Introduction
Alport syndrome (AS) is a hereditary
glomerulonephritis, which is variably associated with neural
hearing loss and ocular abnormalities. It is widely accepted that
AS is a genetically heterogeneous disease, which is caused by
mutations in the collagen type IV α5 chain (COL4A5) gene
located at Xq22.3 and encoding the α5 chain of type IV collagen
(1,2). The primary pathological event appears
to be the loss of the type IV collagen network, consisting of α3,
α4 and α5 chains, which is an important component of the glomerular
basement membrane (GBM). This results in the characteristic
thinning, thickening and splitting of the GBM (3,4).
Until now, a definitive diagnosis of AS was only possible through
renal biopsy (5), which is
primarily performed late following the onset of the profound
clinical symptoms of this progressive renal disease. Therefore,
early diagnosis and preemptive treatments have become increasingly
important (6). Progress has been
made in understanding the genetic basis of AS (7,8) and
improving treatment, although patients suffering from AS inevitably
develop end-stage renal disease. A study demonstrated that the
secretion of α3-α4-α5 (IV) heterotrimers by podocytes into a
preformed, abnormal, filtering GBM is effective at restoring the
missing collagen IV network, slowing kidney disease progression and
extending life span (9). Another
study identified a missense mutation, c.368G>A (p.Gly123Glu), in
the COL4A5 gene, which was reported to be the genetic cause
of AS (10). However, the exact
mechanisms remain poorly understood and novel treatment strategies
are still required. Thus, novel analysis methods are required to
reveal the genetic basis and mechanisms underlying AS.
MicroRNAs (miRNAs) regulate gene expression and
modulate crucial biological processes, including differentiation,
proliferation and apoptosis. They function through various
mechanisms, including targeted miRNA degradation and translational
repression (11,12). Aberrant miRNA expression is
associated with kidney disease. Emerging evidence from clinical and
animal studies has indicated a critical role for miRNAs in renal
pathophysiology (13). In previous
studies, miRNAs were studied in the context of nephropathy,
including membranous nephropathy, immunoglobulin (Ig)A nephropathy,
lupus nephritis and renal transplantation. Collectively, the
results demonstrated that miRNAs may act as biomarkers for the
early diagnosis of kidney disease (14–16).
Transcript sequencing is a useful alternative to whole genome
sequencing as it avoids non-coding and repetitive sequences that
make up the majority of eukaryotic genomes. Transcriptomic data
offers an opportunity to deliver fast, inexpensive and accurate
genome information (17).
Transcriptome analysis of diabetic kidney disease identified
multiple genes and pathways that may serve a role in the
pathogenesis of the disease or act as biomarkers (18). A previous study demonstrated that
injury-associated transcriptome alterations occur in kidney
parenchymal cells in response to stresses of transplantation
(19). Transcriptome analysis
appears to be an effective and important tool for hypothesis-driven
investigation of kidney disease. In addition, proteins are useful
for gaining insight into the functional network of gene expression.
With the advancement of 2D gel electrophoresis and isobaric tagging
for relative and absolute quantification technologies, protein
analysis has become an important tool for investigating disease
(20). Exosomal proteomics has
emerged as a powerful tool for understanding the molecular
composition of exosomes and has the potential to accelerate
biomarker discovery in diabetic nephropathy (21). By comparing IgA nephropathy with a
normal control, Park et al (22) established a urinary proteomic map
of IgA nephropathy and identified 216 protein spots that were
differentially expressed. Therefore, studying proteins may aid in
understanding the molecular physiology of nephropathy and
identifying early diagnostic markers.
Induced pluripotent stem cells (iPSCs) may be used
to generate pluripotent patient-specific cell lines that are
beneficial for studying the pathogenesis of model human diseases,
and may also be used to determine genetic information associated
with disease pathogenesis, particularly for diseases resulting from
abnormal embryonic development (23,24).
Extensive research, including system-wide genomic analyses and
comparisons of transcripts expression profiles, has been conducted
to identify iPSCs (25). The
molecular mechanisms that govern the induction, maintenance and
directed differentiation of pluripotency are mediated by
transcription factors and non-coding RNAs, including miRNAs and
long non-coding RNAs (26,27). Systematic deciphering of genetic or
epigenetic alterations may help identify genomic hotspots in iPSCs
with their consistent genetic background. However, these finding
have also left notable gaps in the knowledge regarding the
development and progression of disease.
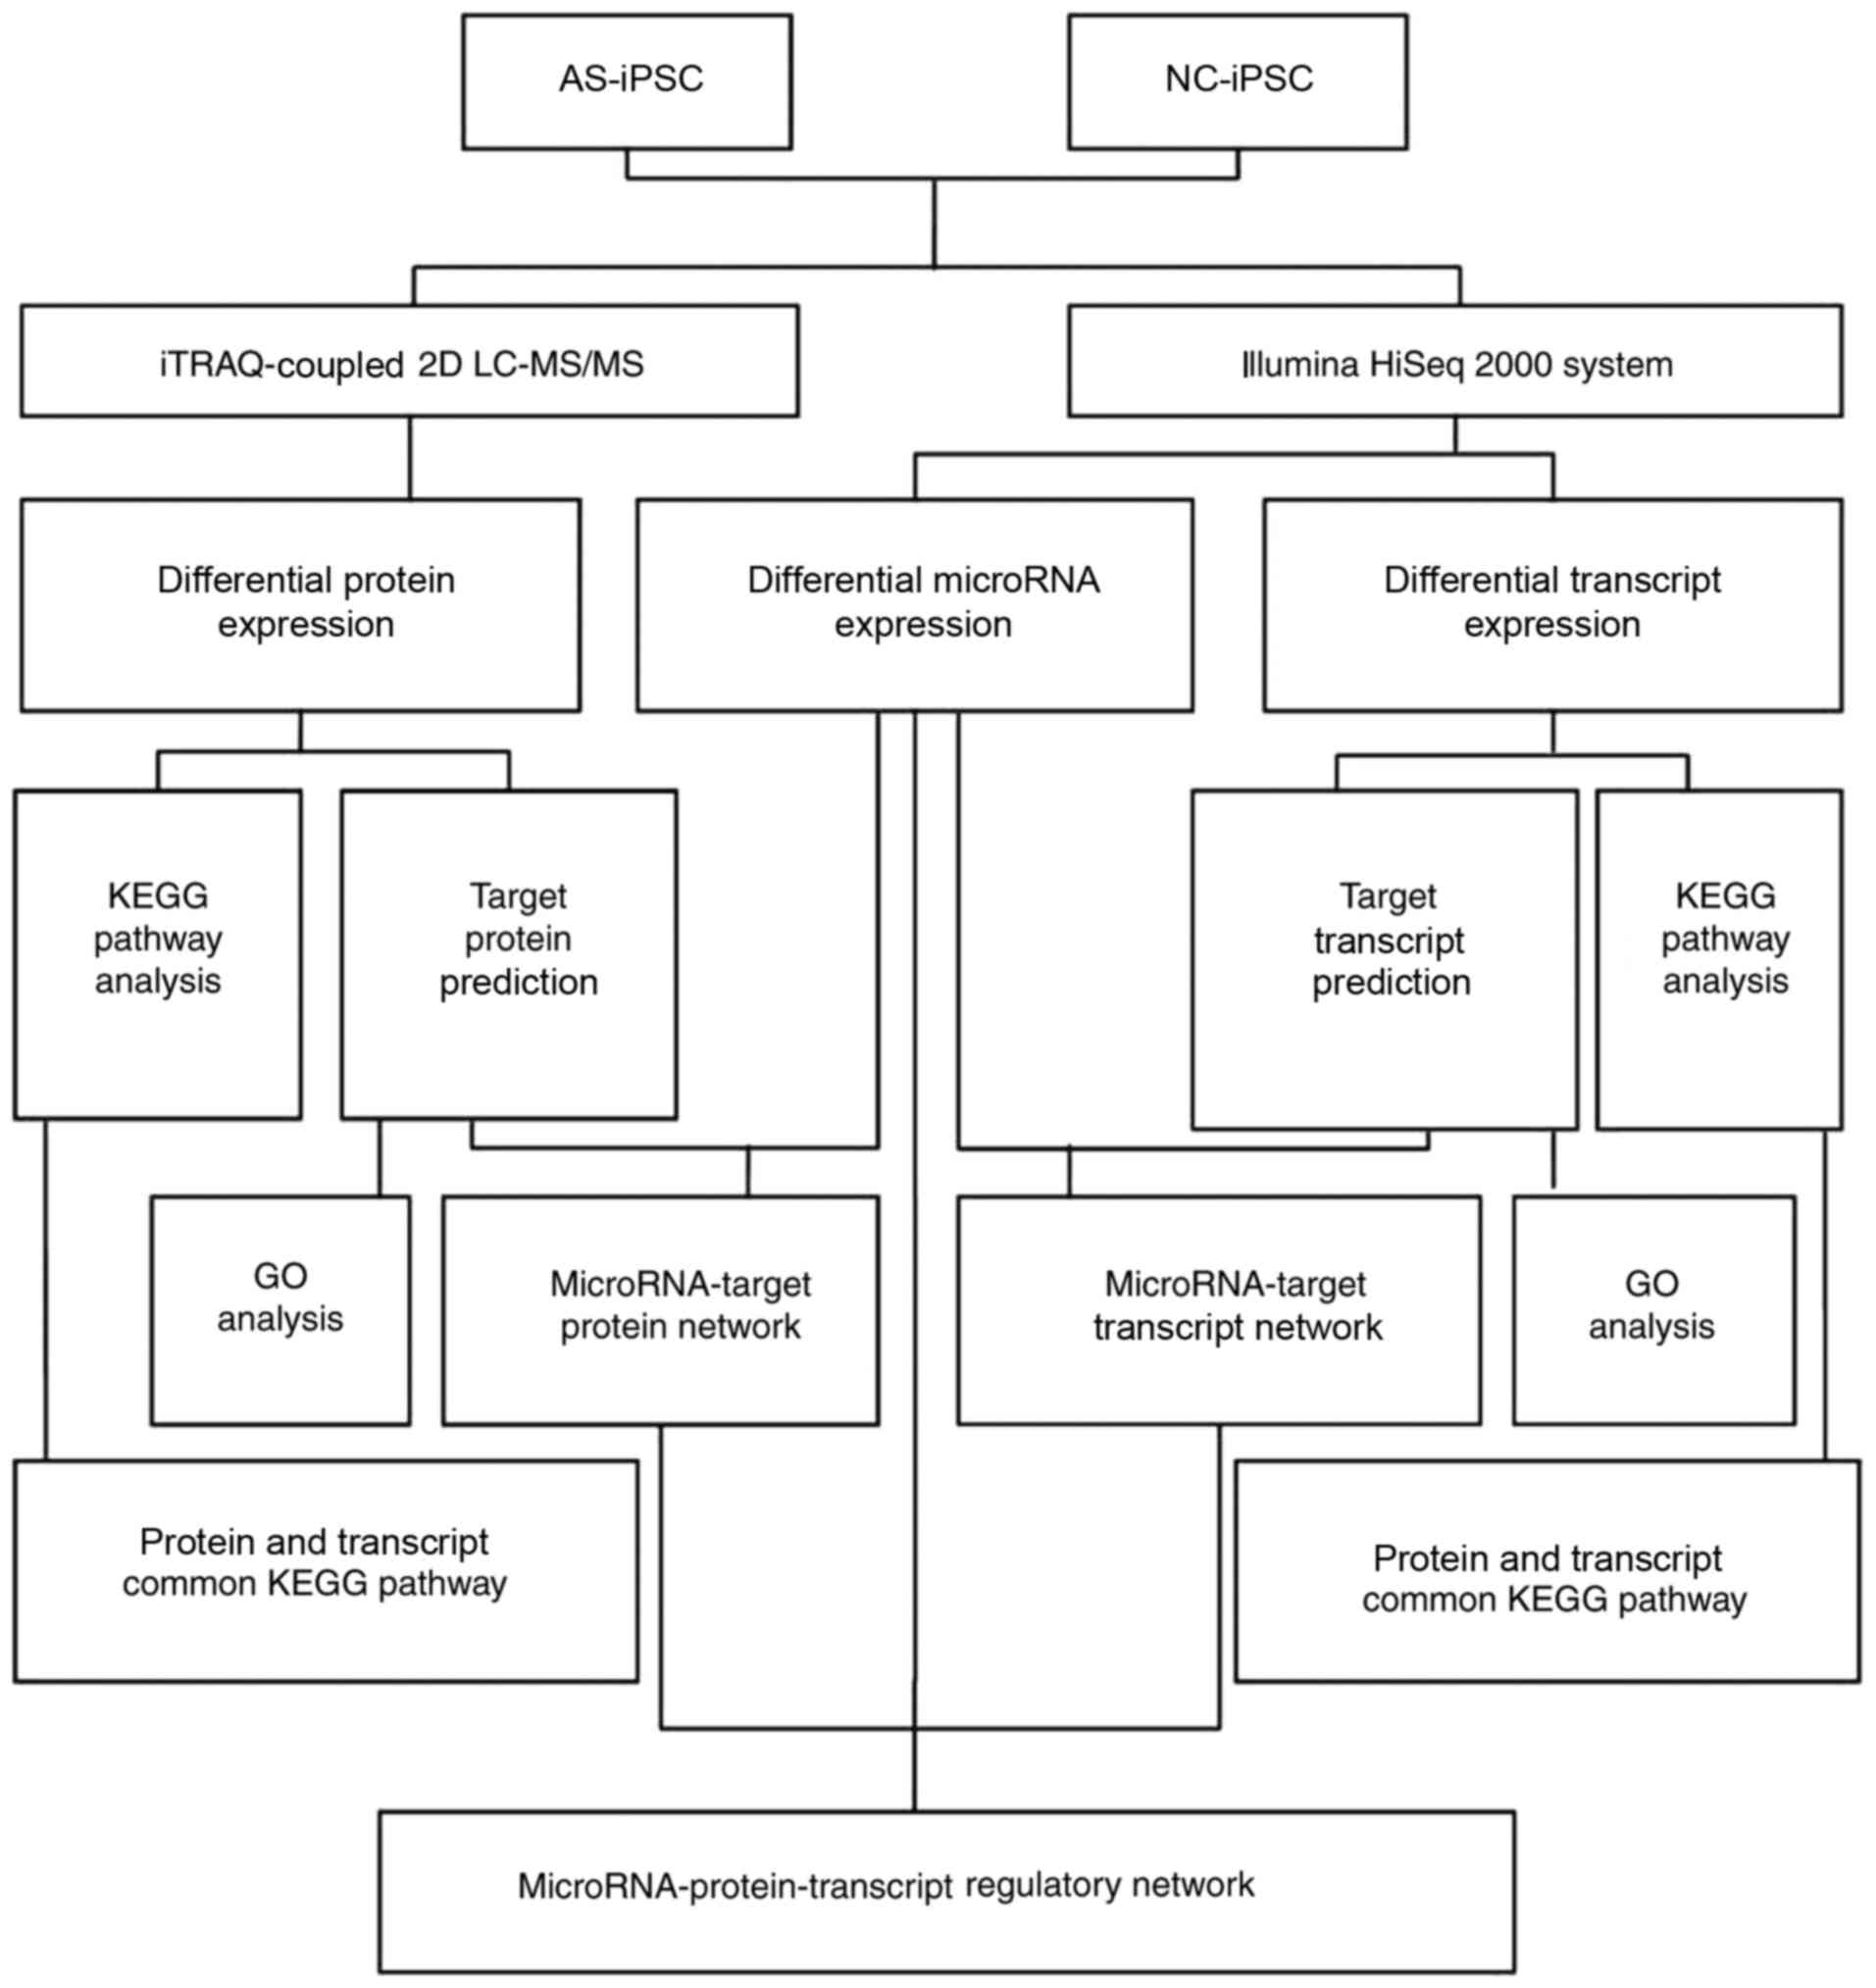
In the present study, iPSCs from renal tubular cells
of patients with AS (AS-iPSCs) and normal controls (NC-iPSCs) were
successfully generated (28).
Subsequently, miRNA, transcript and protein regulation in iPSCs was
studied with the aim of better understanding the genetic mechanism
of AS. Furthermore, the identified proteins, in addition to miRNAs
and their target transcripts, were subjected to gene ontology (GO)
and Kyoto Encyclopedia of Genes and Genomes (KEGG) functional
analyses. The resulting comprehensive network maps of miRNAs,
transcripts and proteins may help with understanding the
pathogenesis of AS at the genetic level (Fig. 1).
Materials and methods
Patients and controls
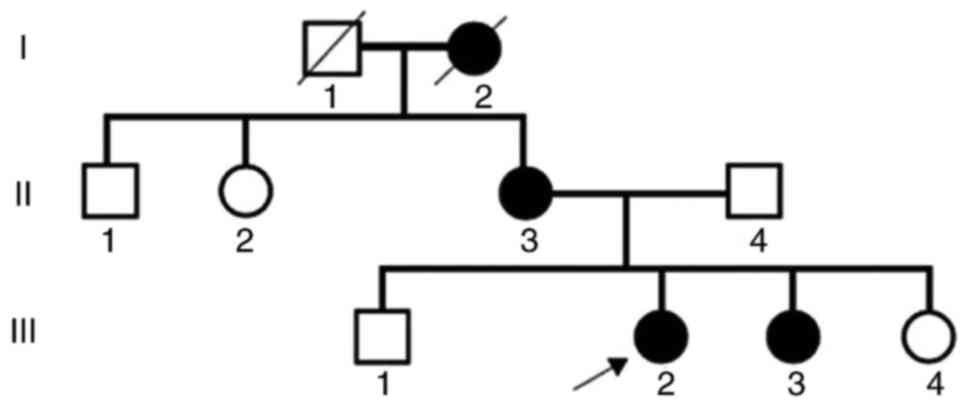
A family with three generations of patients
suffering from AS was identified (Fig.
2). The proband (III2) was a 26-year-old woman, who presented
clinically with gross hematuria and albuminuria. The patient was
diagnosed with AS at the Second Clinical Medical College of Jinan
University (Shenzhen, China) in 2013. The proband was confirmed to
have AS by pathological examination. The grandmother of the proband
(I2) was also diagnosed with AS, although this individual succumbed
to kidney failure. The mother of the proband (II3) exhibited AS
symptoms, including kidney failure, gross hematuria, albuminuria,
sensorineural hearing loss and pathognomonic ocular lesions. The
sister of the proband (III3) presented with mild clinical symptoms
of gross hematuria and albuminuria. The study protocol and consent
forms were approved by the Ethics Committee of Jinan University and
adhered to the guidelines set forth in the Declaration of Helsinki.
Healthy participants and those with AS provided written informed
consent.
A total of six members of the family were selected
for further research. The proband (III2), her mother (II3) and a
sister (III3) formed the experimental AS group, whereas a sister
(III4), brother (III1) and her father (II4) served as the normal
controls (NC) (Table I).
 | Table I.Participant characteristics and blood
biochemical test results. |
Table I.
Participant characteristics and blood
biochemical test results.
| Individual | Sex | Age, years | BLO | PRO | Urea nitrogen,
mmol/l | Inosine,
µmol/l | TP, g/l | ALB, g/l | CHOL, mmol/l | Hearing loss | Vision loss
(L/R) |
|---|
| III2 | Female | 26 | ++ | + | 6.6 | 121 | 57 | 35 | 5.76 | + | 0.2/1.0 |
| III3 | Female | 23 | + | + | 3.9 | 110 | 71 | 45 | 4.45 | + | 0.4/1.0 |
| II3 | Female | 51 | ++ | ++ | 3.5 | 231 | 70 | 43 | 4.68 | + | 0.2/0.8 |
| II4 | Male | 53 | − | − | 3.0 | 55 | 75 | 52 | 3.81 | − | 1.0/1.0 |
| III1 | Male | 21 | − | − | 3.2 | 56 | 66 | 45 | 4.61 | − | 1.5/1.0 |
| III4 | Female | 17 | − | − | 3.2 | 50 | 75 | 43 | 4.98 | − | 1.2/1.1 |
Renal tubular cell isolation and iPSC
generation
iPSCs were successfully generated from renal tubular
cells, as previously described (28). iPSC formation was confirmed by
comparatively analyzing human embryonic stem cell (hESC) markers
via colony morphology, immunohistochemistry, reverse
transcription-quantitative polymerase chain reaction (RT-qPCR),
flow cytometry, gene expression profiling of the three germ layers
and karyotyping. The results demonstrated that iPSCs were similar
to hESCs with regards to morphology, proliferation, hESC-specific
surface marker expression and differentiation into the cell types
of the three germ layers. Therefore, iPSCs have similar
characteristics to hESCs and are suitable for AS research (28).
Total RNA from iPSCs was extracted using
TRIzol® (Invitrogen; Thermo Fisher Scientific, Inc.,
Waltham, MA, USA), according to the manufacturer's protocol. RNA
concentration was measured using a NanoDrop™ 2000
spectrophotometer (Thermo Fisher Scientific, Inc.) and stored at
−80°C. All materials and solutions were handled under RNase-free
conditions, and all solutions were prepared with RNase-free water.
Small RNAs (sRNAs) from the AS and NC groups were sequenced by BGI
(Shenzhen, China) using Solexa high-throughput sequencing
technology. A total of ~2 µg RNA/sample was used to prepare an sRNA
library using the TruSeq sRNA sample preparation kit, according to
the manufacturer's protocol (Illumina, Inc., San Diego, CA, USA).
sRNA libraries were sequenced in two batches (three samples per
sequencing run) using a next sequencing apparatus (Illumina
HiSeq™ 2000), to generate ~16 million single-end 75-bp
reads per sample. To compare the estimated miRNA expression, the
miRNA levels were first normalized. Subsequently, the fold change
between AS and NC was calculated as follows: Fold change =
log2 (AS/NC). A rigorous significance test developed by
Audic and Claverie (29) was used
to identify differentially expressed genes with minimal statistical
error. A fold change ≥1 and P≤0.01 were considered to indicate
statistically significant differential expression between the two
groups.
Following total RNA extraction, a cDNA library was
constructed using the First Strand cDNA Synthesis kit (Thermo
Fisher Scientific, Inc.) containing random oligonucleotides and a
recombinant Moloney murine leukemia virus reverse transcriptase.
The cDNA library consisted of 200-bp fragments. The cDNA whole
transcriptome library was sequenced on the Illumina
HiSeq™ 2000 sequencing platform (Illumina, Inc.).
Differentially expressed transcripts were detected by IDEG6
software (http://telethon.bio.unipd.it/bioinfo/IDEG6_form/)
using a general χ2 test based on the reads per kilobase
of transcript per million mapped reads (RPKM) values. Multiple
testing correction via false discovery rate (FDR) was performed. An
FDR<0.001, fold change ≥1, and P≤0.05 were used as thresholds to
judge the significance of differential gene expression.
Proteome identification and
comparative analysis
iPSCs were washed five times in ice-cold PBS and
lysed using enhanced radioimmunoprecipitation assay buffer
(Beyotime Institute of Biotechnology, Haimen, China) containing
protease and phosphatase inhibitors for 30 min on ice.
Subsequently, the samples were sonicated at 4°C for 10 min at
40,000 × g, with ten cycles of 5-sec bursts followed by 30-sec
cooling intervals. Cell debris was removed by centrifugation at
12,000 × g for 30 min at 4°C and the supernatants were collected.
Protein concentration was measured using a bicinchoninic acid assay
kit (Pierce; Thermo Fisher Scientific, Inc.). A total of 100 µg
protein per AS or NC sample was labeled with iTRAQ®
reagents (Applied Biosystems; Thermo Fisher Scientific, Inc.).
Proteins with ≥3 peptides were considered valid for subsequent
analysis. For each peptide, the ratio between the iTRAQ®
label peak value and the sum of the intensities was calculated. The
ratio was normalized to 1 and divided by the median of the ratio.
Relative quantification of proteins was based on the ratio of the
peak areas of the mass-to-charge ratio of 114 (AS) and 115 (NC)
tandem mass spectrometry (MS/MS) spectra. Proteins with a fold
change of >1.2 in peptide abundance (>1.2 increased or
<0.83 decreased) were considered to be significantly
differentially abundant (P<0.05).
miRNA target prediction
Three different software packages were used to
predict the miRNA target genes, including PicTar (http://pictar.mdc-berlin.de/), miRanda v5 (http://www.ebi.ac.uk/enright%20srv/microcosm/htdocs/targets/v5/)
and TargetScan Human 7.2 (http://www.targetscan.org/vert/). Genes identified by
at least two of the three platforms were selected as ultimate
target genes.
Data analysis and network
visualization
For functional analysis of miRNAs, differentially
abundant proteins, differentially expressed transcripts and miRNAs
were combined with miRNA target predictions to form integrated
regulatory networks. Statistical analyses were performed using R
software (http://www.r-project.org/) with the
appropriate KEGGSOAP packages (http://www.bioconductor.org/packages/2.4/bioc/html/KEGGSOAP.html).
The network was visualized using Cytoscape 3.0 software (http://cytoscape.org).
Kyoto Encyclopedia of Genes and
Genomes (KEGG) pathway analysis
KEGG pathways of the differentially expressed
transcripts and differentially abundant proteins were annotated
using the Database for Annotation, Visualization and Integrated
Discovery gene annotation tool 6.8 (http://david.abcc.ncifcrf.gov). KEGG pathways were
defined as significantly enriched in target candidates at a
corrected P≤0.01. This analysis tool was also able to predict the
principal biological functions and pathways in which the candidate
targets were involved.
Gene Ontology (GO) analysis
Target transcripts, proteins and miRNAs were
subjected to GO analysis. The whole GO database was used as the
background network to calculate the number of genes in each node.
The hypergeometric distribution was used to test the enrichment of
genes in each GO node. GO terms were classified as biological
process, cellular component and molecular function, whereby
P<0.05 was considered statistically significant.
Validation using RT-qPCR
RT-qPCR was used to validate the results of deep
sequencing analysis for miRNAs and transcripts. U6 and
GAPDH were selected as the internal controls for miRNAs and
transcripts, respectively. A total of 2 µg total RNA from each
sample was extracted using a Qiagen RNeasy Mini Extraction kit and
reverse transcribed to cDNA using miScript Reverse Transcription
kit (both from Qiagen GmbH, Hilden, Germany) according to the
manufacturer's protocol. Gene-specific primers were listed in
Table II. The reverse
transcription products were amplified using the following PCR
program with SYBR green reagent (Roche Diagnostics, Basel,
Switzerland) on a ABI QuantStudio™ 6 Flex Real-Time PCR system
(Thermo Fisher Scientific, Inc.): Polymerase activation at 95°C for
2 min, followed by 40 cycles of 94°C for 10 sec, 59°C for 10 sec
and 72°C for 40 sec. All reactions were run in triplicate. miRNA
and transcript expression levels were normalized to the reference
genes. Fold changes were determined and the relative quantification
of gene expression data was performed using the 2−ΔΔCq
method (30).
| Table II.RT-qPCR primer used in the validation
assays. |
Table II.
RT-qPCR primer used in the validation
assays.
| Primer name | Primer sequence
(5′→3′) | Tm |
|---|
| mir4461-R |
GTCGTATCCAGTGCGTGTCGTGGAGTCGGCAATTGCACTGGATACGACTATGGC |
|
| mir4461-F |
TATGTACGTAGTCTAGGCC | 55 |
| mir-4775-R |
GTCGTATCCAGTGCGTGTCGTGGAGTCGGCAATTGCACTGGATACGACACCAAC |
|
| mir-4775-F |
AAGCATTCTTTCATTGGTTGG | 55 |
| mir-4651-R |
GTCGTATCCAGTGCGTGTCGTGGAGTCGGCAATTGCACTGGATACGACCCCACC |
|
| mir-4651-F |
CGGCGACGGCGGGGT | 55 |
| U6-R |
GTCGTATCCAGTGCGTGTCGTGGAGTCGGCAATTGCACTGGATACGACAAAATATG |
|
| U6-F |
GATTAGCATGGCCCCTGC | 55 |
| EGFR-F |
AAAGTGGCCGCCATTTTAGA | 57 |
| EGFR-R |
CAACAATCACGCAAAGCTCC |
|
|
CX3CL1-F |
CGTGCAGCAAGATGACATCA | 59 |
|
CX3CL1-R |
TCCTTGACCCATTGCTCCTT |
|
|
LRRC55-F |
AATGGACACCCGAAACCTCA | 57 |
|
LRRC55-R |
TGGCACATGGCTGAAATTGT |
|
|
FAM18B1-F |
AATGGTTGGCCTACGTTGGT | 59 |
|
FAM18B1-R |
TGGACAGGCAATAAGTCCCA |
|
| AURKC-F |
AGCGCACAGCCACGATAATA | 59 |
| AURKC-R |
TGCACAGACCAGCCAAAATC |
|
|
RPS4Y1-F |
ATGGCAAGGTTCGAGTGGAT | 59 |
|
RPS4Y1-R |
GATGCGGTGAACAGCAAAAC |
|
| GAPDH-F |
ACCACAGTCCATGCCATCAC | 59 |
| GAPDH-R |
TCCACCACCCTGTTGCTGTA |
|
Results
Sequence profiling of miRNAs,
transcripts and proteins
To build an integrated network of miRNAs,
transcripts and proteins for AS-iPSCs, miRNA, transcript and
protein expression level data for AS-iPSCs and NC-iPSCs were
compared.
The comparison of AS-iPSC and NC-iPSC sRNA libraries
revealed 830 differentially expressed miRNAs, of which 155 were
significantly differentially expressed, including 79 upregulated
and 76 downregulated miRNAs (data not shown). The miRNA sequences
were submitted to the National Center for Biotechnology Information
(NCBI) and assigned the accession no. SRP041435.
Following quality control and filtering, 26,021,874
and 27,551,343 clean reads were obtained from the AS-iPSC and
NC-iPSC transcript libraries, respectively. Following application
of the thresholds for significance, 1,168 significantly
differentially expressed genes were identified, including 786 that
were upregulated and 382 that were downregulated (data not shown).
The raw transcript sequence data were deposited at the NCBI under
the accession no. SRP041474.
For the proteomic analysis, a total of 15,553 iTRAQ-
labeled peptides that mapped to a total of 3,431 proteins were
identified and quantified. Among them, 899 proteins were predicted
as differentially abundant between the AS-iPSC and NC-iPSC samples.
Of these, 383 were significantly differentially abundant proteins
(data not shown), including 227 upregulated and 156 downregulated
proteins.
miRNA-target transcript regulatory
network
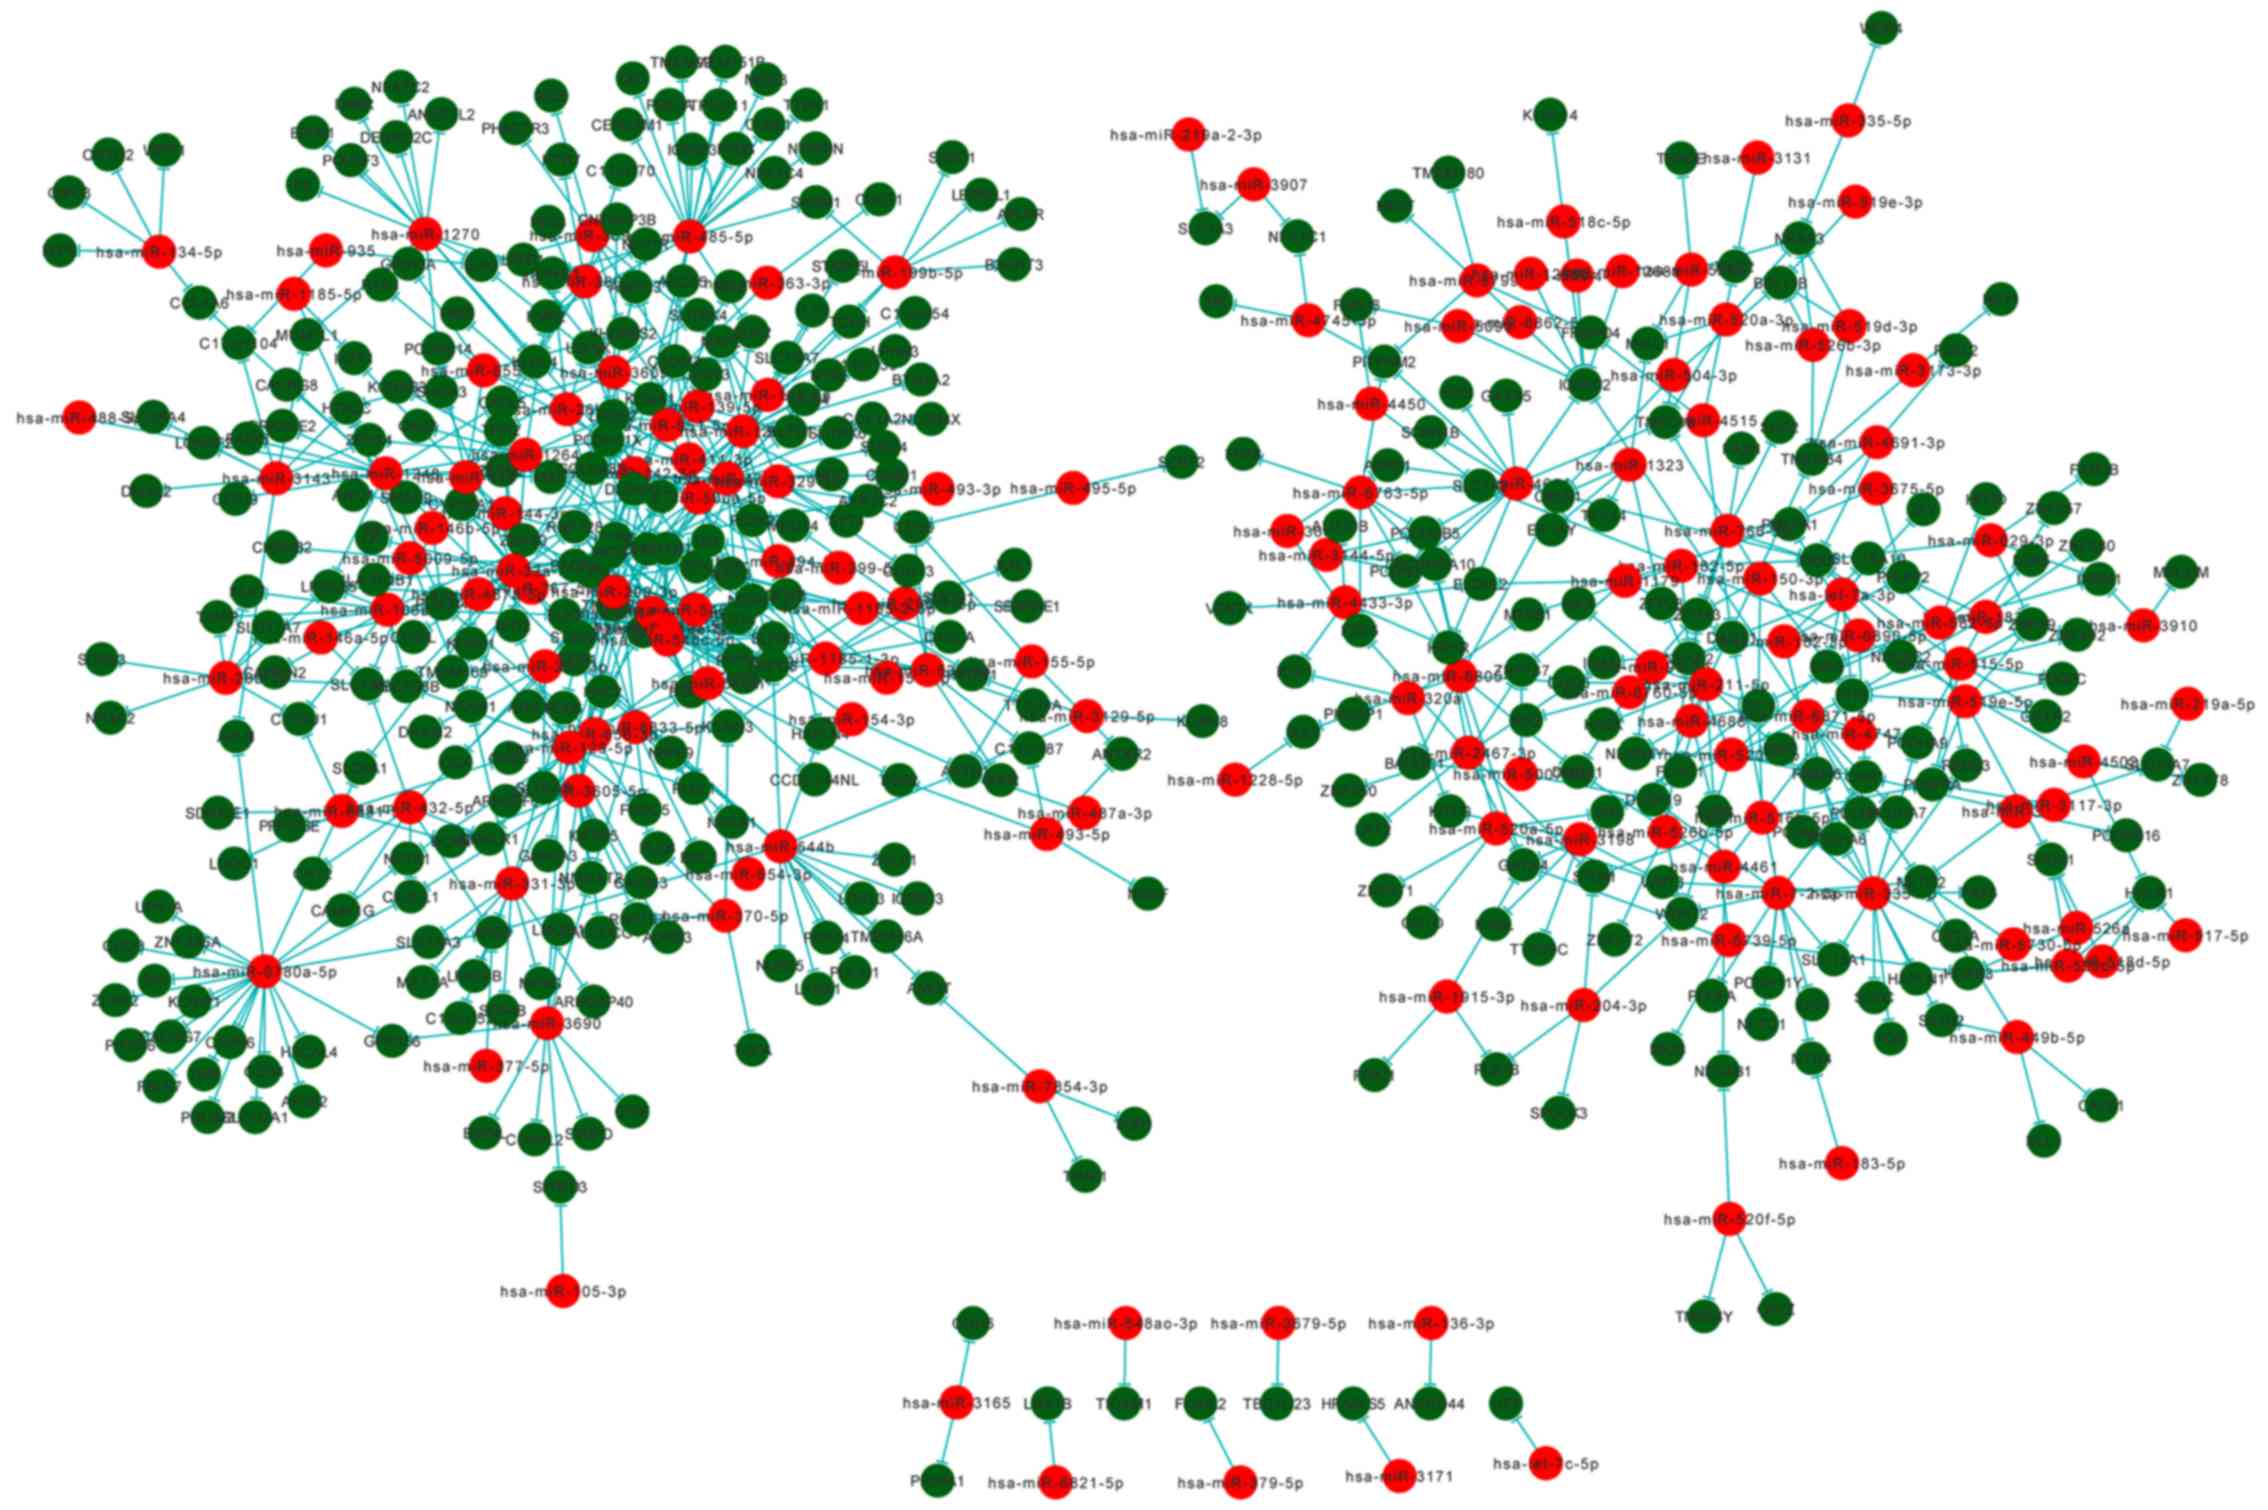
To establish the miRNA-target transcript network, a
systematic investigation was conducted using miRanda, TargetScan
and Pictar to predict potential miRNA target transcripts. A
transcript was classed as a potential target if two out of three
platforms identified it as a miRNA target. The network map, which
consisted of miRNAs and their target transcripts, was constructed
using Cytoscape (Fig. 3). The
results indicated that 156 miRNAs were associated with 382 target
transcripts. It was observed that miRNAs and their target
transcripts were mutually cross-regulated. Among them, the most
prominent miRNA was hsa-miRNA (miR)-4775, which was associated with
27 transcripts.
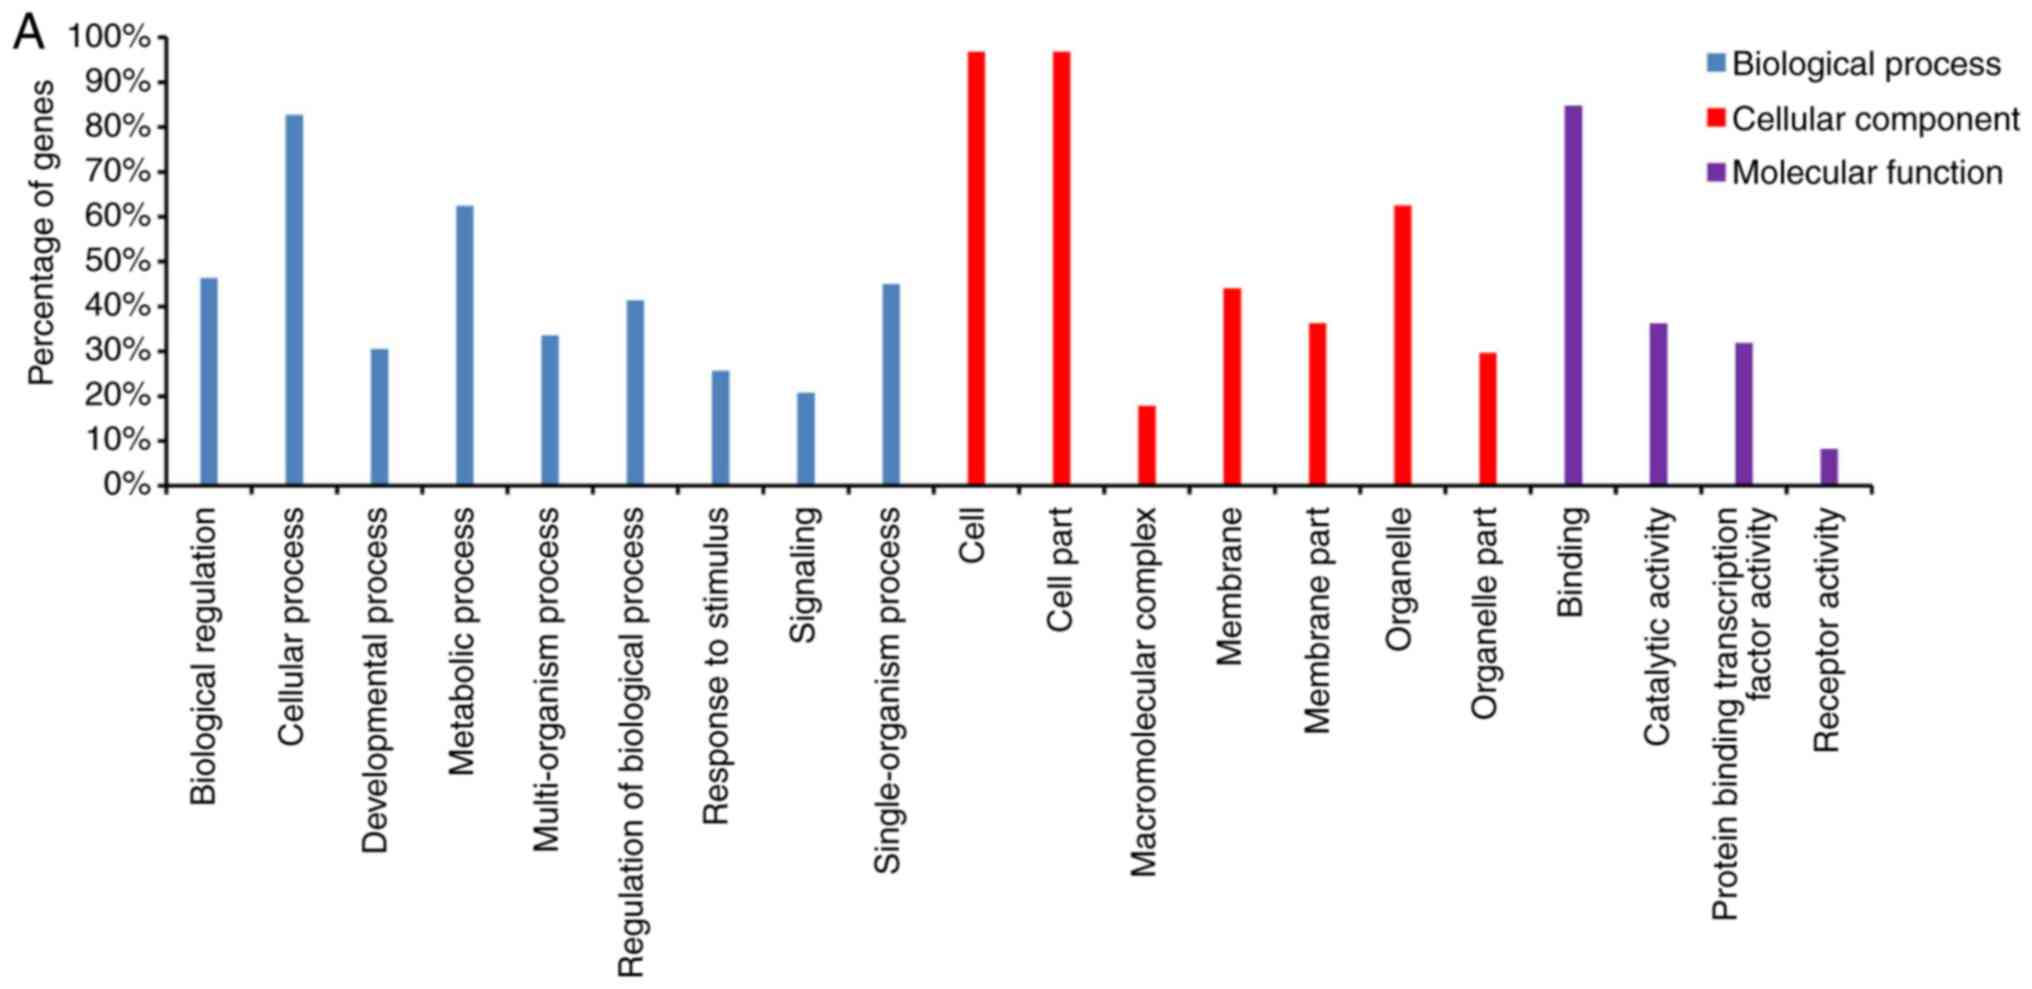
To evaluate the functions of the target transcripts
and miRNAs, GO functional enrichment analysis was conducted. A
total of three ontologies, including molecular function (MF),
cellular component (CC) and biological process (BP) were enriched
by features of the transcript and miRNA datasets. In total, miRNAs
were mainly involved in 9 BP, 7 CC and 4 MF terms (Fig. 4A), and the target transcripts were
mainly involved in five BP, 5 CC and five MF terms (Fig. 4B). Notably, certain terms involving
miRNAs were also associated with the target transcripts. BP terms
included ‘cellular process’ and ‘biological regulation’. CC terms
included ‘cell physiology’ and ‘membrane part’. MF terms included
‘cell activity’ and ‘cellular molecular binding’.
miRNA-target protein regulatory
network
GO enrichment analysis of the miRNAs and target
proteins was performed. Target proteins were mainly enriched in
five BP, five CC and five MF terms (Fig. 4C). Compared with the miRNA GO
enrichment analysis, certain GO terms for the target proteins were
the same or similar to those of the miRNAs. For example, BP
included ‘cellular physiological process’ and ‘intracellular
signal’, and MF included ‘cellular activity’ and ‘cellular
molecular binding’. However, the CC terms of the target proteins
and miRNAs were different. The CC term ‘intracellular biological
process’ was associated with the target proteins, whereas
‘extracellular biological process’ was associated with the
miRNAs.
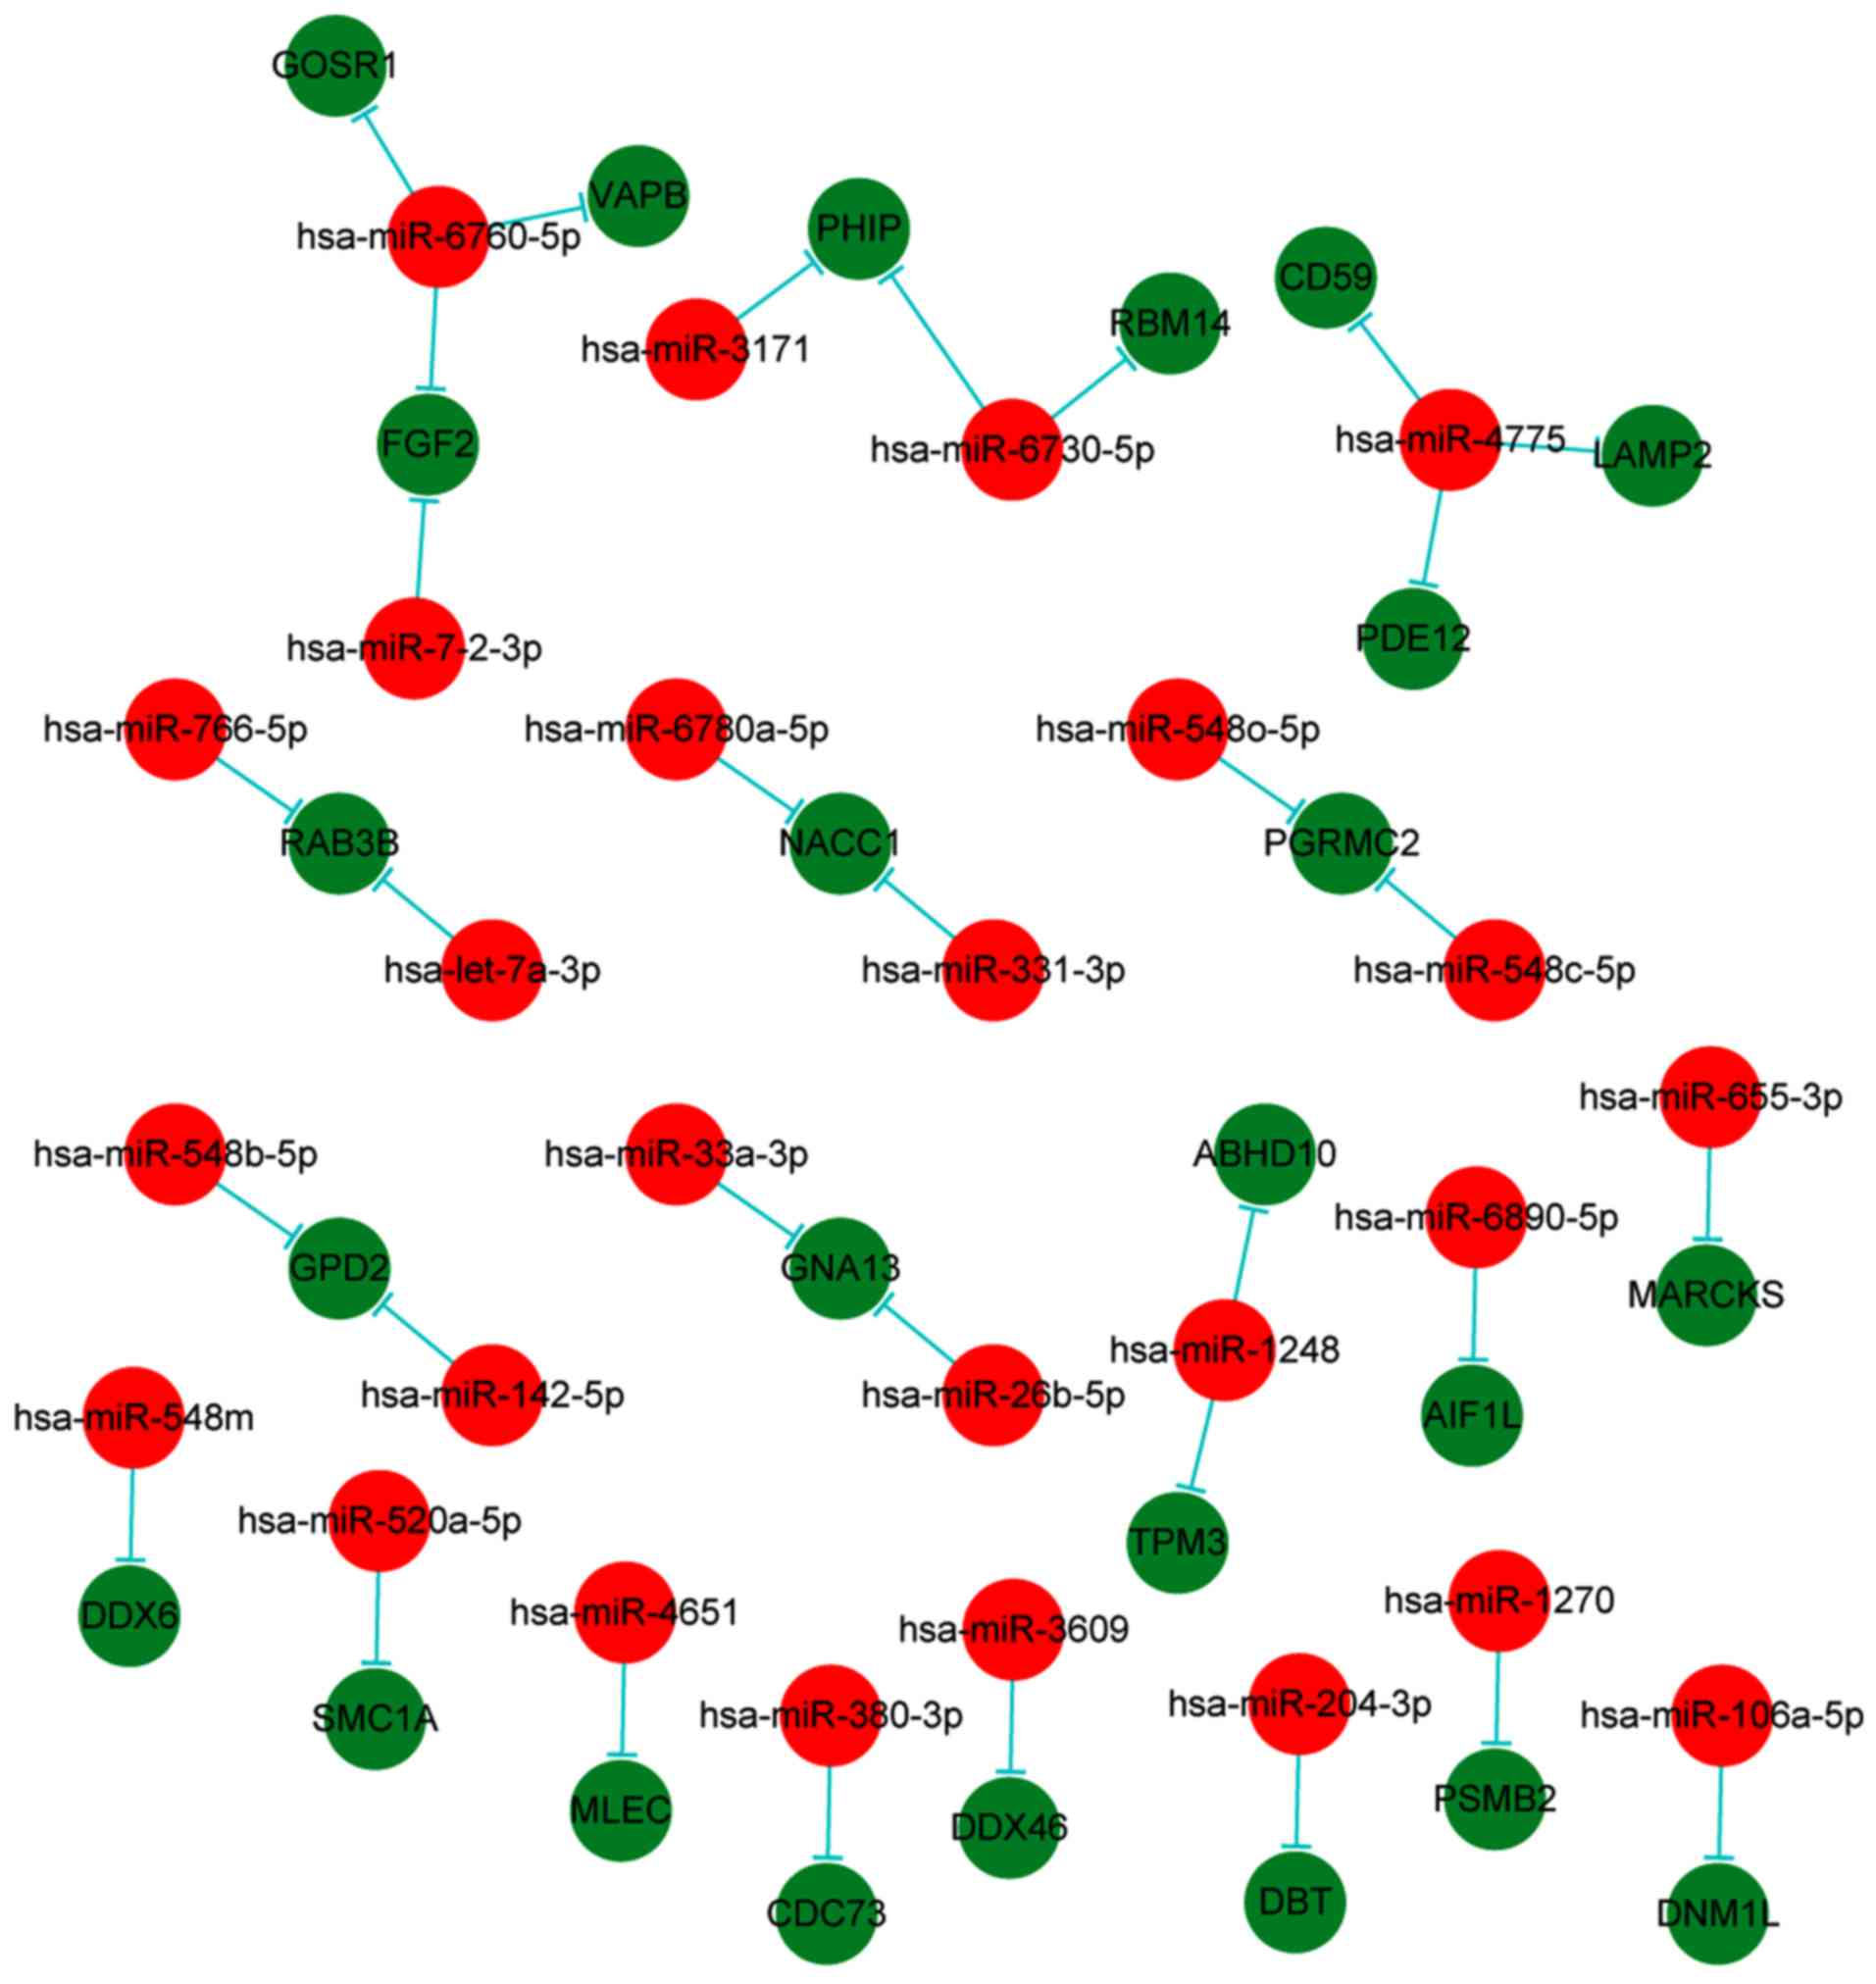
To investigate the potential functional association
between miRNAs and target proteins, the differentially expressed
miRNAs and target proteins were used to build a regulatory network.
Cytoscape used to visualize the miRNA-target protein regulatory
network and the results demonstrated that 26 miRNAs were associated
with 25 target proteins (Fig. 5).
In addition, the results indicated that the miRNAs and target
proteins were mutually cross-regulated.
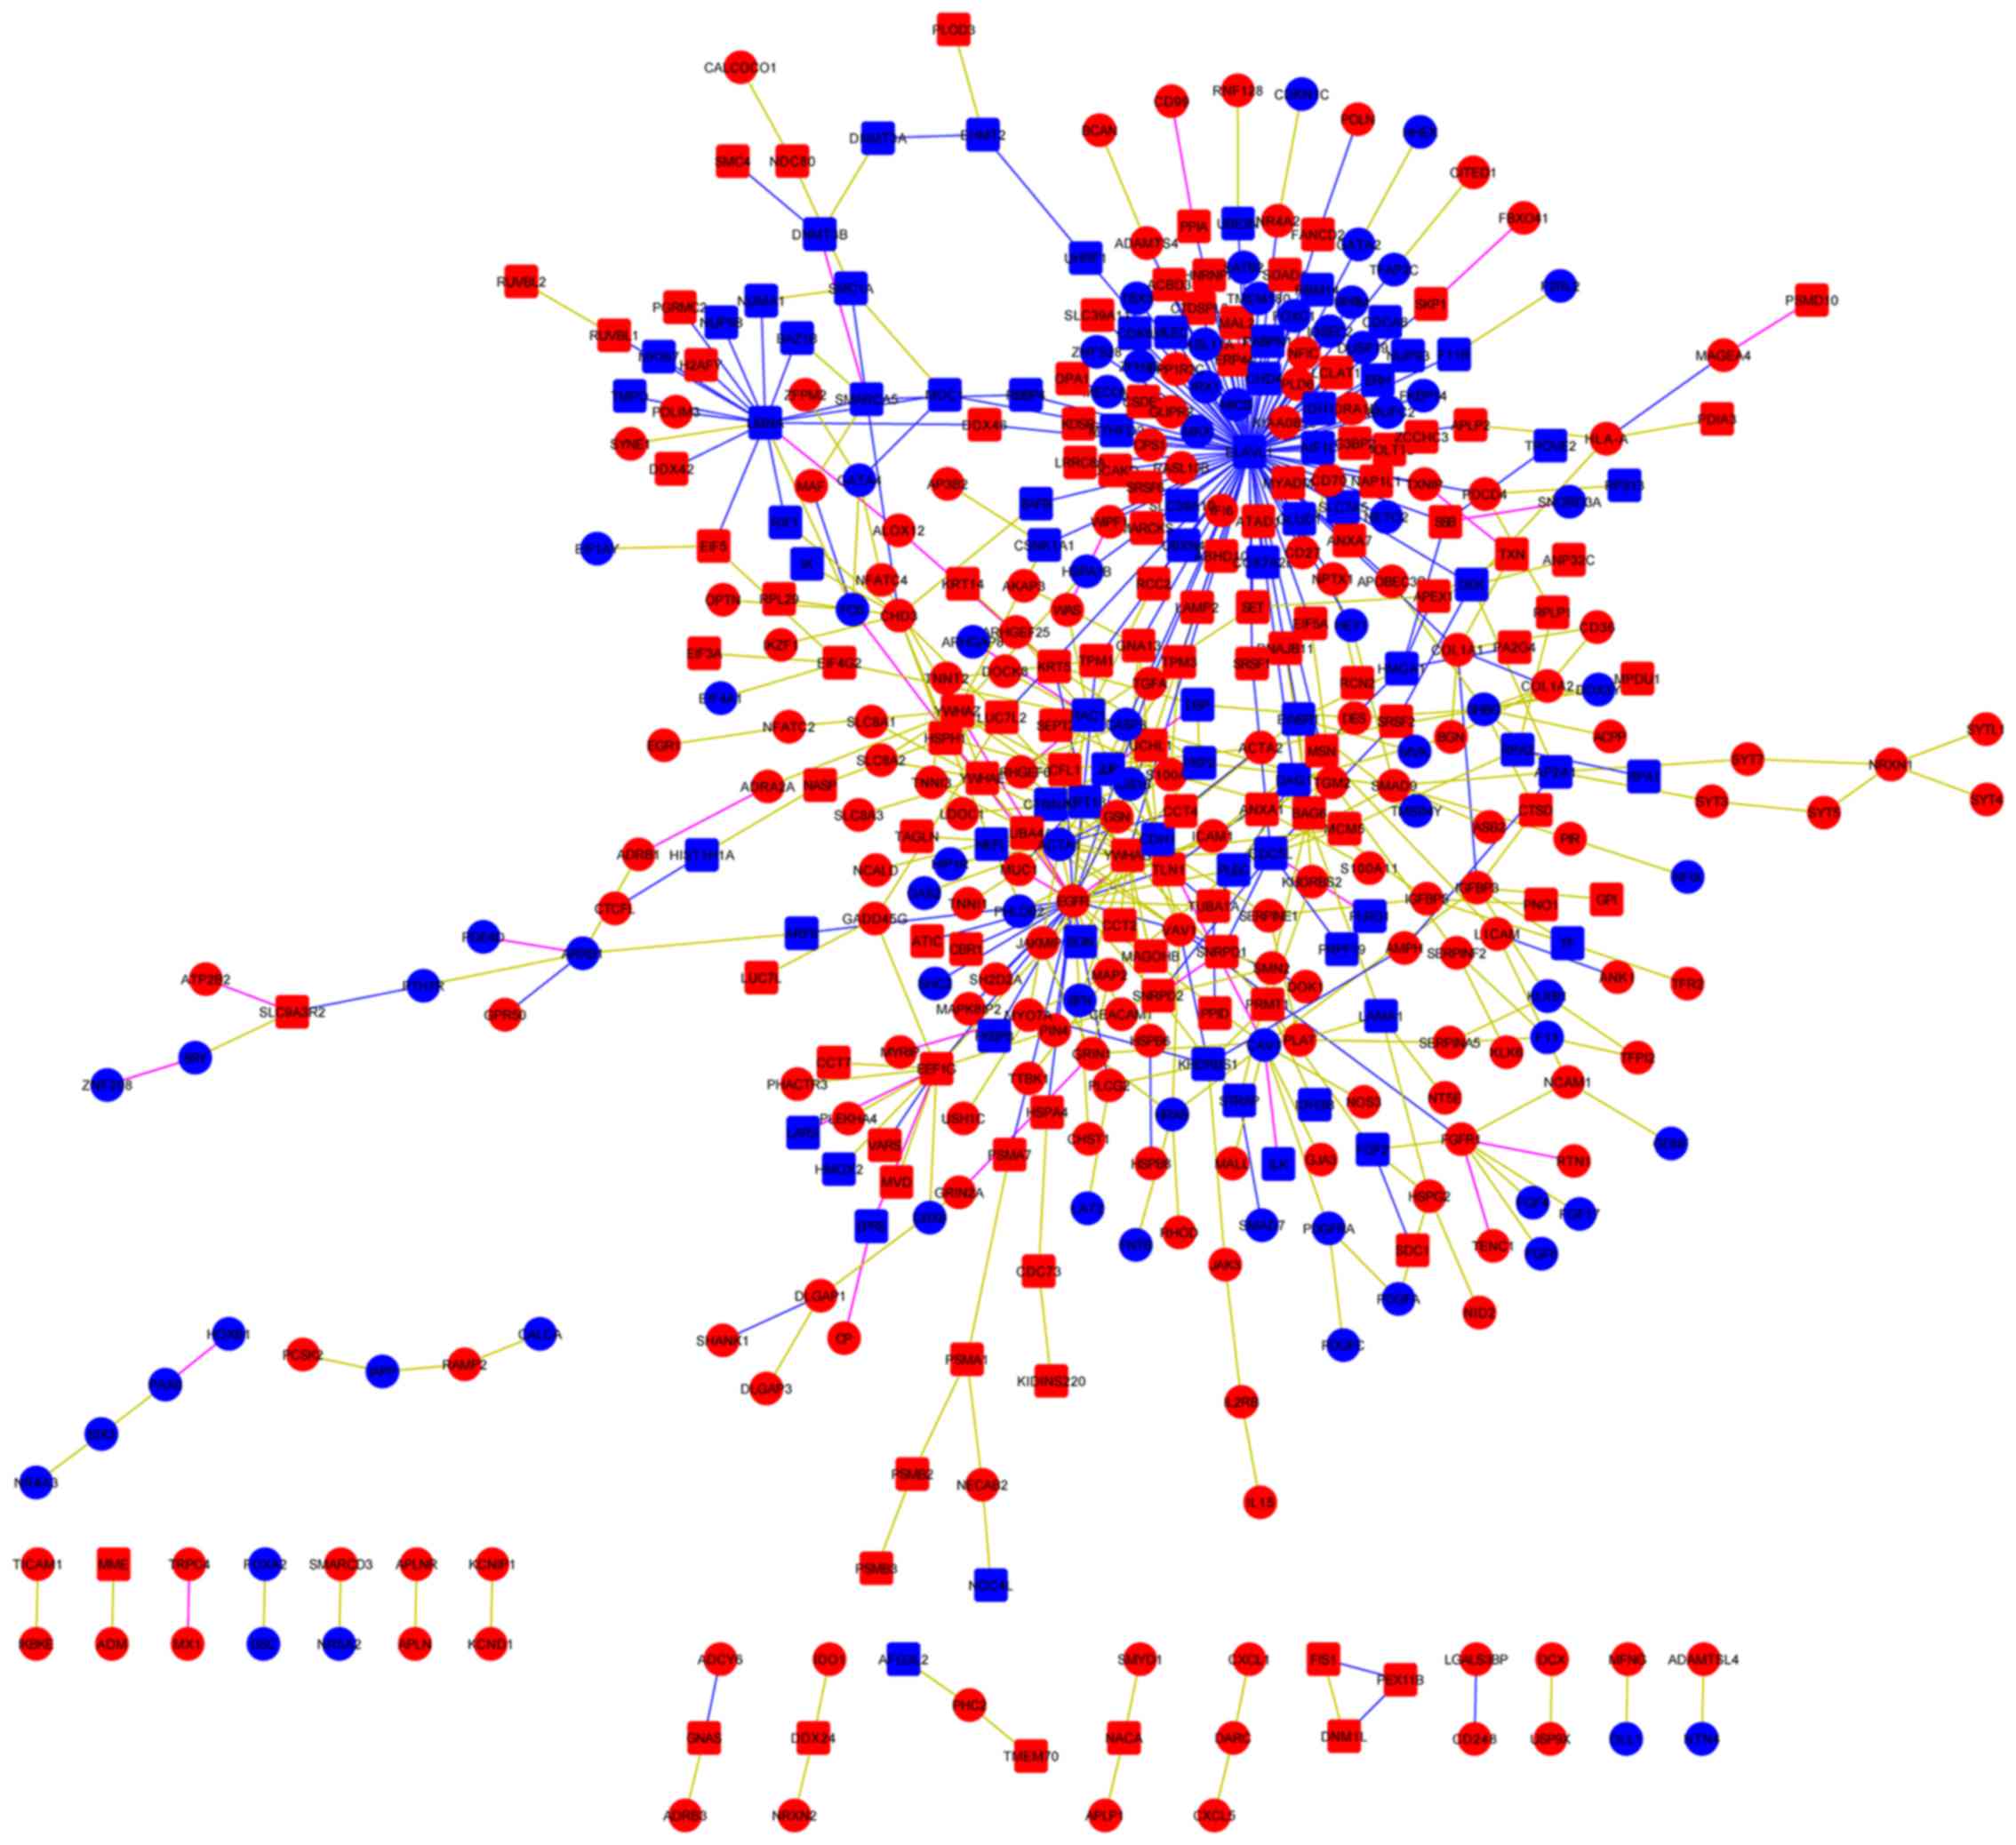
Transcript-protein regulatory
network
A total of 1,168 differentially expressed
transcripts and 383 differentially abundant proteins were used to
build a regulatory network. The results demonstrated that 237
transcripts were associated with 189 proteins (Fig. 6). ELAV-like RNA binding protein 1
(ELAVL1) was the most prominent protein, which was associated with
41 transcripts, and epidermal growth factor receptor (EGFR) was the
most prominent transcript, which was associated with 19
proteins.
KEGG was used to analyze pathways enriched for
significantly differentially expressed transcripts between the
AS-iPSC and NC-iPSC libraries. Among them, 1,168 differentially
expressed genes were involved in 15 pathways (data not shown) and
383 differentially abundant proteins were involved in 11 pathways
(data not shown). Notably, there were several pathways that the
proteins were involved in that were similar to those of the
transcripts, including cell signaling pathways, cell metabolism
pathways and cell interaction pathways. Transcripts and proteins
were also mapped to KEGG pathways using GenMAPP to identify common
pathways. The results indicated that the transcripts and proteins
were primarily enriched in 262 common pathways, which included
‘carbon metabolism’ and ‘cell adhesion molecules’ (data not
shown).
Numerous studies have demonstrated a substantial
role for post-transcriptional, post-translational and protein
degradation regulation in cellular biology (31). However, it is generally accepted to
use transcript concentrations as proxies for the concentrations and
activities of the corresponding proteins. On the basis of
transcript-protein association, nine proteins and nine transcripts
were identified to have a consistent expression pattern, including
three upregulated and six downregulated pairs (Fig. 7).
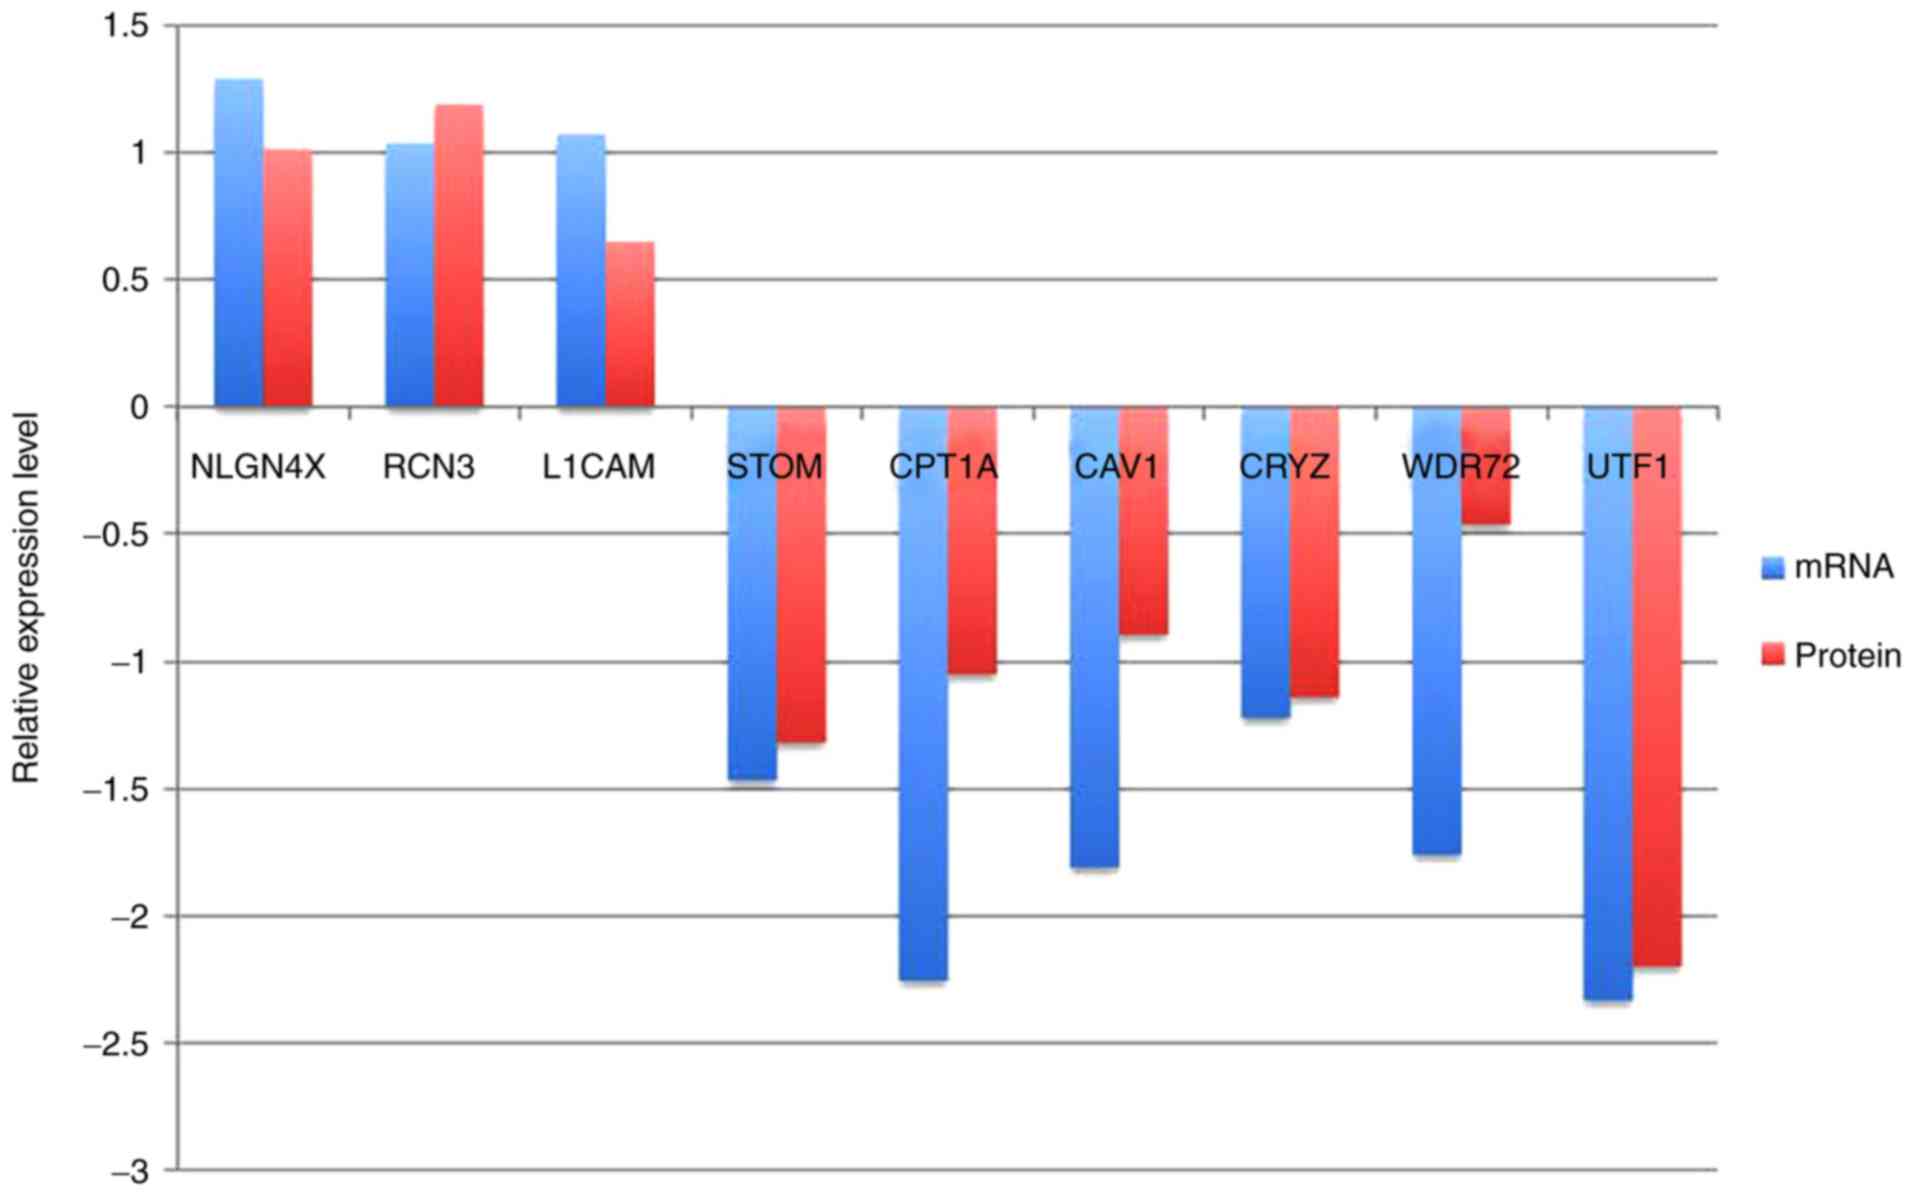 | Figure 7.A total of nine proteins and their
corresponding transcripts, identified to have a consistent
expression pattern. The X-axis indicates transcripts and proteins.
The Y-axis indicates upregulation or downregulation of expression.
CAV1, caveolin 1; CPT1A, carnitine palmitoyltransferase 1A; CRYZ,
crystallin-ζ; L1CAM, L1 cell adhesion molecule; NLGN4X, neuroligin
4 X-linked; RCN3, reticulocalbin 3; STOM, stomatin; UTF1,
undifferentiated embryonic cell transcription factor 1; WDR72, WD
repeat domain 72. |
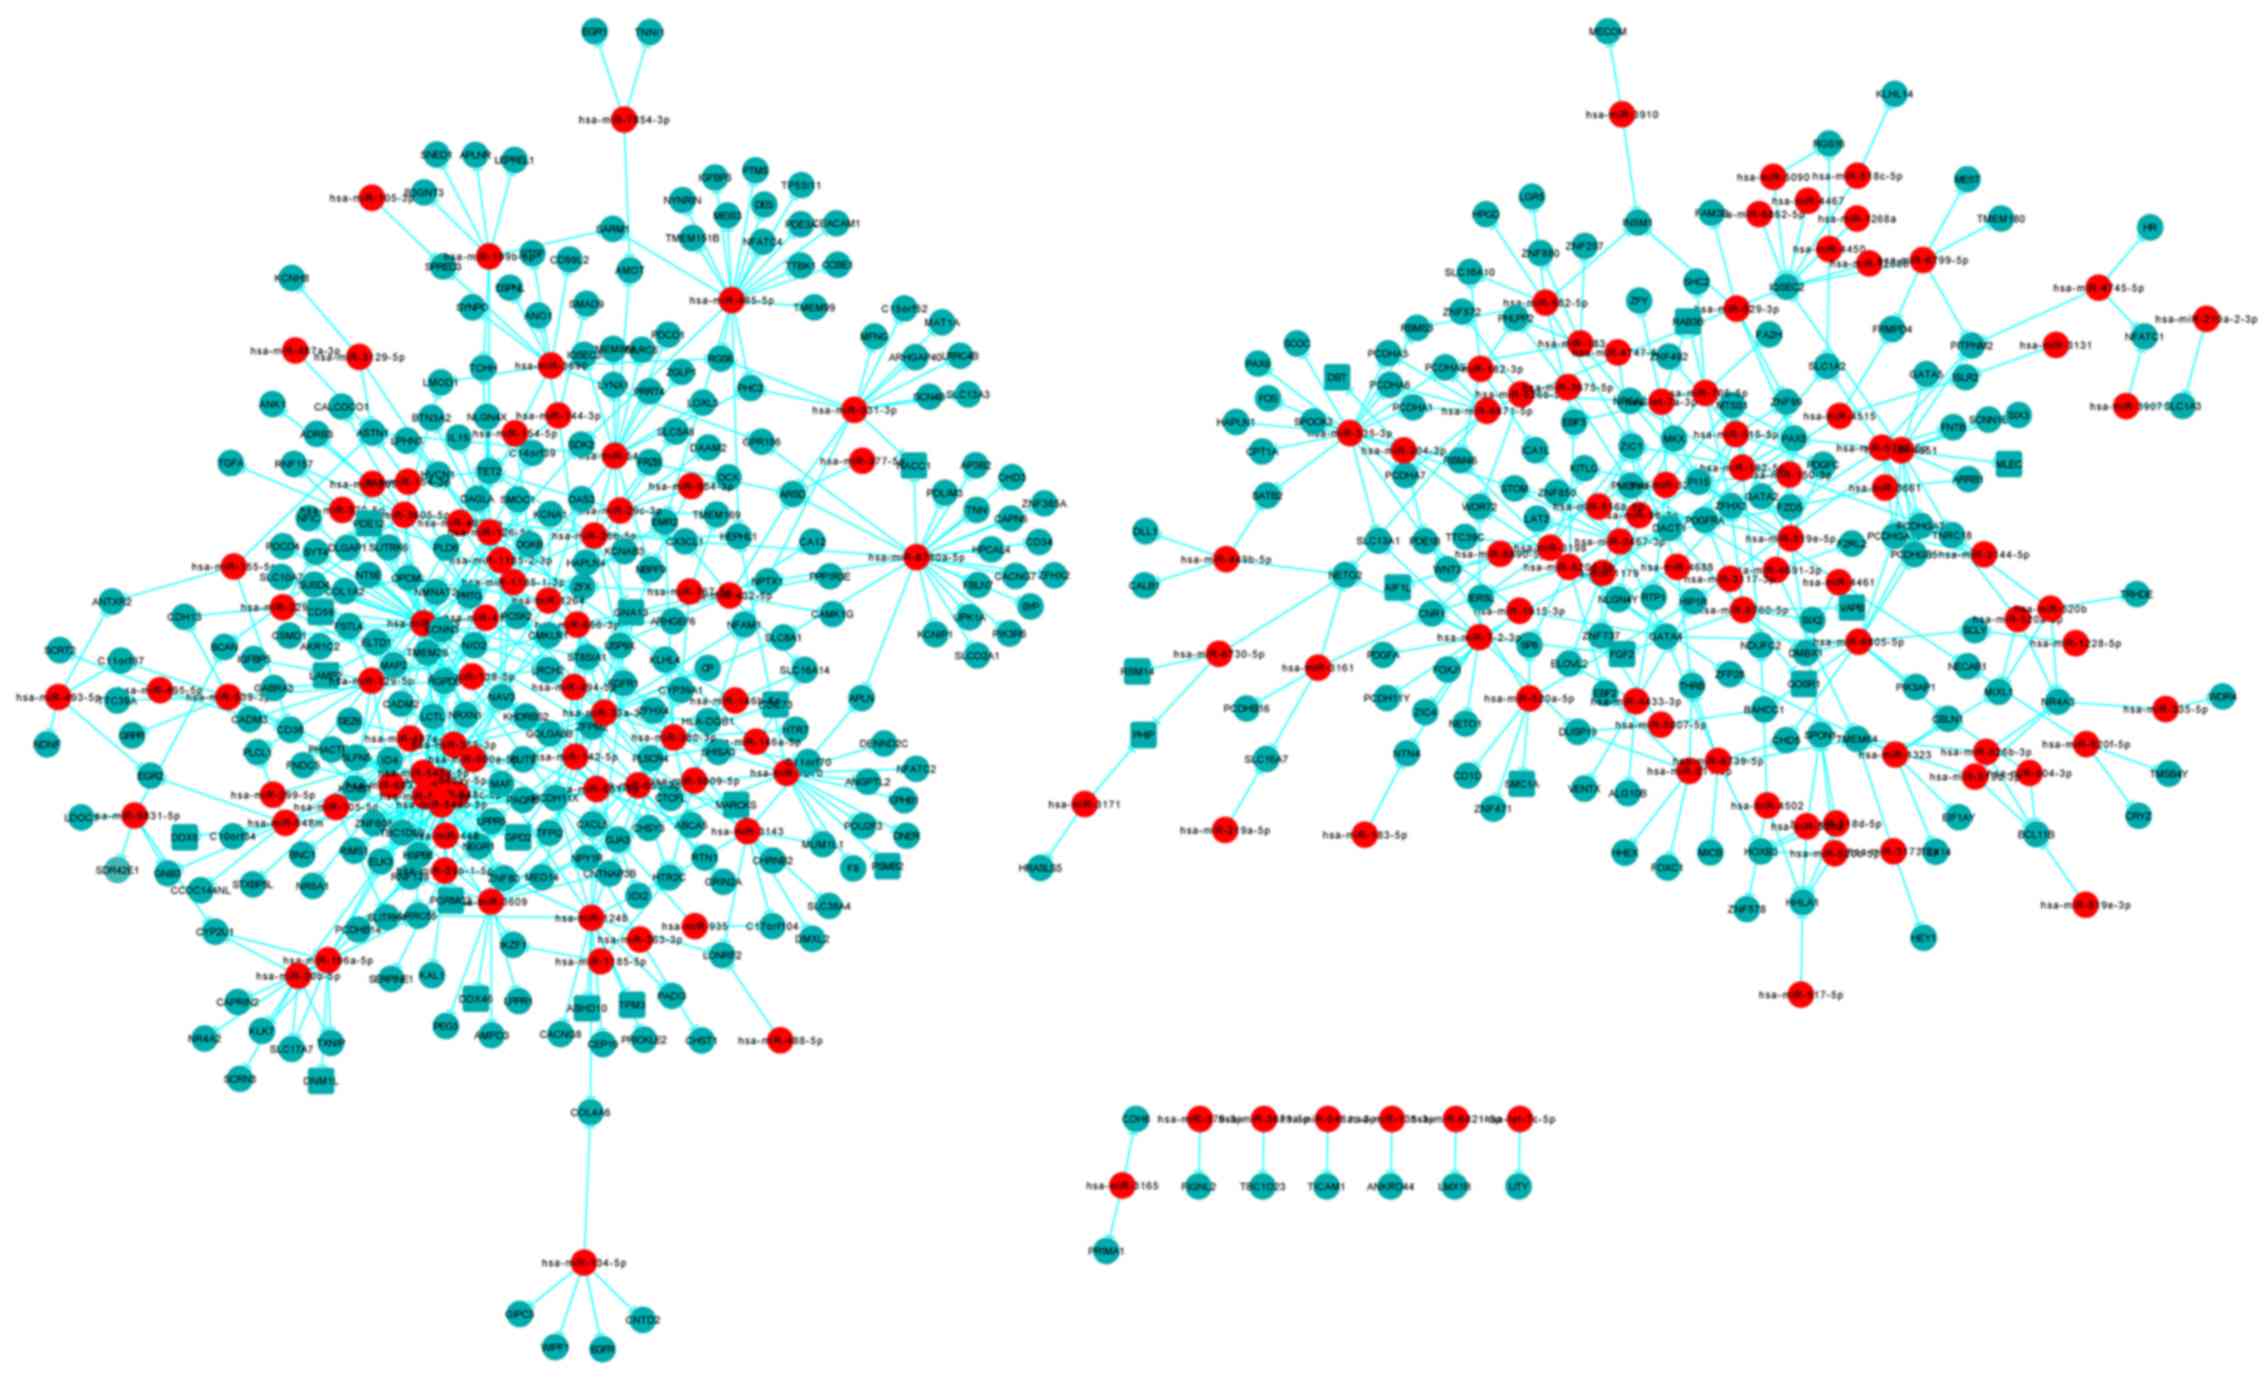
miRNA-protein-transcript network
To integrate the miRNA, transcript and protein data,
Cytoscape was used to construct a network comprising 156 miRNAs, 26
proteins and 381 transcripts (Fig.
8). The network consisted of miRNA-protein and miRNA-transcript
interaction pairs, whereby a single miRNA was able to be connected
to multiple transcripts or proteins, and a single protein or
transcript was able to be targeted by multiple miRNAs. In the
network, the most prominent miRNA was hsa-miR-4775, which was
associated with 30 transcripts and proteins.
Expression profiling by RT-qPCR
A total of three differentially expressed miRNAs and
six differentially expressed transcripts were selected for RT-qPCR
analysis. These miRNAs and transcripts exhibited high abundance and
were differentially expressed between the AS and NC groups. The
expression levels determined by RT-qPCR were consistent with the
read abundance of deep sequencing, indicating the validity of the
microarray-based miRNA and transcript quantification. RT-qPCR
confirmed that hsa-mir-4651, hsa-mir-4461 and hsa-miR-4775 were
upregulated in AS compared with NC (data not shown). In addition,
EGFR, LRRC55, and CX3CLI were upregulated; and
AURKC, RPS4Y1, and FAM18BI were downregulated in AS,
compared with NC (data not shown).
Discussion
It is considered that IPSCs may revolutionize stem
cell biology and regenerative medicine research by providing
unprecedented opportunities to research human diseases and to
overcome study limitations associated with safety, efficiency and
ethics (32). IPSCs are an ideal
platform for medical research as they carry the identical genetic
anomalies associated with genetically heritable diseases, including
Down's syndrome and type 1 diabetes. Various diseases have been
modeled using iPSCs to better understand their etiology, which may
aid in the development of novel treatments (33–35).
In addition, iPSC technology has been employed in various diseases
for disease modeling and gene therapy (36). Zou et al (37) demonstrated that single nucleotide
substitution in human iPSCs was feasible, which may provide a novel
strategy for gene therapy for monogenic diseases, including sickle
cell disease. Another study used zinc finger nucleases and PiggyBac
technology in human iPSCs to achieve biallelic correction of a
point mutation (Glu342Lys) in the serpin family A member 1 gene,
which is responsible for α1-antitrypsin deficiency (38). In addition, a previous study
demonstrated successful in situ gene corrections in iPSCs
derived from patients with pyruvate kinase deficiency (39). In the present study, iPSCs were
used to study the pathogenic mechanisms of AS, since it is a
hereditary disease caused by genetic mutations.
Increasing research has revealed that miRNAs,
transcripts and proteins regulate iPSCs, which may be important for
their pluripotency (40,41). The specific regulatory roles of
miRNAs in controlling the self-renewal and pluripotency of iPSCs
are becoming increasingly evident. Studies have suggested a
critical role for miRNAs in reprogramming somatic cells into
pluripotent cells (42,43). Another study revealed that cells
undergoing iPSC reprogramming exhibited marked transcriptomic
alterations associated with cell signaling pathways (44). Protein studies of iPSCs have also
proven to have the potential to identify molecules and pathways
that are important for iPSC biology (45,46).
Therefore, the present study made use of miRNA, transcript and
protein data to study AS in an iPSC disease model, which will aid
in a better understanding of AS pathogenesis.
Systems biological approaches provide tools to
investigate the interactions between candidate genes by integrating
miRNA, transcript and protein data. Network-based approaches are
ideally suited to study the implications of functional genes in
disease (47). In the present
study, multiple expression profiling and bioinformatics analyses
were integrated. The constructed databases were subjected to
network analysis. To the best of our knowledge, the present study
is the first of its kind to attempt investigating miRNA-target
transcript, miRNA-target protein and transcript-protein networks in
the context of an iPSC AS disease model. The results may be used
for further research in the area of AS.
In the present study, significantly differentially
expressed miRNAs, transcripts and proteins were identified, and the
corresponding targets of the miRNAs were predicted. Target
transcripts, proteins and miRNAs were subjected to GO enrichment
analysis. A systematic comparison of the results revealed similar
GO enrichments terms for AS-iPSCs and NC-iPSCs. Cellular process in
BP, membrane part in CC, and cell binding in MF were identified as
common GO terms for miRNAs and their target transcripts.
AS is an inherited disease caused by gene mutations
that result in absence of the collagen IV network from basement
membranes (9). The glomerular
basement membrane (GBM) is the extracellular matrix component of
the glomerular filtration barrier that lies between podocytes and
endothelial cells. Pathological alterations in the GBM are specific
characteristics of AS (5,9). Notably, the results demonstrated that
the miRNAs and their target transcripts were enriched in the
‘membrane part’ CC category. Studies have also revealed that
podocyte dysfunction and the development of fibrosis are
pathological alterations characteristic of AS (2,48).
Podocytes may bind to various immune deposits, thereby contributing
to the development of fibrosis (49). This is consistent with the present
results, which identified that the miRNAs and their target
transcripts were enriched in ‘binding’ in the MF category. In the
GO analysis of the miRNAs and their target proteins, ‘binding’ was
also a significant term in the MF category.
The common KEGG pathways for the miRNAs and proteins
were those involving carbon metabolism and cell adhesion molecules.
Research has demonstrated that in addition to the inherited AS
factors, acquired external factors serve an important role in the
progression of the disease (50,51).
Metabolic abnormalities are an example of these acquired external
factors (52,53). During the development of kidney
failure, the majority of patients with AS suffer from metabolic
abnormalities, including high blood pressure, hyperlipidemia and
high proteinuria (54,55). Metabolic abnormalities contribute
to the progression of kidney disease and subsequent kidney failure
(56); however, the correction of
metabolic disorders may considerably delay renal replacement
therapy and accelerate the onset of end-stage kidney disease
(57). Cell adhesion molecules are
a principal mechanism of cell-cell and cell-matrix interactions.
The growth, differentiation and organization of cells require
cell-cell interactions (58). A
previous study revealed that cadherin, a cell adhesion molecule,
serves an important role in animal morphogenesis (59). Another study revealed that neural
cell adhesion molecules were already present on the cells of the
uninduced nephrogenic mesenchyme at the onset of kidney development
(60). Therefore, it was
hypothesized that morphological alterations occur in AS during the
developmental process due to abnormalities in cell adhesion
molecules, which in turn results in a thin and fractured GBM.
Cellular reproduction is controlled by
protein-coding genes and noncoding regions, including those
encoding for sRNAs. The expression of coding and noncoding genes
may be markedly influenced by the structural features of the
corresponding sRNA transcripts (61). miRNAs, a diverse class of highly
conserved sRNAs, serve a critical role in fundamental biological
processes, including cellular differentiation, apoptosis, cell
proliferation and development (62,63).
The comprehensive characterization of miRNAs and transcripts in
cell lines provides insight into the miRNA regulation of
transcription, and enables the miRNA regulation of the
corresponding target genes to be evaluated (64). In the present study, the regulatory
network of miRNA-target transcripts revealed that they were
mutually cross-regulated. Similarly, miRNA-protein interaction
networks have long been studied in detail in various diseases.
Numerous diseases have been linked to the misregulation or
malfunction of proteins that interact with RNA (65). Thus, deciphering RNA-protein
interactions at the molecular and cellular level is essential for
understanding human physiology and disease (66). RNA-protein interactions are
critical for the regulation of gene expression. Research over the
last decade has demonstrated that RNA is invariably bound and
frequently altered by proteins in cells, and that in biological
environments, RNAs generally function together with proteins as
RNA-protein complexes (67,68).
In the present study, it was identified that certain miRNAs and
proteins were closely associated. An in-depth study of this
interaction network may aid in understanding the pathogenesis of
AS.
The aim of the present study was to identify
potential important targets through regulatory network analysis of
miRNAs, transcripts and proteins. Notably, hsa-miR-4775 had the
greatest number of associations with proteins and target
transcripts. In addition, hsa-miR-4775 was upregulated in AS-iPSCs,
which was also verified using RT-qPCR. Recently a study revealed
that hsa-miR-4775 promotes colorectal cancer invasion and
metastasis (69). It was also
reported that hsa-miR-4775 binds to the mRNAs of genes involved in
the core apoptosis pathway, resulting in alterations which may lead
to cancer, nephropathy and other diseases (70,71).
The EGFR family is a central element for cellular signal
transduction and diversification (72). Upregulated EGFR was observed to be
the most relevant transcript in the interaction analysis in the
present study. EGFR is known to have a key role in chronic renal
failure (73). Transgenic mice
harboring the negative form of EGFR are resistant to the
progression of renal lesions (74). Dawson et al (75) revealed that EGFR was
overexpressed in 75–90% of renal cell carcinomas and served an
important role in tumor suppression or progression. Downregulated
ELAVL1 was the most prominent protein in the network in the present
study. This protein is a member of the ELAV family of RNA binding
proteins that contain a number of RNA recognition motifs. ELAVL1
has been identified as a key post-transcriptional regulator and is
implicated in cancer progression, particularly human renal cell
carcinoma. ELAVL1 knockdown mice exhibited 60% inhibition of
cell growth through inhibition of cell proliferation in addition to
induction of cellular apoptosis (76). Therefore, it may be hypothesized
that upregulated EGFR was involved in chronic renal failure
of AS. In addition, it was theorized that there was an association
between EGFR and hsa-miR-4775 expression, which may have
accelerated the core apoptosis of GBM cells. However, further
studies are required to confirm this hypothesis.
In conclusion, 155 differentially expressed miRNAs,
1,168 differentially expressed transcripts and 383 differentially
abundant proteins were identified in AS-iPSCs compared with
NC-iPSCs. Using computational and systems techniques, integrated
analysis of miRNA, transcript and protein expression data was
performed. In addition, regulatory network maps were constructed to
determine miRNA interactions with transcripts and proteins. To
investigate the influence of miRNAs on biological processes,
potential targets were predicted using miRanda, TargetScan and
Pictar. The results demonstrated that hsa-miR-4775, ELAVL1 and
EGFR were the most prominent miRNA, protein and transcript,
respectively. RT-qPCR confirmed the upregulation of hsa-miR-4775
and EGFR. Target transcripts, proteins and miRNAs were used
for GO enrichment analysis. ‘Cellular process’ in BP, ‘membrane
part’ in CC and ‘cell binding’ in MF were common GO terms for
miRNAs and target transcripts. ‘Cell binding’ in MF was also a
common GO term for miRNAs and target proteins.
GenMAPP identified common KEGG pathways of miRNAs
and proteins, which included ‘carbon metabolism’ and ‘cell adhesion
molecules’. Integration of multiple profiling datasets provides a
novel way of examining gene regulation by miRNAs in conjunction
with proteins and transcripts. This approach may enhance the
understanding of the pathogenesis of AS and provide novel
diagnostic and treatment strategies for AS.
Acknowledgements
The authors would like to acknowledge the Department
of Collaborative Innovation Center for Diagnosis and Treatment of
Infectious Diseases, Zhejiang University (Hangzhou, China) for
assistance with the bioinformatics analysis.
Funding
The present study was supported by the Natural
Science Foundation of China (grant no. 81671596) and Guangdong
Province Chinese Scientific Project (grant no. 20170209).
Availability of data and materials
The miRNA sequences were submitted to NCBI and
assigned the accession number SRP041435. The raw transcript
sequence data has been deposited at NCBI under the accession number
SRP041474.
Authors' contributions
HD and YD contributed to the conception and design
of the research; WC wrote manuscript and supervised the report; WC
and DT collected information, assembly the tables and drawn the
figures; DT performed the research experiments and interpreted of
data; WC critically reviewed.
Ethics approval and consent to
participate
The study protocol and consent forms were approved
by the Ethics Committee of Jinan University and adhered to the
guidelines set forth in the Declaration of Helsinki.
Patient consent for publication
Healthy participants and patients with AS provided
written informed consent.
Competing interests
The authors declare that they have no competing
interests.
References
|
1
|
Heidet L and Gubler MC: The renal lesions
of Alport syndrome. J Am Soc Nephrol. 20:1210–1215. 2009.
View Article : Google Scholar : PubMed/NCBI
|
|
2
|
Kruegel J, Rubel D and Gross O: Alport
syndrome-insights from basic and clinical research. Nat Rev
Nephrol. 9:170–178. 2013. View Article : Google Scholar : PubMed/NCBI
|
|
3
|
Endreffy E, Ondrik Z, Ivanyi B, Maróti Z,
Bereczki C, Haszon I, Györke Z, Worum E, Németh K, Rikker C, et al:
Collagen type IV nephropathy: Genetic heterogeneity examinations in
affected hungarian families. Mol Cell Probes. 25:28–34. 2011.
View Article : Google Scholar : PubMed/NCBI
|
|
4
|
Thorner PS: Alport syndrome and thin
basement membrane nephropathy. Nephron Clin Pract. 106:c82–c88.
2007. View Article : Google Scholar : PubMed/NCBI
|
|
5
|
Haas M: Alport syndrome and thin
glomerular basement membrane nephropathy: A practical approach to
diagnosis. Arch Pathol Lab Med. 133:224–232. 2009.PubMed/NCBI
|
|
6
|
Miao Y, Xiong J, Zhang X, Huang H, Yu L,
Chen J, Deng W, Xu H, Liu R, Xiang C, et al: Genetic diagnosis of
polycystic kidney disease, Alport syndrome, and thalassemia minor
in a large Chinese family. Clin Sci (Lond). 131:2427–2438. 2017.
View Article : Google Scholar : PubMed/NCBI
|
|
7
|
Weber S, Strasser K, Rath S, Kittke A,
Beicht S, Alberer M, Lange-Sperandio B, Hoyer PF, Benz MR, Ponsel
S, et al: Identification of 47 novel mutations in patients with
alport syndrome and thin basement membrane nephropathy. Pediatr
Nephrol. 31:941–955. 2016. View Article : Google Scholar : PubMed/NCBI
|
|
8
|
Nozu K, Vorechovsky I, Kaito H, Fu XJ,
Nakanishi K, Hashimura Y, Hashimoto F, Kamei K, Ito S, Kaku Y, et
al: X-linked Alport syndrome caused by splicing mutations in
COL4A5. Clin J Am Soc Nephrol. 9:1958–1964. 2014. View Article : Google Scholar : PubMed/NCBI
|
|
9
|
Lin X, Suh JH, Go G and Miner JH:
Feasibility of repairing glomerular basement membrane defects in
alport syndrome. J Am Soc Nephrol. 25:687–692. 2014. View Article : Google Scholar : PubMed/NCBI
|
|
10
|
Guo Y, Yuan J, Liang H, Xiao J, Xu H, Yuan
L, Gao K, Wu B, Tang Y, Li X and Deng H: Identification of a novel
COL4A5 mutation in a Chinese family with X-linked Alport syndrome
using exome sequencing. Mol Biol Rep. 41:3631–3635. 2014.
View Article : Google Scholar : PubMed/NCBI
|
|
11
|
Kim VN and Nam JW: Genomics of microRNA.
Trends Genet. 22:165–173. 2006. View Article : Google Scholar : PubMed/NCBI
|
|
12
|
Ghosh Z, Chakrabarti J and Mallick B:
miRNomics-the bioinformatics of microRNA genes. Biochem Biophys Res
Commun. 363:6–11. 2007. View Article : Google Scholar : PubMed/NCBI
|
|
13
|
Chung AC, Yu X and Lan HY: MicroRNA and
nephropathy: Emerging concepts. Int J Nephrol Renovasc Dis.
6:169–179. 2013.PubMed/NCBI
|
|
14
|
Chen W, Lin X, Huang J, Tan K, Chen Y,
Peng W, Li W and Dai Y: Integrated profiling of microRNA expression
in membranous nephropathy using high-throughput sequencing
technology. Int J Mol Med. 33:25–34. 2014. View Article : Google Scholar : PubMed/NCBI
|
|
15
|
Tan K, Chen J, Li W, Chen Y, Sui W, Zhang
Y and Dai Y: Genome-wide analysis of microRNAs expression profiling
in patients with primary IgA nephropathy. Genome. 56:161–169. 2013.
View Article : Google Scholar : PubMed/NCBI
|
|
16
|
Dai Y, Huang YS, Tang M, Lv TY, Hu CX, Tan
YH, Xu ZM and Yin YB: Microarray analysis of microRNA expression in
peripheral blood cells of systemic lupus erythematosus patients.
Lupus. 16:939–946. 2007. View Article : Google Scholar : PubMed/NCBI
|
|
17
|
Hafner M, Landthaler M, Burger L, Khorshid
M, Hausser J, Berninger P, Rothballer A, Ascano M Jr, Jungkamp AC,
Munschauer M, et al: Transcriptome-wide identification of
RNA-binding protein and microRNA target sites by PAR-CLIP. Cell.
141:129–141. 2010. View Article : Google Scholar : PubMed/NCBI
|
|
18
|
Woroniecka KI, Park AS, Mohtat D, Thomas
DB, Pullman JM and Susztak K: Transcriptome analysis of human
diabetic kidney disease. Diabetes. 60:2354–2369. 2011. View Article : Google Scholar : PubMed/NCBI
|
|
19
|
Famulski KS, Broderick G, Einecke G, Hay
K, Cruz J, Sis B, Mengel M and Halloran PF: Transcriptome analysis
reveals heterogeneity in the injury response of kidney transplants.
Am J Transplant. 7:2483–2495. 2007. View Article : Google Scholar : PubMed/NCBI
|
|
20
|
Kapoor I, Pal P, Lochab S, Kanaujiya JK
and Trivedi AK: Proteomics approaches for myeloid leukemia drug
discovery. Expert Opin Drug Discov. 7:1165–1175. 2012. View Article : Google Scholar : PubMed/NCBI
|
|
21
|
Raimondo F, Corbetta S, Morosi L, Chinello
C, Gianazza E, Castoldi G, Di Gioia C, Bombardi C, Stella A,
Battaglia C, et al: Urinary exosomes and diabetic nephropathy: A
proteomic approach. Mol Biosyst. 9:1139–1146. 2013. View Article : Google Scholar : PubMed/NCBI
|
|
22
|
Park MR, Wang EH, Jin DC, Cha JH, Lee KH,
Yang CW, Kang CS and Choi YJ: Establishment of a 2-D human urinary
proteomic map in IgA nephropathy. Proteomics. 6:1066–1076. 2006.
View Article : Google Scholar : PubMed/NCBI
|
|
23
|
Ebert AD, Liang P and Wu JC: Induced
pluripotent stem cells as a disease modeling and drug screening
platform. J Cardiovasc Pharmacol. 60:408–416. 2012. View Article : Google Scholar : PubMed/NCBI
|
|
24
|
Hirschi KK, Li S and Roy K: Induced
pluripotent stem cells for regenerative medicine. Annu Rev Biomed
Eng. 16:277–294. 2014. View Article : Google Scholar : PubMed/NCBI
|
|
25
|
Qian K, Huang CT, Chen H, Blackbourn LW
IV, Chen Y, Cao J, Yao L, Sauvey C, Du Z and Zhang SC: A simple and
efficient system for regulating gene expression in human
pluripotent stem cells and derivatives. Stem Cells. 32:1230–1238.
2014. View Article : Google Scholar : PubMed/NCBI
|
|
26
|
Hao J, Duan FF and Wang Y: MicroRNAs and
RNA binding protein regulators of microRNAs in the control of
pluripotency and reprogramming. Curr Opin Genet Dev. 46:95–103.
2017. View Article : Google Scholar : PubMed/NCBI
|
|
27
|
Mallanna SK and Rizzino A: Emerging roles
of microRNAs in the control of embryonic stem cells and the
generation of induced pluripotent stem cells. Dev Biol. 344:16–25.
2010. View Article : Google Scholar : PubMed/NCBI
|
|
28
|
Chen W, Huang J, Yu X, Lin X and Dai Y:
Generation of induced pluripotent stem cells from renal tubular
cells of a patient with Alport syndrome. Int J Nephrol Renovasc
Dis. 8:101–109. 2015.PubMed/NCBI
|
|
29
|
Audic S and Claverie JM: The significance
of digital gene expression profiles. Genome Res. 7:986–995. 1997.
View Article : Google Scholar : PubMed/NCBI
|
|
30
|
Livak KJ and Schmittgen TD: Analysis of
relative gene expression data using real-time quantitative PCR and
the 2(-Delta Delta C(T)) method. Methods. 25:402–408. 2001.
View Article : Google Scholar : PubMed/NCBI
|
|
31
|
Van Roey K and Davey NE: Motif
co-regulation and co-operativity are common mechanisms in
transcriptional, post-transcriptional and post-translational
regulation. Cell Commun Signal. 13:452015. View Article : Google Scholar : PubMed/NCBI
|
|
32
|
Singh VK, Kalsan M, Kumar N, Saini A and
Chandra R: Induced pluripotent stem cells: Applications in
regenerative medicine, disease modeling, and drug discovery. Front
Cell Dev Biol. 3:22015. View Article : Google Scholar : PubMed/NCBI
|
|
33
|
Kondo Y, Toyoda T, Inagaki N and Osafune
K: iPSC technology-based regenerative therapy for diabetes. J
Diabetes Investig. 9:234–243. 2018. View Article : Google Scholar : PubMed/NCBI
|
|
34
|
Yoshida Y and Yamanaka S: Induced
pluripotent stem cells 10 years later: For cardiac applications.
Circ Res. 120:1958–1968. 2017. View Article : Google Scholar : PubMed/NCBI
|
|
35
|
Jungverdorben J, Till A and Brustle O:
Induced pluripotent stem cell-based modeling of neurodegenerative
diseases: A focus on autophagy. J Mol Med (Berl). 95:705–718. 2017.
View Article : Google Scholar : PubMed/NCBI
|
|
36
|
Jang YY and Ye Z: Gene correction in
patient-specific iPSCs for therapy development and disease
modeling. Hum Genet. 135:1041–1058. 2016. View Article : Google Scholar : PubMed/NCBI
|
|
37
|
Zou J, Mali P, Huang X, Dowey SN and Cheng
L: Site-specific gene correction of a point mutation in human iPS
cells derived from an adult patient with sickle cell disease.
Blood. 118:4599–4608. 2011. View Article : Google Scholar : PubMed/NCBI
|
|
38
|
Yusa K, Rashid ST, Strick-Marchand H,
Varela I, Liu PQ, Paschon DE, Miranda E, Ordóñez A, Hannan NR,
Rouhani FJ, et al: Targeted gene correction of alpha1-antitrypsin
deficiency in induced pluripotent stem cells. Nature. 478:391–394.
2011. View Article : Google Scholar : PubMed/NCBI
|
|
39
|
Garate Z, Quintana-Bustamante O, Crane AM,
Olivier E, Poirot L, Galetto R, Kosinski P, Hill C, Kung C, Agirre
X, et al: Generation of a high number of healthy erythroid cells
from gene-edited pyruvate kinase deficiency patient-specific
induced pluripotent stem cells. Stem Cell Reports. 5:1053–1066.
2015. View Article : Google Scholar : PubMed/NCBI
|
|
40
|
Brix J, Zhou Y and Luo Y: The epigenetic
reprogramming roadmap in generation of iPSCs from somatic cells. J
Genet Genomics. 42:661–670. 2015. View Article : Google Scholar : PubMed/NCBI
|
|
41
|
Liang G and Zhang Y: Embryonic stem cell
and induced pluripotent stem cell: An epigenetic perspective. Cell
Res. 23:49–69. 2013. View Article : Google Scholar : PubMed/NCBI
|
|
42
|
Li N, Long B, Han W, Yuan S and Wang K:
microRNAs: Important regulators of stem cells. Stem Cell Res Ther.
8:1102017. View Article : Google Scholar : PubMed/NCBI
|
|
43
|
Wang T, Shi SB and Sha HY: MicroRNAs in
regulation of pluripotency and somatic cell reprogramming: Small
molecule with big impact. RNA Biol. 10:1255–1261. 2013. View Article : Google Scholar : PubMed/NCBI
|
|
44
|
Zhang H, Xue C, Shah R, Bermingham K,
Hinkle CC, Li W, Rodrigues A, Tabita-Martinez J, Millar JS, Cuchel
M, et al: Functional analysis and transcriptomic profiling of
iPSC-derived macrophages and their application in modeling
mendelian disease. Circ Res. 117:17–28. 2015. View Article : Google Scholar : PubMed/NCBI
|
|
45
|
Huang X, Wang Y, Yan W, Smith C, Ye Z,
Wang J, Gao Y, Mendelsohn L and Cheng L: Production of
gene-corrected adult beta globin protein in human erythrocytes
differentiated from patient iPSCs after genome editing of the
sickle point mutation. Stem Cells. 33:1470–1479. 2015. View Article : Google Scholar : PubMed/NCBI
|
|
46
|
Chen F, Zhang G, Yu L, Feng Y, Li X, Zhang
Z, Wang Y, Sun D and Pradhan S: High-efficiency generation of
induced pluripotent mesenchymal stem cells from human dermal
fibroblasts using recombinant proteins. Stem Cell Res Ther.
7:992016. View Article : Google Scholar : PubMed/NCBI
|
|
47
|
Poos K, Smida J, Nathrath M, Maugg D,
Baumhoer D and Korsching E: How microRNA and transcription factor
co-regulatory networks affect osteosarcoma cell proliferation. PLoS
Comput Biol. 9:e10032102013. View Article : Google Scholar : PubMed/NCBI
|
|
48
|
Nagata M: Podocyte injury and its
consequences. Kidney Int. 89:1221–1230. 2016. View Article : Google Scholar : PubMed/NCBI
|
|
49
|
Wang H, Yue Z, Wu J, Liu T, Mo Y, Jiang X
and Sun L: The accumulation of VEGFA in the glomerular basement
membrane and its relationship with podocyte injury and proteinuria
in alport syndrome. PLoS One. 10:e01356482015. View Article : Google Scholar : PubMed/NCBI
|
|
50
|
Hudson BG, Tryggvason K, Sundaramoorthy M
and Neilson EG: Alport's syndrome, goodpasture's syndrome, and type
IV collagen. N Engl J Med. 348:2543–2556. 2003. View Article : Google Scholar : PubMed/NCBI
|
|
51
|
Kluth DC and Rees AJ: Anti-glomerular
basement membrane disease. J Am Soc Nephrol. 10:2446–2453.
1999.PubMed/NCBI
|
|
52
|
Chen J, Gu D, Chen CS, Wu X, Hamm LL,
Muntner P, Batuman V, Lee CH, Whelton PK and He J: Association
between the metabolic syndrome and chronic kidney disease in
chinese adults. Nephrol Dial Transplant. 22:1100–1106. 2007.
View Article : Google Scholar : PubMed/NCBI
|
|
53
|
Peralta CA, Kurella M, Lo JC and Chertow
GM: The metabolic syndrome and chronic kidney disease. Curr Opin
Nephrol Hypertens. 15:361–365. 2006. View Article : Google Scholar : PubMed/NCBI
|
|
54
|
Jarad G, Knutsen RH, Mecham RP and Miner
JH: Albumin contributes to kidney disease progression in Alport
syndrome. Am J Physiol Renal Physiol. 311:F120–F130. 2016.
View Article : Google Scholar : PubMed/NCBI
|
|
55
|
Gross O, Licht C, Anders HJ, Hoppe B, Beck
B, Tönshoff B, Höcker B, Wygoda S, Ehrich JH, Pape L, et al: Early
angiotensin-converting enzyme inhibition in Alport syndrome delays
renal failure and improves life expectancy. Kidney Int. 81:494–501.
2012. View Article : Google Scholar : PubMed/NCBI
|
|
56
|
Kurella M, Lo JC and Chertow GM: Metabolic
syndrome and the risk for chronic kidney disease among nondiabetic
adults. J Am Soc Nephrol. 16:2134–2140. 2005. View Article : Google Scholar : PubMed/NCBI
|
|
57
|
Klahr S, Levey AS, Beck GJ, Caggiula AW,
Hunsicker L, Kusek JW and Striker G: The effects of dietary protein
restriction and blood-pressure control on the progression of
chronic renal disease. Modification of diet in renal disease study
group. N Engl J Med. 330:877–884. 1994. View Article : Google Scholar : PubMed/NCBI
|
|
58
|
Gumbiner BM: Cell adhesion: The molecular
basis of tissue architecture and morphogenesis. Cell. 84:345–357.
1996. View Article : Google Scholar : PubMed/NCBI
|
|
59
|
Halbleib JM and Nelson WJ: Cadherins in
development: Cell adhesion, sorting, and tissue morphogenesis.
Genes Dev. 20:3199–3214. 2006. View Article : Google Scholar : PubMed/NCBI
|
|
60
|
Klein G, Langegger M, Goridis C and Ekblom
P: Neural cell adhesion molecules during embryonic induction and
development of the kidney. Development. 102:749–761.
1988.PubMed/NCBI
|
|
61
|
Lagos-Quintana M, Rauhut R, Lendeckel W
and Tuschl T: Identification of novel genes coding for small
expressed RNAs. Science. 294:853–858. 2001. View Article : Google Scholar : PubMed/NCBI
|
|
62
|
Ambros V: The functions of animal
microRNAs. Nature. 431:350–355. 2004. View Article : Google Scholar : PubMed/NCBI
|
|
63
|
Cui Q, Yu Z, Pan Y, Purisima EO and Wang
E: MicroRNAs preferentially target the genes with high
transcriptional regulation complexity. Biochem Biophys Res Commun.
352:733–738. 2007. View Article : Google Scholar : PubMed/NCBI
|
|
64
|
Glisovic T, Bachorik JL, Yong J and
Dreyfuss G: RNA-binding proteins and post-transcriptional gene
regulation. FEBS Lett. 582:1977–1986. 2008. View Article : Google Scholar : PubMed/NCBI
|
|
65
|
Li JH, Liu S, Zhou H, Qu LH and Yang JH:
starBase v2.0: Decoding miRNA-ceRNA, miRNA-ncRNA and protein-RNA
interaction networks from large-scale CLIP-Seq data. Nucleic Acids
Res. 42:D92–D97. 2014. View Article : Google Scholar : PubMed/NCBI
|
|
66
|
Jankowsky E and Harris ME: Specificity and
nonspecificity in RNA-protein interactions. Nat Rev Mol Cell Biol.
16:533–544. 2015. View Article : Google Scholar : PubMed/NCBI
|
|
67
|
Buenrostro JD, Araya CL, Chircus LM,
Layton CJ, Chang HY, Snyder MP and Greenleaf WJ: Quantitative
analysis of RNA-protein interactions on a massively parallel array
reveals biophysical and evolutionary landscapes. Nat Biotechnol.
32:562–568. 2014. View Article : Google Scholar : PubMed/NCBI
|
|
68
|
Hennig J and Sattler M: Deciphering the
protein-RNA recognition code: Combining large-scale quantitative
methods with structural biology. Bioessays. 37:899–908. 2015.
View Article : Google Scholar : PubMed/NCBI
|
|
69
|
Zhao S, Sun H, Jiang W, Mi Y, Zhang D, Wen
Y, Cheng D, Tang H, Wu S, Yu Y, et al: miR-4775 promotes colorectal
cancer invasion and metastasis via the Smad7/TGFβ-mediated
epithelial to mesenchymal transition. Mol Cancer. 16:122017.
View Article : Google Scholar : PubMed/NCBI
|
|
70
|
Lima RT, Busacca S, Almeida GM, Gaudino G,
Fennell DA and Vasconcelos MH: MicroRNA regulation of core
apoptosis pathways in cancer. Eur J Cancer. 47:163–174. 2011.
View Article : Google Scholar : PubMed/NCBI
|
|
71
|
Ouyang L, Shi Z, Zhao S, Wang FT, Zhou TT,
Liu B and Bao JK: Programmed cell death pathways in cancer: A
review of apoptosis, autophagy and programmed necrosis. Cell
Prolif. 45:487–498. 2012. View Article : Google Scholar : PubMed/NCBI
|
|
72
|
Prenzel N, Fischer OM, Streit S, Hart S
and Ullrich A: The epidermal growth factor receptor family as a
central element for cellular signal transduction and
diversification. Endocr Relat Cancer. 8:11–31. 2001. View Article : Google Scholar : PubMed/NCBI
|
|
73
|
Lautrette A, Li S, Alili R, Sunnarborg SW,
Burtin M, Lee DC, Friedlander G and Terzi F: Angiotensin II and EGF
receptor cross-talk in chronic kidney diseases: A new therapeutic
approach. Nat Med. 11:867–874. 2005. View
Article : Google Scholar : PubMed/NCBI
|
|
74
|
Friedlander G and Terzi F: Angiotensin and
EGF receptor cross-talk in chronic kidney diseases: Towards a new
therapeutic approach. Bull Acad Natl Med. 190:927–934. 2006.(In
French). PubMed/NCBI
|
|
75
|
Dawson NA, Guo C, Zak R, Dorsey B, Smoot
J, Wong J and Hussain A: A phase II trial of gefitinib (Iressa,
ZD1839) in stage IV and recurrent renal cell carcinoma. Clin Cancer
Res. 10:7812–7819. 2004. View Article : Google Scholar : PubMed/NCBI
|
|
76
|
Danilin S, Sourbier C, Thomas L, Lindner
V, Rothhut S, Dormoy V, Helwig JJ, Jacqmin D, Lang H and Massfelder
T: Role of the RNA-binding protein HuR in human renal cell
carcinoma. Carcinogenesis. 31:1018–1026. 2010. View Article : Google Scholar : PubMed/NCBI
|