Introduction
Pseudomonas aeruginosa (P. aeruginosa)
is one of the ESKAPE bacterial species that is particularly
concerning, because they represent the largest group of nosocomial
pathogens with growing incidences of antibiotic resistance
(1,2). Plethora of studies are focused on
eliminating or reducing P. aeruginosa infection by using
novel molecules (3–5). The main problem is tracking the
action of these molecules in vivo, with a non-invasive
method. Μagnetic resonance imaging (MRI) can be considered as a
non-invasive method for monitoring the course of the infection. An
MRI approach using USPIO nanoparticles as molecules to label the
macrophages that are present in the infected area has been reported
and seems to open perspectives for testing novel anti-infective
compounds (6,7). Recently, the explosion in available
fluorescent proteins promises a wide variety of new tools for
biological imaging, and in particular, for protein labeling and
cell tracing (8). In the last
decade, Green Fluorescent Protein (GFP) has been frequently used as
a marker of gene expression, since it is non-toxic for both animals
and bacteria and thus useful for in vivo imaging (9). The introduction of GFP has
revolutionized the field of cell biology and fluorescence
microscopy (10). GFP is a
naturally fluorescent protein, consisting of an 11-strand β-barrel
wrapped around a central helix that is widely utilized as a
fluorescent marker of gene expression (11). GFP is detected by optical
spectroscopy through its fluorescent properties; the protein has a
major excitation peak at 395 nm and in a normal solution gives
emission peaking at 508 nm (11).
In vivo GFP can be detected only if the tissue is
transparent or if protein expression is close to tissue surface
(12). Due to this limitation,
most experiments utilizing this marker are focused on in
vitro cell cultures, ex vivo histology slices, or
transparent animal models (13,14).
GFP is extensively used in animal models, in
transplantation studies to determine the fate of transplanted
cells, as well as for studying various biological processes.
Published studies on in vivo MRI using GFP protein as a
marker to label tumor cells for example melanoma cells (15) or stem cells (16) suggested that the labeling does not
affect expression of other genes.
Recently, the magnetization transfer contrast (MTC)
technique was used to detect GFP and was shown to produce
protein-specific values that seemed to be concentration dependent
(17). MTC MRI has been utilized
for detecting early macromolecular changes in the Tg2576 mouse
model of Alzheimer's disease (18)
for localizing the signal to noise ratio (SN) in vivo
(19). MTC is an MRI technique
able to detect changes in macromolecule concentration and
composition (20). MTC is commonly
used to track changes in myelination as a way to grade multiple
sclerosis lesions (21). Recently,
MTC has also been utilized to detect macromolecular accumulation in
a mouse model of early Alzheimer's disease (18).
The MTC technique uses the application of a
radiofrequency pulse at a specific distance from the water
resonance, known as the offset frequency. This radiofrequency pulse
causes a loss of signal intensity proportional to macromolecular
concentration. When combined with a reference image, where the
radiofrequency pulse is not applied, the percent of signal loss can
be quantified in what is referred to as the magnetization transfer
ratio (MTR). Specifically, MTC evaluates changes in semisolid
macromolecules (22).
This provides a flexible, non-invasive in
vivo molecular imaging system exclusively dependent on the
concentration of the fluorescent reporter. Starting from these
results the idea of this work was the possibility to follow the
P. aeruginosa infection in vivo using the MTC MRI
method and the GFP as a molecular marker.
Materials and methods
Bacterial strains and growth
conditions
UCBPP-PA14 (PA14) is a P. aeruginosa human
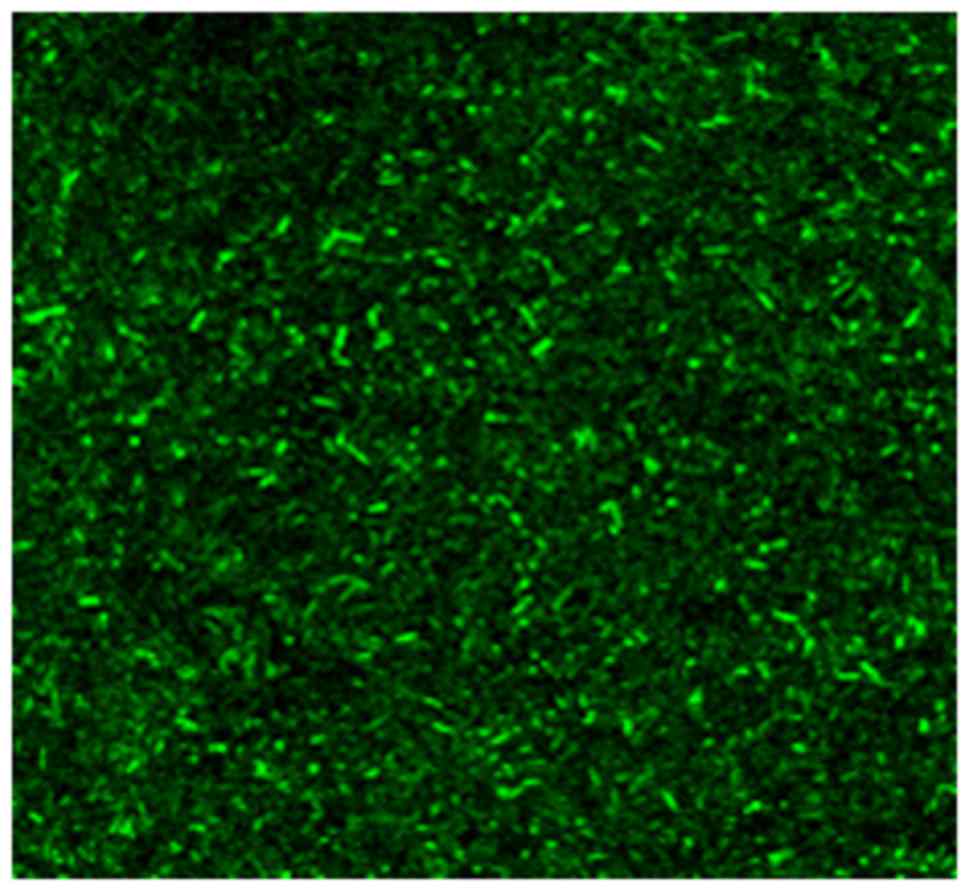
clinical isolate (23). GFP-tagged
P. aeruginosa (PA-GFP), (Fig. 1), GFP-tagged E. coli
(EC-GFP) (both tagged with a stable plasmid expressing GFP)
and non-fluorescent P. aeruginosa (PA) cells were
grown overnight in 5 ml LB Lenox medium (Thermo Fisher Scientific,
Inc., Waltham, MA, USA) at 37°C under 200 rpm orbital shaking using
glass tubes (VWR). The next day, bacteria were centrifuged,
re-suspended and diluted in phosphate-buffered saline (PBS) to
final concentrations of 5×10⁶ and 5×10⁵
cells/ml. The latter concentration is equivalent to the PA
inoculum used in a murine burn and infection model. Then 0.2 ml
microfuge tubes were filled to the maximum capacity with the
diluted cultures (23).
Fluorescence of the cells was confirmed by microscopy under the 1st
section talking about the bacteria.
Phantom
One phantom was prepared to test and calibrate the
experiments. Three microfuge tubes (capacity 0.2 ml) were filled to
the maximum capacity with the diluted cultures of PA-GFP,
EC-GFP and PA cells, respectively, and placed in a
Falcon tube (2.7 cm inner diameter) filled with isotonic saline
(NaCl) solution.
Animals
Six weeks old, CD-1 mice were anesthetized and a leg
burn injury of 5% total burn surface area (TBSA) was produced on
the right thigh muscle. Briefly, animals were anesthetized with
Xylazine (13 mg/kg, i.p.) and Ketamine (87 mg/kg, i.p.), thermally
injured (5–8% of body surface) on the shaved abdomen dermis, and
intra-dermally infected into the burn eschar. Mice were randomized
into one experimental and control groups (N=6 per group). The
experimental group consisted of burned mice infected with
PA-GFP-tagged PA14 P. aeruginosa strain containing no
plasmid and the control group consisted of burned mice infected
with wild-type P. aeruginosa. Mice were infected as
described in Rahme et al (23). An inoculum of 5×10⁵ PA14
cells in 100 µl of PBS was injected intradermal into the burn
eschar. The animal protocol was approved by the Massachusetts
General Hospital Institutional Animal Care and Use Committee.
MRI experiments
The mice were imaged 12 h post-burn and infection.
During MRI, mice were kept anesthetized with a mixture of
isoflurane and maintained at 37°C.
We used a triple phantom in a 4.7 T horizontal bore
magnet (20 cm bore diameter, Magnex Scientific, using a Bruker
Avance console). The images were acquired in a 4.7 T horizontal
magnet, 20 cm bore, equipped with gradient system capable of 39
G/cm, Magnex Scientific, using a Bruker Avance console (Bruker
BioSpin, Billerica, MA, USA) with a custom-built volume coil of 3
cm inner diameter and 10 cm active length. The main magnetic field
(B0) was shimmed and the RF filed (B1) was calibrated. We acquired
a RARE sequence (also known as Fast Spin Echo, FSE) with
magnetization transfer (24–26).
The imaging pulse sequence comprised a pre-saturation pulse at the
designated offset frequency followed by a spin echo sequence with
TE/TR=7.95/2,000 msec. Images were recorded with a 128×128 matrix,
field of view, 3×3 cm; slice thickness, 3 mm; and average, 1.
Pre-saturation off-resonance pulses ranged from ±0.05 to ±0.4
kHz.
Magnetization transfer ratios (MTR) in the form of
MTR=(unsaturated-saturated)/unsaturated were calculated from the
signal intensities of regions of interest (ROI) using Paravision
software (Bruker BioSpin).
Statistical analysis
Data are expressed as a mean ± standard deviation.
Comparisons between groups were performed in each group using a
two-tailed t-test (P-value=0.05). Moreover we implemented the
analysis with a One-Way ANOVA analysis followed by Tukey's post hoc
test using the Metaboanalyst online softaware (http://www.metaboanalyst.ca/).
Results
GFP cell model
We compared the MTC profiles of GFP-tagged P.
aeruginosa cells to those of the non-fluorescent P.
aeruginosa, GFP-tagged and E. coli cells in culture.
Cells were visualized in 0.2 ml tubes filled to capacity with
5×10⁵ cells/ml. The non-fluorescent P.
aeruginosa, was chosen as a non-specific control to compare
against GFP-tagged bacteria, whereas E. coli was used as a
specific control for the GFP to compare with both tagged and
wild-type P. aeruginosa. The goal was to find the frequency
at which there was the largest difference between GFP-tagged P.
aeruginosa and E. coli, and non-fluorescent P.
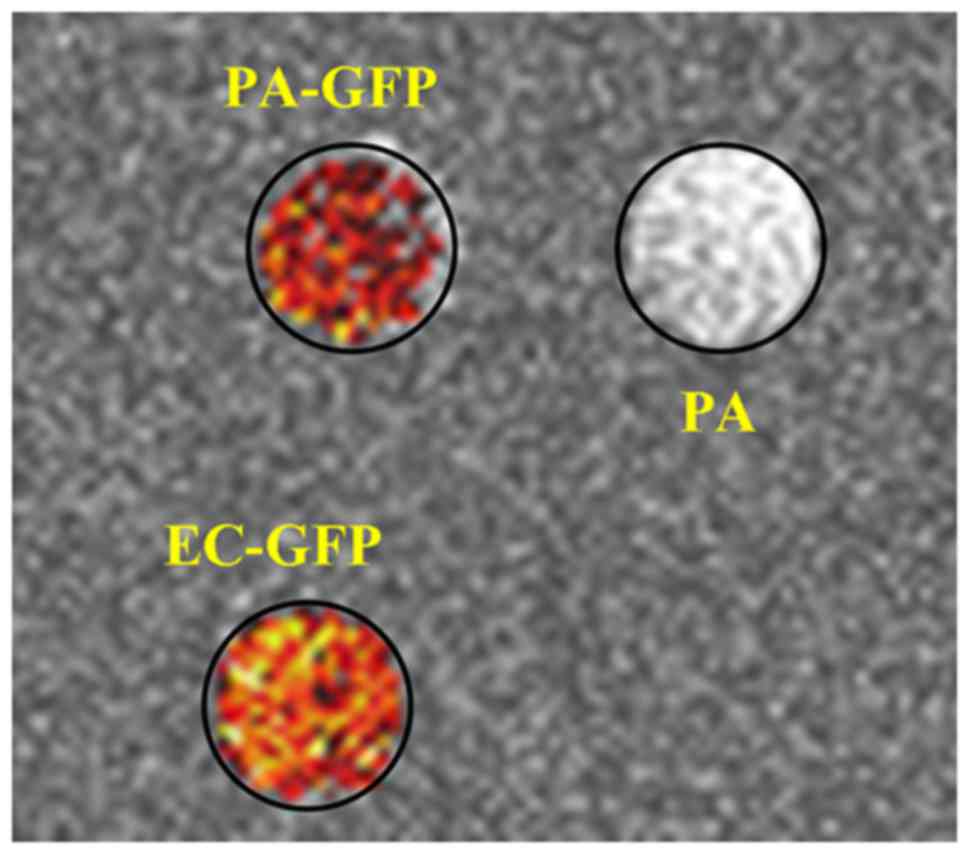
aeruginosa (Fig. 2). Samples
were imaged first without and then with MTC. Nine MTC datasets were
acquired from 0.05 to 0.4 kHz. The MTR was calculated from the
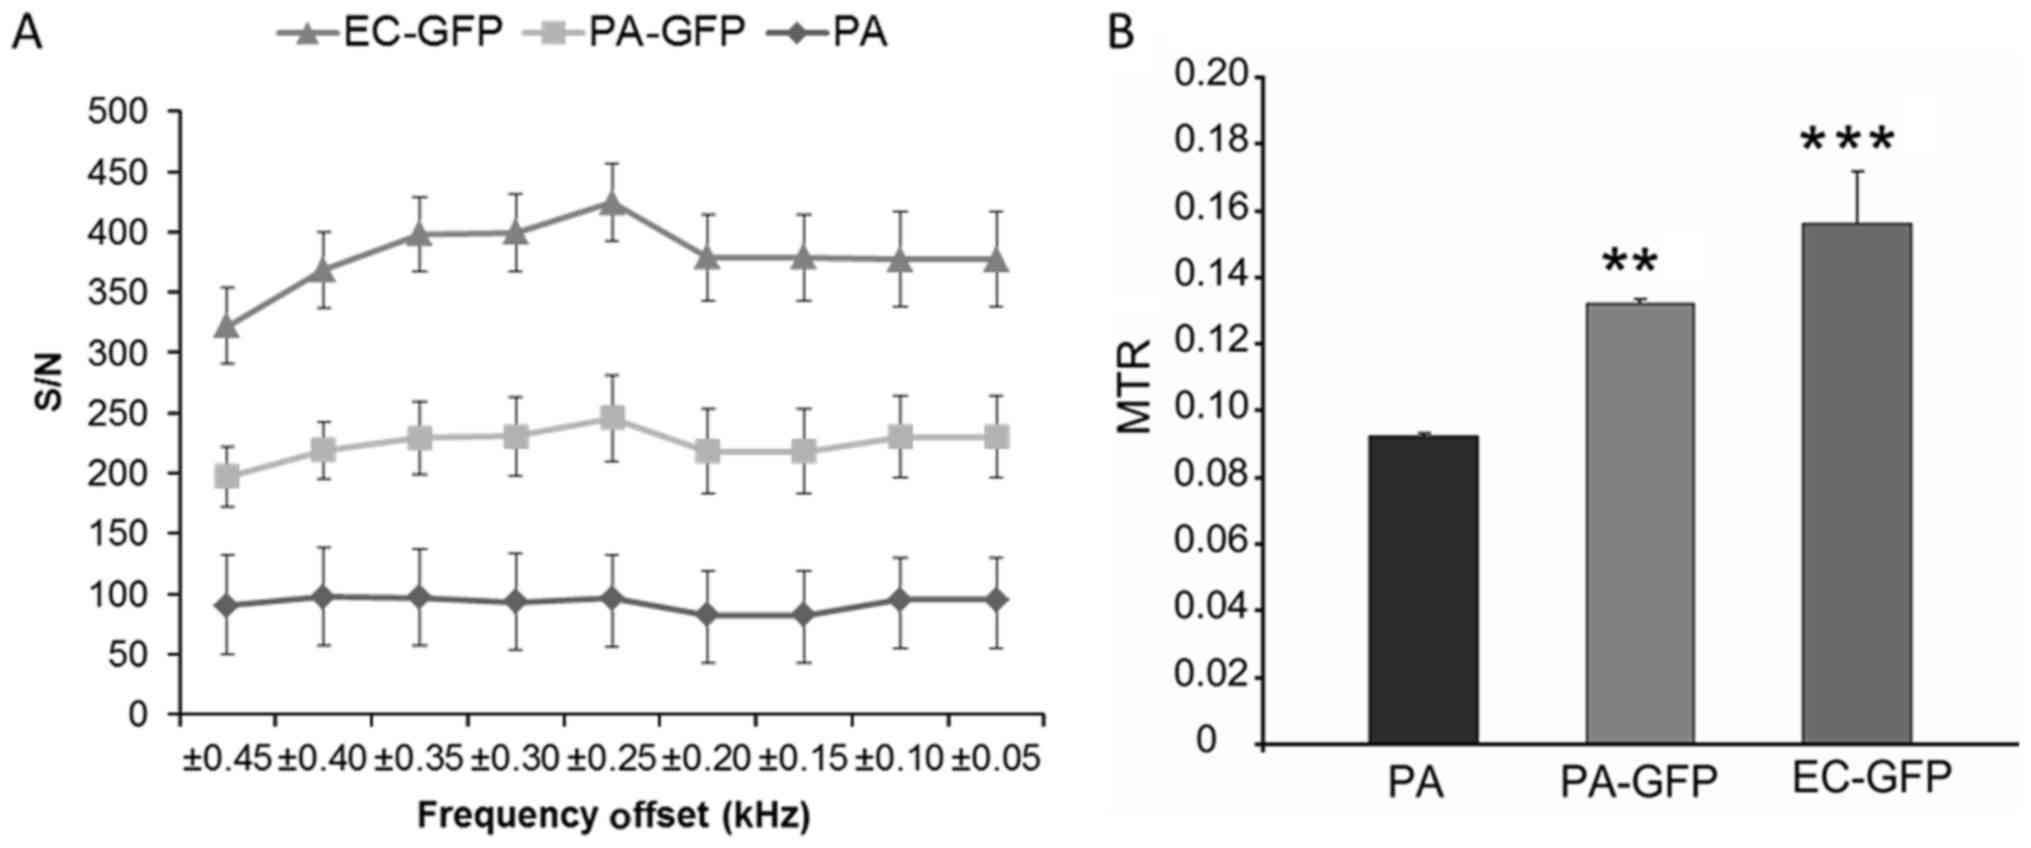
images, and is shown in Fig. 3A.
We found the largest difference between 0.2, 0.25 and 0.3 kHz (the
peak difference was at 0.25 kHz) for EC-GFP and for
PA-GFP with respect to PA (Fig.
3A). Pseudo-colored pixel by pixel MTR calculations visually
show a clear difference between the PA-GFP and PA
phantoms (Fig. 3B); we found a
statistically significant difference between PA and
EC-GFP (P<0.0001), and an even greater statistically
significant difference between PA and PA-GFP
(P=0.00001). These simple t-test analyst is confirmed by using a
multiple comparison Tukey's analysis (One-way ANOVA Analysis). The
PA samples are strongly different from EC-GFP and
PA-GFP and the data are statistically significant with
P<0.001 and P<0.01 respectively.
GFP mouse model
The comparison of the GFP-tagged and non-tagged live
P. aeruginosa and E. coli cells using MTC MRI
indicated that this method was sensitive enough to distinguish
between GFP-tagged and non-tagged bacteria at cell concentrations
relevant to those to be used in animal infection models.
Accordingly, the MTC MRI profiles of mice infected with non-tagged
P. aeruginosa and mice infected with GFP-tagged P.
aeruginosa were compared to determine the frequency with the
largest difference between them in the infected a burn area.
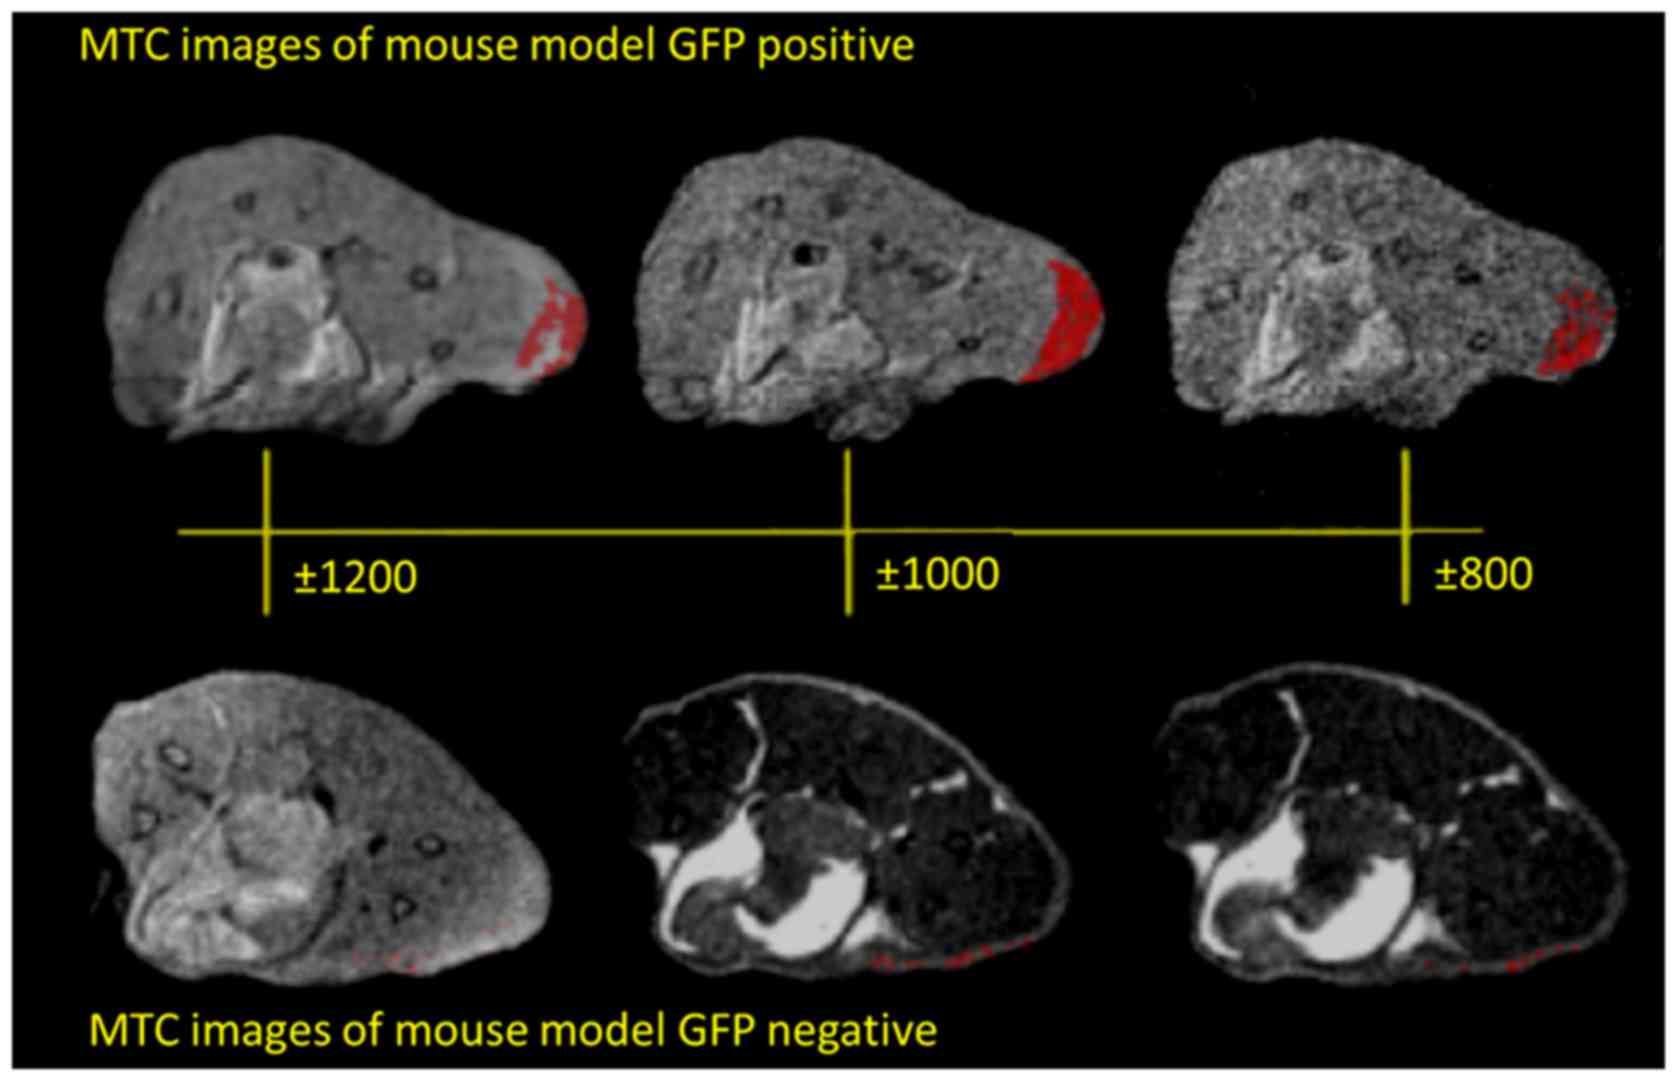
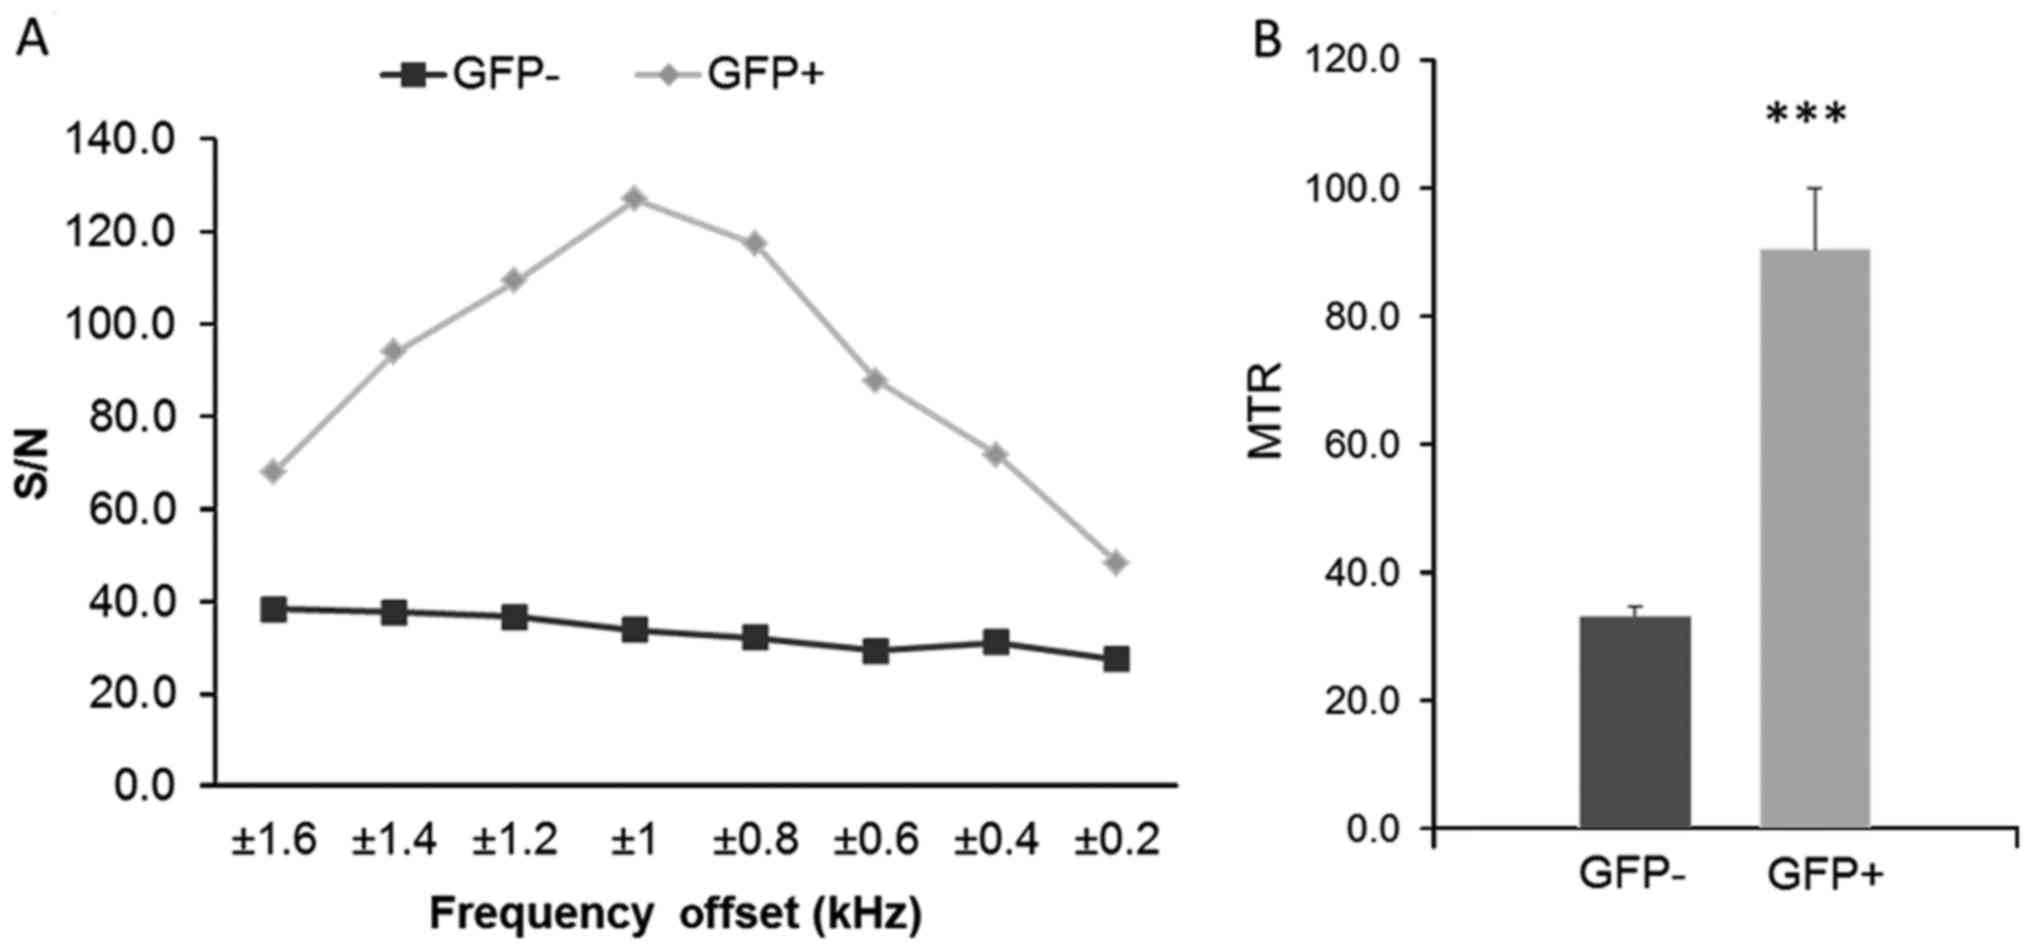
Fig. 4 shows the in vivo
MRI results from our experiments in mice, and the MTR maps
demonstrated an enhancement in the GFP expressing infected animals.
The two groups (GFP-positive and GFP-negative) were imaged first
without and then with MTC. In addition, nine MTC datasets were
acquired from 0.2 to 1.6 kHz. The control animal did not give any
appreciable signal at this setting. The MTR was calculated from the
images, and is shown in Fig. 5A.
We found the largest difference between 0.8, 1 and 1.2 kHz, the
peak difference being at 1 kHz, for the GFP-positive with respect
to the GFP-negative mice. Fig. 5B
shows the calculated MTR values; we found a statistically
significant difference between GFP+ and GFP−
with a P<0.0001.
The visual representation is more useful to assess
the spatial distribution of signal changes compared to a single ROI
analysis. The unsaturated images for a representative GFP
expressing and control animal demonstrated different signal
intensities. The MTR maps demonstrated an enhancement in the GFP
expressing animals.
Discussion
MTC MRI methods have been used before to distinguish
intrinsic macromolecule concentration changes. The main advantages
of detecting GFP, an extrinsic protein marker, with MTC MRI
compared to other MRI based reporters, such as USPIO are the
non-toxicity of the protein and the potential to detect the
expression of a specific gene or product in vivo serially
and non-invasively. Our results confirm that we can detect
GFP-tagged live bacteria using MTC MRI both in vitro and
in vivo.
Comparison of the GFP-tagged and non-tagged live
P. aeruginosa and E. coli cells using the MTC MRI
methodology indicated that this method was sensitive enough to
distinguish between GFP-tagged and non-tagged bacteria and to
successfully image in vivo GFP-tagged P. aeruginosa
in a non-invasive manner. We observed a difference in the MRI MTR
value between PA and PAGFP, which was statistically
significant (P<0.0001).
Also, we report an in vivo study of
GFP-tagged MTC MRI in a burn mouse model infected with P.
aeruginosa. The utility of this method is to visualize
bacterial infections in vivo in real time, and to study the
impact of novel therapeutics on bacterial proliferation and
viability within the host system. The use of an extrinsic protein
marker provides an added flexibility. The main advantages of
detecting GFP with MTC MRI over other MRI based reporters includes
that there are multiple GFP mouse lines available and it poses no
toxicity to the host or the bacteria.
Our results confirm the hypothesis that we can
detect GFP-tagged live bacteria using MTC MRI.
The study reported here assessed detection of GFP
through MTC MRI both in vitro and in vivo
experiments. To provide optimal results and the best off-set
frequency we worked on the fine-tuned and at the end we found that
1 kHz offset as the most robust offset frequency for the MTC
detection of GFP and provided the difference between tagged and
non-tagged mice. Our results are similar to the data reported by
Pérez-Torres et al (17).
We were able to successfully use this methodology to
image in vivo GFP-tagged P. aeruginosa in a murine
burn and infection model, showing the utility of MTC for tracking
bacterial proliferation and gene expression in vivo in
animal models in a non-invasive manner. The significance of this
method is that it can be used to visualize bacterial infections
in vivo in real time without being restricted to the use of
transparent tissue necessary for optical imaging. The innocuous
nature of the technology allows for repeated imaging over time
without damage to the host or the bacteria. Furthermore, this in
vivo, MRI molecular imaging technique can detect varying levels
of the GFP reporter, further establishing its utility for studying
host-bacterial interactions. In addition to the visualizing
bacterial infections and expression of GFP tagged gene, in
vivo and in real time, this method could be suitable for
assessing the efficacy of novel therapeutics on specific targets,
and, bacterial proliferation and viability within the host
system.
Overall, this method provides a valuable,
non-invasive imaging tool to study the impact of novel
antibacterial therapeutics on bacterial proliferation and perhaps
viability within the host system, and could potentially give clues
to the modulation of bacterial gene expression within the host when
exposed to such compounds.
Acknowledgements
This abstract was presented at the International
Society of Magnetic Resonance Annual Meeting hold in Stockholm in
2010 and was published as Abstract no. 5135 Proceeding ‘Righi V,
Starkey M, Dai G, Rahme LG and Tzika AA: Magnetization transfer
contrast MRI in GFP-tagged live bacteria. Proc Intl Soc Mag Reson
Med 18: 513, 2010. ISBN: 978–1-61782-008-3’. This abstract was
presented at the International Society of Magnetic Resonance Annual
Meeting hold in Montreal in 2011 and was published as Abstract no.
662 Proceeding ‘Righi V, Starkey M, Rahme LG, Tompkins RG and Tzika
AA: Magnetization Transfer Contrast MRI detects Pseudomonas
Aeruginosa bacterial infection a mouse burn model. Proc Intl Soc
Mag Reson Med 19: 662, 2011. ISBN: 978-1-61839-284-8. ISSN:
1545-4428’.
Funding
The present study was funded by Shriners Burn
Hospitals and NIH grants (NIH grant no. R01AI134857 and grant no.
R33AI105902).
Availability of data and materials
All data generated or analysed during this study are
included in this published article.
Authors' contributions
VR analyzed the samples and interpreted data and
wrote the manuscript; MS prepared the samples and helped in writing
the manuscript; GD helped in the MRI acquisition data; LR supported
the study, helped in writing the manuscript and interpreting the
results, and organized the cells and mice preparation, AT designed
the study, helped in data interpretation and wrote the manuscript.
All authors read and approved the final manuscript.
Ethics approval and consent to
participate
This study was carried out in strict accordance with
the recommendations of the Guide for the Care and Use of Laboratory
Animals of the National Institutes of Health. The protocol was
approved by the Committee on the Ethics of Animal Experiments at
Massachusetts General Hospital (Permit no. 2006N000093/2).
Patient consent for publication
Not applicable.
Competing interests
The authors declare that they have no competing
interests.
References
|
1
|
Turner KH, Everett J, Trivedi U, Rumbaugh
KP and Whiteley M: Requirements for Pseudomonas aeruginosa
acute burn and chronic surgical wound infection. PLoS Genet.
10:e10045182014. View Article : Google Scholar : PubMed/NCBI
|
|
2
|
Pendleton JN, Gorman SP and Gilmore BF:
Clinical relevance of the ESKAPE pathogens. Expert Rev Anti Infect
Ther. 11:297–308. 2013. View Article : Google Scholar : PubMed/NCBI
|
|
3
|
Church D, Elsayed S, Reid O, Winston B and
Lindsay R: Burn wound infections. Clin Microbiol Rev. 19:403–434.
2006. View Article : Google Scholar : PubMed/NCBI
|
|
4
|
Lyczak JB, Cannon CL and Pier GB:
Establishment of Pseudomonas aeruginosa infection: Lessons
from a versatile opportunist. Microbes Infect. 2:1051–1060. 2000.
View Article : Google Scholar : PubMed/NCBI
|
|
5
|
McVay CS, Velásquez M and Fralick JA:
Phage therapy of Pseudomonas aeruginosa infection in a mouse
burn wound model. Antimicrob Agents Chemother. 51:1934–1938. 2007.
View Article : Google Scholar : PubMed/NCBI
|
|
6
|
Andronesi OC, Mintzopoulos D, Righi D,
Psychogios N, Kesarwani M, He J, Yasuhara S, Dai G, Rahme LG and
Tzika AA: Combined off-resonance imaging and T2 relaxation in the
rotating frame for positive contrast MR imaging of infection in a
murine burn model. J Magn Reson Imaging. 32:1172–1183. 2010.
View Article : Google Scholar : PubMed/NCBI
|
|
7
|
Starkey M, Lepine F, Maura D,
Bandyopadhaya A, Lesic B, He J, Kitao T, Righi V, Milot S, Tzika A
and Rahme L: Identification of anti-virulence compounds that
disrupt quorum-sensing regulated acute and persistent
pathogenicity. PLoS Pathog. 10:e10043212014. View Article : Google Scholar : PubMed/NCBI
|
|
8
|
Shaner NC, Steinbach PA and Tsien RY: A
guide to choosing fluorescent proteins. Nat Methods. 2:905–909.
2005. View
Article : Google Scholar : PubMed/NCBI
|
|
9
|
Chalfie M, Tu Y, Euskirchen G, Ward WW and
Prasher DC: Green fluorescent protein as a marker for gene
expression. Science. 263:802–805. 1994. View Article : Google Scholar : PubMed/NCBI
|
|
10
|
Stepanenko OV, Verkhusha VV, Kuznetsova
IM, Uversky VN and Turoverov KK: Fluorescent proteins as biomarkers
and biosensors: Throwing color lights on molecular and cellular
processes. Curr Protein Pept Sci. 9:338–369. 2008. View Article : Google Scholar : PubMed/NCBI
|
|
11
|
Tsien RY: The green fluorescent protein.
Annu Rev Biochem. 67:509–544. 1998. View Article : Google Scholar : PubMed/NCBI
|
|
12
|
Helmchen F and Denk W: Deep tissue
two-photon microscopy. Nat Methods. 2:932–940. 2005. View Article : Google Scholar : PubMed/NCBI
|
|
13
|
Shaner NC, Patterson GH and Davidson MW:
Advances in fluorescent protein technology. J Cell Sci.
120:4247–4260. 2007. View Article : Google Scholar : PubMed/NCBI
|
|
14
|
Zhang J, Campbell RE, Ting AY and Tsien
RY: Creating new fluorescent probes for cell biology. Nat Rev Mol
Cell Biol. 3:906–918. 2002. View
Article : Google Scholar : PubMed/NCBI
|
|
15
|
Wunderbaldinger P, Josephson L, Bremer C,
Moore A and Weissleder R: Detection of lymph node metastases by
contrast-enhanced MRI in an experimental model. Magn Reson Med.
47:292–297. 2002. View Article : Google Scholar : PubMed/NCBI
|
|
16
|
Pawelczyk E, Jordan EK, Balakumaran A,
Chaudhry A, Gormley N, Smith M, Lewis BK, Childs R, Robey PG and
Frank JA: In vivo transfer of intracellular labels from locally
implanted bone marrow stromal cells to resident tissue macrophages.
PLoS One. 4:e67122009. View Article : Google Scholar : PubMed/NCBI
|
|
17
|
Pérez-Torres CJ, Massaad CA, Hilsenbeck
SG, Serrano F and Pautler RG: In vitro and in vivo magnetic
resonance imaging (MRI) detection of GFP through magnetization
transfer contrast (MTC). Neuroimage. 50:375–382. 2010. View Article : Google Scholar : PubMed/NCBI
|
|
18
|
Pérez-Torres CJ, Reynolds JO and Pautler
RG: Use of magnetization transfer contrast MRI to detect early
molecular pathology in Alzheimer's disease. Magn Reson Med.
71:333–338. 2014. View Article : Google Scholar : PubMed/NCBI
|
|
19
|
Bolding MS, Reid MA, Avsar KB, Roberts RC,
Gamlin PD, Gawne TJ, White DM, den Hollander JA and Lahti AC:
Magnetic transfer contrast accurately localizes substantia nigra
confirmed by histology. Biol Psychiatry. 73:289–294. 2013.
View Article : Google Scholar : PubMed/NCBI
|
|
20
|
Wolff SD and Balaban RS: Magnetization
transfer contrast (MTC) and tissue water proton relaxation in vivo.
Magn Reson Med. 10:135–144. 1989. View Article : Google Scholar : PubMed/NCBI
|
|
21
|
Horsfield MA: Magnetization transfer
imaging in multiple sclerosis. J Neuroimaging. 15 Suppl 4:58S–67S.
2005. View Article : Google Scholar : PubMed/NCBI
|
|
22
|
Henkelman RM, Stanisz GJ and Graham SJ.
Magnetization transfer in MRI: A review. NMR Biomed. 14:57–64.
2001. View
Article : Google Scholar : PubMed/NCBI
|
|
23
|
Rahme LG, Stevens EJ, Wolfort SF, Shao J,
Tompkins RG and Ausubel FM: Common virulence factors for bacterial
pathogenicity in plants and animals. Science. 268:1899–1902. 1995.
View Article : Google Scholar : PubMed/NCBI
|
|
24
|
Forsén S and Hoffman RA: Study of
moderately rapid chemical exchange reactions by means of nuclear
magnetic double resonance. J Chem Phys. 39:28921963. View Article : Google Scholar
|
|
25
|
Baguet E and Roby C: Off-resonance
irradiation effect in steady-state NMR saturation transfer. J Magn
Reson. 128:149–160. 1997. View Article : Google Scholar : PubMed/NCBI
|
|
26
|
Sun PZ, Van Zijl PC and Zhou J:
Optimization of the irradiation power in chemical exchange
dependent saturation transfer experiments. J Magn Reson.
175:193–200. 2005. View Article : Google Scholar : PubMed/NCBI
|