Introduction
Wilms tumor (WT), or nephroblastoma, is a type of
pediatric renal malignancy that typically occurs in children,
representing 6–14% of childhood tumors (1,2).
With the advancement of multimodal therapies for WT, the 5-year
overall survival rate has reached its peak (2,3).
Unfortunately, high-risk WT, including anaplastic histology WT
subtypes, rhabdoid tumor, metastatic renal sarcoma and carcinoma,
still have a generally poor prognosis (4). Additionally, current treatment
strategies for high-risk nephroblastoma include surgery, radiation
therapy and chemotherapy; however, a targeted cure is still lacking
(5). Therefore, novel therapeutic
methods targeting specific mechanisms of high-risk nephroblastoma
carcinogenesis are required to improve treatment efficiency and
avoid the side effects of traditional therapy.
Advances in RNA sequencing technologies have
revealed the complexity of the human genome. Investigation of the
RNA transcriptome is one of the most important challenges facing
biology today, as RNAs represent novel potential biomarkers and
drug targets (6–9). Presently, accumulating evidence
suggests that numerous key mRNAs identified in WT are closely
associated with the pathogenesis of this tumor, including
programmed cell death, reversion inducing cysteine rich protein
with kazal motifs, TIMP metallopeptidase inhibitor 3, tropomyosin 1
and phosphatase and tensin homolog (10). However molecular biomarkers that
may be predictive of a curative effect and prognosis in high-risk
WT have not been reported.
The Cancer Genome Atlas (TCGA), a publicly available
database, provides the gene expression profiles of >10,000
specimens from >25 different tumor types to be used for
biological discovery (11). In the
present study, weighted gene co-expression network analysis (WGCNA)
and other analyses were performed using TCGA datasets to identify
hub genes associated with clinical features of WT. These hub genes
have the potential to be biomarkers of high-risk WT
tumorigenesis.
Materials and methods
Study population
Datasets were manually retrieved from TCGA database
(12). The primary tumor site for
high-risk WT was the kidney. Regarding experimental strategy, RNA
sequencing (seq) was used. Taken together, a total of 132 WT and 6
normal samples, including the clinical information and mRNA-seq
data, were downloaded via the Data Transfer Tool (provided by GDC
Apps; http://tcga-data.nci.nih.gov/). The
sequenced data were all derived from IlluminaHiSeq RNA-Seq
platforms. The present study followed the publication guidelines
provided by TCGA (http://cancergenome.nih.gov/publications/publicationguidelines).
Differentially expressed gene (DEG)
analysis
Prior to statistical analysis, the high-risk WT
RNA-seq data derived from 138 WT samples were normalized across all
matrixes using the ‘batch’ package (13). In addition, tumor sample and normal
sample data were merged and expressed data, which closed to zero,
were deleted. Differential expression (DE) for genes, including all
six normal control samples, was tested with the ‘DESeq’ and ‘edgR’
packages in R software version 3.4.0 (14,15).
The empirical probability distribution of the fold-changes
associated with significant DEs (P<0.05) was used to define a
|log2 fold-change| with a threshold >2.0 (16). To remove potential noise, all
fold-change values associated with comparisons that were not
considered significant by the ‘Limma’ package or potentially
significant by threshold-filtering were converted to ‘zero’, which
in the log2 scale corresponds to the complete absence of
differential regulation among all samples, with the function
f(C)=IC (X), where:
ICj(xi)={0ifα-<xi<α+xiifxi<α-xiifxi>α+
Finally, to maintain every one data corresponding to
per samples, the retained fold-change values were calculated by
subtracting the median normalized log2 expression values
of the normal samples from the respective WT samples.
Construction of gene co-expression
network
WGCNA is a systems biology method for describing the
correlation patterns among genes across microarray samples. WGCNA
may be used for identifying modules of highly correlated genes,
summarizing such clusters using a module eigengene or an
intra-modular hub gene, relating modules to one another and to
external sample traits, and for calculating module membership
measures. Correlation networks facilitate network-based gene
screening methods that may be used to identify candidate biomarkers
or therapeutic targets (17–19).
To identify the interactions between the DEGs, the
WGCNA, which used the topological overlapping measurement, was
performed to identify the co-expression modules with a threshold of
power cutoff of 14 and a module size cutoff ≤30 (13). All DEGs were used, and Pearson's
correlation was calculated for all pairs of selected genes. The
correlation data were converted into the adjacency matrix with a
power function; therefore, the correlation strength between two
genes, xi and xj, was defined as aij=| 0.5 *
(1+cor(xi, xj))|β, where
xi and xj represent the expression values of
the probes. The parameter β was determined by the criterion that
the resulting adjacency matrix approximately met a scale-free
topological feature, according to the proposed model-fitting index.
The row index u (u=1,…, m) represents sample measurements. This was
further transformed into a topological overlap matrix (TOM), which
captures not only the direct interaction among two genes, but also
the indirect interactions throughout all the other genes in the
network. In the present study, it was possible to identify two
functions of adjacency matrices. At first, the TOM is defined as
follows:
TOMij=∑uaiuauj+aijmin(ki,kj)+1-aij,ki=∑uaiu
Therefore, it was possible to calculate the node
connectivity. Secondly, the other function was performed as a
matrix into hierarchical clustering of the transcript profiles for
identifying the modules, and it may be defined as follows:
Dissimij=1-TOMij
Functional annotation and
protein-protein interactions (PPIs)
To identify Kyoto Encyclopedia of Genes and Genomes
(KEGG) pathways associated with each DEG, the KEGG Orthology Based
Annotation System (KOBAS) was used to annotate the function of
different module genes, with a false discovery rate thresholds
<0.05 (20). Cytoscape software
was used to construct a co-expression network of hub DEG-mediated
pathways (21). These DEG-pathway
network data were subsequently exported as Microsoft Excel files
(Microsoft Corporation, Redmond, WA, USA).
In order to obtain protein interactions between DEGs
of different modules, we used the Search Tool for the Retrieval of
Interacting Genes online tool to construct a PPI network for the
DEGs (minimum required interaction score >0.4) (22). In addition, Cytoscape software was
used to visualize the PPI networks. Finally, the Cytohubb plugin
was used to identify the hub genes in the PPI network (23).
Survival analysis
In order to identify prognostic hub mRNA signatures,
survival curves of all the clinical data from patients in TCGA were
combined with those of hub DEGs using log-rank tests. The
‘survival’ package was adopted to produce the survival curves in R
software (24). This analysis was
based on Kaplan-Meier univariate survival analysis (24). P<0.05 was considered to indicate
a statistically significant difference.
Results
Patient characteristics
The detailed clinical characteristics of the WT
study population are summarized in Table I. In the present study, the median
age of patients with WT was 3 years old and the median survival
time was 77.5 months. In addition, there were more female patients
(54.4%) compared with male patients (45.6%). The distribution of
race among patients demonstrated that Caucasian represented largest
proportion (68.4%). Regarding the tumor stage, it was identified
that the patients with stage II and III represented the largest
proportion (33%) compared with other stage groups. As demonstrated
in Table I, the distribution of
histological classification illustrated that the patients with
favorable-histology WT were increased compared with those with
diffusely anaplastic WT. Regarding adverse events, patients with WT
suffered more relapses (18.8%) compared with patients with
progression (2.1%).
 | Table I.Clinical characteristics of 138
patients with Wilms tumor. |
Table I.
Clinical characteristics of 138
patients with Wilms tumor.
| Variable | Patients with Wilms
tumor (n=138) |
|---|
| Age, years |
|
|
Median | 3 |
|
IQR | 2-5 |
| Overall survival
time, months |
|
|
Median | 77.5 |
|
IQR | 44.75–109 |
| Sex |
|
|
Male | 63
(45.4%) |
|
Female | 75
(54.6%) |
| Race |
|
|
Caucasian | 94
(68.4%) |
| African
American | 24
(17.7%) |
|
Other | 20
(13.9%) |
| Ethnicity |
|
|
Local | 86
(62.2%) |
|
Hispanic or Latino | 11 (8%) |
|
Other | 41
(29.8%) |
| Tumor stage |
|
| Stage
I | 28 (20%) |
| Stage
II | 45 (33%) |
| Stage
III | 46 (33%) |
| Stage
IV | 10
(7.6%) |
| Stage
V | 9
(6.4%) |
| Histology
classification |
|
|
Favorable-histology Wilms
tumor | 117 (85.7%) |
|
Diffusely anaplastic Wilms
tumor | 21
(14.3%) |
| Adverse event |
|
|
Progression | 3
(2.1%) |
|
Relapse | 26
(18.8%) |
|
None | 109 (79.1%) |
Gene expression profiles in high-risk
WT
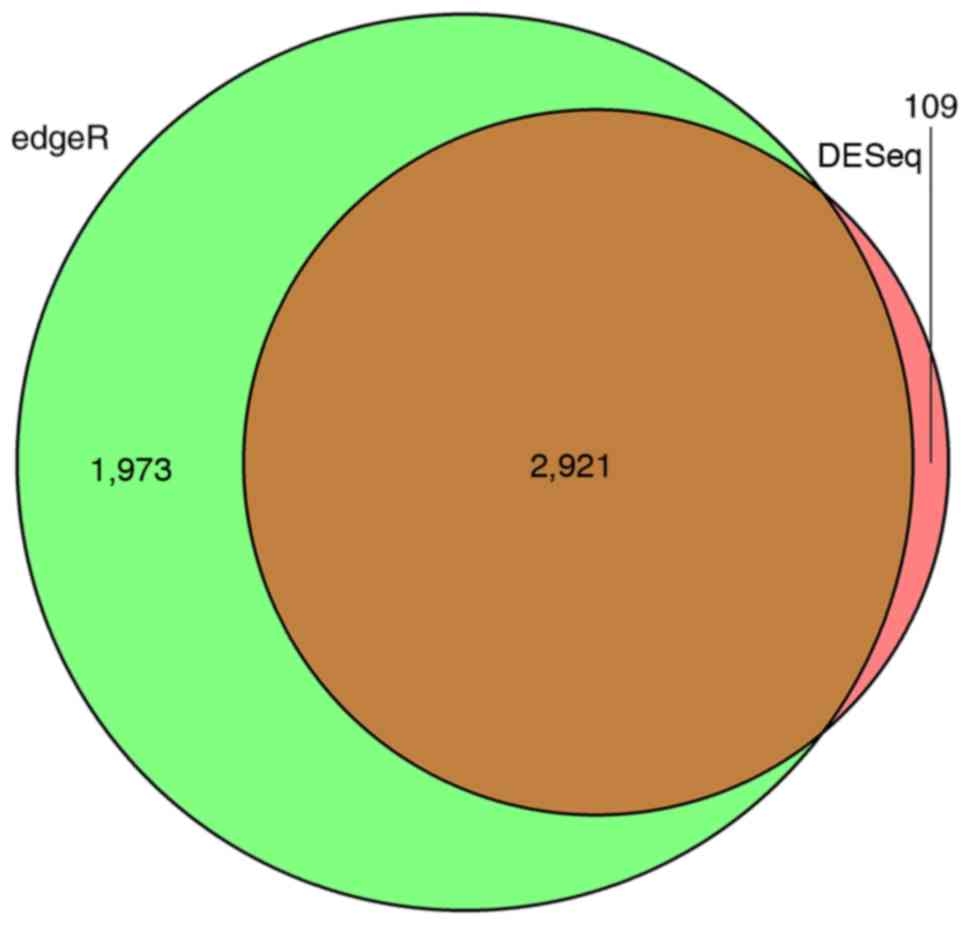
Using high-risk WT expression profiles from the TCGA
database, significant DEGs in 138 tumor samples compared with six
normal samples were identified. There were 2,089 downregulated and
941 upregulated DEGs identified by the DESeq package, accounting
for 68.94 and 31.06% of all DEGs, respectively. In total, 4,894
DEGs were identified using the edgR package, among which 2,044 DEGs
were downregulated in high-risk WT tumor samples and 2,850 were
upregulated. According to the Venn diagram, a total of 2,921
overlapping DEmRNAs were identified, among which 1,987 were
downregulated DEGs and 934 were upregulated, accounting for 68.02
and 31.98% of all overlapping DEGs, respectively. These genes were
DEGs, as computed by the DESeq and edgR algorithms (Fig. 1). The top 10 upregulated and
downregulated mRNAs with a |log2foldchange|>2.0 are presented in
Table II.
| Table II.The top 10 upregulated and
downregulated genes. |
Table II.
The top 10 upregulated and
downregulated genes.
| Gene symbol | logFC | Adjusted
P-value |
|---|
| LIN28B | 13.36619486 |
5.42×10⁻⁶ |
| SIX2 | 12.52402043 |
7.06×10−47 |
| DGKK | 12.24930467 |
4.66×10⁻¹⁶ |
| VSTM2B | 12.04214637 |
6.34×10⁻⁹ |
| GPAT3 | 11.61327772 |
1.85×10⁻⁹ |
| CHRNA1 | 11.52619613 |
2.15×10⁻¹³ |
| DLK1 | 11.46063048 |
1.56×10⁻³ |
| COL2A1 | 10.55873377 |
1.68×10−44 |
| PCDH15 | 10.33793967 |
2.40×10⁻²⁵ |
| GATA4 | 10.29733454 |
1.25×10⁻⁷ |
|
| Gene
symbol | logFC | Adjusted
P-value |
|
| UMOD | −18.37509732 |
9.61×10−65 |
| AQP2 | −13.96005987 |
1.11×10⁻³² |
| KNG1 | −12.65948815 |
3.72×10−41 |
| FXYD4 | −12.04659281 |
4.80×10−61 |
| GP2 | −11.12440106 |
9.70×10⁻²⁸ |
| SLC9A4 | −10.52222348 |
1.56×10⁻²⁹ |
| CLCNKA | −10.26143663 |
1.07×10⁻²³ |
| BSND | −10.11652616 |
8.55×10⁻²² |
| HRG | −10.11203117 |
3.38×10⁻¹⁹ |
| SEMG2 | −9.973583814 |
3.12×10⁻⁶ |
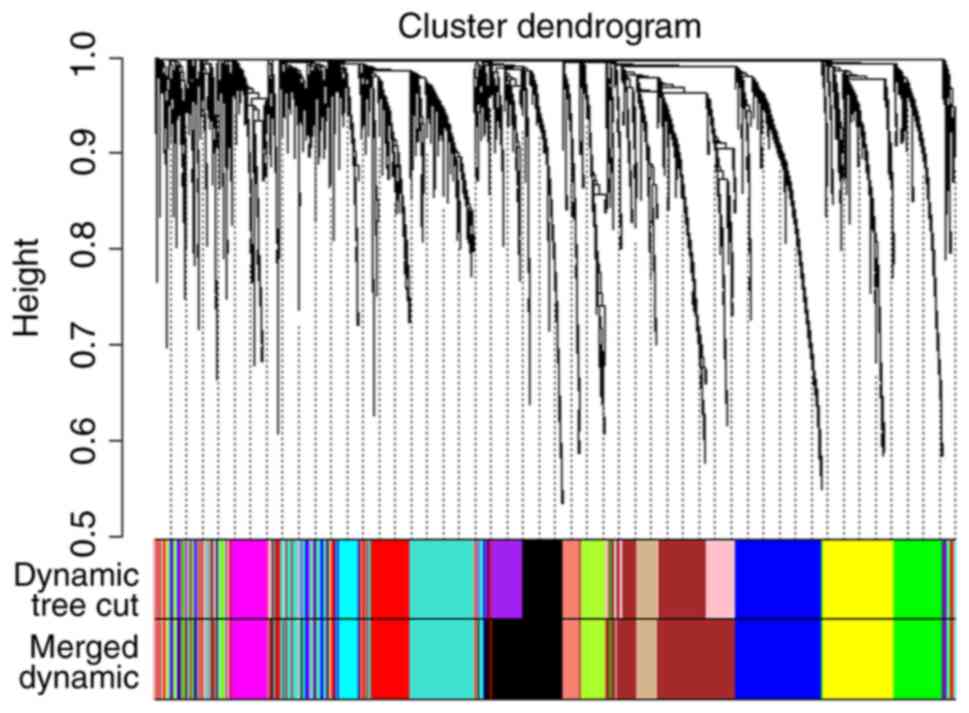
Construction of weighted gene
co-expression modules
To explain the association between the 2,921
overlapping DEGs, WGCNA, a systems biology method, was used to
screen potential biomarkers and therapeutic targets via gene
co-expression network construction. DEGs involved in similar
pathways or with the same biological function tended to have the
same expression cluster. As demonstrated in Fig. 2 and Table III, a total of 11 co-expressed
modules were identified with a power cutoff of 14 and a module size
cutoff ≤30. Therefore, the grey colored clusters represent the
non-clustering genes in WGCNA. As six colored DEG modules,
specifically black, blue, magenta, red, turquoise and yellow, were
more numerous compared with the other color module genes, these key
modules were selected for further analysis.
| Table III.Gene co-expression module sizes. |
Table III.
Gene co-expression module sizes.
| Module color | Number of
genes |
|---|
| Black | 320 |
| Blue | 380 |
| Brown | 152 |
| Cyan | 80 |
| Green | 204 |
| Green yellow | 111 |
| Grey | 106 |
| Magenta | 464 |
| Red | 292 |
| Salmon | 84 |
| Turquoise | 424 |
| Yellow | 274 |
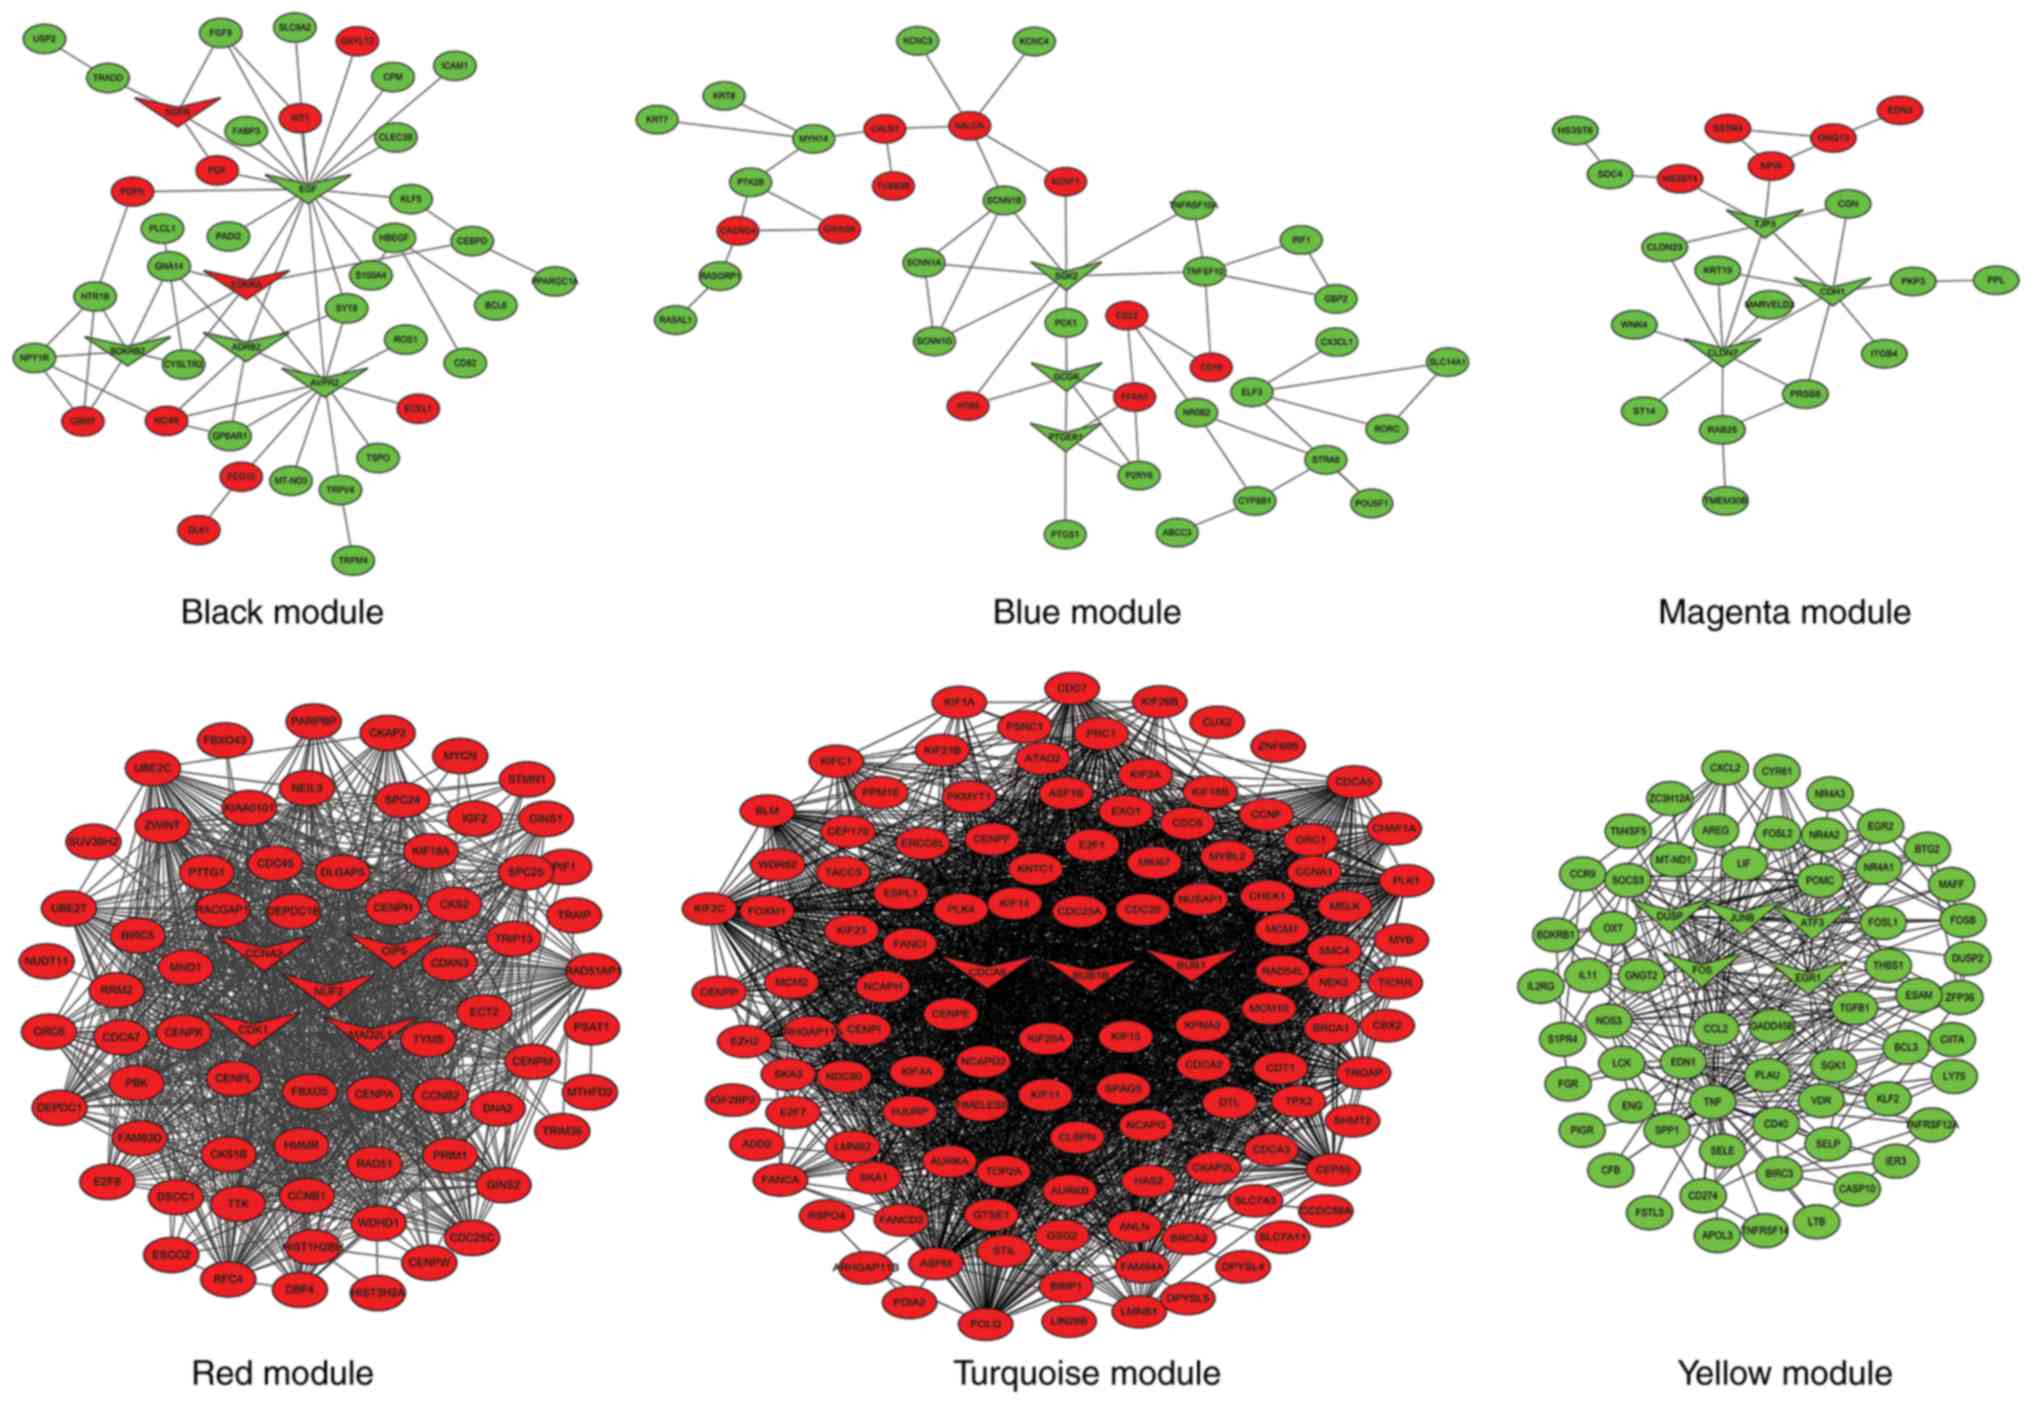
PPI network and functional annotation
for the modules
To better understand the associations between DEGs
in the six different color modules, a PPI network was constructed
using Cytoscape software (Fig. 3).
The black module had 42 nodes and 58 interactions. There were 11
upregulated and 31 downregulated DEGs in this module. In total, six
hub genes were identified in the center of the PPI network
identified by the Cytohubb plugin, including epidermal growth
factor (EGF), arginine vasopressin receptor 2, adrenoceptor β2,
bradykinin receptor B2, endothelin receptor type A (ENDRA) and
nerve growth factor receptor (NGFR). In addition, the KOBAS online
tool was used to predict possible enrichment pathways (Table IV). There were 21 pathways
enriched in this module, including ‘calcium signaling pathway’,
‘cGMP-PKG signaling pathway’ and ‘pathways in cancer’.
| Table IV.KEGG pathways of weighted gene
co-expression network analysis modules. |
Table IV.
KEGG pathways of weighted gene
co-expression network analysis modules.
| Module name | KEGG pathways | Input number | P-value |
|---|
| Black module |
hsa04080:Neuroactive ligand-receptor
interaction | 13 |
1.02×10⁻⁸ |
|
| hsa01100:Metabolic
pathways | 21 |
3.37×10⁻⁷ |
|
| hsa04020:Calcium
signaling pathway | 8 |
7.78×10⁻⁶ |
|
| hsa04810:Regulation
of actin cytoskeleton | 7 |
1.05×10⁻⁵ |
|
| hsa00830:Renin
secretion | 4 |
2.61×10⁻⁵ |
|
|
hsa05202:Transcriptional misregulation in
cancer | 6 |
2.84×10⁻⁵ |
|
| hsa04110:Cell
cycle | 5 |
7.34×10⁻⁵ |
|
| hsa04151:PI3K-Akt
signaling pathway | 8 |
1.23×10⁻⁴ |
|
| hsa05200:Pathways
in cancer | 8 |
2.45×10⁻⁴ |
|
| hsa04014:Ras
signaling pathway | 5 |
5.83×10⁻⁴ |
|
| hsa04022:cGMP-PKG
signaling pathway | 6 |
6.04×10⁻⁴ |
|
| hsa04024:cAMP
signaling pathway | 5 |
6.50×10⁻⁴ |
|
| hsa04010:MAPK
signaling pathway | 6 |
7.21×10⁻⁴ |
|
| hsa05219:Bladder
cancer | 4 |
7.37×10⁻⁴ |
|
|
hsa05218:Melanoma | 4 |
7.59×10⁻⁴ |
|
| hsa04068:FoxO
signaling pathway | 3 |
7.66×10⁻⁴ |
|
| hsa04510:Focal
adhesion | 5 |
8.40×10⁻³ |
|
| hsa04923:Regulation
of lipolysis in adipocytes | 4 |
4.38×10⁻³ |
|
| hsa05160:Hepatitis
C | 4 |
1.20×10⁻² |
|
|
hsa04072:Phospholipase D signaling
pathway | 3 |
3.34×10⁻² |
|
|
hsa04144:Endocytosis | 4 |
4.93×10⁻² |
| Blue module | hsa01100:Metabolic
pathways | 15 |
3.10×10⁻³ |
|
| hsa04020:Calcium
signaling pathway | 5 |
3.17×10⁻³ |
|
|
hsa04080:Neuroactive ligand-receptor
interaction | 6 |
4.24×10⁻³ |
|
|
hsa04060:Cytokine-cytokine receptor
interaction | 8 |
3.67×10⁻² |
|
|
hsa04080:Neuroactive ligand-receptor
interaction | 6 |
3.69×10⁻² |
|
| hsa04068:FoxO
signaling pathway | 3 |
4.02×10⁻² |
|
| hsa04922:Glucagon
signaling pathway | 3 |
4.53×10⁻² |
| Magenta module | hsa04530:Tight
junction | 6 |
3.27×10⁻⁶ |
|
| hsa04514:Cell
adhesion molecule | 4 |
8.15×10⁻⁴ |
|
| hsa05219:Bladder
cancer | 3 |
6.33×10⁻³ |
|
| hsa04390:Hippo
signaling pathway | 3 |
9.48×10⁻³ |
|
|
hsa05218:Melanoma | 2 |
9.51×10⁻³ |
|
| hsa05100:Bacterial
invasion of epithelial cells | 3 |
1.75×10⁻² |
|
| hsa05200:Pathways
in cancer | 4 |
1.88×10⁻² |
|
| hsa04670:Leukocyte
transendothelial migration | 3 |
2.07×10⁻² |
| Red module | hsa04110:Cell
cycle | 11 |
3.77×10⁻¹¹ |
|
| hsa04114:Oocyte
meiosis | 10 |
6.60×10⁻¹° |
|
|
hsa04914:Progesterone-mediated oocyte
maturation | 7 |
5.89×10⁻⁷ |
|
| hsa04115:p53
signaling pathway | 4 |
3.63×10⁻⁴ |
|
| hsa05200:Pathways
in cancer | 6 |
7.66×10⁻⁴ |
|
| hsa01100:Metabolic
pathways | 12 |
2.08×10⁻³ |
|
| hsa04152:AMPK
signaling pathway | 3 |
4.54×10⁻³ |
|
| hsa05166:HTLV-I
infection | 4 |
7.30×10⁻³ |
|
|
hsa04060:Cytokine-cytokine receptor
interaction | 4 |
1.10×10⁻² |
|
|
hsa04080:Neuroactive ligand-receptor
interaction | 4 |
1.33×10⁻² |
|
| hsa00982:Drug
metabolism-cytochrome P450 | 2 |
1.36×10⁻² |
|
| hsa00980:Metabolism
of xenobiotics by cytochrome P450 | 2 |
2.13×10⁻² |
|
| hsa01524:Platinum
drug resistance | 2 |
2.13×10⁻² |
|
|
hsa01230:Biosynthesis of amino acids | 2 |
3.38×10⁻² |
|
| hsa00430:Taurine
and hypotaurine metabolism | 2 |
4.54×10⁻² |
|
| hsa05203:Viral
carcinogenesis | 3 |
4.83×10⁻² |
| Turquoise
module | hsa04110:Cell
cycle | 17 |
3.25×10⁻¹⁵ |
|
| hsa05166:HTLV-I
infection | 12 |
4.94×10⁻⁶ |
|
| hsa04114:Oocyte
meiosis | 8 |
5.99×10⁻⁶ |
|
| hsa05200:Pathways
in cancer | 13 |
2.23×10⁻⁵ |
|
|
hsa05202:Transcriptional misregulation in
cancer | 8 |
2.94×10⁻⁵ |
|
|
hsa04914:Progesterone-mediated oocyte
maturation | 6 |
8.26×10⁻⁴ |
|
|
hsa01040:Biosynthesis of unsaturated fatty
acids | 3 |
1.36×10⁻² |
|
| hsa01212:Fatty acid
metabolism | 3 |
4.05×10⁻² |
| Yellow module | hsa04668:TNF
signaling pathway | 12 |
4.98×10⁻¹³ |
|
| hsa04380:Osteoclast
differentiation | 9 |
2.27×10⁻¹⁰ |
|
| hsa05166:HTLV-I
infection | 11 |
2.03×10⁻⁸ |
|
| hsa05323:Rheumatoid
arthritis | 7 |
5.60×10⁻⁸ |
|
| hsa04933:AGE-RAGE
signaling pathway in diabetic complications | 7 |
3.68×10⁻⁷ |
|
| hsa04010:MAPK
signaling pathway | 7 |
7.13×10⁻⁷ |
|
|
hsa04210:Apoptosis | 5 |
2.20×10⁻⁴ |
|
| hsa05161:Hepatitis
B | 5 |
5.67×10⁻⁴ |
|
| hsa05142:Chagas
disease (American trypanosomiasis) | 4 |
6.82×10⁻⁴ |
|
| hsa04620:Toll-like
receptor signaling pathway | 4 |
1.58×10⁻³ |
|
| hsa05168:Herpes
simplex infection | 5 |
1.69×10⁻³ |
|
| hsa01100:Metabolic
pathways | 14 |
1.93×10⁻² |
|
| hsa04510:Focal
adhesion | 5 |
4.47×10⁻² |
In the blue module, there were 40 nodes and 53
interactions. There were fewer upregulated genes than downregulated
genes; 10 and 30, respectively. In total, three key dysregulated
mRNAs, including glucagon receptor, prostaglandin E receptor 1 and
SGK2, serine/threonine kinase 2, were identified as hub genes.
There were seven enriched KEGG pathways in this module, which
included ‘neuroactive ligand-receptor interaction’, ‘calcium
signaling pathway’, ‘foxO signaling pathway’ and ‘glucagon
signaling pathway’.
The magenta module had 22 nodes and 28 interactions.
The number of upregulated genes was lower compared with the
downregulated genes (five upregulated genes; 17 downregulated
genes). Cadherin 1, claudin 7 and tight junction protein 3 were
identified as hub genes. In total, eight enriched KEGG pathways
were identified, which included ‘cell adhesion molecule’,
‘melanoma’ and ‘hippo signaling pathway’.
The red module had 70 nodes and 658 interactions.
All the DEGs were upregulated in this module. Five hub genes were
identified by the Cytohubb plugin, including mitotic arrest
deficient 2 like 1, cyclin A2, cyclin dependent kinase 1 (CDK1),
opa-interacting protein 5 (OIP5) and NUF2, NDC80 kinetochore
complex component (NUF2). A total of 16 pathways were enriched in
the red modules, including ‘progesterone-mediated oocyte
maturation’, ‘HTLV-I infection’ and ‘viral carcinogenesis’, among
others.
In the turquoise module, there were 116 nodes and
532 interactions. All the DEGs were upregulated in this module.
Only three hub genes were identified, including BUB1 mitotic
checkpoint serine/threonine kinase (BUB1) B, BUB1 and cell division
cycle associated 8 (CDCA8). There were a total of eight pathways
enriched in the turquoise module, including ‘cell cycle’, ‘oocyte
meiosis’ and ‘progesterone-mediated oocyte maturation’, among
others.
In the yellow module, there were 65 nodes and 293
interactions. All the DEGs were downregulated in this module. Five
hub genes were identified, including FOS proto-oncogene, AP-1
transcription factor subunit, early growth response 1, activating
transcription factor 3, dual specificity phosphatases and JunB
proto-oncogene, AP-1 transcription factor subunit. A total of 13
pathways were identified, including ‘TNF signaling pathway’, ‘MAPK
signaling pathway’ and ‘Toll-like receptor signaling pathway’,
among others.
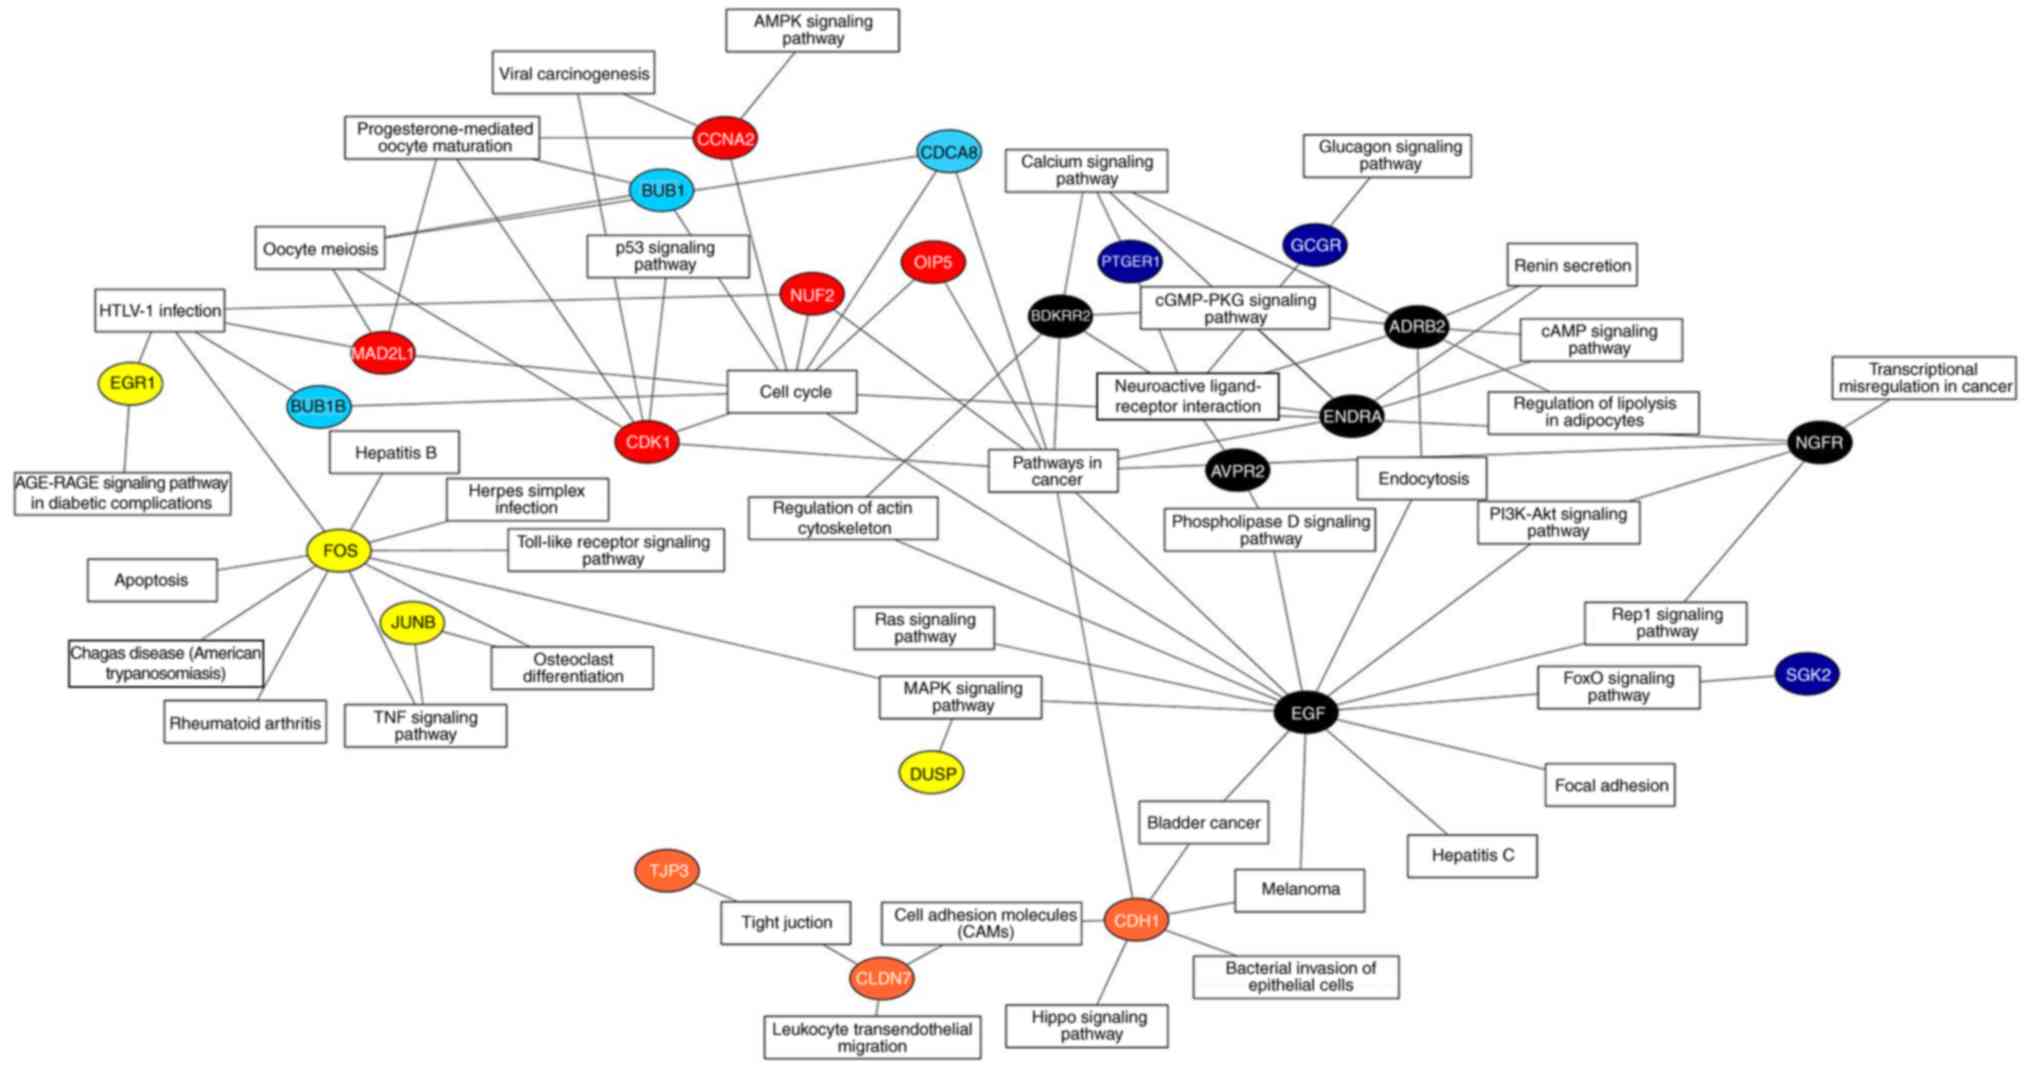
Co-expression network of the hub
DEG-mediated pathways
According to KOBAS annotation, a co-expression
network was constructed to exhibit the enrichment pathways and
biological processes that may be activated by 25 hub DEGs (Fig. 4). Among these key DEGs, it was
identified that seven had more interactions enriched in ‘cell
cycle’ and ‘pathways in cancer’ compared with other regulators,
including EGF, CDK1, ENDRA, NGFR, OIP5, NUF2 and CDCA8. These genes
may represent key regulators associated with the progression of
high-risk WT.
Survival analysis of hub DEGs
The mRNAseq data and clinical information of all
high-risk WT samples were combined for Kaplan-Meier univariate
survival analysis. The seven most crucial hub genes were subjected
to survival analysis. As a result, the high expression levels of
three DEGs, including EGF, ENDRA and NGFR, were associated with a
longer overall survival time compared with the low gene expression
(P<0.05). On the contrary, four overexpressed DEGs (CDK1, OIP5,
NUF2 and CDCA8) demonstrated that they were all associated with
poor prognosis in patient overall survival (P<0.05). All
survival analyses are plotted in Fig.
5.
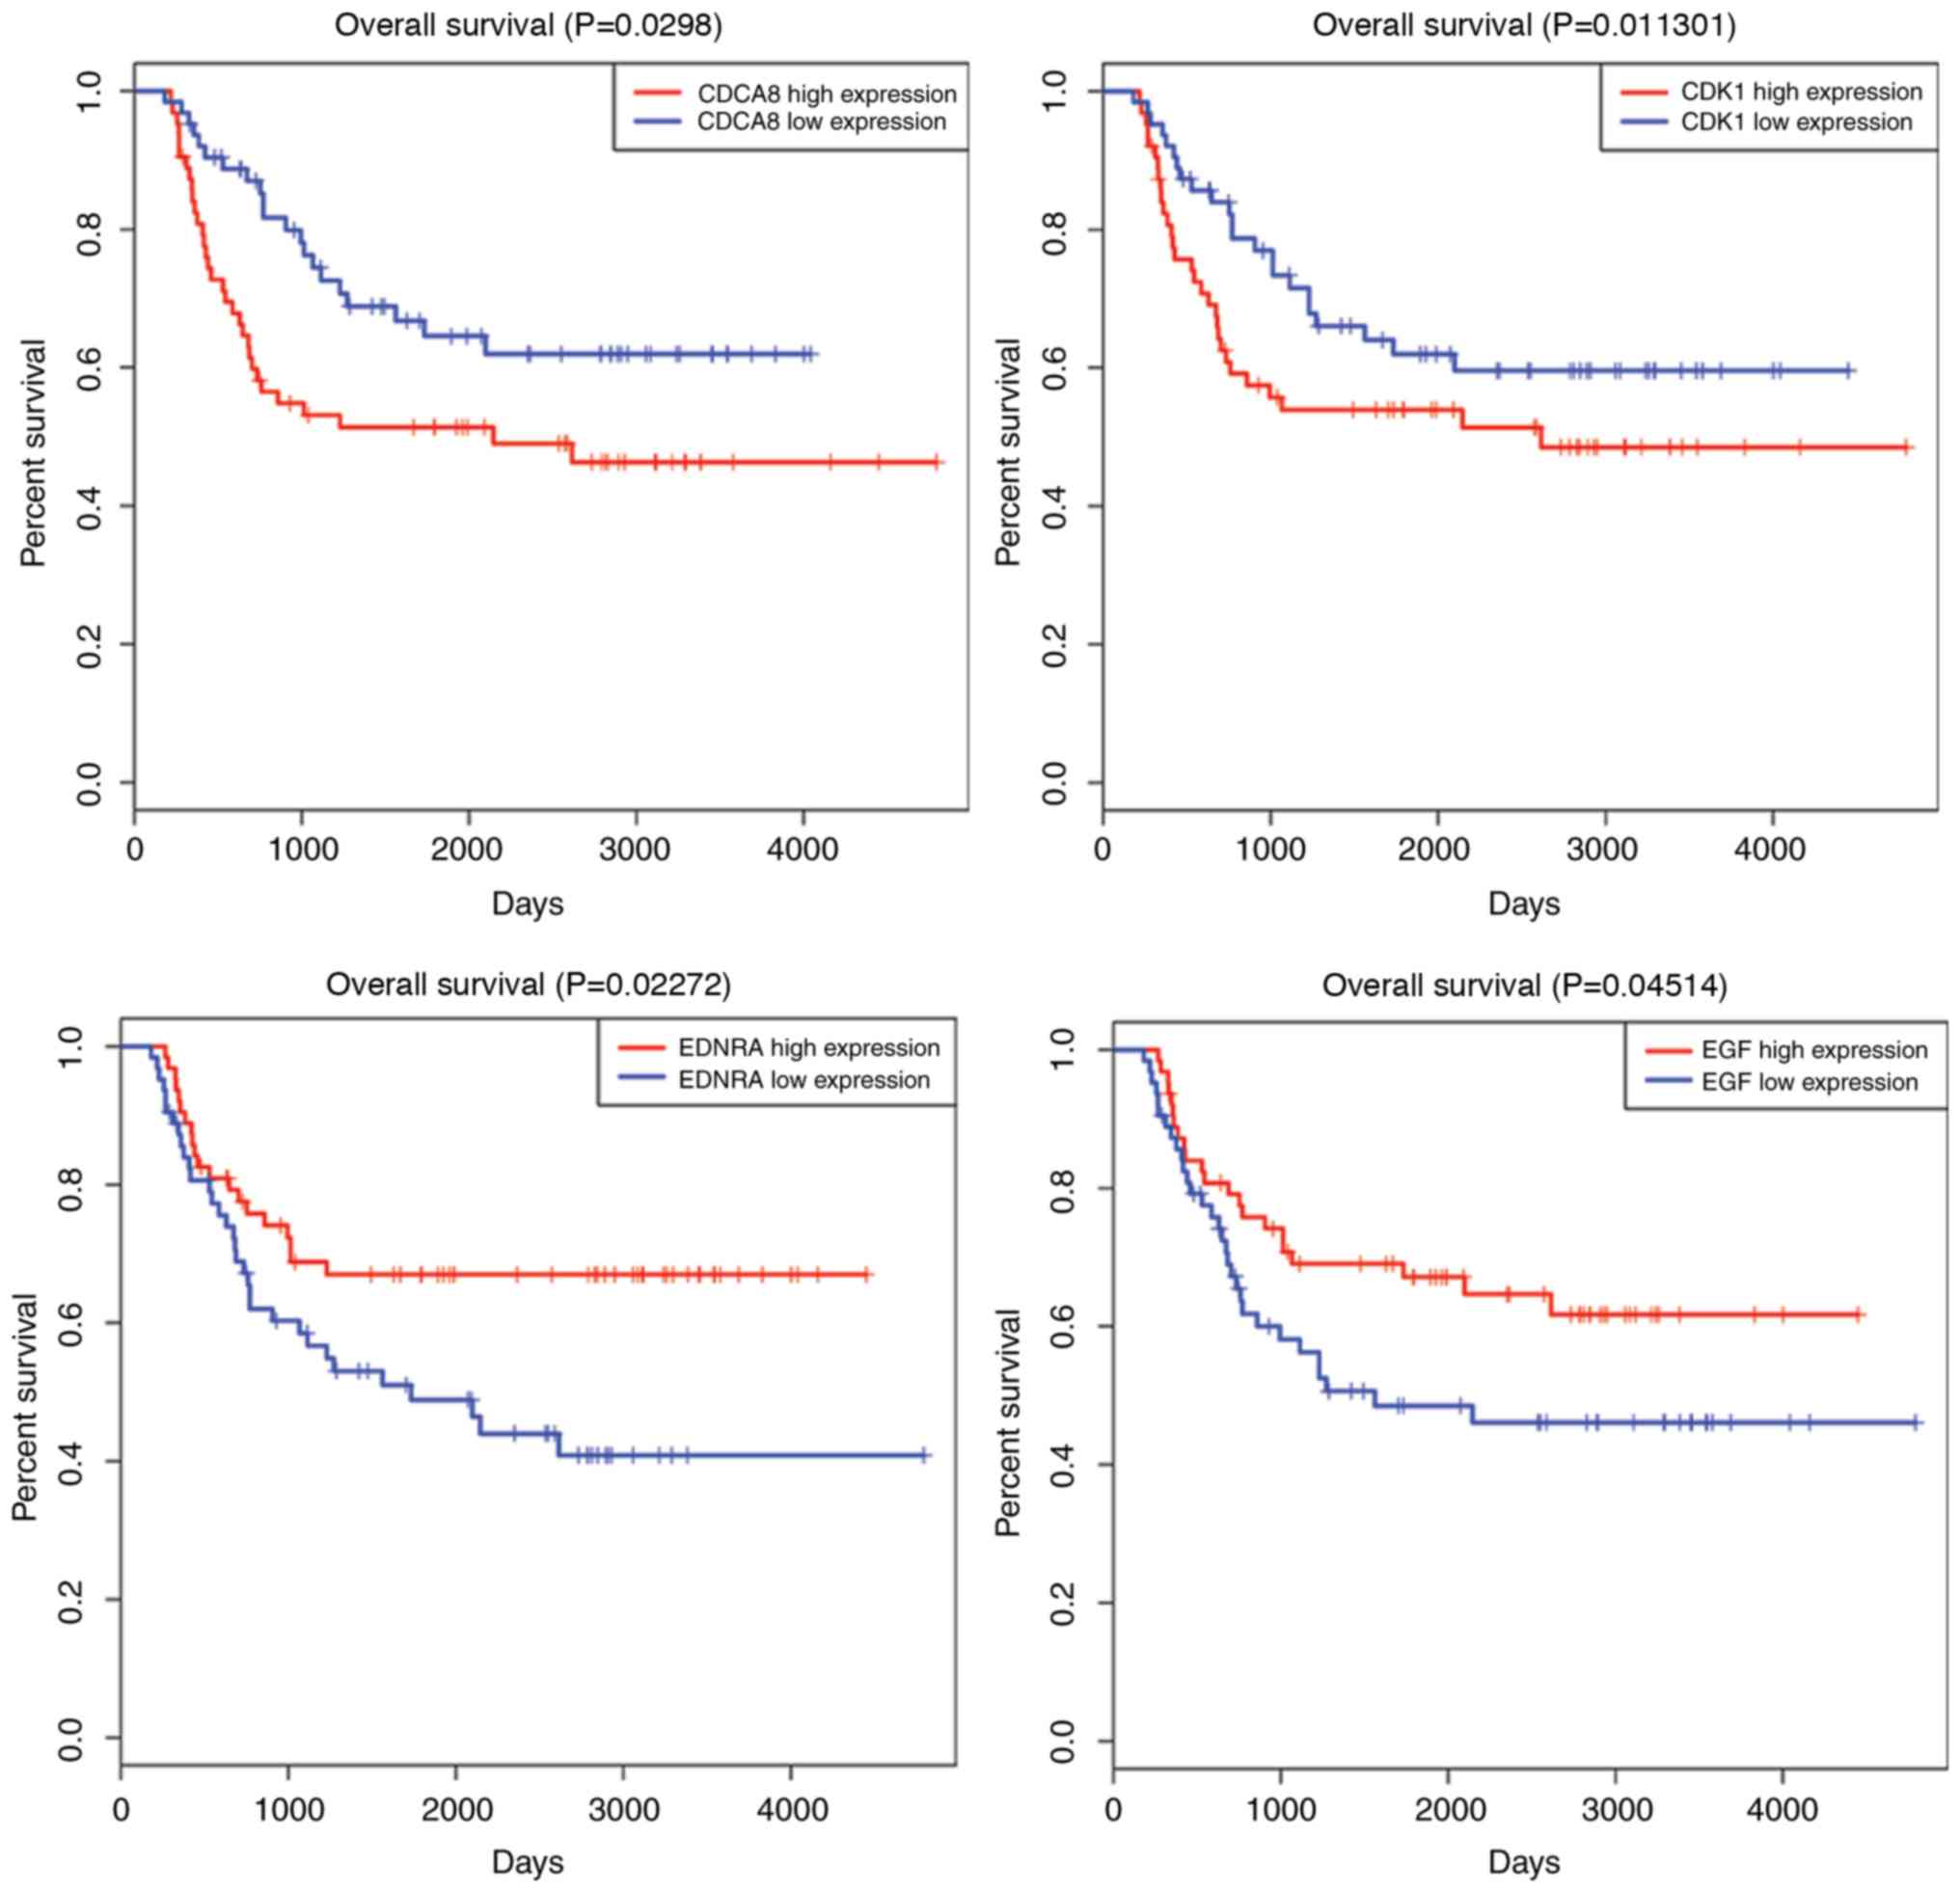 | Figure 5.Survival curve analysis of hub DEGs
for the overall survival in patients with high-risk Wilms tumor. In
total, seven hub DEGs (CDK1, OIP5, NUF2, CDCA8, EGF, ENDRA and
NGFR) are presented (P<0.05). DEGs, differentially expressed
genes; CDK1, cyclin dependent kinase 1; OIP5, opa-interacting
protein 5; NUF2, NUF2, NDC80 kinetochore complex component; CDCA8,
cell division cycle associated 8; EGF, epidermal growth factor;
ENDRA, endothelin receptor type A; NGFR, nerve growth factor
receptor. |
Discussion
WT is the most common genitourinary malignant tumor
in children (1). High-risk WT,
called anaplastic WT, and infants and children with rhabdoid tumor,
were studied to determine why they have a much poorer prognosis.
Even though numerous efforts have been made to investigate the key
regulatory genes or molecules in malignant neoplasms, few studies
have been able to predict the prognosis for high-risk WT, and no
reliable biomarkers for the improvement of therapeutic
decision-making have been identified.
In the present study, 2,921 overlapping DEGs, using
the DESeq and edgR algorithms, were identified in gene expression
profiling analysis. Furthermore, WGCNA was used to construct a
free-scale gene co-expression network to investigate the
associations between different sets of DEGs. To clarify the
different clusters of WGCNA, PPI networks were built with Cytoscape
software and the hub genes were identified by the Cytohubb plugin.
Finally, using clinical information, it was identified that seven
hub genes, including EGF, CDK1, ENDRA, NGFR, OIP5, NUF2 and CDCA8,
may be potential biomarkers for prognosis prediction of patients
with high-risk WT.
EGF is a member of the epidermal growth factor
superfamily (25). The protein
encoded by EGF acts as a potent mitogenic factor that serves a
critical role in the proliferation, growth and differentiation of
various cell types. Lanuti et al (26) identified that EGF is associated
with patients with high-risk esophageal adenocarcinoma. Tanabe
et al (27) identified that
modulation of EGF gene expression levels is directly associated
with the risk of developing hepatocellular carcinoma following
liver cirrhosis. However, considering the survival analysis in the
present study, it is noteworthy that the overexpression of EGF was
demonstrated to be associated with better survival compared with a
lower mean expression level in high-risk WT. In addition, KEGG
pathway annotation demonstrated that EGF was associated with
biological process and molecular function pathways, including ‘Rep1
signaling pathway’, ‘pathways in cancer’, and ‘PI3K-Akt signaling
pathway’, which suggests that EGF may be the key regulator in the
progression of WT to high-risk WT.
CDK1 is a member of the Ser/Thr protein kinase
family, which serves a critical role in the G1/S and
G2/M phase transitions of the eukaryotic cell cycle
(28). In the present results, it
was also identified that CDK1 is associated with significant
cancer-associated pathways, including ‘oocyte meiosis’, ‘p53
signaling pathway’ and ‘viral carcinogenesis’. In addition,
survival analysis demonstrated that high CDK1 expression decreased
patient survival time. Although CDK1 was determined to be a
prognostic predictor of high-risk WT, further research is required
to verify this result.
ENDRA generally encodes the receptor for
endothelin-1, a peptide that serves a role in potent and
long-lasting vasoconstriction (29). The receptor for ENDRA is associated
with guanine-nucleotide-binding proteins (30). In the present study, it was
additionally identified that the ENDRA may activate specific
pathways (‘cGMP-PKG signaling pathway’, ‘cAMP signaling pathway’
and ‘pathways in cancer’) to mediate high-risk WT. Combined with
clinical data, survival analysis demonstrated that higher
expression levels of ENDRA may prolong the overall survival time in
patients with high-risk WT.
NGFR is a transmembrane receptor with intracellular
tyrosine kinase activity (31).
Through KEGG annotation, it was observed that NGF is enriched in
‘transcriptional dysregulation in cancer’, ‘PI3K-Akt signaling
pathway’ and ‘Rap1 signaling pathway’. In 2008, Soland et al
(32) verified that NGFR
overexpression was associated with a pattern of invasion and a poor
prognosis in oral squamous cell carcinoma. However in the present
survival analysis, high NGFR expression was demonstrated to predict
a longer survival time in patients with high-risk WT. Further
investigations are required to confirm the impact of such gene
expression on high-risk WT.
OIP5 is localized as adherent to centromeres
(33). Expression of OIP5 is
upregulated in a number of cancer types, making it a potential
therapeutic target (34–37). Chun et al (37) reported that OIP5 is a highly
expressed therapeutic target in colorectal and gastric carcinomas.
Similarly, Koinuma et al (35) identified OIP5 as a molecular target
in lung and esophageal carcinogenesis due to its biological
functions. In the present study, survival analysis demonstrated
that OIP5 overexpression was negatively associated with high-risk
WT patient overall survival. Therefore, it was suggested that OIP5
may be a potential biomarker of high-risk WT, although the
mechanism of OIP5-induced carcinogenesis should be further
elucidated.
The protein encoded by NUF2 is generally a component
protein that regulates chromosome segregation in the cell cycle
(38). A previous study identified
NUF2 to be associated with the malignant potential of colorectal
cancer (39). In the present
study, it was identified that, for the first time to the best of
the authors' knowledge, NUF2 is associated with the clinical
outcomes of patients with high-risk WT. Survival analysis
demonstrated that NUF2 overexpression was negatively associated
with patient overall survival. This result suggested that NUF2
expression knockdown may suppress the growth and progression of WT
tumor cells. CDCA8 protein may additionally encode a component of
the chromosomal passenger complex, which serves a regulatory role
in mitosis and cell division (40). Additionally, higher expression of
CDCA8 is associated with longer survival compared with lower
expression.
However, the primary limitation of the present study
was that these important DEGs remain to be verified by experiments;
therefore, further analyses are required to determine the
mechanisms underlying the process of malignant progression in
high-risk WT. Future studies may aim to use polymerase chain
reaction assays or western blotting to verify the expression levels
of key genes between tumor and normal samples. Furthermore,
conservative statistical methods with corrections for multiple
testing at each level of analysis were applied; however, the
present study still did not identify a better mathematical model to
combine all eligible hub genes together for predicting the survival
of WT. Therefore, future studies may aim for a better re-evaluation
of the prognostic performance of the model for WT.
In conclusion, based on the gene expression profile
analysis conducted in the present study, using TCGA database,
DEmRNAs between high-risk WT samples and normal samples were
identified. There were 2,921 DEGs identified by comprehensive
bioinformatics analysis. The WGCNA method was used to identify hub
genes involved in high-risk WT development. Specifically, EGF,
CDK1, ENDRA, NGFR, OIP5, NUF2 and CDCA8 may serve a fundamental
role in the development of high-risk WT and are predicted to be
involved in carcinogenesis pathways. These findings may provide
potential biomarkers for further study of WT mechanisms, and may be
efficacious targets for therapeutic intervention or diagnosis in
high-risk WT.
Acknowledgements
The authors gratefully acknowledge The Cancer Genome
Atlas pilot project (established by the National Cancer Institute
and NHGRI), which made available the genomic and clinical WT.
Funding
No funding was received.
Availability of data and materials
The datasets used and/or analyzed during the current
study are available from the corresponding author on reasonable
request.
Authors' contributions
CBX and CGH conceived and designed the study. XFW
performed the bioinformatics analyses and was a major contributor
in writing the manuscript. PS and NJY assisted in the
bioinformatics analysis. CGH and XHZ selected and downloaded the
datasets. All authors read and approved the final manuscript.
Ethics approval and consent to
participate
Not applicable.
Patient consent for publication
Not applicable.
Competing interests
The authors declare that they have no competing
interests.
References
|
1
|
Amirian ES: The role of Hispanic ethnicity
in pediatric Wilms' tumor survival. Pediatr Hematol Oncol.
30:317–327. 2013. View Article : Google Scholar : PubMed/NCBI
|
|
2
|
Perme MP and Jereb B: Trends in survival
after childhood cancer in Slovenia between 1957 and 2007. Pediatr
Hematol Oncol. 26:240–251. 2009. View Article : Google Scholar : PubMed/NCBI
|
|
3
|
Pastore G, Znaor A, Spreafico F, Graf N,
Pritchard-Jones K and Steliarova-Foucher E: Malignant renal tumours
incidence and survival in European children (1978–1997): Report
from the Automated Childhood Cancer Information System project. Eur
J Cancer. 42:2103–2114. 2006. View Article : Google Scholar : PubMed/NCBI
|
|
4
|
Geller JI: Current standards of care and
future directions for ‘high-risk’ pediatric renal tumors:
Anaplastic Wilms tumor and Rhabdoid tumor. Urol Oncol. 34:50–56.
2016. View Article : Google Scholar : PubMed/NCBI
|
|
5
|
National Cancer Institute: Wilms Tumor and
Other Childhood Kidney Tumors Treatment (PDQ®): Patient
version. PDQ Cancer Information Summaries. National Cancer
Institute (US); Bethesda, MD: 2002
|
|
6
|
Yuan N, Zhang G, Bie F, Ma M, Ma Y, Jiang
X, Wang Y and Hao X: Integrative analysis of lncRNAs and miRNAs
with coding RNAs associated with ceRNA crosstalk network in triple
negative breast cancer. OncoTargets and Ther. 10:5883–5897. 2017.
View Article : Google Scholar
|
|
7
|
Baltimore D: Our genome unveiled. Nature.
409:814–816. 2001. View
Article : Google Scholar : PubMed/NCBI
|
|
8
|
Huang C, Yuan N, Wu L, Wang X, Dai J, Song
P, Li F, Xu C and Zhao X: An integrated analysis for long noncoding
RNAs and microRNAs with the mediated competing endogenous RNA
network in papillary renal cell carcinoma. Onco Targets and Ther.
10:4037–4050. 2017. View Article : Google Scholar
|
|
9
|
Huang CG, Li FX, Pan S, Xu CB, Dai JQ and
Zhao XH: Identification of genes associated with
castration-resistant prostate cancer by gene expression profile
analysis. Mol Med Rep. 16:6803–6813. 2017. View Article : Google Scholar : PubMed/NCBI
|
|
10
|
Charlton J, Pavasovic V and
Pritchard-Jones K: Biomarkers to detect Wilms tumors in pediatric
patients: Where are we now? Future Oncol. 11:2221–2234. 2015.
View Article : Google Scholar : PubMed/NCBI
|
|
11
|
Tomczak K, Czerwińska P and Wiznerowicz M:
The cancer genome atlas (TCGA): An immeasurable source of
knowledge. Contemp Oncol (Pozn). 19:A68–A77. 2015.PubMed/NCBI
|
|
12
|
Lee JS: Exploring cancer genomic data from
the cancer genome atlas project. BMB Rep. 49:607–611. 2016.
View Article : Google Scholar : PubMed/NCBI
|
|
13
|
Rao Y, Lee Y, Jarjoura D, Ruppert AS, Liu
CG, Hsu JC and Hagan JP: A comparison of normalization techniques
for microRNA microarray data. Stat Appl Genet Mol Biol.
7:Article222008. View Article : Google Scholar : PubMed/NCBI
|
|
14
|
Robinson MD, McCarthy DJ and Smyth GK:
edgeR: A Bioconductor package for differential expression analysis
of digital gene expression data. Bioinformatics. 26:139–140. 2010.
View Article : Google Scholar : PubMed/NCBI
|
|
15
|
Li D and Dye TD: Power and stability
properties of resampling-based multiple testing procedures with
applications to gene oncology studies. Comput Math Methods Med
2013. 6102972013.
|
|
16
|
Anders S and Huber W: Differential
expression analysis for sequence count data. Genome Biol.
11:R1062010. View Article : Google Scholar : PubMed/NCBI
|
|
17
|
Zhang B and Horvath S: A general framework
for weighted gene co-expression network analysis. Stat Appl Genet
Mol Biol. 4:Article172005. View Article : Google Scholar : PubMed/NCBI
|
|
18
|
Langfelder P and Horvath S: WGCNA: An R
package for weighted correlation network analysis. BMC
Bioinformatics. 9:5592008. View Article : Google Scholar : PubMed/NCBI
|
|
19
|
Langfelder P and Horvath S: Eigengene
networks for studying the relationships between co-expression
modules. BMC Syst Biol. 1:542007. View Article : Google Scholar : PubMed/NCBI
|
|
20
|
Xie C, Mao X, Huang J, Ding Y, Wu J, Dong
S, Kong L, Gao G, Li CY and Wei L: KOBAS 2.0: A web server for
annotation and identification of enriched pathways and diseases.
Nucleic Acids Res. 39:W316–W322. 2011. View Article : Google Scholar : PubMed/NCBI
|
|
21
|
Shannon P, Markiel A, Ozier O, Baliga NS,
Wang JT, Ramage D, Amin N, Schwikowski B and Ideker T: Cytoscape: A
software environment for integrated models of biomolecular
interaction networks. Genome Res. 13:2498–2504. 2003. View Article : Google Scholar : PubMed/NCBI
|
|
22
|
Franceschini A, Szklarczyk D, Frankild S,
Kuhn M, Simonovic M, Roth A, Lin J, Minguez P, Bork P, von Mering C
and Jensen LJ: STRING v9.1: Protein-protein interaction networks,
with increased coverage and integration. Nucleic Acids Res.
41:(Database Issue). D808–D815. 2013. View Article : Google Scholar : PubMed/NCBI
|
|
23
|
Chin CH, Chen SH, Wu HH, Ho CW, Ko MT and
Lin CY: cytoHubba: Identifying hub objects and sub-networks from
complex interactome. BMC Syst Biol. 8 Suppl 4:S112014. View Article : Google Scholar : PubMed/NCBI
|
|
24
|
Goeman JJ, Oosting J, Cleton-Jansen AM,
Anninga JK and van Houwelingen HC: Testing association of a pathway
with survival using gene expression data. Bioinformatics.
21:1950–1957. 2005. View Article : Google Scholar : PubMed/NCBI
|
|
25
|
Jensen CH, Krogh TN, Støving RK, Holmskov
U and Teisner B: Fetal antigen 1 (FA1), a circulating member of the
epidermal growth factor (EGF) superfamily: ELISA development,
physiology and metabolism in relation to renal function. Clin Chim
Acta. 268:1–20. 1997. View Article : Google Scholar : PubMed/NCBI
|
|
26
|
Lanuti M, Liu G, Goodwin JM, Zhai R, Fuchs
BC, Asomaning K, Su L, Nishioka NS, Tanabe KK and Christiani DC: A
functional epidermal growth factor (EGF) polymorphism, EGF serum
levels, and esophageal adenocarcinoma risk and outcome. Clin Cancer
Res. 14:3216–3222. 2008. View Article : Google Scholar : PubMed/NCBI
|
|
27
|
Tanabe KK, Lemoine A, Finkelstein DM,
Kawasaki H, Fujii T, Chung RT, Lauwers GY, Kulu Y, Muzikansky A,
Kuruppu D, et al: Epidermal growth factor gene functional
polymorphism and the risk of hepatocellular carcinoma in patients
with cirrhosis. JAMA. 299:53–60. 2008. View Article : Google Scholar : PubMed/NCBI
|
|
28
|
Marteil G, Gagne JP, Borsuk E,
Richard-Parpaillon L, Poirier GG and Kubiak JZ: Proteomics reveals
a switch in CDK1-associated proteins upon M-phase exit during the
Xenopus laevis oocyte to embryo transition. Int J Biochem Cell
Biol. 44:53–64. 2012. View Article : Google Scholar : PubMed/NCBI
|
|
29
|
Russignan A, Spina C, Tamassia N, Cassaro
A, Rigo A, Bagnato A, Rosanò L, Bonalumi A, Gottardi M, Zanatta L,
et al: Endothelin-1 receptor blockade as new possible therapeutic
approach in multiple myeloma. Br J Haematol. 178:781–793. 2017.
View Article : Google Scholar : PubMed/NCBI
|
|
30
|
Zhu J, Cui L, Wang W, Hang XY, Xu AX, Yang
SX, Dou JT, Mu YM, Zhang X and Gao JP: Whole exome sequencing
identifies mutation of ENDRA involved in ACTH-independent
macronodular adrenal hyperplasia. Fam Cancer. 12:657–667. 2013.
View Article : Google Scholar : PubMed/NCBI
|
|
31
|
Canossa M, Twiss JL, Verity AN and Shooter
EM: p75(NGFR) and TrkA receptors collaborate to rapidly activate a
p75(NGFR)-associated protein kinase. EMBO J. 15:3369–3376. 1996.
View Article : Google Scholar : PubMed/NCBI
|
|
32
|
Soland TM, Brusevold IJ, Koppang HS,
Schenck K and Bryne M: Nerve growth factor receptor (p75 NTR) and
pattern of invasion predict poor prognosis in oral squamous cell
carcinoma. Histopathology. 53:62–72. 2008. View Article : Google Scholar : PubMed/NCBI
|
|
33
|
Williams JM, Chen GC, Zhu L and Rest RF:
Using the yeast two-hybrid system to identify human epithelial cell
proteins that bind gonococcal Opa proteins: Intracellular gonococci
bind pyruvate kinase via their Opa proteins and require host
pyruvate for growth. Mol Microbiol. 27:171–186. 1998. View Article : Google Scholar : PubMed/NCBI
|
|
34
|
Li H, Zhang J, Lee MJ, Yu GR, Han X and
Kim DG: OIP5, a target of miR-15b-5p, regulates hepatocellular
carcinoma growth and metastasis through the AKT/mTORC1 and
β-catenin signaling pathways. Oncotarget. 8:18129–18144.
2017.PubMed/NCBI
|
|
35
|
Koinuma J, Akiyama H, Fujita M, Hosokawa
M, Tsuchiya E, Kondo S, Nakamura Y and Daigo Y: Characterization of
an Opa interacting protein 5 involved in lung and esophageal
carcinogenesis. Cancer Sci. 103:577–586. 2012. View Article : Google Scholar : PubMed/NCBI
|
|
36
|
Li HC, Chen YF, Feng W, Cai H, Mei Y,
Jiang YM, Chen T, Xu K and Feng DX: Loss of the Opa interacting
protein 5 inhibits breast cancer proliferation through
miR-139-5p/NOTCH1 pathway. Gene. 603:1–8. 2017. View Article : Google Scholar : PubMed/NCBI
|
|
37
|
Chun HK, Chung KS, Kim HC, Kang JE, Kang
MA, Kim JT, Choi EH, Jung KE, Kim MH, Song EY, et al: OIP5 is a
highly expressed potential therapeutic target for colorectal and
gastric cancers. BMB Rep. 43:349–354. 2010. View Article : Google Scholar : PubMed/NCBI
|
|
38
|
Wigge PA and Kilmartin JV: The Ndc80p
complex from Saccharomyces cerevisiae contains conserved centromere
components and has a function in chromosome segregation. J Cell
Biol. 152:349–360. 2001. View Article : Google Scholar : PubMed/NCBI
|
|
39
|
Kobayashi Y, Takano A, Miyagi Y, Tsuchiya
E, Sonoda H, Shimizu T, Okabe H, Tani T, Fujiyama Y and Daigo Y:
Cell division cycle-associated protein 1 overexpression is
essential for the malignant potential of colorectal cancers. Int J
Oncol. 44:69–77. 2014. View Article : Google Scholar : PubMed/NCBI
|
|
40
|
Dai C, Miao CX, Xu XM, Liu LJ, Gu YF, Zhou
D, Chen LS, Lin G and Lu GX: Transcriptional activation of human
CDCA8 gene regulated by transcription factor NF-Y in embryonic stem
cells and cancer cells. J Biol Chem. 290:22423–22434. 2015.
View Article : Google Scholar : PubMed/NCBI
|