Introduction
Hereditary spherocytosis (HS) is an inherited
hemolytic anemia that emerges as a result of a defect in
erythrocyte membrane proteins, and is characterized by spherocytes
in the peripheral blood (1).
Clinically, HS is characterized by anemia, jaundice and
splenomegaly to various degrees. Common complications are
cholelithiasis, hemolytic episodes and aplastic crisis (2). HS has been documented across all
races and ethnic groups. The prevalence is 1:5,000 in Northern
European countries (3). Autosomal
dominant inheritance is observed in 80% of patients and autosomal
recessive in the remainder. Homozygote dominant HS is nearly
lethal. De novo mutations of erythrocyte membrane protein
genes (ankyrin, β-spectrin or band 3 genes) are prevalent in HS
(4). Autosomal recessive
inheritance is associated with mutations of the α-spectrin or
protein 4.2 genes (4–6).
Erythrocyte membrane proteins are divided into two
groups: Peripheral proteins and integral (transmembrane) proteins.
Spectrin accounts for 50% of the peripheral proteins. Spectrin
tetramers anchor to protein 4.1 and actin via their tails, and
combine with band 3, which moves to the outer surface of the lipid
layer by anchoring to Ankyrin (4).
In addition, band 3 regulates water and anion transport in the cell
membrane (5,6). Normal qualitative and quantitative
levels of erythrocyte membrane proteins are important for membrane
stabilization through their connections to the lipid layer
(7,8). Quantitative and qualitative deficits
lead to lipid loss from the erythrocyte surface and to decreases in
erythrocyte surface volume ratio, normal shape, heat and mechanical
stability. The osmotic fragility of the erythrocytes is also
negatively affected, resulting in a shortened life span and
hemolytic anemia (9).
Decreased levels of membrane proteins, which are not
identifiable with electrophoretic analyses, cause abnormal cell
morphology, osmotic fragility and other erythrocyte defects
(8). Quantitative protein
assessments have been performed using matrix-assisted laser
desorption/ionization-time of flight mass spectrometry (MALDI TOF
MS) to identify the membrane protein defects. MALDI is one of the
primary sensitive ionizer methods used as an ion source in mass
spectrometry, and biomolecules, including proteins, are easily be
ionized (10).
Next-generation DNA sequencing (NGS) technology
facilitates access to substantial and unique information about
genetic/epigenetic regulatory networks, chromatin structure,
nuclear organization and genome variations, none of which are
provided by other experimental methods. Ultra-speed sequencing is
achievable through genome transcription and DNA-protein
interactions analyses with highly accurate results (11).
The present study aimed to analyze the genetic
profile of a patient, a 35 year old woman who had undergone
laparoscopic splenectomy due to severe HS, and her family members.
In order to identify the genetic basis for erythrocyte membrane
protein deficits, MALDI TOF MS and NGS methods were used to
understand the pathophysiological mechanism in HS.
Materials and methods
Ethics and subject information
The Ethics Committee of the Istanbul Faculty of
Medicine, Istanbul University (Istanbul, Turkey) approved the
study, and written informed consent was obtained from all subjects
prior to sample collection. The laboratory characteristics of the
patient with hereditary spherocytosis (E.U) were analyzed via a
blood test performed prior to splenectomy (Table I). The osmotic fragility test is
common in hematology, and is often performed to aid with diagnosis
of diseases associated with RBC membrane abnormalities. The osmotic
fragility test is used to measure the level of hemolysis in a
collected sample of a patient's blood which is compared to a
control sample. For an osmotic fragility test, blood sample was
usually collected from the right arm from patients. Red blood cells
were lysed in a 0.9% NaCI salt solution. Providing the patient's
red blood cells are more fragile than normal, a positive result is
obtained (12).
 | Table I.Blood test results of the patient with
hereditary spherocytosis. |
Table I.
Blood test results of the patient with
hereditary spherocytosis.
| Parameter | Patient results |
|---|
| Hemoglobin, g/dl | 6.8 |
| Hematocrit, % | 18 |
| Bilirubin, mg/dl | 3.61 |
| Lactate
dehydrogenase, U/l | 323 |
| Leukocyte,
mm3 | 2,300 |
| Platelets,
mm3 | 194,000 |
The HS patient featured in the present study is a 35
year old woman diagnosed a with deep vein thrombosis and cardiac
problem. The healthy control group was composed of 3 female
subjects (34, 35 and 63 years old) and 3 male subjects (28, 34 and
58 years old). DNA samples were also collected from the mother (64
years old), father (66 years old) and son (12 years old) of the
patient. Samples were collected in January 2015 to April 2015.
All clinical investigations were conducted in
accordance with the principles of the Declaration of Helsinki. The
parents gave informed consent for publication of this study. The
study was approved by the research fund of Istanbul University
(project no. 35214; date, 2015).
Preparation of red blood cell
ghost
Red blood cell (RBC) membrane ghosts were prepared
in accordance with the methods of Dodge et al (13). Erythrocytes were isolated by
centrifugation for 20 min at 314 × g at room temperature. The
packed cells were lysed in of cold 5 mM sodium phosphate. RBC
preparations were washed three times in 5 mM sodium phosphate, and
centrifuged at 20,070 × g at 4°C (Heraeus Megafuge 1.0R; Heraeus
Deutschland GmbH & Co., Hanau, Germany). The cells were
hypotonically lysed and washed free of hemoglobin, with the
resulting membrane ghosts consisting solely of the lipid bilayer
and associated proteins.
SDS-PAGE of RBC membrane
Erythrocyte ghosts were separated by SDS-PAGE
(14). The stacking gel was
prepared at room temperature using 4% acrylamide (Sigma-Aldrich;
Merck KGaA, Darmstadt, Germany) Tris-HCl (0.5 M pH 6.8;
Sigma-Aldrich), containing 0.4% SDS, and the separating gel was
prepared at room temperature using 10% acrylamide Tris-HCl buffer
(1.5 M, pH 8.8), containing 0.4% SDS (Sigma-Aldrich). After
spectrophotometric measurements were obtained, each sample (20 µg)
was mixed with the sample buffer to a final concentration of 0.06 M
Tris-HCl pH 6.8, 2% SDS, 5% β-mercaptoethanol, 10% glycerol and
0.025% bromophenol blue. Following electrophoresis, the gels were
fixed for 1 h in a solution of 40% (v/v) aqueous ethanol (99.8%;
Sigma-Aldrich) and 10% (v/v) acetic acid (Merck KGaA) at room
temperature. The gels were then washed for 30 min in fresh fixing
solution and incubated with Coomassie Blue R-250 0.2% diluted in
fixative solution for 2 h at room temperature (Thermo Fisher
Scientific, Inc., Waltham, MA, USA). The gels were destained using
fixative solution for 2 h, followed by incubation in water at room
temperature until complete destaining.
May-Grünwald giemsa staining
A drop of anticoagulated blood was dripped on the
far end of a microscope slide. A second slide was dragged forward
with a quick, smooth movement to produce a 2–3 cm smear. Staining
was performed when the preparations were dry.
The microscope slide was covered with May-Grünwald
stain for 3 min at room temperature. The slide was held from one
end, and the residual stain drained and removed with distilled
water. The slide was placed horizontally and covered with distilled
water. Giemsa stain was dripped on the distilled water (2–3 drops)
and allowed to stand for 8 min, following which the residual stain
was drained and washed with tap water. The preparation was analyzed
under a light microscope when the slide was dry (15).
Scanning electron microscopy
(SEM)
Blood samples were centrifuged at 706 ×g (rotor
diameter, 16 cm) 5 min at room temperature. Erythrocyte samples for
the scanning electron microscopy were fixed for 24 h in 2.5%
glutaraldehyde in 0.1 M phosphate buffer at pH 7.4 at room
temperature. The samples were dehydrated via a gradual increase in
concentrations of ethanol and amile acetate; they were then dried
at critical-point in a Balzers critical point drier using liquid
CO2. The cells were settled on coverslips (Assistent;
Glaswarenfabrik Karl Hecht Kg, Sondheim, Germany) using a Shandon
Cytospin 2 (200 × g 5 min at room temperature; Dako; Agilent
Technologies, Inc., Santa Clara, CA, USA), followed by dehydration
using increasing concentrations of ethanol. Finally, the samples
were sputter coated with 3 nm of gold using the BAL-TEC MED 020
(Leica Microsystems GmbH, Wetzlar, Germany) coating system and
analyzed with a FEI Quanta 450 FEG-EDS (FEI; Thermo Fisher
Scientific, Inc.) scanning transmission electron microscope.
Proteome analysis of erythrocyte
membrane
Ghost materials from the patient and healthy
subjects were frozen with liquid nitrogen and pulverized with a
bead beater (Mixer Mill MM301; Retsch GmbH, Haan, Germany). A
volume of 500 µl of UPX™ universal protein extraction buffer
(Expedeon, Heidelberg, Germany) with 5 µl protease inhibitor
cocktail (Sigma-Aldrich; Merck KGaA) was added to samples and
boiled at 100°C for 5 min, and subsequently centrifuged at 15.366 ×
g for 15 min to remove the debris. The supernatant was transferred
to a clean tube and protein concentration was measured with a
NanoDrop™ spectrophotometer (ND-1000; NanoDrop Technologies; Thermo
Fisher Scientific, Inc., Wilmington, DE, USA) at 280 nm. Tryptic
peptides were generated in accordance with the filter-aided sample
preparation protocol (16).
Peptides were eluted from the spin column, the concentration was
measured with a NanoDrop™spectrometer, adjusted to a concentration
of 100 ng/µl, and 50 fmol internal standards (MassPREP Enolase
Digestion Standard; Waters Corporation, Milford, MA, USA).
Liquid chromatography-mass
spectrometry (LC-MS/MS) analysis and database search
LC-MS/MS analysis and protein identifications were
performed according to a previously published protocol (17). In brief, 500 ng of tryptic peptides
in 5 µl for each experimental condition were analyzed using the
LC-MS/MS system (nanoACQUITY ultra pressure liquid chromatography,
SYNAPT high definition mass spectrometer, NanoLockSpray mass
ionization source; Waters Corporation). Columns were equilibrated
with 97% mobile phase A (0.1% formic acid in LC-MS grade water;
Sigma-Aldrich; Merck KGaA) and the column temperature was set to
45°C. The peptides were separated from the trap column (Symmetry
C18 5 µm, 180 µm i.d. × 20 mm; Waters Corporation) by gradient
elution into an analytical column (BEH C18, 1.7 µm, 75 µm i.d. ×
250 mm; Waters Corporation) at a 300 nl/min flow rate, with a
linear gradient from 5–40% mobile phase B (0.1 formic acid in
hypergrade acetonitrile; Sigma-Aldrich; Merck KGaA) over 90
min.
Data independent acquisition was performed by
operating the instrument at positive ion V mode, applying the MS
and MS/MS functions over 1.5 sec intervals with 6 V low energy and
15–40 V high energy collision. Glu-fibrinopeptide (internal mass
calibrant) was infused every 45 sec at 300 nl/min flow rate. Values
of mass charge ratio (m/z)>50-1,600 were recorded. Tandem mass
data extraction, charge state deconvolution and deisotoping were
conducted using ProteinLynx Global Server v2.5 (Waters
Corporation), and searched with the IdentityE High
Definition Proteomics System (Waters Corporation), using a fragment
ion mass tolerance of 0.025 Da and a parent ion tolerance of 0.0100
Da against the reviewed human protein database from Uniprot
(18). The amino acid sequence of
the internal standard (yeast enolase; Uniprot accession no. P00924)
was included in the FASTA file of the database. The Apex 3D data
preparation parameters were set to 0.2 min chromatographic peak
width, 10.000 MS TOF resolution, 150 counts for low energy
threshold, 50 counts for elevated energy threshold, and 1,200
counts for the intensity threshold. The databank search query was
set to a minimum 3 fragment ion matches per peptide, minimum 7
fragment ion matches per protein, minimum 1 peptide matches per
protein and 1 missed cleavage. Carbamidomethyl-cysteine fixed
modification and Acetyl N-TERM, deamidation of asparagine and
glutamine, and oxidation of methionine variable modifications were
set. Quantification of the protein expression changes were
performed with Progenesis LC-MS software V4.0 (Nonlinear Dynamics;
Waters Corporation). Normalization across the sample set was based
on the total ion signal. Protein quantitation was only performed
with non-conflicting peptide features.
Exome capture/massively parallel
sequencing
DNA was extracted from 1 ml venous blood (MagNA Pure
Compact Nucleic Acid Isolation kit; Roche Applied Science,
Penzberg, Germany). DNA Purity and integrity were checked using a
spectrophotometer (ND-1000, NanoDrop™) and 1% agarose gel
electrophoresis, respectively (19). The quantity of genomic DNA was
measured using a sensitive fluorescence-based kit (Qubit RNA BR
assay kit, Invitrogen; Thermo Fisher Scientific, Inc) and an
integrated instrument (Qubit 2.0 Fluorometer; Invitrogen; Thermo
Fisher Scientific, Inc). Genomic DNA (1,500 ng) was fragmented with
an ultrasonicator (S220; Covaris, Inc., Woburn, MA, USA) following
the manufacturer's instructions for a target peak of 400 bp.
Libraries were prepared using TruSeq DNA Sample Preparation Kit-Set
A (Illumina, Inc., San Diego, CA, USA). Following three subsequent
steps (end repair, A-tailing and adaptor ligation), DNA fragments
(~400–550 bp) were separated with the E-Gel SizeSelect 2% Agarose
system (Invitrogen; Thermo Fisher Scientific, Inc), purified using
MinElute Gel Extraction kit (Qiagen, Inc., Valencia, CA, USA), and
amplified by polymerase chain reaction (PCR), according to the
sample preparation guide. Exonic regions were isolated using TruSeq
Exome Enrichment kit in accordance with manufacturer's guidelines
(Illumina, Inc.). This process includes two hybridization steps
using capture target oligos and streptavidin beads to enrich exonic
regions, and wash steps to eliminate non-specific binding from the
beads. Cluster generation from a DNA template was performed with an
automated system (cBot; Illumina, Inc.) using TruSeq PE Cluster kit
V3 (Illumina, Inc.). Sequencing (multiplexed paired-end) was
performed with HiSeq 2000 (Illumina, Inc.) using TruSeq SBS kit v3
(200 cycles) (Illumina, Inc.). Illumina Real-Time Analysis software
(version 1.13) with standard parameters was used for real-time
image analysis and base calling (Illumina, Inc.). At the end of all
procedures, 104-bp-long paired-end reads were obtained.
Exome sequencing analysis
pipeline
Raw sequencing data were aligned to the human genome
hg19 reference using Burrows-Wheeler Aligner (20) with standard parameters in
paired-end mode. SAMtools (21)
was used to remove the PCR duplicates. BEDtools (22) was used to calculate the coverage of
targeted exome regions. A total of 82% of targeted regions were
covered at least nine times, and the average sequencing depth of
the regions was 24-fold. These values are the mean of all samples.
Genome Analysis Toolkit v1.6 (GATK) was used for local realignment
around indels (23). Indel
Realigner was used, and single nucleotide polymorphisms and small
indels were called using a GATK Unified Genotyper (24). ANNOVAR (25) was used for functional annotation of
variants including gene/exonic region, segmental duplications,
sorting intolerant from tolerant (SIFT), MutationTaster and
Polymorphism Phenotyping (PolyPhen) scores (26).
Statistical analysis
All experiments were conducted at least in
triplicate. Statistical analysis was performed and data are
presented as the mean ± standard deviation. For comparisons of two
normally distributed groups, a Student's t-test was used. P<0.05
was considered to indicate a statistically significant difference.
All statistical analyses were performed using SPSS (version 21; IBM
Corp., Armonk, NY, USA).
Results
Clinical profile of the patient
Splenectomy and cholecystectomy were performed when
the patient had been diagnosed with HS. The results of blood tests
performed post-splenectomy were as follows: Hemoglobin (Hb), 9.2
g/dl; hemotocrit (Hct), 27%; leucocyte, 8,500/mm3;
platelets, 1,300,000/mm3. Hemoglobin A2 was
determined as 3.7% using an LH 780 Hematology analyzer (Beckman
Coulter, Inc., Brea, CA, USA).
May-Grünwald Giemsa staining and SEM
images of the RBCs of the patient
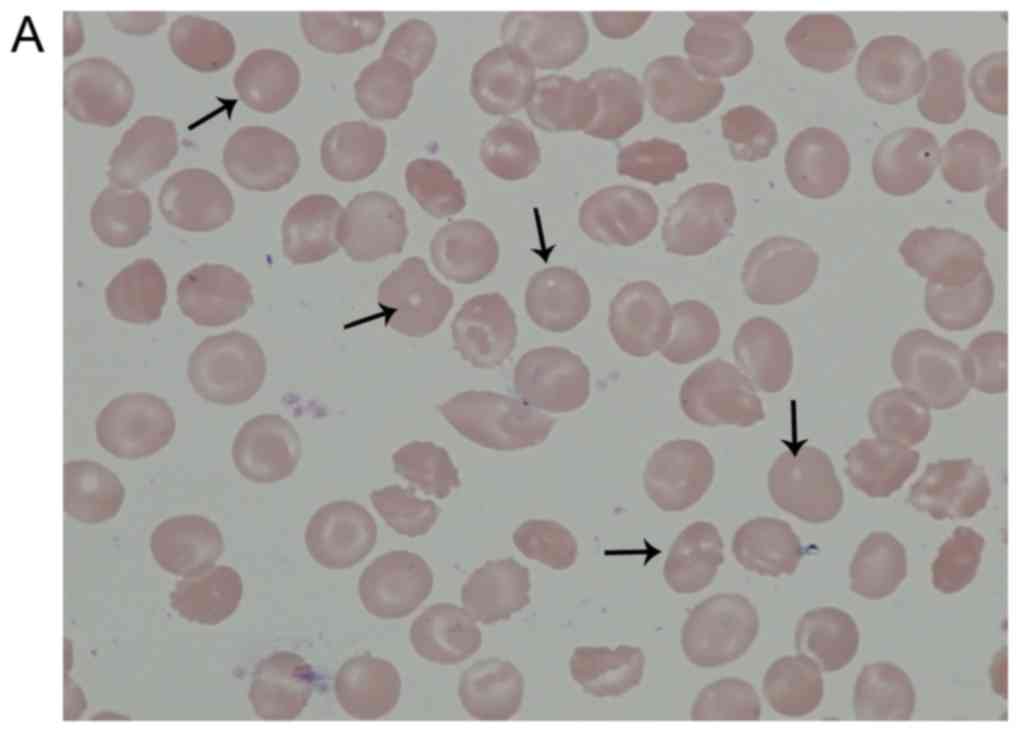
The arrows in Fig.
1A indicate the localization of the pores assumed in the
patient's RBCs following May-Grünwald Giemsa staining. As presented
in Fig. 1B May-Grünwald staining
indicated the localization of healthy RBCs following Giemsa
staining. There was no porous structure in healthy RBCs. These
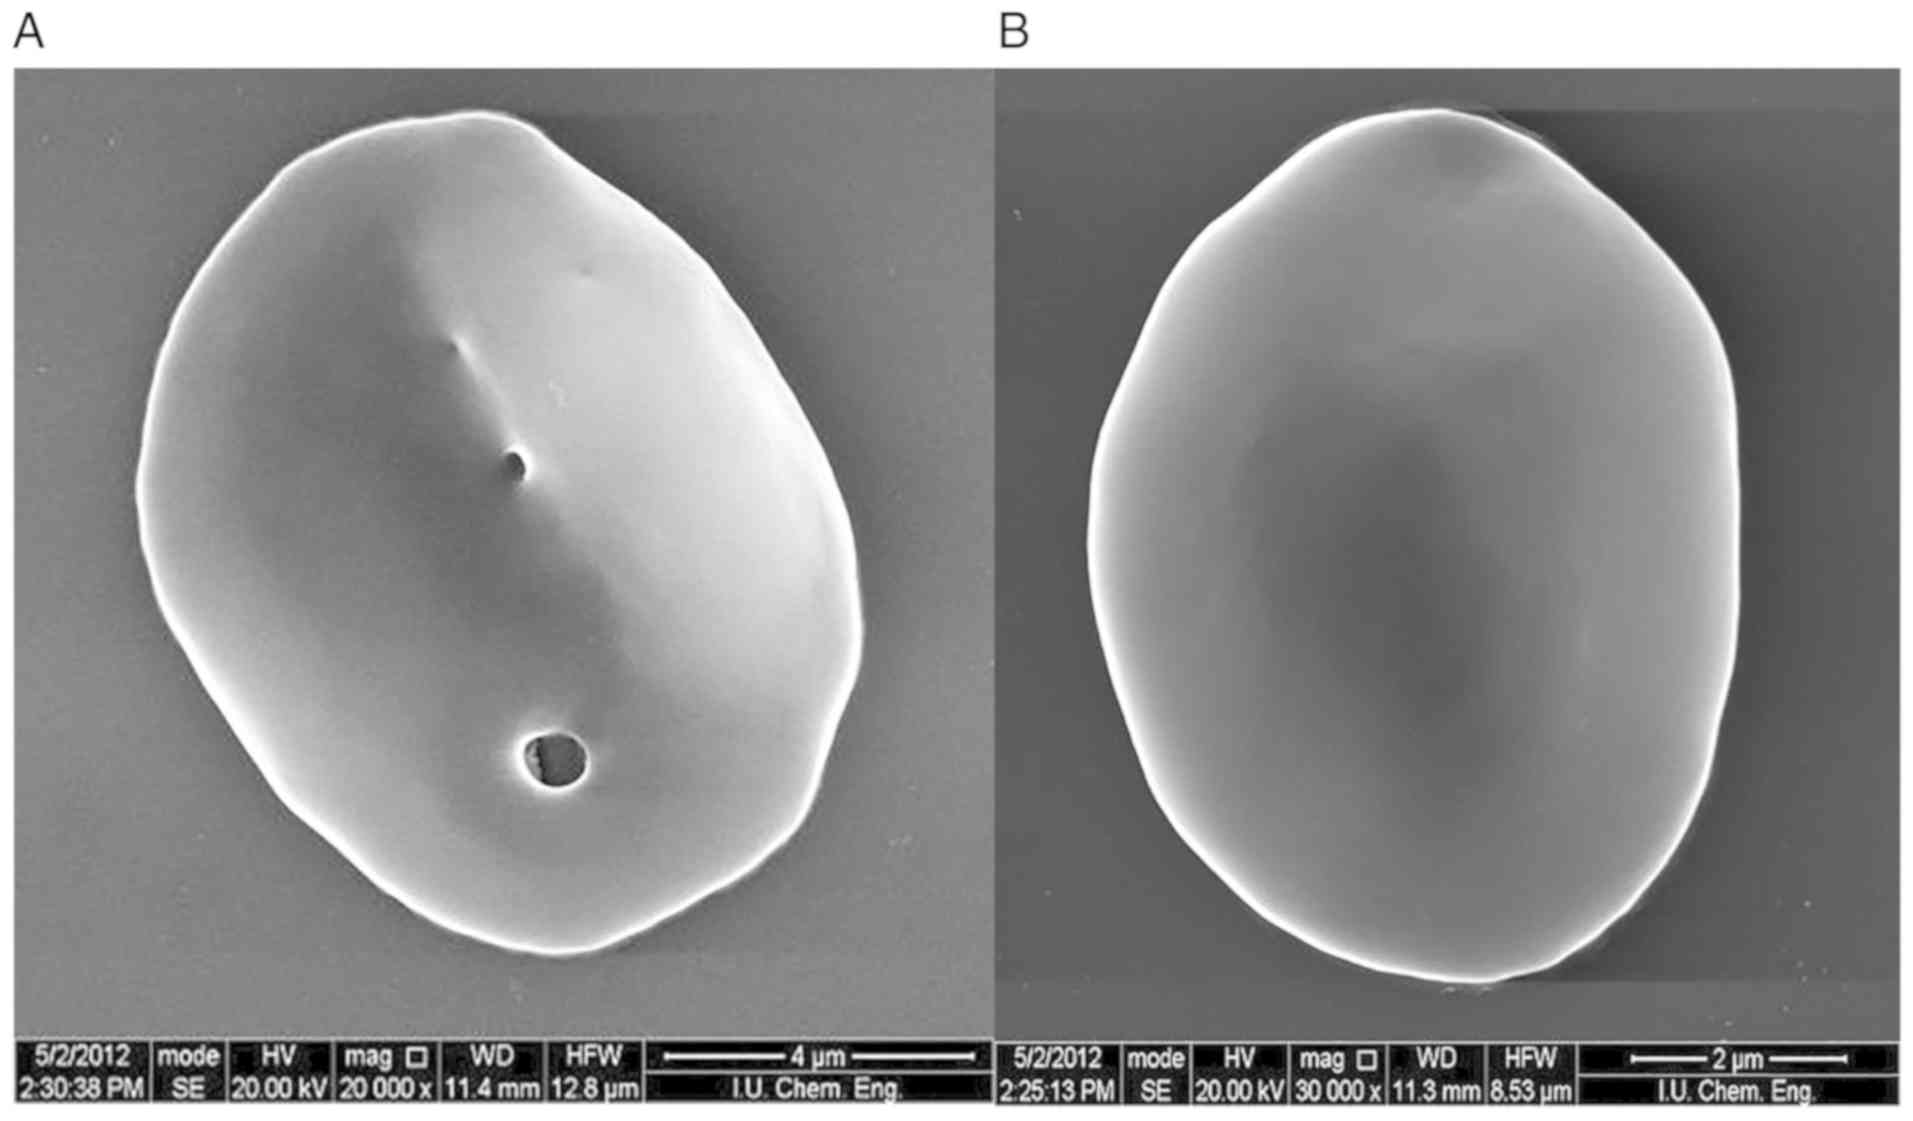
morphological abnormalities were subsequently confirmed using SEM.
The presence of these pores in the membrane is inconsistent with
the literature (Fig. 2). SDS-PAGE
analysis of the erythrocyte membrane proteins was performed to
identify the responsible genes and proteins for these defects.
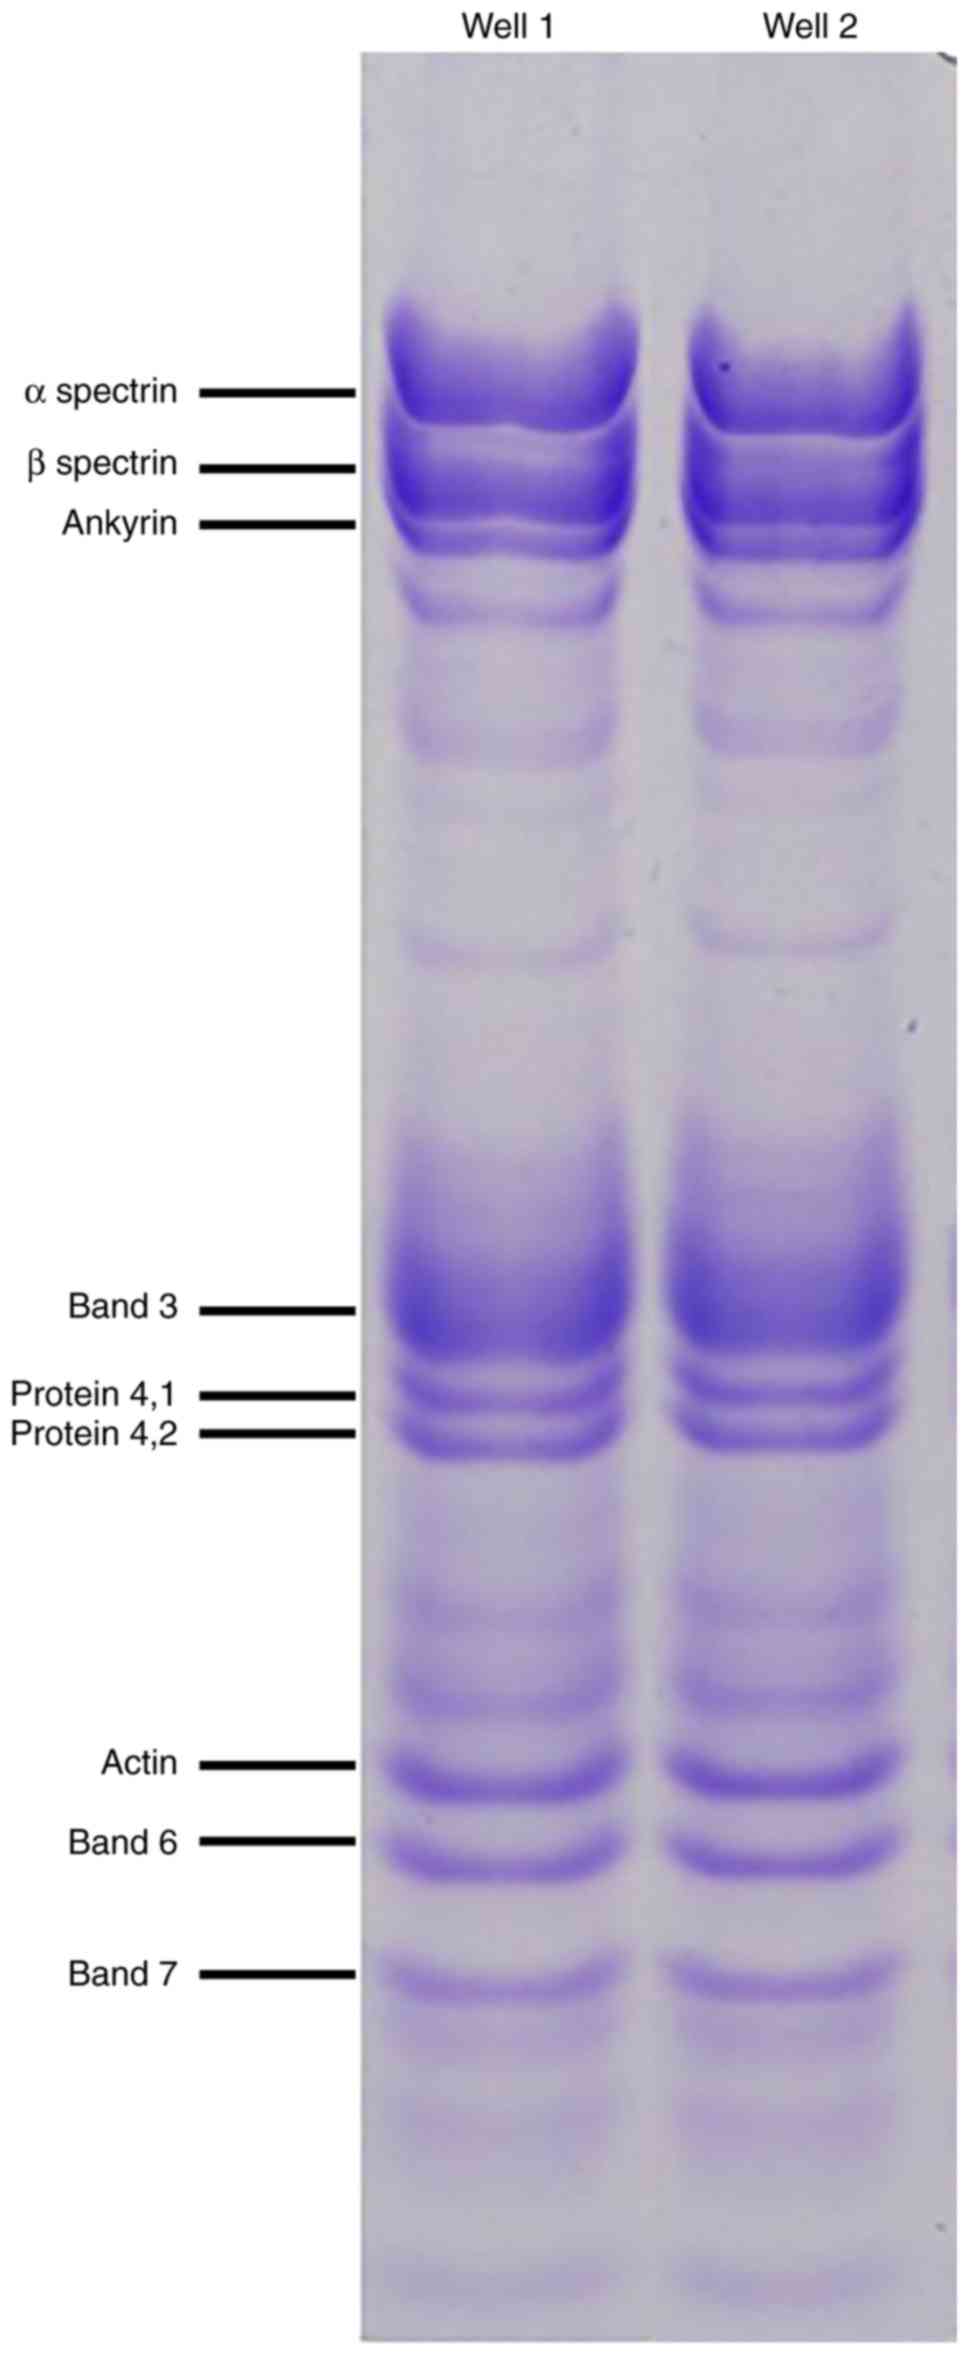
SDS-PAGE and proteome analyses of
erythrocyte membrane proteins
Blood samples were collected from the patient who
was admitted to the Hematology Clinic at Istanbul Medical Faculty
(Istanbul, Turkey) and diagnosed as having congenital hemolytic
anemia. Erythrocyte membrane protein (ghost) isolation was
performed from the patient's blood sample from the healthy control
group. Erythrocyte membrane proteins were subsequently screened
using polyacrylamide SDS-PAGE electrophoresis (Fig. 3). Abnormal morphology of the RBCs
may have affected the results of the SDS-PAGE gel, and therefore
direct comparisons of the healthy group and the HS patient are not
possible. Quantitative protein assessments were conducted using
MALDI TOF MS to accurately determine the membrane protein
deficits.
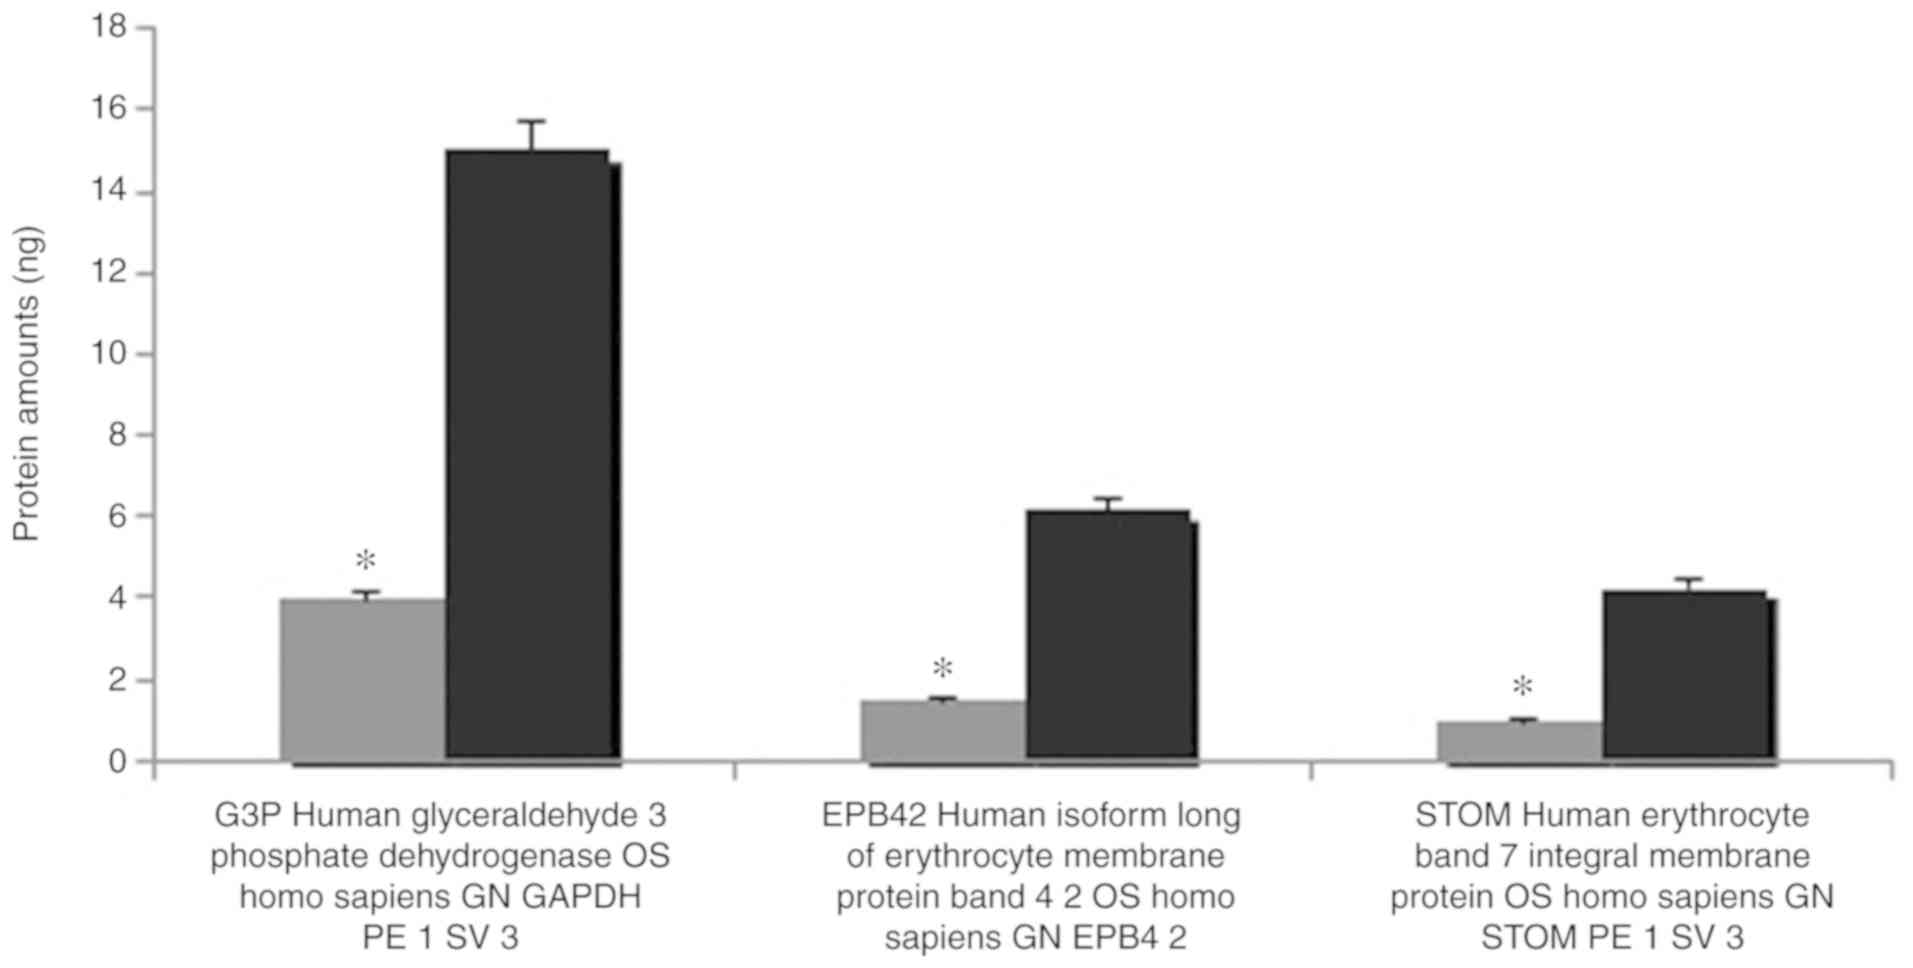
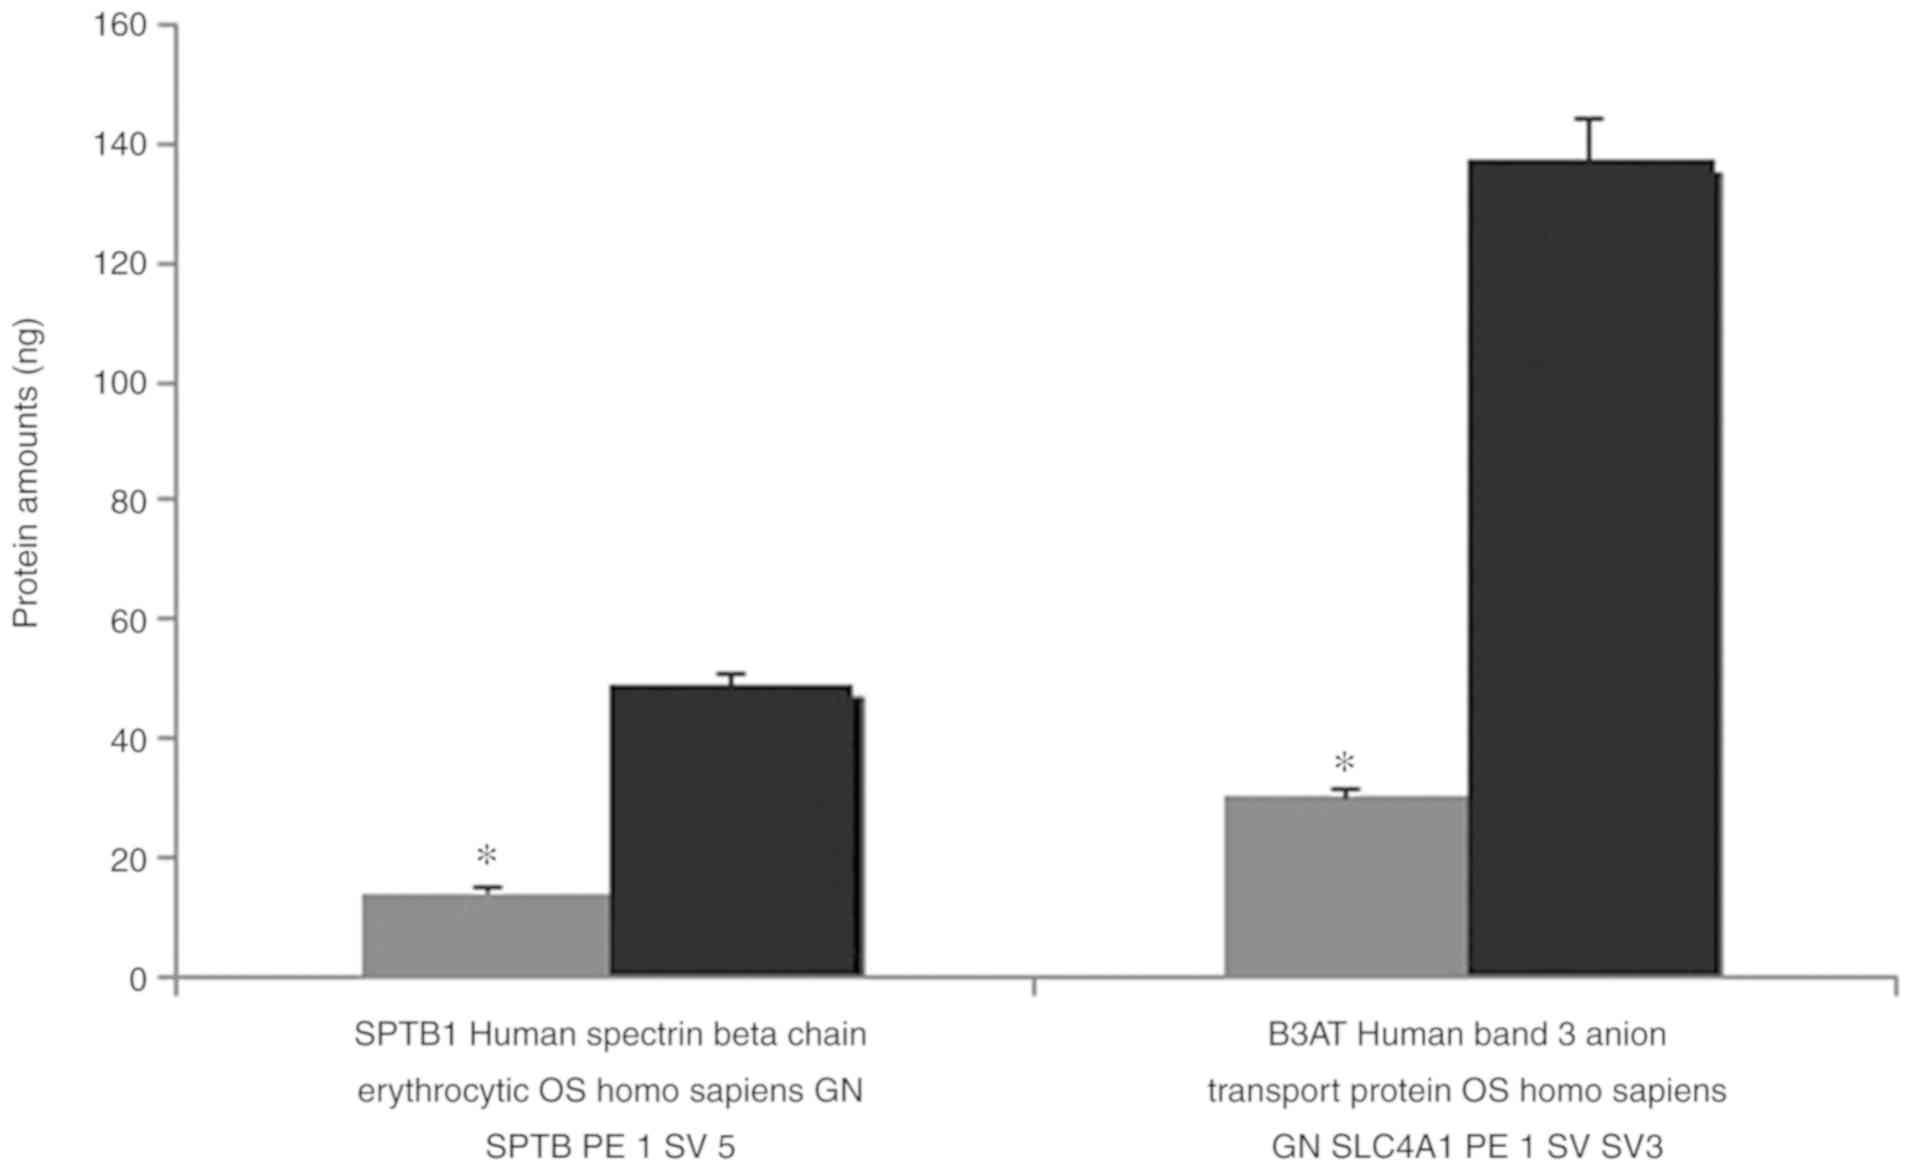
The results of the MALDI TOF MS analysis revealed
the majority of the bands, particularly spectrin and ankyrin, had a
reduction in the amount of membrane proteins compared with the
controls. Band 3, which has a notable role in membrane structure,
decreased 4.573-fold, and protein 4.2 decreased 4.106-fold compared
with healthy controls. Quantitative protein amounts (ng) with MALDI
TOF MS are shown in Table II.
| Table II.Quantification of erythrocyte membrane
proteins of the patient and healthy controls using MALDI TOF
MS. |
Table II.
Quantification of erythrocyte membrane
proteins of the patient and healthy controls using MALDI TOF
MS.
| Erythrocyte membrane
proteins | Patient, ng | Healthy control,
ng |
|---|
| CAH1; HUMAN; Carbonic
anhydrase 1; OS Homo sapiens; GN CA1; PE 1; SV 2 | 0.1272 | – |
| IGKC; HUMAN; Ig kappa
chain C region; OS Homo sapiens; GN IGKC; PE 1; SV 1 | 0.1026 | 0.5685 |
| P01857 | 0.2131 | 1.2857 |
| IGHG1; HUMAN; Ig
gamma 1 chain C region; OS Homo sapiens; GN IGHG1; PE 1; SV
1 | 0.2131 | 1.2857 |
| P01859 | – | 1.0083 |
| IGHG2; HUMAN; Ig
gamma 2 chain C region; OS Homo sapiens; GN IGHG2; PE 1; SV
2 | – | 1.0083 |
| P02549 | – | 44.1543 |
| SPTA1; HUMAN;
Spectrin alpha chain erythrocytic 1; OS Homo sapiens; GN
SPTA1; PE 1; SV 5 | – | 44.1543 |
| SPTA1; HUMAN;
Isoform 2 of Spectrin alpha chain erythrocytic 1; OS Homo
sapiens; GN SPTA1 | 13.1225 | 11.9537 |
| GLPA; HUMAN;
Glycophorin A; OS Homo sapiens; GN GYPA; PE 1; SV 2 | 0.9468 | 1.6933 |
| P02730 |
30.0719a | 137.5161 |
| B3AT; HUMAN Band 3
anion transport protein; OS Homo sapiens; GN SLC4A1; PE 1;
SV 3 | 30.0719 | 137.5161 |
| P04406 | 3.9705 | 15.03 |
| G3P; HUMAN;
Glyceraldehyde 3 phosphate dehydrogenase; OS Homo sapiens;
GN GAPDH; PE 1; SV 3 | 3.9705a | 15.03 |
| P06753-2 | 0.1604 | 0.6265 |
| TPM3; HUMAN;
Isoform 2 of Tropomyosin alpha 3 chain; OS Homo sapiens; GN
TPM3 | 0.1604 | 0.6265 |
| GTR1; HUMAN; Solute
carrier family 2 facilitated glucose transporter member 1; OS
Homo sapiens; GN SLC2 | 1.7362 | 5.4405 |
| P11277 |
14.1724a | 49.0578 |
| SPTB1; HUMAN;
Spectrin beta chain erythrocytic; OS Homo sapiens; GN SPTB;
PE 1; SV 5 | 14.1724 | 49.0578 |
| SPTB1; HUMAN;
Isoform 2 of Spectrin beta chain erythrocytic; OS Homo
sapiens; GN SPTB | – | 7.4763 |
| SPTB1; HUMAN;
Isoform 3 of Spectrin beta chain erythrocytic; OS Homo
sapiens; GN SPTB | – | 1.812 |
| ANK1; HUMAN;
Ankyrin 1; OS Homo sapiens; GN ANK1; PE 1; SV 3 | – | 9.8798 |
| P16157-12 | – | 46.714 |
| ANK1; HUMAN;
Isoform Er11 of Ankyrin 1; OS Homo sapiens; GN ANK1 | – | 46.714 |
| ANK1 HUMAN; Isoform
Er3 of Ankyrin 1; OS Homo sapiens; GN ANK1 | 8.6526 |
|
| EPB42; HUMAN;
Isoform Long of Erythrocyte membrane protein band 4 2; OS Homo
sapiens; GN EPB42 | 1.5063a | 6.1724 |
| STOM; HUMAN;
Erythrocyte band 7 integral membrane protein; OS Homo
sapiens; GN STOM; PE 1; SV 3 | 1.0081a | 4.2655 |
| TMOD1; HUMAN;
Tropomodulin 1; OS Homo sapiens; GN TMOD1; PE 1; SV 1 | 0.2535 | 1.3899 |
| P35612 | – | 2.7708 |
| ADDB; HUMAN; Beta
adducing; OS Homo sapiens; GN ADD2; PE 1; SV 3 | – | 2.7708 |
| ACTG; HUMAN; Actin
cytoplasmic 2; OS Homo sapiens; GN ACTG1; PE 1; SV 1 | 2.1885 | 0.0118 |
| HBB; HUMAN;
Hemoglobin subunit beta; OS Homo sapiens; GN HBB; PE 1; SV
2 | 5.3178 | 8.6761 |
| HBA; HUMAN;
Hemoglobin subunit alpha; OS Homo sapiens; GN HBA1; PE 1; SV
2 | 13.7438 | 5.569 |
| DEMA; HUMAN;
Dematin; OS Homo sapiens; GN EPB49; PE 1; SV 3 | – | 0.0599 |
Confirmation of the decrease in the amount of
erythrocyte proteins verified in the SDS-PAGE analysis, is
presented in Figs. 4 and 5.
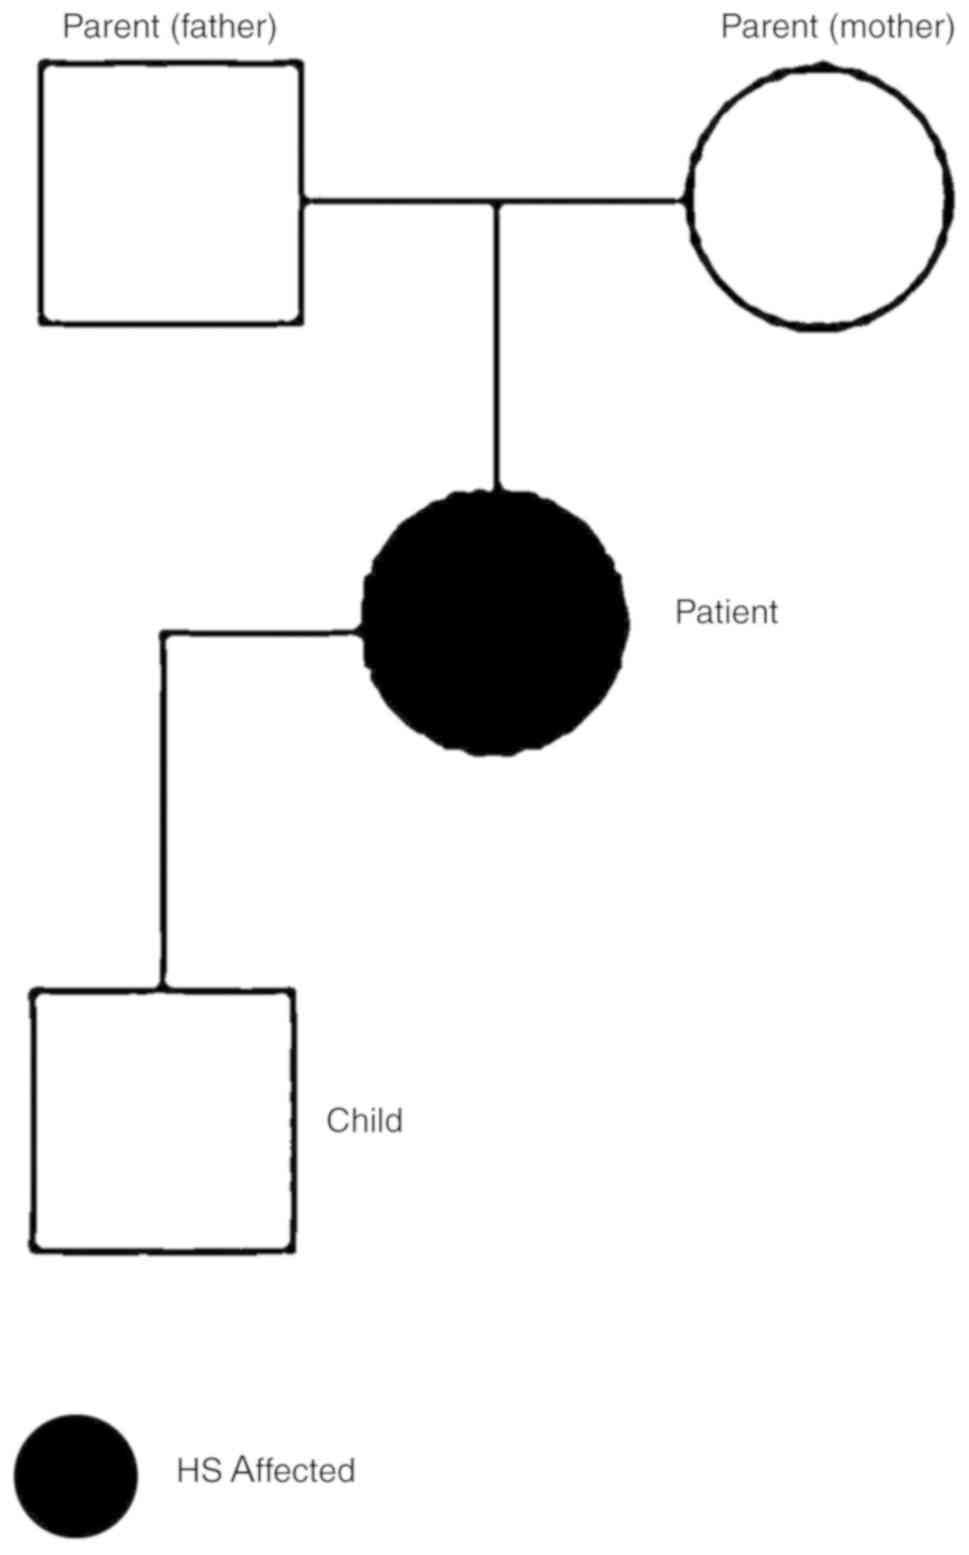
To further characterize the RBC proteome of the
patient, blood samples from the patient and family (Fig. 6) were collected and analyzed. The
blood counts of the son and parents of the patient were normal
(data not shown).
Exome capture/exome sequencing
analysis pipeline
Raw sequencing data were aligned to the human genome
hg19 reference using Burrows-Wheeler Aligner with standard
parameters in paired-end mode. SAMtools was used to remove the PCR
duplicates. SAM format is a generic format for storing large
nucleotide sequence alignment. SAM format is a generic alignment
format or storing read aligments against reference sequences,
supporting short and long reads produced by different sequencing
platforms. BeDtools is an open source software package comprised of
multiple tools for comparing and exploring genomic datasets via
fundamental genome arithmetic tasks. BEDtools was used to calculate
the coverage of targeted exome regions. A total of 82% of targeted
regions were covered at least eight times, (>8% coverage) and
the average sequencing depth of the regions was 24-fold (Table III). Coverage is associated with
to read depth. At any given position the coverage is equal to the
read depth. These values are the mean of all samples. Filtering as
based on coverage. Sequencing intensity of the targeted regions
increased 20 fold as determined by using Bedtools (Table III). ANNOVAR is an efficient
software tool to utilize update-to-date information to functionally
annotate genetic variants detected from diverse genomes. An
important and probably highly desirable feature is that ANNOVAR can
help identify subset of variants annotated in dbSNP or variants
based on comparisons with other variant databases. ANNOVAR was used
for functional information variants such as gene/exonic regions,
segmental copies, SIFT and PolyPhen scores. All variants were
filtered according to the following criteria are presented in
Table IV. Variants were filtered
based on genotype quality (GQ) score >15, read depth (DP) of
>4, predicted loss-of- function or missense mutation and minor
allele frequency (MAF) <0.01. Exome variant server is to
discover novel genes and mechanisms contributing blood disorders by
pioneering the application of NGS of the protein coding regions of
the human genome across diverse, richly-phenotyped populations
(Table IV). The results revealed
that a new mutation which is not in dbSNP135 or 1000 genome MAF
<0.01, and homozygous in the affected patient (S2) and
heterozygous in the carrier parents (S4&S5); GQ >15 and
coverage (DP) >4 (chr9:80000000-118000000).
| Table III.Exome sequencing coverage
analysis. |
Table III.
Exome sequencing coverage
analysis.
| Coverage | Sample 1 | Sample 2 | Sample 3 | Sample 4 | Sample 5 | Mean |
|---|
| Average
coverage | 23 | 25 | 23 | 22 | 27 | 24.25 |
| >8%
coverage | 81% | 82% | 81% | 80% | 84% | 82% |
| Table IV.Variant filtering results for HS
patient (S2) and parents (S4&S6). |
Table IV.
Variant filtering results for HS
patient (S2) and parents (S4&S6).
| Filtering
condition | Variants | Synonomous | Non-synonomous | Stop gain/loss | Splicing | Frameshift
indels | Non-frameshift
indels | Total in EVS |
|---|
| Total | 182,671 | 11,408 | 10,775 | 109 | 164 | 115 | 196 | 22,767 |
| Not in dbSNP 135 or
1000 Genome MAF <0.01 | 11,927 | 399 | 857 | 20 | 42 | 24 | 21 | 1,363 |
| Homozygous in
patient (S2) and heterozygous in parents (S4&S5) | 1,014 | 21 | 28 | 0 | 2 | 3 | 5 | 59 |
| GQ>15 and
DP>4 | 377 | 14 | 14 | 0 | 2 | 2 | 3 | 35 |
| In homozygous
region(chr9:80000000-118000000) | 23 | 2 | 1 | 0 | 0 | 0 | 0 | 3 |
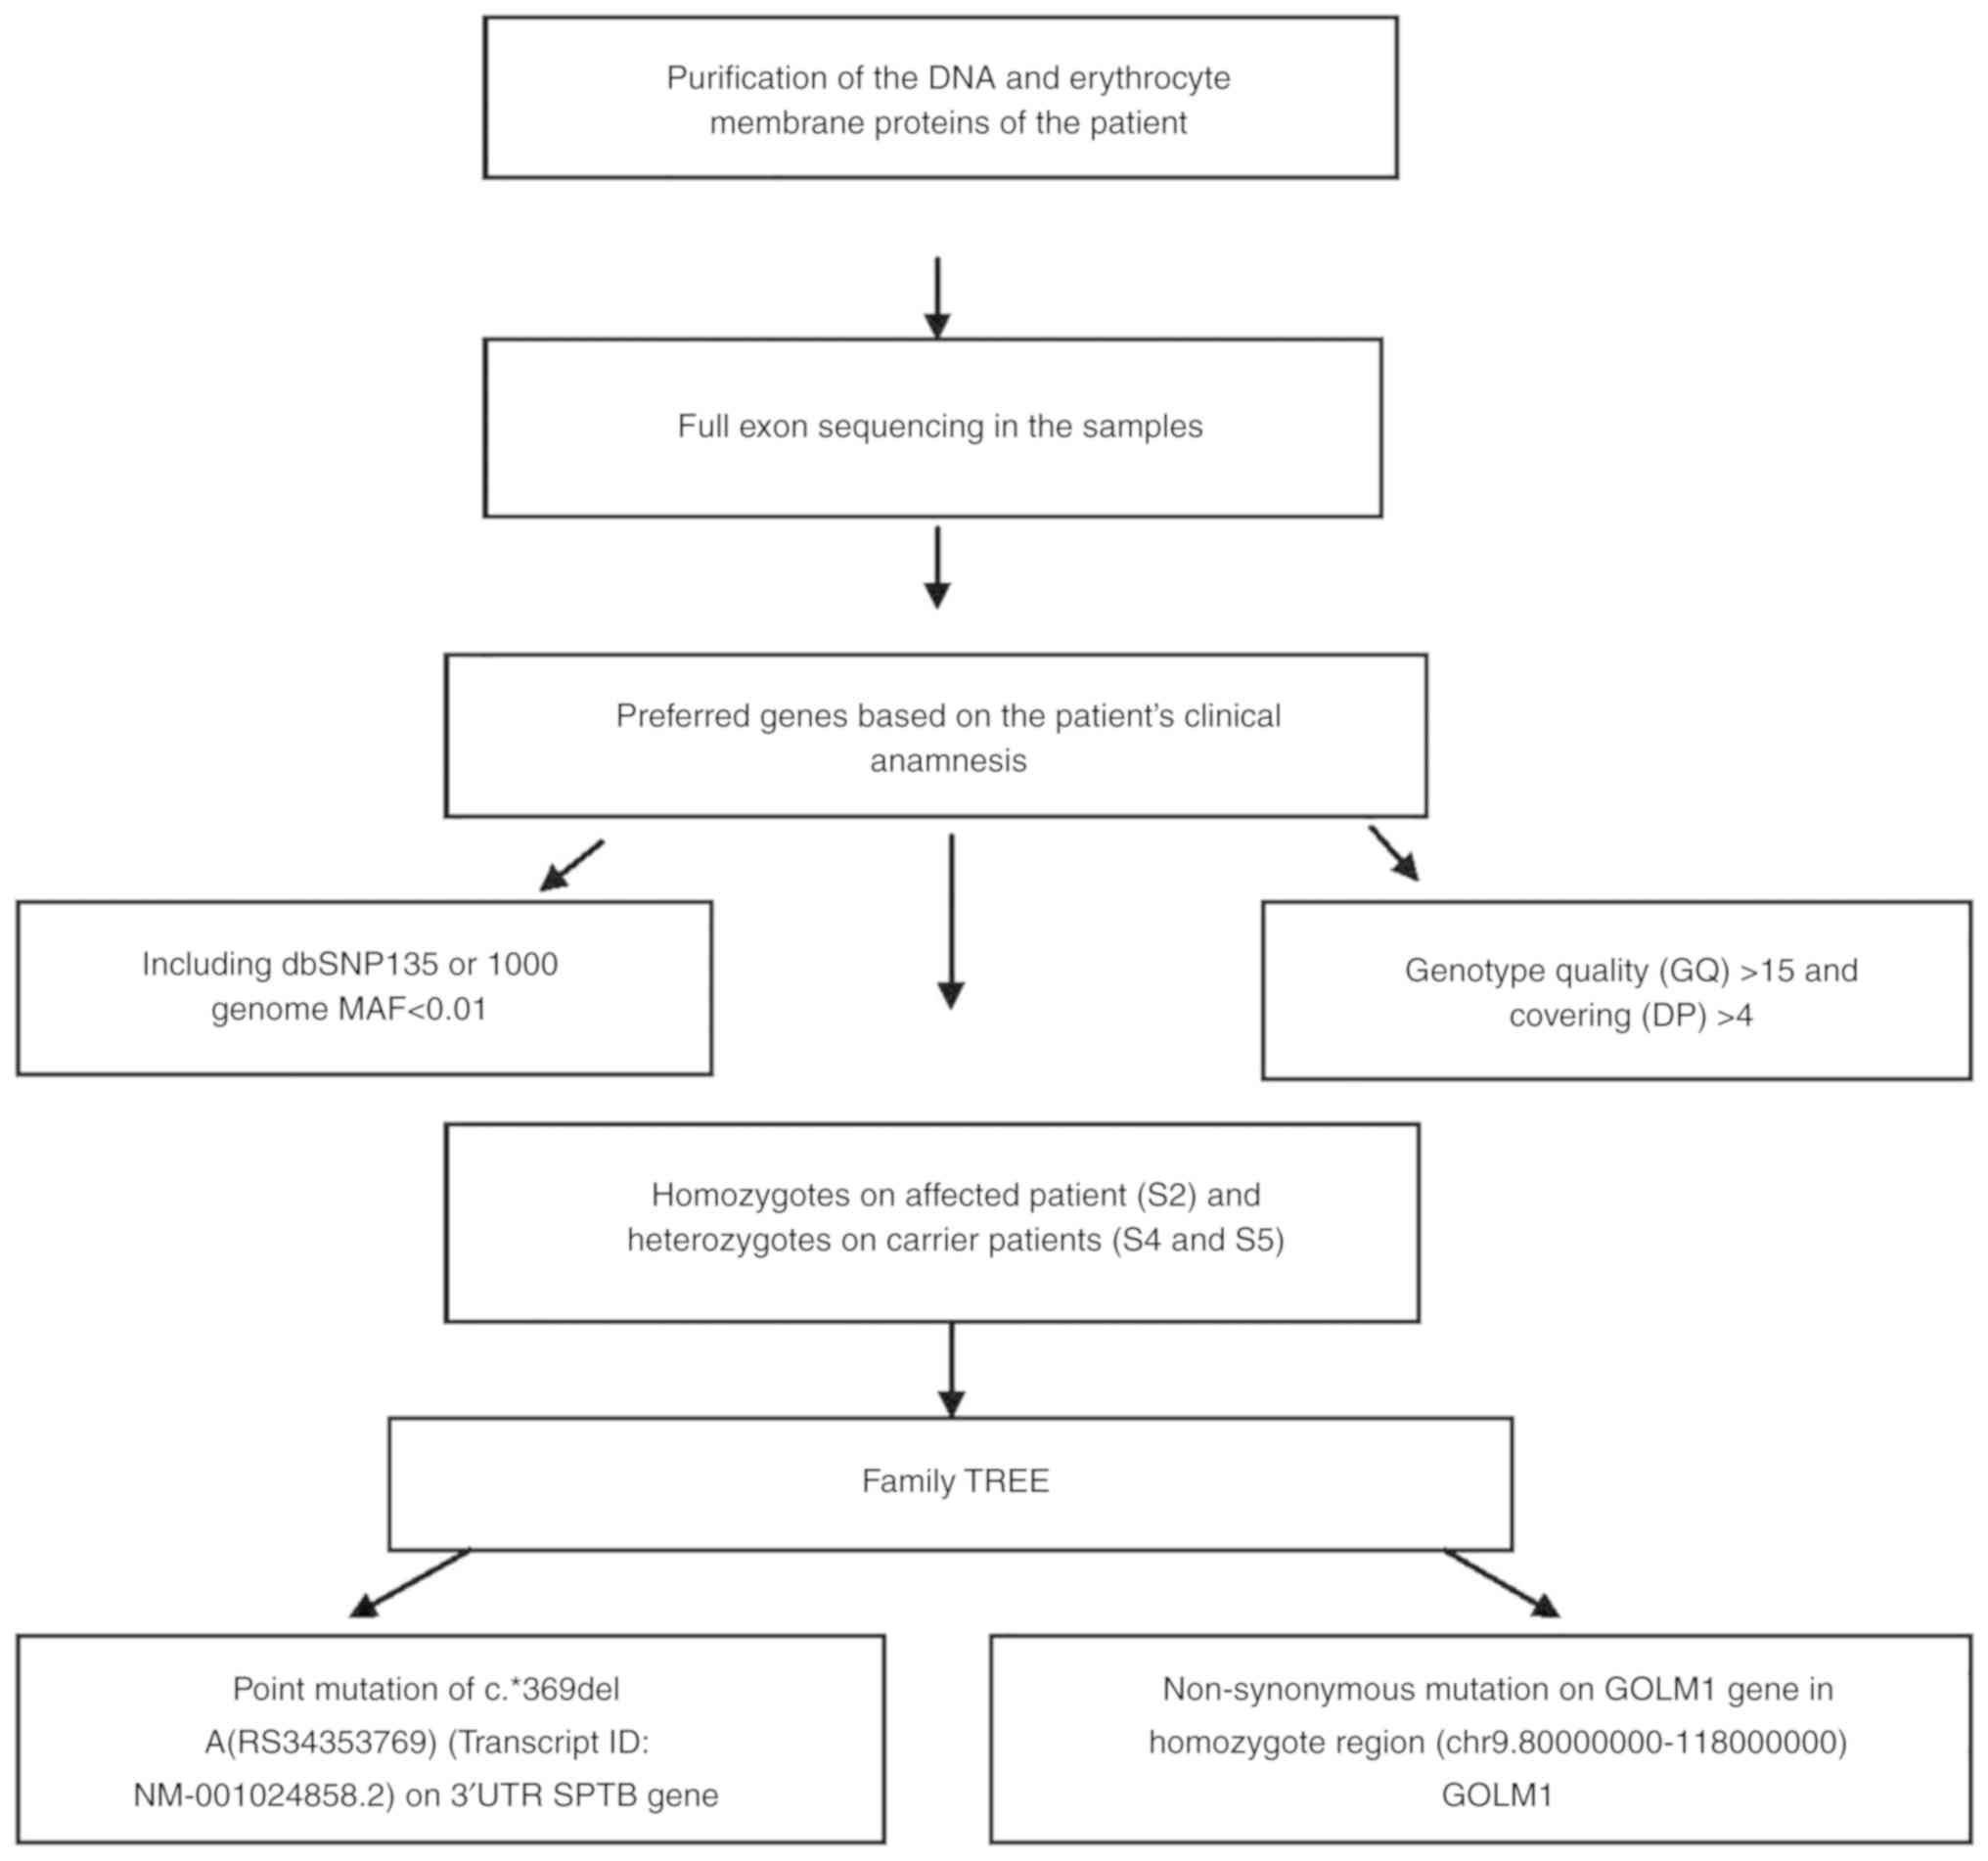
From performing NGS of the genes in the present
study, we examined the genetic background of the patient and her
family (Table IV). Deficient
proteins in the erythrocytes were identified as a result of
proteomic analyses. Non-synonymous exonic mutation region was
selected on GOLM1 gene (Chr9 rs142242230) after the filter was
applied. SIFT, PolyPhen2, LRT and MutationTaster revealed the
mutation (Table IV). Filtering of
the variants according to the exon sequencing of the family members
and data on the family tree revealed a c.*369delA (rs34353769)
point mutation 3′UTR of SPTB gene (Transcript ID: NM_001024858.2;
genomic coordinates, hg19: chr14:65215655). This variation is not
present in the exon sequencing of 300 Turkish individuals or in the
open public database. No mutation was detected in EPB41 (band 4.1)
and EPB42 (protein 4.2) genes. The workflow of exome sequencing
analysis pipeline is presented in Fig.
7.
In the present study, a patient with HS aged 35 and
her family were genetically analyzed and new generation sequencing
was also performed, as the genetic source of HS was determined by
mutation of GOLM1 gene. To determine genes and proteins that are
responsible from the holes erythrocytes exome sequencing and MALDI
TOF analyses were used, and the potential responsible genes and
proteins were detected.
Discussion
HS is a disease accompanied by anemia, jaundice and
splenomegaly due to an increased predisposition to hemolysis. It is
also accompanied by a transformation of erythrocytes from biconcave
and disc-shaped cells into sphere-shaped (spherocyte) cells
(1). The biconcave disc-shape of
erythrocytes helps to increase gas exchange with maximum efficiency
at the membrane level (2). In
addition, a flexible cytoskeleton and membrane structures are
required for RBCs to change shape and circulate along capillaries
(4,5). Therefore, quantitative and
qualitative deficiencies in erythrocyte membrane proteins, which
result in lipid loss from the erythrocyte surface and decreases in
the erythrocyte surface/volume ratio, affect the normal activity of
these cells. Beyond deforming the normal shape of RBCs,
modifications in membrane proteins may lead to degeneration in
heat, mechanical instability and osmotic fragility, and decrease
erythrocyte life span, all of which cause hemolytic anemia
(2,3). The severity of disease ranges from
mild to severe depending on the extent of the membrane defects
(8,9). Previous studies have demonstrated the
loss of surface area results from increased membrane fragility due
to primary and secondary abnormalities in erythrocyte membrane
proteins, particularly ankyrin, α- and β-spectrin, band 3 and
protein 4.2 (4).
Deteriorations of one of the erythrocyte membranes
may affect other associated proteins (7). Mutations in the cytoplasmic domain of
band 3 may cause functional defects by preventing the attachment of
membrane proteins to cytoskeletal proteins. Translocation of amino
acids (G130A) in the cytoplasmic domain of band 3 may also affect
its attachment to protein 4.2. Moreover, protein 4.2 decreases have
been detected in patients with band 3 damage (8,9).
Therefore, it is possible that band 3 may facilitate the attachment
of protein 4.2 to the membrane. Thus, slight decreases in protein
4.2 may indicate damage in the attachment region with band 3,
rather than deterioration of the protein (9).
Studies have demonstrated that RBC band 3
deterioration occurs in 30% of European patients with HS, with
protein decreases in the range of 15–40% (3). HS that develops as a consequence of
band 3 damage is hereditary and is generally mild compared with HS
caused by ankyrin and spectrin deterioration. The majority of
patients (around 80%) with band 3 loss have small amounts (1–2%) of
mushroom-shaped blood cells, also termed pincers (6), an RBC morphology unique to HS
patients with band 3 damage.
MALDI TOF MS analysis revealed the majority of the
bands, particularly spectrin and ankyrin, were reduced in the
abundance of membrane proteins compared with the controls. Band 3,
which has a notable role in membrane structure, decreased
4.573-fold, and protein 4.2 decreased 4.106-fold in expression
compared with healthy controls Spectrin deterioration is the most
common protein alteration in patients with HS (2,3).
Different degrees of spectrin loss are detected in RBCs with
ankyrin and spectrin deterioration (4–6). As
a result, RBCs attain the spheroid form, which results in the
increase in hemolysis intensity, and decreases the durability of
RBC membranes against strain stress (6). However, the general structure of the
cell cytoskeleton is preserved, although the number of attachment
points to actin, spectrin and protein 4.1 decreases (2,6).
In the present study, high resolution microscopic
images were obtained using SEM in order to characterize the
morphology of the erythrocytes of an HS patient with deep vein
thrombosis, and cardiac problems. Pores were observed on
erythrocyte membrane surfaces in these images.
Quantitative protein assessments were performed
using MALDI TOF MS to determine membrane protein deficiencies
(10). A difference was detected
in the analysis of the erythrocyte membrane proteins following
SDS-PAGE compared with controls. It was observed that band 3 and
protein 4.2, which serve a particular role in membrane structure,
were decreased 4.573 and 4.106-fold, respectively.
It was hypothesized that the pores observed in the
erythrocytes of the patient developed due to a decrease in these
proteins, which reside in the membrane. Thus, the second phase of
the study was initiated with blood drawn from the patient and the
family, namely the father, mother and 12-year-old son. Proteomic
analysis of isolated erythrocyte ghosts from all four individuals
was performed to elucidate the cause of the disease.
The genetic profile of the patient and her family
was generated via NGS, and it was concluded that a GOLM1 gene
mutation was responsible for the emergence of the disease. Even
though various hereditary conditions have specific molecular
defects which are unique to a family, molecular analyses ought to
be performed in severe cases where prenatal diagnosis is required.
Moreover, complete genetic profiling of unique HS phenotypes may
help further the understanding of the illness and provide novel
insights for scientific investigation.
Acknowledgements
Not applicable.
Funding
The present study was supported by the research fund
of Istanbul University (grant no. 35214).
Availability of data and materials
All data generated or analyzed during this study are
included in this published article.
Authors' contributions
IA and GA contributed equally in preparing and
writing this manuscript. LTS, AS, DU, GA and MA performed the
experiments. IA and GA analyzed the data. All authors have reviewed
and approved the final version of the article.
Ethics approval and consent to
participate
The Ethics Committee of the Istanbul Faculty of
Medicine, Istanbul University (Istanbul, Turkey) approved the
study, and written informed consent was obtained from all subjects
prior to sample collection.
Patient consent for publication
Not applicable.
Competing interests
The authors declare that they have no competing
interests.
References
|
1
|
Bolton-Maggs PH, Stevens RF, Dodd NJ,
Lamont G, Tittensor P and King MJ; General Haematology Task Force
of the British Committee for Standards in Haematology, : Guidelines
for the diagnosis and management of hereditary spherocytosis. Br J
Haematol. 126:455–474. 2004. View Article : Google Scholar : PubMed/NCBI
|
|
2
|
Perrotta S, Gallagher PG and Mohandas N:
Hereditary spherocytosis. Lancet. 372:1411–1426. 2008. View Article : Google Scholar : PubMed/NCBI
|
|
3
|
Hug S, Pietroni ACM, Rahman H and Alam TM:
Hereditary spherocytosis. J Health Popul Nutr. 28:107–109.
2010.PubMed/NCBI
|
|
4
|
Miraglia del Giudice E, Francese M, Nobili
B, Morle L, Cutillo S, Delaunay J and Perrotta S: High frequency of
de novo mutations in ankyrin gene (ANK1) in children with
hereditary spherocytosis. J Pediatr. 132:117–120. 1998. View Article : Google Scholar : PubMed/NCBI
|
|
5
|
Miraglia Del Giudice E, Lombardi C,
Francese M, Nobili B, Conte ML, Amendola G, Cutillo S, Iolascon A
and Perrotta S: Frequent de novo monoallelic expression of
beta-spectrin gene (SPTB) in children with hereditary spherocytosis
and isolated spectrin deficiency. Br J Haematol. 101:251–254. 1998.
View Article : Google Scholar : PubMed/NCBI
|
|
6
|
Gallagher PG: Abnormalities of the
erythrocyte membrane. Pediatr Clin North Am. 60:1349–1362. 2013.
View Article : Google Scholar : PubMed/NCBI
|
|
7
|
Mohandas N and Gallagher PG: Red cell
membrane: Past, present and future. Blood. 112:3939–3948. 2008.
View Article : Google Scholar : PubMed/NCBI
|
|
8
|
Barcellini W, Fermo P, Imperiali E,
Imperiali FG, Marcello AP, Vercellati C, Zaninoni A and Zanella A:
Hereditary red cell membrane defects: Diagnostic and clinical
aspects. Blood Transfus. 9:274–227. 2011.PubMed/NCBI
|
|
9
|
Farias MG: Advances in laboratory
diagnosis of hereditary spherocytosis. Clin Chem Lab Med.
55:944–948. 2017. View Article : Google Scholar : PubMed/NCBI
|
|
10
|
Karas M and Hillenkamp F: Laser desorption
ionization of proteins with molecular masses exceeding 10,000
daltons. Anal Chem Oct. 60:2299–2301. 1988. View Article : Google Scholar
|
|
11
|
Gormez Z, Bakir-Gungor B and Sagiroglu MS:
HomSI: Homozygous stretch identifier from next-generation
sequencing data. Bioinformatics. 30:445–447. 2014. View Article : Google Scholar : PubMed/NCBI
|
|
12
|
Godal HC, Elde AT, Nyborg N and Brosstad
F: The normal range of osmotic fragility of red blood cells. Scand
J Haematol. 25:107–112. 1980. View Article : Google Scholar : PubMed/NCBI
|
|
13
|
Dodge JT, Mitchell C and Hanahan DJ: The
preparation and chemical characteristics of hemoglobin-free ghosts
of human erythrocytes. Arch Biochem Biophys. 100:119–130. 1963.
View Article : Google Scholar : PubMed/NCBI
|
|
14
|
Laemmli UK: Cleavage of structural
proteins during the assembly of the head of bacteriophage T4.
Nature. 227:680–685. 1970. View
Article : Google Scholar : PubMed/NCBI
|
|
15
|
Fan XH, Feng GD, Yang YN, Dai W and Zhao
G: Diagnostic value of may grunwald giemsa staining of
cerebrospinal fluid in patients with crptococcal meningitis. J İnt
Neurol Neurosurg. 40:220–222. 2013.
|
|
16
|
Wisniewski JR, Zougman A, Nagaraj N and
Mann M: Universal sample preparation method for proteome analysis.
Nat Methods. 6:359–362. 2009. View Article : Google Scholar : PubMed/NCBI
|
|
17
|
Hacariz O, Sayers G and Baykal AT: A
proteomic approach to investigate the distribution and abundance of
surface and internal fasciola hepatica proteins during the chronic
stage of natural liver fluke infection in cattle. J Proteome Res.
11:3592–3604. 2012. View Article : Google Scholar : PubMed/NCBI
|
|
18
|
The UniProt Consortium: UniProt: The
universal protein knowledgebase. Nucleic Acids Res. 46:D158–D169.
2017.
|
|
19
|
Jeppsson JO, Laurell CB and Franzen B:
Agarose gel electrophoresis. Clin Chem. 25:629–638. 1979.PubMed/NCBI
|
|
20
|
Li H and Durbin R: Fast and accurate short
read alignment with Burrows–Wheeler transform. Bioinformatics.
25:1754–1760. 2009. View Article : Google Scholar : PubMed/NCBI
|
|
21
|
Li H, Handsaker B, Wysoker A, Fennell T,
Ruan J, Homer N, Marth G and Abecasis G; Durbin R and 1000 Genome
Project Data Processing Subgroup, : The sequence alignment/map
format and SAMtools. Bioinformatics (Oxford, England).
25:2078–2079. 2009. View Article : Google Scholar : PubMed/NCBI
|
|
22
|
Quinlan AR and Hall IM: BEDTools: A
flexible suite of utilities for comparing genomic features.
Bioinformatics. 26:841–842. 2010. View Article : Google Scholar : PubMed/NCBI
|
|
23
|
DePristo MA, Banks E, Poplin R, Garimella
KV, Maquire JR, Hartl C, Philippakis AA, del Angel G, Rivas MA,
Hanna M, et al: A framework for variation discovery and genotyping
using next-generation DNA sequencing data. Nat Genet. 43:491–498.
2011. View
Article : Google Scholar : PubMed/NCBI
|
|
24
|
Warden CD, Adamson AVV, Neuhausen SL and
Wu X: Detailed comparison of two popular variant calling packages
for exome and targeted exon studies. Peer J. 30:e6002014.
View Article : Google Scholar
|
|
25
|
Wang K, Li M and Hakonarson H: ANNOVAR:
Functional annotation of genetic variants from high-throughput
sequencing data. Nucleic Acids Res. 38:e1642010. View Article : Google Scholar : PubMed/NCBI
|
|
26
|
Schwarz JM, Rödelsperger C, Schuelke M and
Seelow D: MutationTaster evaluates disease- causing potential of
sequence alterations. Nat Methods. 7:575–576. 2010. View Article : Google Scholar : PubMed/NCBI
|