Introduction
Myocardial infarction (MI), one of the leading
cardiovascular diseases, may cause various complications, including
cardiogenic shock, ventricular fibrillation, heart failure and
recurrent ischemia (1). The
mortality rate in unselected patients with ST-segment elevation MI
ranges between 6 and 14% in The European Society of Cardiology
countries (2). Physical
examinations, highly sensitive biomarkers, electrocardiograms and
imaging techniques are frequently used in the clinical diagnosis of
MI. However, electrocardiograms were identified to be associated
with low sensitivity (2).
Similarly, among the biomarkers for MI, the blood level of creatine
kinase-muscle/brain (CK-MB) was identified to be associated with
low specificity, ranging between 59.1 and 84.2% (2,3).
High-sensitivity cardiac muscle troponin T (TNNT) exhibited a
limited specificity, ranging between 54 and 85% and a low positive
predictive value of 61–87% (4).
Furthermore, various diseases, other than MI, may cause an increase
in the circulating level of TNNT, including direct myocardial
injury and various primary noncardiac diseases (5). Additionally, the increase in TNNT2
blood plasma levels may be maintained for ≤2 weeks following MI
(6), thus, this parameter is not
sufficient to monitor the disease status and the potential
therapeutic effects of a treatment. Imaging techniques, including
coronary computed tomography angiography, are alternative
diagnostic methods; however, the iodinated contrast media used in
coronary computed tomography angiography may lead to
contrast-induced nephropathy (7).
Various protein biomarkers of MI have been identified in multiple
previous studies (8,9).
Over the past decade, multiple studies have used
genomics, proteomics and metabolomics to identify sensitive and
specific biomarkers for early diagnosis (10–16).
Due to the improvements in mass spectrometry (MS) techniques,
proteomics represents an efficient approach to investigate
alterations in the expression levels of multiple proteins following
the onset of MI. In 2003, Marshall et al (10) used matrix-assisted laser
desorption/ionization time-of-flight (MALDI-TOF) MS and identified
that fibrinogen peptide A and complement C3f peptide were cleaved
by aminopeptidases in the serum of patients with MI. Following this
previous study, various studies used proteomics analyses to
identify biomarkers of MI via multiple technology platforms,
including two-dimensional (2D) electrophoresis coupled with
MALDI-TOF MS (11,12), surface-enhanced laser
desorption/ionization-TOF MS with ProteinChip arrays (13) and liquid chromatography-tandem MS
(LC-MS/MS) (14–16). The majority of previous studies
analyzed blood samples (12,16);
however, purified platelets (11)
and cardiac tissues (15) were
additionally used to investigate biomarkers of MI, and multiple
biomarkers were identified to be associated with the onset of
MI.
Although the majority of previous studies analyzed
serum to identify biomarkers of MI, blood serum remains challenging
to investigate in proteomics analyses due to its dynamic range of
abundant proteins and the complex composition of blood serum.
Platelets and cardiac tissues are extracted proximally to the
potential injury site, and various biomarkers were identified to be
enriched in these samples (14).
However, platelets and cardiac samples are collected invasively.
Therefore, these samples are not suitable for clinical experiments
or for long-term monitoring. Urine composition is less complex than
plasma and cardiac tissue, and its collection in large volumes is
simple and noninvasive. Due to these characteristics, the urinary
proteome was previously used to identify biomarkers of
cardiovascular diseases, in particular for coronary artery disease
(CAD) (17–20). A number of previous studies used
capillary electrophoresis (CE)-MS to identify CAD-associated
biomarkers. Previous clinical studies (17–19)
performed CE-MS and identified various polypeptide panels used to
differentiate between patients with CAD and healthy controls. In a
previous animal model study, von zur Muhlen et al (20) identified alterations in the protein
expression levels of urinary polypeptides in apolipoprotein E
mutant mice fed a high-fat diet compared with a standard diet.
Collectively, these previously identified urinary polypeptide
panels exhibited a sensitivity of 79–98% and a specificity of
83–100%. CE-MS allows the identification of urinary polypeptides;
however, single proteins were not identified by these previous
studies (17–20) and the characterization of the
proteome of CAD remains limited. Additionally, these previous
studies did not analyze the urinary proteome following surgical
treatment and no biomarkers for monitoring therapeutic effects were
identified. To the best of our knowledge, the present study is the
first to use the isobaric tags for relative and absolute
quantification (iTRAQ) technique to analyze the urinary proteome of
patients with MI that underwent surgical treatment.
In the present study, the urinary proteome was
analyzed within 12 h following the first symptoms of early-onset MI
and at day 7 following percutaneous coronary intervention via iTRAQ
labeling and 2D LC-MS/MS. The proteomes obtained were compared with
normal healthy controls. The expression levels of the candidate
biomarkers were further validated by multiple reaction monitoring
(MRM) analysis using additional cohorts.
Patients and methods
Clinical samples
A total of 22 male patients with MI and 22 healthy
male volunteers were included in the present study and were divided
into two groups: Test group and validation group. In total, 7 male
patients with MI and 7 healthy male volunteers were randomly
included in the test group and were used for differential proteome
analysis. Furthermore, 15 patients with MI and 15 healthy
volunteers were included in the validation group used for MRM
validation.
MI was diagnosed at The Fourth Affiliated Hospital
of Jilin University (Changchun, China) between February 2011 and
September 2011. The clinical characteristics of patient with MI are
presented in Table I. The age of
patients with MI ranged between 41 and 59 years (mean age, 50.9
years; standard deviation of the mean age, 5.6 years). Patients
with MI were excluded from the present study if any additional
cardiovascular, renal or hepatic diseases were present. The
patients with MI enrolled in the present study successfully
underwent percutaneous coronary intervention (treatment group) 12 h
following MI. The recanalization rate of the infarct-associated
arteries was 100%, and the distal coronary flow was defined as
‘thrombolysis in MI flow grade’ 3, indicating a normal reflow
(21). Healthy volunteers (control
group; age range, 44–59; mean age, 49.3 years; standard deviation
of the mean age, 4.3 years), which were collected from 2012.04 to
2012.07, were considered healthy according to the clinical and
electrocardiographic criteria used to diagnose the patients with
MI. As the samples were collected for clinical examination and the
present study analyzed the remaining parts of the samples, and the
identity of the patients was anonymized throughout the study, the
requirement for patient consent was waived by The Institutional
Review Board of The Institute of Basic Medical Sciences (Beijing,
China). The study was approved by The Institutional Review Board of
The Institute of Basic Medical Sciences and followed the ethical
guidelines of The Declaration of Helsinki (22).
 | Table I.Clinical characteristics of male
patients with myocardial infarction. |
Table I.
Clinical characteristics of male
patients with myocardial infarction.
| A, Samples used for
isobaric tags for relative and absolute quantitation analysis |
|---|
|
|---|
| Patient ID | Age (years) | Diagnosis |
|---|
| 1 | 42 | Anterior, inferior
and right ventricular myocardial infarction; hypertension |
| 2 | 47 | Anterior myocardial
infarction |
| 3 | 48 | Inferior and right
ventricular myocardial infarction; hypertension |
| 4 | 48 | Anterior myocardial
infarction |
| 5 | 51 | Inferior and right
ventricular myocardial infarction; hypertension |
| 6 | 57 | Inferior and
posterior myocardial infarction |
| 7 | 57 | Anterior and
inferior myocardial infarction; hypertension |
|
| B, Samples used
for multiple reaction monitoring analysis |
|
| Patient
ID | Age
(years) |
Diagnosis |
|
| 8 | 56 | Anterior myocardial
infarction; hypertension; stomach cancer |
| 9 | 49 | Anterior myocardial
infarction; hepatitis C virus |
| 10 | 48 | Anterior myocardial
infarction |
| 11 | 51 | Anterior myocardial
infarction |
| 12 | 54 | Inferior and
posterior myocardial infarction; hypertension |
| 13 | 58 | Anterior myocardial
infarction |
| 14 | 59 | Anterior and
inferior myocardial infarction |
| 15 | 41 | Inferior and
posterior myocardial infarction; hypertension |
| 16 | 41 | Anterior myocardial
infarction |
| 17 | 47 | Inferior myocardial
infarction |
| 18 | 48 | inferior and right
ventricular Myocardial infarction; hypertension |
| 19 | 50 | Anterior myocardial
infarction; hypertension |
| 20 | 52 | Anterior, inferior
and right ventricular myocardial infarction; hypertension |
| 21 | 58 | Anterior and right
ventricular myocardial infarction; hypertension |
| 22 | 58 | Inferior myocardial
infarction; hypertension |
Sample collection
Midstream urine samples were collected from healthy
volunteers (control group) and patients with MI (treatment and MI
group). For the MI group, urine samples were obtained from patients
within 12 h of the first onset of MI. For the treatment group,
urine samples were collected from patients with MI at 1 week
following percutaneous coronary intervention (treatment group).
Urine samples from individuals belonging to the same group
(control, MI or treatment) were pooled to decrease individual
variability. The samples were centrifuged at 3,500 × g at 4°C for
15 min. Subsequently, the cells and debris were removed. Clarified
supernatants were stored at −80°C until further analysis.
Urinary protein extraction
Urine samples were precipitated with ethanol at 4°C
for 2 h, and proteins were collected by centrifugation at 12,000 ×
g for 30 min at 4°C. The pellets were resuspended in lysis buffer
containing 7 M urea, 2 M thiourea, 0.1 M dithiothreitol (DTT) and
50 mM TBS. Following centrifugation at 12,000 × g for 30 min at
4°C, supernatants were collected. The protein concentration of each
sample was determined using the Bradford method. The urine samples
of the individuals belonging to the same group (control, MI and
treatment) were pooled prior to further analysis.
Protein digestion
The urinary proteins were digested via the
filter-aided sample preparation approach combined with the
microwave-assisted protein preparation method, according to a
previous study (23). The proteins
were reduced with 20 mM DTT, alkylated with 50 mM 2-iodoacetamide
on a 10 kDa filter and washed with urea solution (containing 8 M
urea and 0.1 M TBS at pH 8.5) and 25 mM
NH4HCO3. The trypsin-to-protein ratio was
1:50 and the samples were subjected to high-heat microwave oven
irradiation for 1 min. Following digestion, the peptide mixtures
were desalted with an octadecyl (C18) solid phase extraction column
(Oasis HLB 3cc; 60 mg″ Extraction Cartridges; Waters Corporation,
Milford, MA) according to the manufacturer's protocol.
iTRAQ labeling
The digested peptides were labeled with the 4-plex
iTRAQ reagent (SCIEX, Framingham, MA, USA). Equal quantities of
control, MI, and treatment samples were mixed as an internal
standard. The internal standard, control, MI and treatment samples
were labeled with iTRAQ reagents 114, 115, 116 and 117,
respectively. Labeling was performed according to the
manufacturer's protocol (SCIEX). Subsequently, the four labeled
protein samples were mixed in equal amounts and lyophilized.
LC-MS/MS
The labeled samples were fractionated using a
high-pH offline reversed-phase liquid chromatography (RPLC) column
(column size, 4.6×250 mm; stationary phase, C18; pore size 3 µm;
Waters Corporation). Pooled iTRAQ-labeled samples (200 µg) were
loaded onto the column in buffer A1 (0.1% aqueous ammonia in water,
pH 10) and eluted with buffer B1 (0.1% aqueous ammonia in 10% water
and 90% acetonitrile; pH 10; flow rate, 0.8 ml/min) with a gradient
ranging from 5–25% for 60 min at room temperature using a Water
2690 HPLC system (Waters Corporation). The eluted peptides were
collected as 60 fractions, with one fraction collected per minute,
and were pooled to obtain 20 samples.
Subsequently, each sample was analyzed by
self-packing capillary online low-PH RPLC-MS/MS (column size, 75 µm
×100 mm; C18; pore size 3 µm). Samples (2 µl) were loaded onto the
column in buffer A (0.1% formic acid in water) and eluted with
buffer B (0.1% formic acid in acetonitrile; flow rate, 300 nl/min)
with a gradient ranging from 5–25% for 60 min at room temperature
using a Waters nanoAcquity system (Waters Corporation). A Triple
TOF 5600 (SCIEX) was used to collect the MS data. The MS data were
acquired using the following parameters: Positive ionization mode,
nitrogen gas, flow rate (10 l/min), temperature, 150°C, nebulizer
pressure, 10 psi, 30 data-dependent MS/MS scans per full scan, full
scans acquired at a resolution of 40,000, MS/MS scans acquired at a
resolution of 20,000, rolling collision energy, charge state
screening (including precursors with +2 to +4 charge state),
dynamic exclusion (exclusion duration 15 sec), an MS/MS scan range
of 100–1800 m/z and a scan time of 100 msec. Each sample was run
three times.
Database searches
The MS/MS spectra were searched against the
SwissProt human database (www.uniprot.org, 20,227 entries) using Mascot software
(version 2.3.02; Matrix Science, Ltd., London, UK). The parent and
fragment ion mass tolerances were 0.050 Da. The
carbamidomethylation of cysteine was set as a fixed modification,
and the number of miscleavage sites allowed was ≤2. Scaffold
software (version Scaffold_4.0.7, Proteome Software, Inc.,
Portland, OR, USA) was used to filter the results. Protein
identification was accepted at a false discovery rate (FDR)
<1.0% by analyzing the levels of proteins and peptides formed by
≥2 unique peptides. The identified proteins were quantified based
on iTRAQ reporter ion intensities of unique peptides. The proteins
containing quantification values in all channels in all three runs
were considered suitable for quantification.
Gene Ontology (GO) functional
analysis
All differentially expressed proteins were assigned
to their gene symbol according to the Panther database (http://www.pantherdb.org/) (24). Protein classification was performed
based on their functional annotation using GO according to the
cellular components, molecular functions and biological processes.
Multiple functional annotations were considered in the results.
Ingenuity pathway analysis (IPA)
All differentially expressed proteins of the urinary
proteomes were used for the pathway analysis. SwissProt accession
numbers were used as inputs for the IPA software (version 2.3;
Ingenuity Systems; Qiagen, Inc., Valencia, CA, USA). IPA software
categorizes gene products based on the cellular compartments and
indicates possible molecular, biochemical and biological functions.
Based on the number of proteins associated with a certain pathway
in the ingenuity pathway knowledge base, the significance of
pathways was calculated using the right-tailed Fisher's exact test.
The ratio of pathway enrichment was determined based on the
proportion of differential proteins vs. the total number of
proteins in a pathway.
MRM
MRM was used to validate the differentially
expressed proteins determined by iTRAQ. Data derived from a
spectral library of the urinary proteomics generated by
conventional LC-MS/MS using higher energy collision dissociation
were imported into Skyline software (version 1.1; MacCoss Lab of
Biological Mass Spectrometry; University of Washington, Seattle,
WA, USA) (25). The b and y ions
exceeding the m/z ratio of the respective doubly and triply
charged peptide precursors were considered in the analysis. In
total, ≤5 transitions per peptide were traced on a QTRAP 6500 mass
spectrometer (SCIEX) using the following parameters: Positive
ionization mode, nitrogen gas, flow rate (10 l/min), temperature,
150°C, nebulizer pressure, 10 psi. The optimal peptides for MRM
were selected using the following criteria: i) The peptide is
unique to a protein; ii) the peptide does not contain methionine,
asparagine or glutamine; iii) the peptide exhibits no
trypsine-associated miscleavage sites. The details of the
transitions (m/z) were presented in Table II.
| Table II.Transition for multiple reaction
monitoring analysis. |
Table II.
Transition for multiple reaction
monitoring analysis.
| Transition | MS | MS/MS | Time | DP | CE |
|---|
|
sp|P02768|ALBU_HUMAN.DLGEENFK.+2y6.light | 476.224539 | 723.330795 | 24.18 | 65.8 | 26.0 |
|
sp|P02768|ALBU_HUMAN.DLGEENFK.+2y5.light | 476.224539 | 666.309331 | 24.18 | 65.8 | 26.0 |
|
sp|P02768|ALBU_HUMAN.DLGEENFK.+2y4.light | 476.224539 | 537.266738 | 24.18 | 65.8 | 26.0 |
|
sp|P02768|ALBU_HUMAN.DLGEENFK.+2y3.light | 476.224539 | 408.224145 | 24.18 | 65.8 | 26.0 |
|
sp|P02768|ALBU_HUMAN.DLGEENFK.+2y2.light | 476.224539 | 294.181218 | 24.18 | 65.8 | 26.0 |
|
sp|P02768|ALBU_HUMAN.LVNEVTEFAK.+2y9.light | 575.311146 | 1036.530952 | 30.25 | 73.1 | 29.6 |
|
sp|P02768|ALBU_HUMAN.LVNEVTEFAK.+2y8.light | 575.311146 | 937.462538 | 30.25 | 73.1 | 29.6 |
|
sp|P02768|ALBU_HUMAN.LVNEVTEFAK.+2y7.light | 575.311146 | 823.41961 | 30.25 | 73.1 | 29.6 |
|
sp|P02768|ALBU_HUMAN.LVNEVTEFAK.+2y6.light | 575.311146 | 694.377017 | 30.25 | 73.1 | 29.6 |
|
sp|P02768|ALBU_HUMAN.LVNEVTEFAK.+2y5.light | 575.311146 | 595.308603 | 30.25 | 73.1 | 29.6 |
|
sp|P01008|ANT3_HUMAN.LPGIVAEGR.+2y8.light | 456.269084 | 798.446828 | 25.63 | 64.4 | 25.3 |
|
sp|P01008|ANT3_HUMAN.LPGIVAEGR.+2y7.light | 456.269084 | 701.394064 | 25.63 | 64.4 | 25.3 |
|
sp|P01008|ANT3_HUMAN.LPGIVAEGR.+2y6.light | 456.269084 | 644.3726 | 25.63 | 64.4 | 25.3 |
|
sp|P01008|ANT3_HUMAN.LPGIVAEGR.+2y5.light | 456.269084 | 531.288536 | 25.63 | 64.4 | 25.3 |
|
sp|P01008|ANT3_HUMAN.LPGIVAEGR.+2y4.light | 456.269084 | 432.220122 | 25.63 | 64.4 | 25.3 |
|
sp|P01008|ANT3_HUMAN.DDLYVSDAFHK.+2b3.light | 655.306592 | 344.145226 | 29.82 | 78.9 | 32.4 |
|
sp|P01008|ANT3_HUMAN.DDLYVSDAFHK.+2y8.light | 655.306592 | 966.467957 | 29.82 | 78.9 | 32.4 |
|
sp|P01008|ANT3_HUMAN.DDLYVSDAFHK.+2y7.light | 655.306592 | 803.404629 | 29.82 | 78.9 | 32.4 |
|
sp|P01008|ANT3_HUMAN.DDLYVSDAFHK.+2y6.light | 655.306592 | 704.336215 | 29.82 | 78.9 | 32.4 |
|
sp|P01008|ANT3_HUMAN.DDLYVSDAFHK.+2y4.light | 655.306592 | 502.277243 | 29.82 | 78.9 | 32.4 |
|
sp|P01024|CO3_HUMAN.DFDFVPPVVR.+2y8.light | 595.813856 | 928.525078 | 42.82 | 74.6 | 30.3 |
|
sp|P01024|CO3_HUMAN.DFDFVPPVVR.+2y7.light | 595.813856 | 813.498135 | 42.82 | 74.6 | 30.3 |
|
sp|P01024|CO3_HUMAN.DFDFVPPVVR.+2y6.light | 595.813856 | 666.429721 | 42.82 | 74.6 | 30.3 |
|
sp|P01024|CO3_HUMAN.DFDFVPPVVR.+2y5.light | 595.813856 | 567.361307 | 42.82 | 74.6 | 30.3 |
|
sp|P01024|CO3_HUMAN.DFDFVPPVVR.+2y4.light | 595.813856 | 470.308544 | 42.82 | 74.6 | 30.3 |
|
sp|P02763|A1AG1_HUMAN.TEDTIFLR.+2y7.light | 497.763831 | 893.472708 | 30.96 | 67.4 | 26.8 |
|
sp|P02763|A1AG1_HUMAN.TEDTIFLR.+2y6.light | 497.763831 | 764.430115 | 30.96 | 67.4 | 26.8 |
|
sp|P02763|A1AG1_HUMAN.TEDTIFLR.+2y5.light | 497.763831 | 649.403172 | 30.96 | 67.4 | 26.8 |
|
sp|P02763|A1AG1_HUMAN.TEDTIFLR.+2y4.light | 497.763831 | 548.355494 | 30.96 | 67.4 | 26.8 |
|
sp|P02763|A1AG1_HUMAN.TEDTIFLR.+2y3.light | 497.763831 | 435.27143 | 30.96 | 67.4 | 26.8 |
|
sp|P02763|A1AG1_HUMAN.SDVVYTDWK.+2y7.light | 556.766571 | 910.466895 | 29.91 | 71.7 | 28.9 |
|
sp|P02763|A1AG1_HUMAN.SDVVYTDWK.+2y6.light | 556.766571 | 811.398481 | 29.91 | 71.7 | 28.9 |
|
sp|P02763|A1AG1_HUMAN.SDVVYTDWK.+2y5.light | 556.766571 | 712.330067 | 29.91 | 71.7 | 28.9 |
|
sp|P02763|A1AG1_HUMAN.SDVVYTDWK.+2y4.light | 556.766571 | 549.266738 | 29.91 | 71.7 | 28.9 |
|
sp|P02763|A1AG1_HUMAN.SDVVYTDWK.+2y3.light | 556.766571 | 448.219060 | 29.91 | 71.7 | 28.9 |
|
sp|P04083|ANXA1_HUMAN.GLGTDEDTLIEILASR.+2y10.light | 851.946523 | 1130.641565 | 49.31 | 93.2 | 39.5 |
|
sp|P04083|ANXA1_HUMAN.GLGTDEDTLIEILASR.+2y9.light | 851.946523 | 1015.614622 | 49.31 | 93.2 | 39.5 |
|
sp|P04083|ANXA1_HUMAN.GLGTDEDTLIEILASR.+2y8.light | 851.946523 | 914.566943 | 49.31 | 93.2 | 39.5 |
|
sp|P04083|ANXA1_HUMAN.GLGTDEDTLIEILASR.+2y7.light | 851.946523 | 801.482879 | 49.31 | 93.2 | 39.5 |
|
sp|P04083|ANXA1_HUMAN.GLGTDEDTLIEILASR.+2y6.light | 851.946523 | 688.398815 | 49.31 | 93.2 | 39.5 |
|
sp|P59665|DEF1_HUMAN.IPAC[CAM]IAGER.+2y8.light | 493.758026 | 873.424713 | 21.87 | 67.1 | 26.6 |
|
sp|P59665|DEF1_HUMAN.IPAC[CAM]IAGER.+2y7.light | 493.758026 | 776.371949 | 21.87 | 67.1 | 26.6 |
|
sp|P59665|DEF1_HUMAN.IPAC[CAM]IAGER.+2y6.light | 493.758026 | 705.334835 | 21.87 | 67.1 | 26.6 |
|
sp|P59665|DEF1_HUMAN.IPAC[CAM]IAGER.+2y5.light | 493.758026 | 545.304186 | 21.87 | 67.1 | 26.6 |
|
sp|P59665|DEF1_HUMAN.IPAC[CAM]IAGER.+2y4.light | 493.758026 | 432.220122 | 21.87 | 67.1 | 26.6 |
|
sp|P02787|TRFE_HUMAN.DGAGDVAFVK.+2y8.light | 489.748181 | 806.440680 | 25.92 | 66.8 | 26.5 |
|
sp|P02787|TRFE_HUMAN.DGAGDVAFVK.+2y7.light | 489.748181 | 735.403566 | 25.92 | 66.8 | 26.5 |
|
sp|P02787|TRFE_HUMAN.DGAGDVAFVK.+2y6.light | 489.748181 | 678.382102 | 25.92 | 66.8 | 26.5 |
|
sp|P02787|TRFE_HUMAN.DGAGDVAFVK.+2y5.light | 489.748181 | 563.355159 | 25.92 | 66.8 | 26.5 |
|
sp|P02787|TRFE_HUMAN.DGAGDVAFVK.+2y4.light | 489.748181 | 464.286745 | 25.92 | 66.8 | 26.5 |
|
sp|Q9UBC9|SPRR3_HUMAN.VPEPGYTK.+2y7.light | 445.734543 | 791.393395 | 17.23 | 63.6 | 24.9 |
|
sp|Q9UBC9|SPRR3_HUMAN.VPEPGYTK.+2y6.light | 445.734543 | 694.340632 | 17.23 | 63.6 | 24.9 |
|
sp|Q9UBC9|SPRR3_HUMAN.VPEPGYTK.+2y5.light | 445.734543 | 565.298038 | 17.23 | 63.6 | 24.9 |
|
sp|Q9UBC9|SPRR3_HUMAN.VPEPGYTK.+2y4.light | 445.734543 | 468.245275 | 17.23 | 63.6 | 24.9 |
|
sp|Q9UBC9|SPRR3_HUMAN.VPEPGYTK.+2y3.light | 445.734543 | 411.223811 | 17.23 | 63.6 | 24.9 |
|
sp|Q9UBC9|SPRR3_HUMAN.VPVPGYTK.+2y7.light | 430.747453 | 761.419216 | 20.95 | 62.5 | 24.4 |
|
sp|Q9UBC9|SPRR3_HUMAN.VPVPGYTK.+2y6.light | 430.747453 | 664.366452 | 20.95 | 62.5 | 24.4 |
|
sp|Q9UBC9|SPRR3_HUMAN.VPVPGYTK.+2y5.light | 430.747453 | 565.298038 | 20.95 | 62.5 | 24.4 |
|
sp|Q9UBC9|SPRR3_HUMAN.VPVPGYTK.+2y4.light | 430.747453 | 468.245275 | 20.95 | 62.5 | 24.4 |
|
sp|Q9UBC9|SPRR3_HUMAN.VPVPGYTK.+2y3.light | 430.747453 | 411.223811 | 20.95 | 62.5 | 24.4 |
|
sp|Q8WWA0|ITLN1_HUMAN.EWTC[CAM]SSSPSLPR.+2y10.light | 703.822083 | 1091.514984 | 31.53 | 82.4 | 34.2 |
|
sp|Q8WWA0|ITLN1_HUMAN.EWTC[CAM]SSSPSLPR.+2y9.light | 703.822083 | 990.467306 | 31.53 | 82.4 | 34.2 |
|
sp|Q8WWA0|ITLN1_HUMAN.EWTC[CAM]SSSPSLPR.+2y8.light | 703.822083 | 830.436657 | 31.53 | 82.4 | 34.2 |
|
sp|Q8WWA0|ITLN1_HUMAN.EWTC[CAM]SSSPSLPR.+2y7.light | 703.822083 | 743.404629 | 31.53 | 82.4 | 34.2 |
|
sp|Q8WWA0|ITLN1_HUMAN.EWTC[CAM]SSSPSLPR.+2y6.light | 703.822083 | 656.372600 | 31.53 | 82.4 | 34.2 |
|
sp|Q9UBR2|CATZ_HUMAN.VGDYGSLSGR.+2y9.light | 505.748713 | 911.421735 | 21.84 | 68.0 | 27.1 |
|
sp|Q9UBR2|CATZ_HUMAN.VGDYGSLSGR.+2y8.light | 505.748713 | 854.400272 | 21.84 | 68.0 | 27.1 |
|
sp|Q9UBR2|CATZ_HUMAN.VGDYGSLSGR.+2y7.light | 505.748713 | 739.373329 | 21.84 | 68.0 | 27.1 |
|
sp|Q9UBR2|CATZ_HUMAN.VGDYGSLSGR.+2y6.light | 505.748713 | 576.310000 | 21.84 | 68.0 | 27.1 |
|
sp|Q9UBR2|CATZ_HUMAN.VGDYGSLSGR.+2y5.light | 505.748713 | 519.288536 | 21.84 | 68.0 | 27.1 |
|
sp|P80370|DLK1_HUMAN.C[CAM]PAGFIDK.+2y7.light | 454.220745 | 747.403566 | 21.96 | 64.2 | 25.2 |
|
sp|P80370|DLK1_HUMAN.C[CAM]PAGFIDK.+2y6.light | 454.220745 | 650.350802 | 21.96 | 64.2 | 25.2 |
|
sp|P80370|DLK1_HUMAN.C[CAM]PAGFIDK.+2y5.light | 454.220745 | 579.313689 | 21.96 | 64.2 | 25.2 |
|
sp|P80370|DLK1_HUMAN.C[CAM]PAGFIDK.+2y3.light | 454.220745 | 375.223811 | 21.96 | 64.2 | 25.2 |
|
sp|P80370|DLK1_HUMAN.C[CAM]PAGFIDK.+2y2.light | 454.220745 | 262.139747 | 21.96 | 64.2 | 25.2 |
|
sp|P02647|APOA1_HUMAN.DLATVYVDVLK.+2y9.light | 618.347715 | 1007.577354 | 44.71 | 76.2 | 31.1 |
|
sp|P02647|APOA1_HUMAN.DLATVYVDVLK.+2y9.light | 618.347715 | 1007.577354 | 44.71 | 76.2 | 31.1 |
|
sp|P02647|APOA1_HUMAN.DLATVYVDVLK.+2y9.light | 618.347715 | 1007.577354 | 44.71 | 76.2 | 31.1 |
|
sp|P02647|APOA1_HUMAN.DLATVYVDVLK.+2y9.light | 618.347715 | 1007.577354 | 44.71 | 76.2 | 31.1 |
|
sp|P02647|APOA1_HUMAN.DLATVYVDVLK.+2y9.light | 618.347715 | 1007.577354 | 44.71 | 76.2 | 31.1 |
A total of 15 patients with MI and 15 healthy
patients were used in the MRM confirmation group. In total, ~200 µg
urine protein was digested in lysis buffer and centrifuged at
14,000 × g for 30 min at 4°C in an ultracentrifugation tube, in
order to purify proteins >10,000 Da. Samples (2 µg) were loaded
onto a self-packed C18 RP capillary column (column size, 75 µm ×
100 mm; C18; pore size 3 µm) with buffer A (0.1% formic acid +
99.9% H2O). The peptides were eluted with 5–30% buffer B
(0.1% formic acid, 99.9% acetonitrile; flow rate, 300 nl/min) for
60 min at room temperature using an Eksigent nanoLC 400 system
(SCIEX). Each sample was run three times. All MS data was imported
into Skyline (version Scaffold_3.6.0; MacCoss Lab of Biological
Mass Spectrometry; University of Washington), which was used for
further visualization, transition detection and abundance
calculations.
Combined analysis of proteomics
studies
To investigate proteins reported as differentially
expressed in association with MI, the results from 14 previous
proteomics studies, including those investigating expression in
serum/plasma, tissue and platelets, were combined and analyzed, and
compared with the findings of the urine analysis from the present
study (10–16,26–32).
Statistical analysis
Statistical analyses were performed using the SPSS
(version 19.0; IBM Corp., Armonk, NY, USA) statistical software.
One-way analysis of variance (ANOVA) was used to analyze the
LC-MS/MS results from control, MI and MI treatment groups, and to
examine the significantly differentially expressed proteins.
Following ANOVA, pairwise comparisons were performed using multiple
t-tests with Bonferroni correction to investigate the proteins
differentially expressed between the MI (or treatment) and control.
The proteins of the urinary proteome exhibiting a fold change >2
and P<0.05 were considered differentially expressed. Proteins
with a coefficient of variation (CV) >0.3 were excluded from
iTRAQ quantification. The MRM results for the control, MI and
treatment groups were quantified and analyzed via ANOVA followed by
a post hoc test with Bonferroni correction. Scatter plots were
generated using Graphpad Prism 5 software (GraphPad Software, Inc.,
La Jolla, CA, USA). In MRM analysis, the protein panels with a
diagnostic potential identified following MRM verification were
investigated via binary logistic regression analysis based on
transition intensity, and receiver operating characteristic (ROC)
curves were generated. The ROC curve was generated by plotting the
true positive rate against the false positive rate at various
threshold settings. The sensitivity and specificity for each
patient and the ROC area under the curve (AUC) were calculated
(33). The correlation analysis
was performed using Pearson's correlation test. The diagnostic
sensitivity and specificity of each biomarker were obtained from
the best operating point of the curve. The proteins exhibiting a
ROC AUC >0.8 were combined to calculate the total sensitivity
and specificity for the diagnosis of MI (34).
Results
Experimental design
The research design is presented in Fig. 1. MI urine samples were obtained
from patients within 12 h of the first onset of MI (MI group). To
obtain sensitive diagnostic biomarkers, urine samples from healthy
volunteers were used as the control. To obtain biomarkers for
monitoring the disease process and the therapeutic effect of the
surgical treatment, urine samples were collected from patients with
MI at 1 week after percutaneous coronary intervention (treatment
group). The urine samples of the individuals belonging to the same
group (control, MI or treatment) were pooled to decrease individual
variability. High-pH offline RPLC and low-pH online RPLC-MS/MS
techniques were used to increase the peptide separation efficiency.
To obtain reliable quantitative results, each sample was analyzed
three times. The differentially expressed proteins from the urinary
proteomes were analyzed to identify potential biomarkers of MI.
Differentially expressed proteins were analyzed using the
combination of GO and IPA analyses, and the expression levels of
the candidate biomarkers were confirmed by MRM analysis.
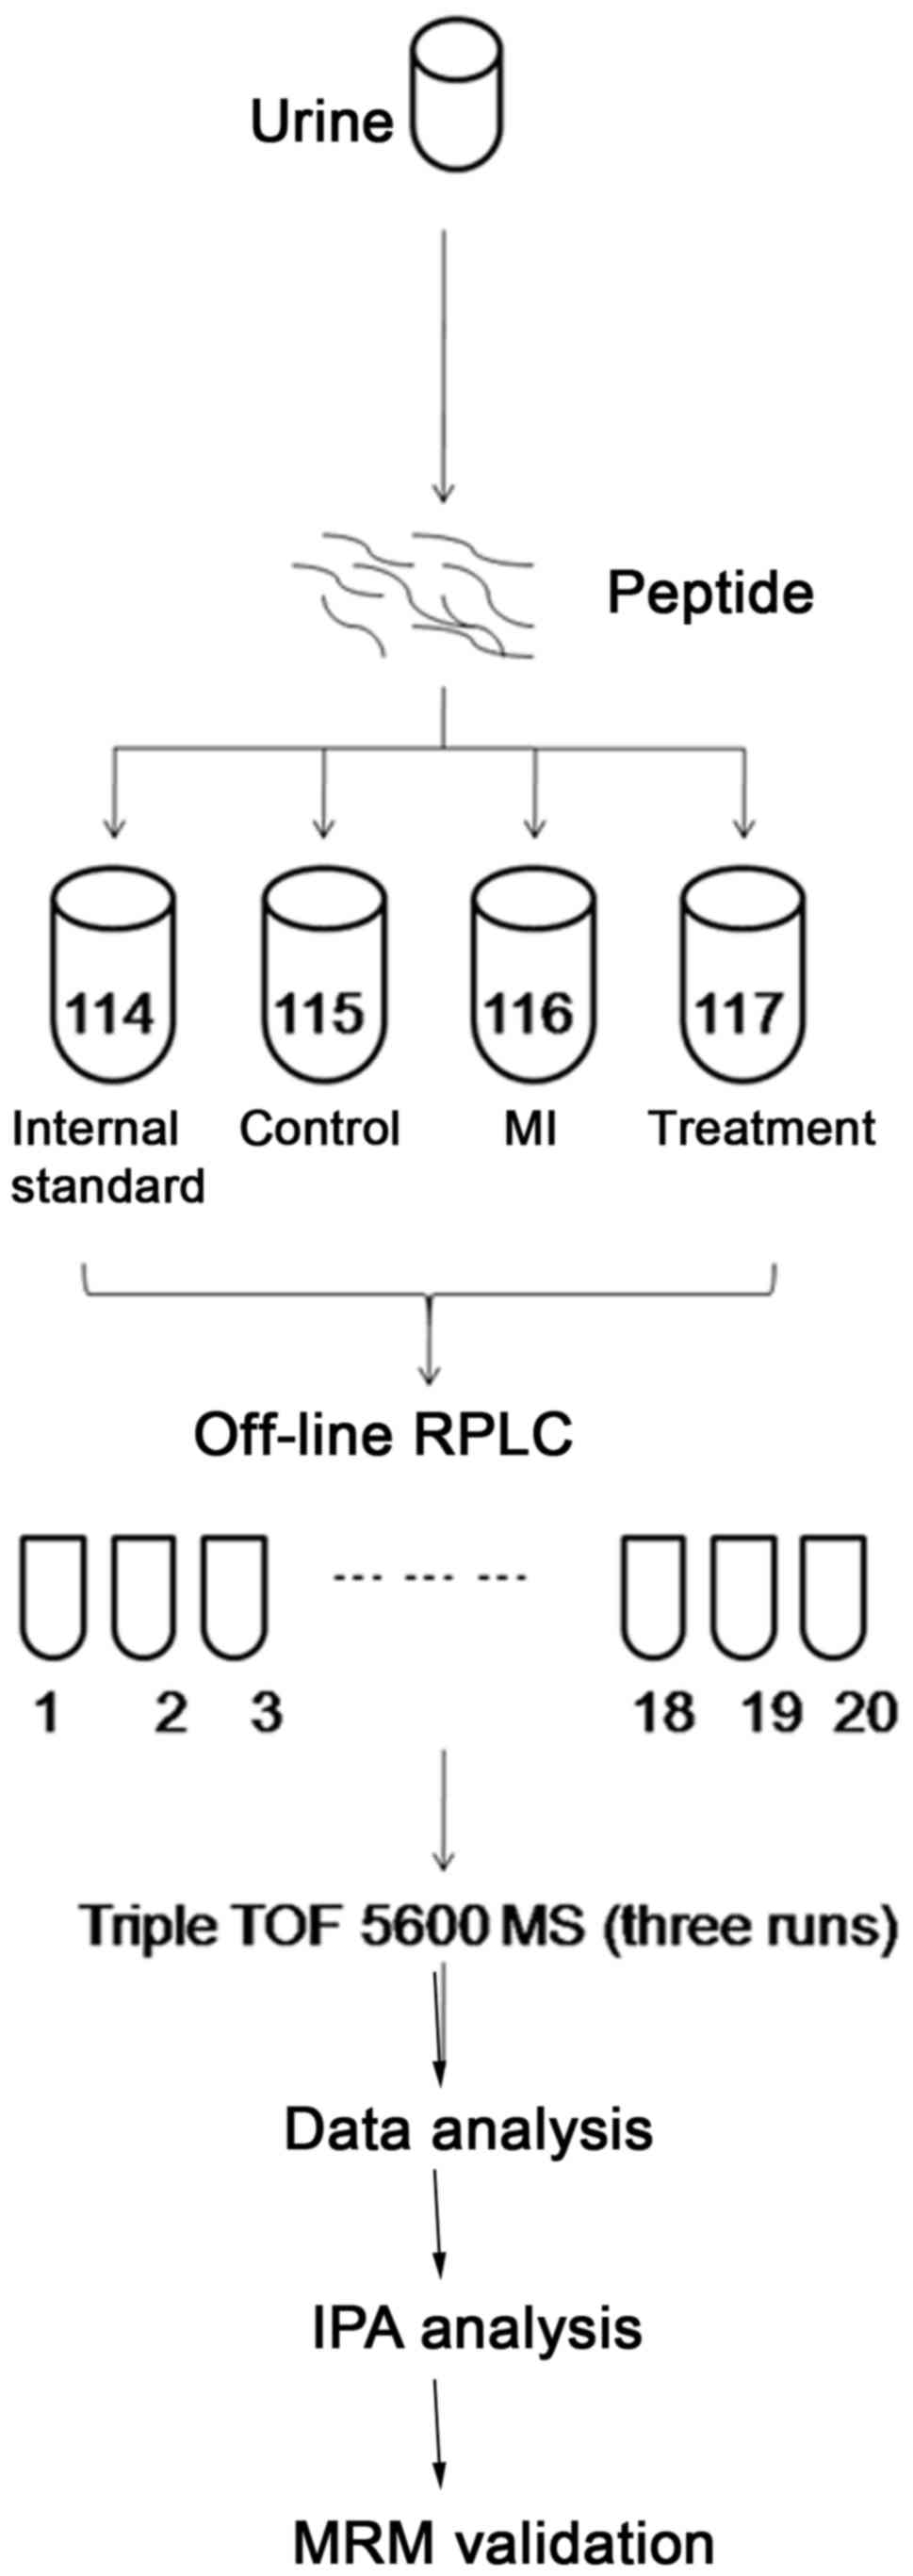 | Figure 1.Workflow of the proteomics experiment
using iTRAQ labeling and 2D LC-MS/MS for biomarker identification
and verification. Urine samples collected within 12 h of
first-onset MI, 1 week following surgical treatment and from seven
healthy subjects were digested and pooled using equal amounts of
each sample to generate an internal standard. Following iTRAQ
labeling, urinary peptides were analyzed by 2D-LC-MS three times.
The MS results were analyzed using the Swiss-Prot human database to
obtain quantitative data. Gene ontology analysis and IPA were
performed to identify pathological alterations associated with MI.
Selected differentially expressed proteins were further validated
by MRM analysis. iTRAQ, isobaric tags for relative and absolute
quantitation; 2D, two-dimensional; LC, liquid chromatography; MS,
mass spectrometry; MS/MS, tandem MS; MI, myocardial infarction; RP,
reversed-phase; RPLC, reversed-phase liquid chromatography; TOF,
time of flight; IPA, ingenuity pathway analysis; MRM, multiple
reaction monitoring. |
Qualitative and quantitative results
of the urinary proteome
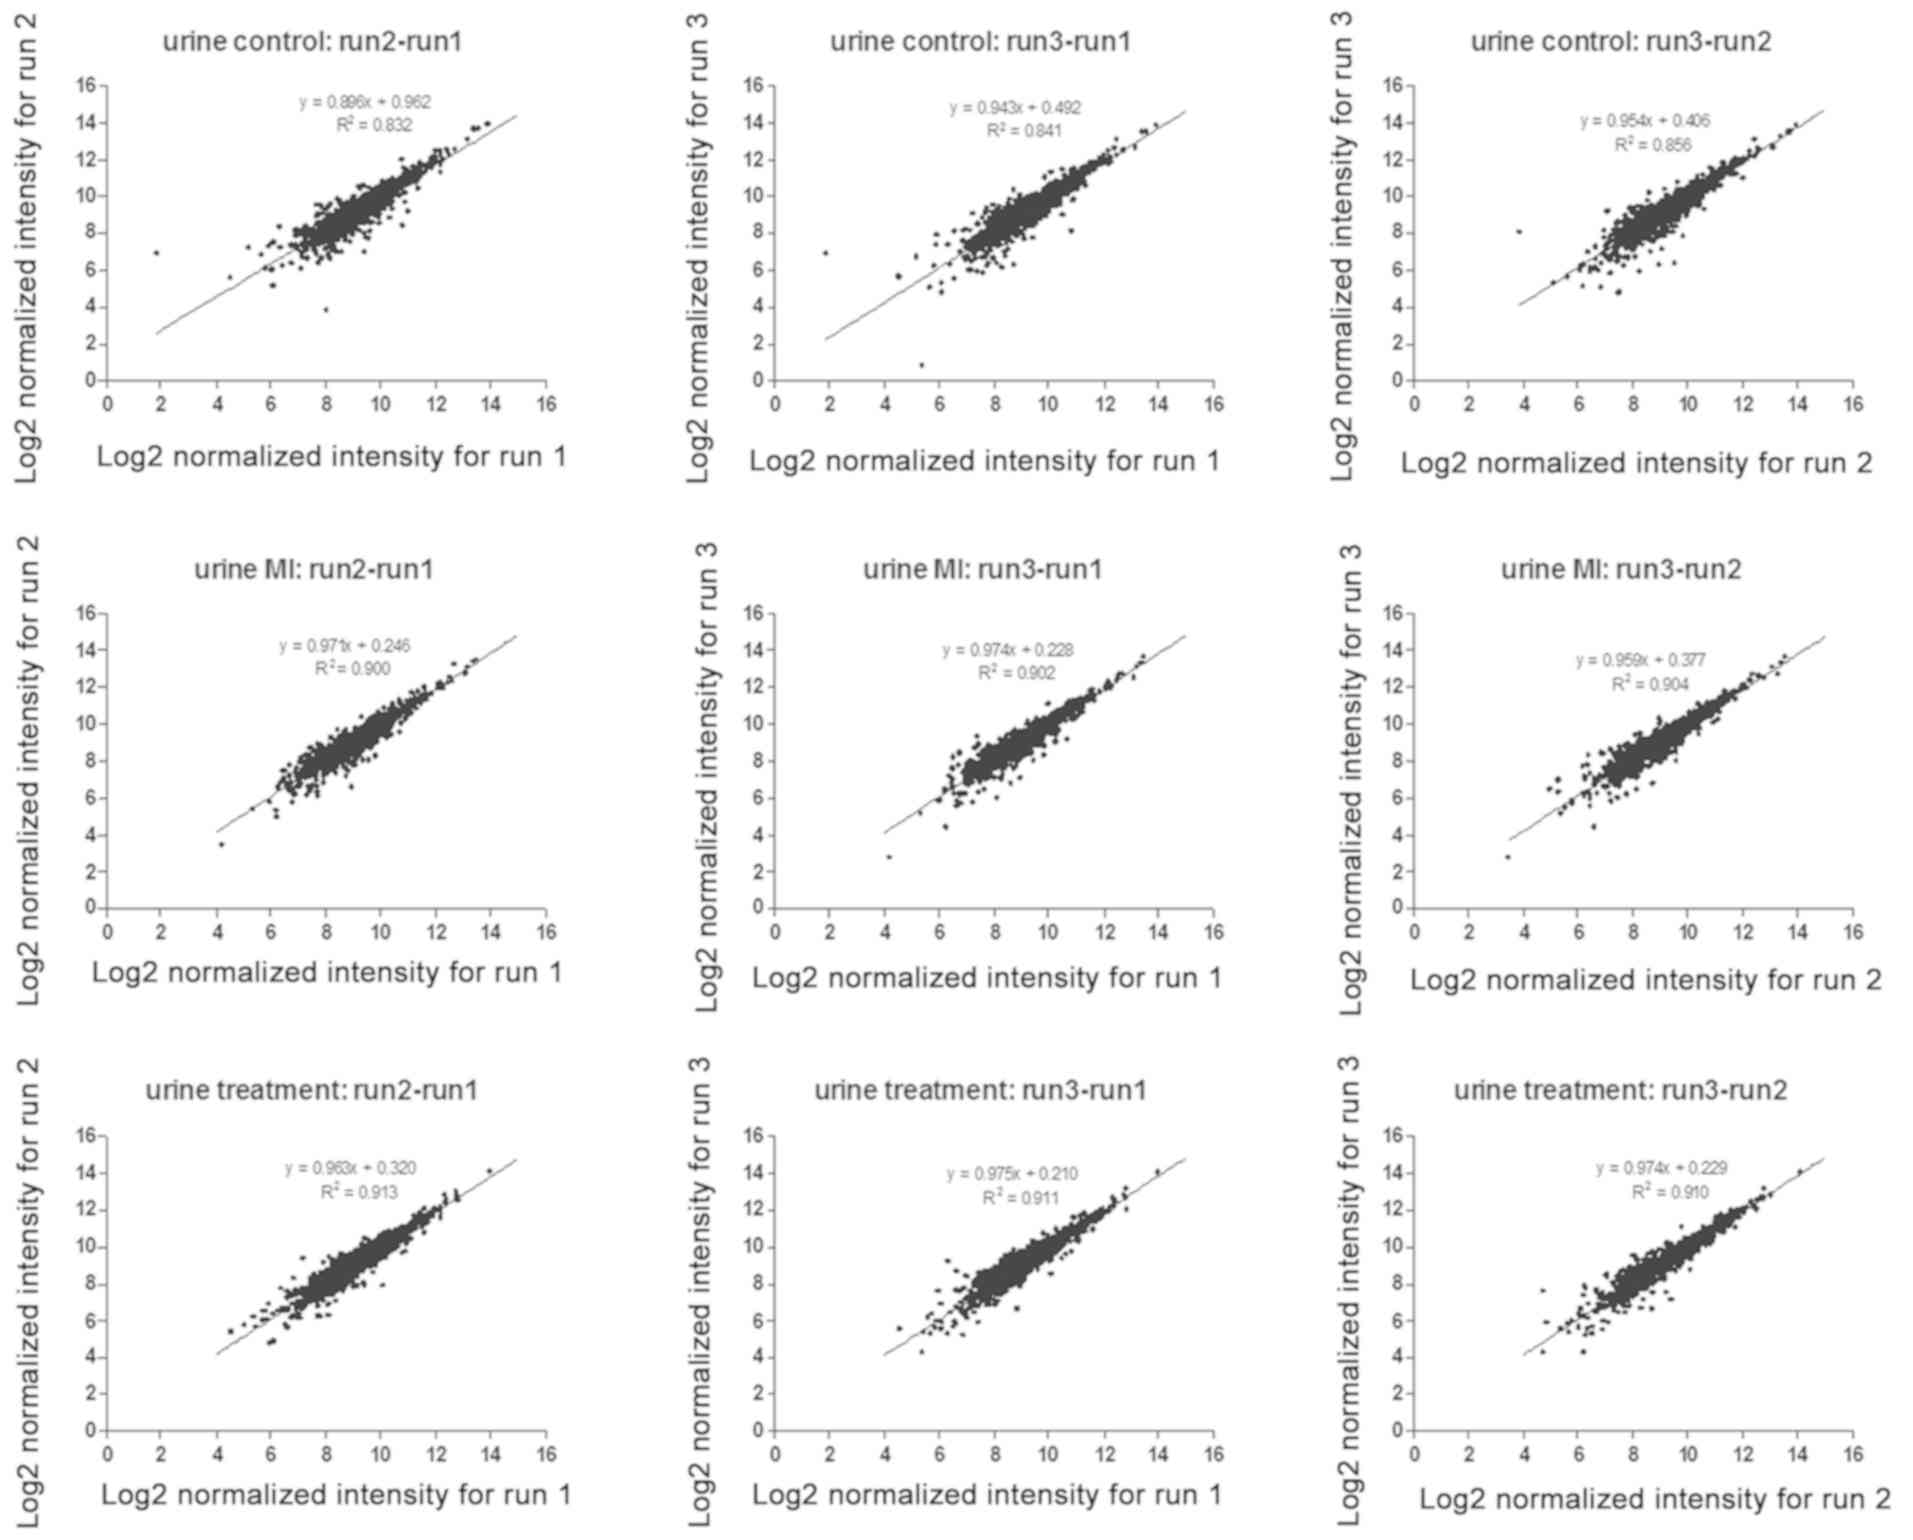
In the analysis of the urinary proteome, 2,086
proteins were identified and the common ones (1,684) in three runs
were used for quantification (Table
III). To examine the repeatability of the present experimental
results, the correlations between the normalized intensities from
the quantified proteins of any two runs were analyzed (Fig. 2). The average Pearson correlation
coefficient (R2) was 0.89, which suggested the
reliability and the repeatability of the LC-MS/MS method.
Additionally, the CVs of ~94% of the analyzed proteins were
<0.3. To obtain accurate quantitative results, proteins with a
CV >0.3 were excluded from the analysis of differentially
expressed proteins. In total, 1,458 urinary proteins were used to
screen the potential biomarkers associated with MI.
| Table III.Numbers of identified proteins,
peptides, spectrums and the average numbers of identifications for
three analyses. |
Table III.
Numbers of identified proteins,
peptides, spectrums and the average numbers of identifications for
three analyses.
| A, Qualitative
analysis |
|---|
|
|---|
| Measurement | Proteins (n) | Peptides (n) | Spectrum |
|---|
| Total number | 2,086 | 14,780 | 117062 |
| Average
identification of three run | 2,005 | 10,926 |
39021 |
|
| B, Quantitative
analysis |
|
|
Measurement | Proteins
(n) | Peptides
(n) |
Spectrum |
|
| Total no. | 1,684 | 13,358 | 111006 |
| Average
identification of three run | 1,684 | 10,032 |
37604 |
Differentially expressed proteins in
the urinary proteome
To define the threshold for differentially expressed
proteins, the intrasample quantitative FDRs were calculated by
comparing the quantitative results between any two runs within one
sample. Following the analysis of proteins exhibiting a fold change
>2 in the urinary proteome, the resulting FDRs were 0%.
Therefore, the thresholds selected to determine differentially
expressed proteins in the urinary proteome were: Fold change >2
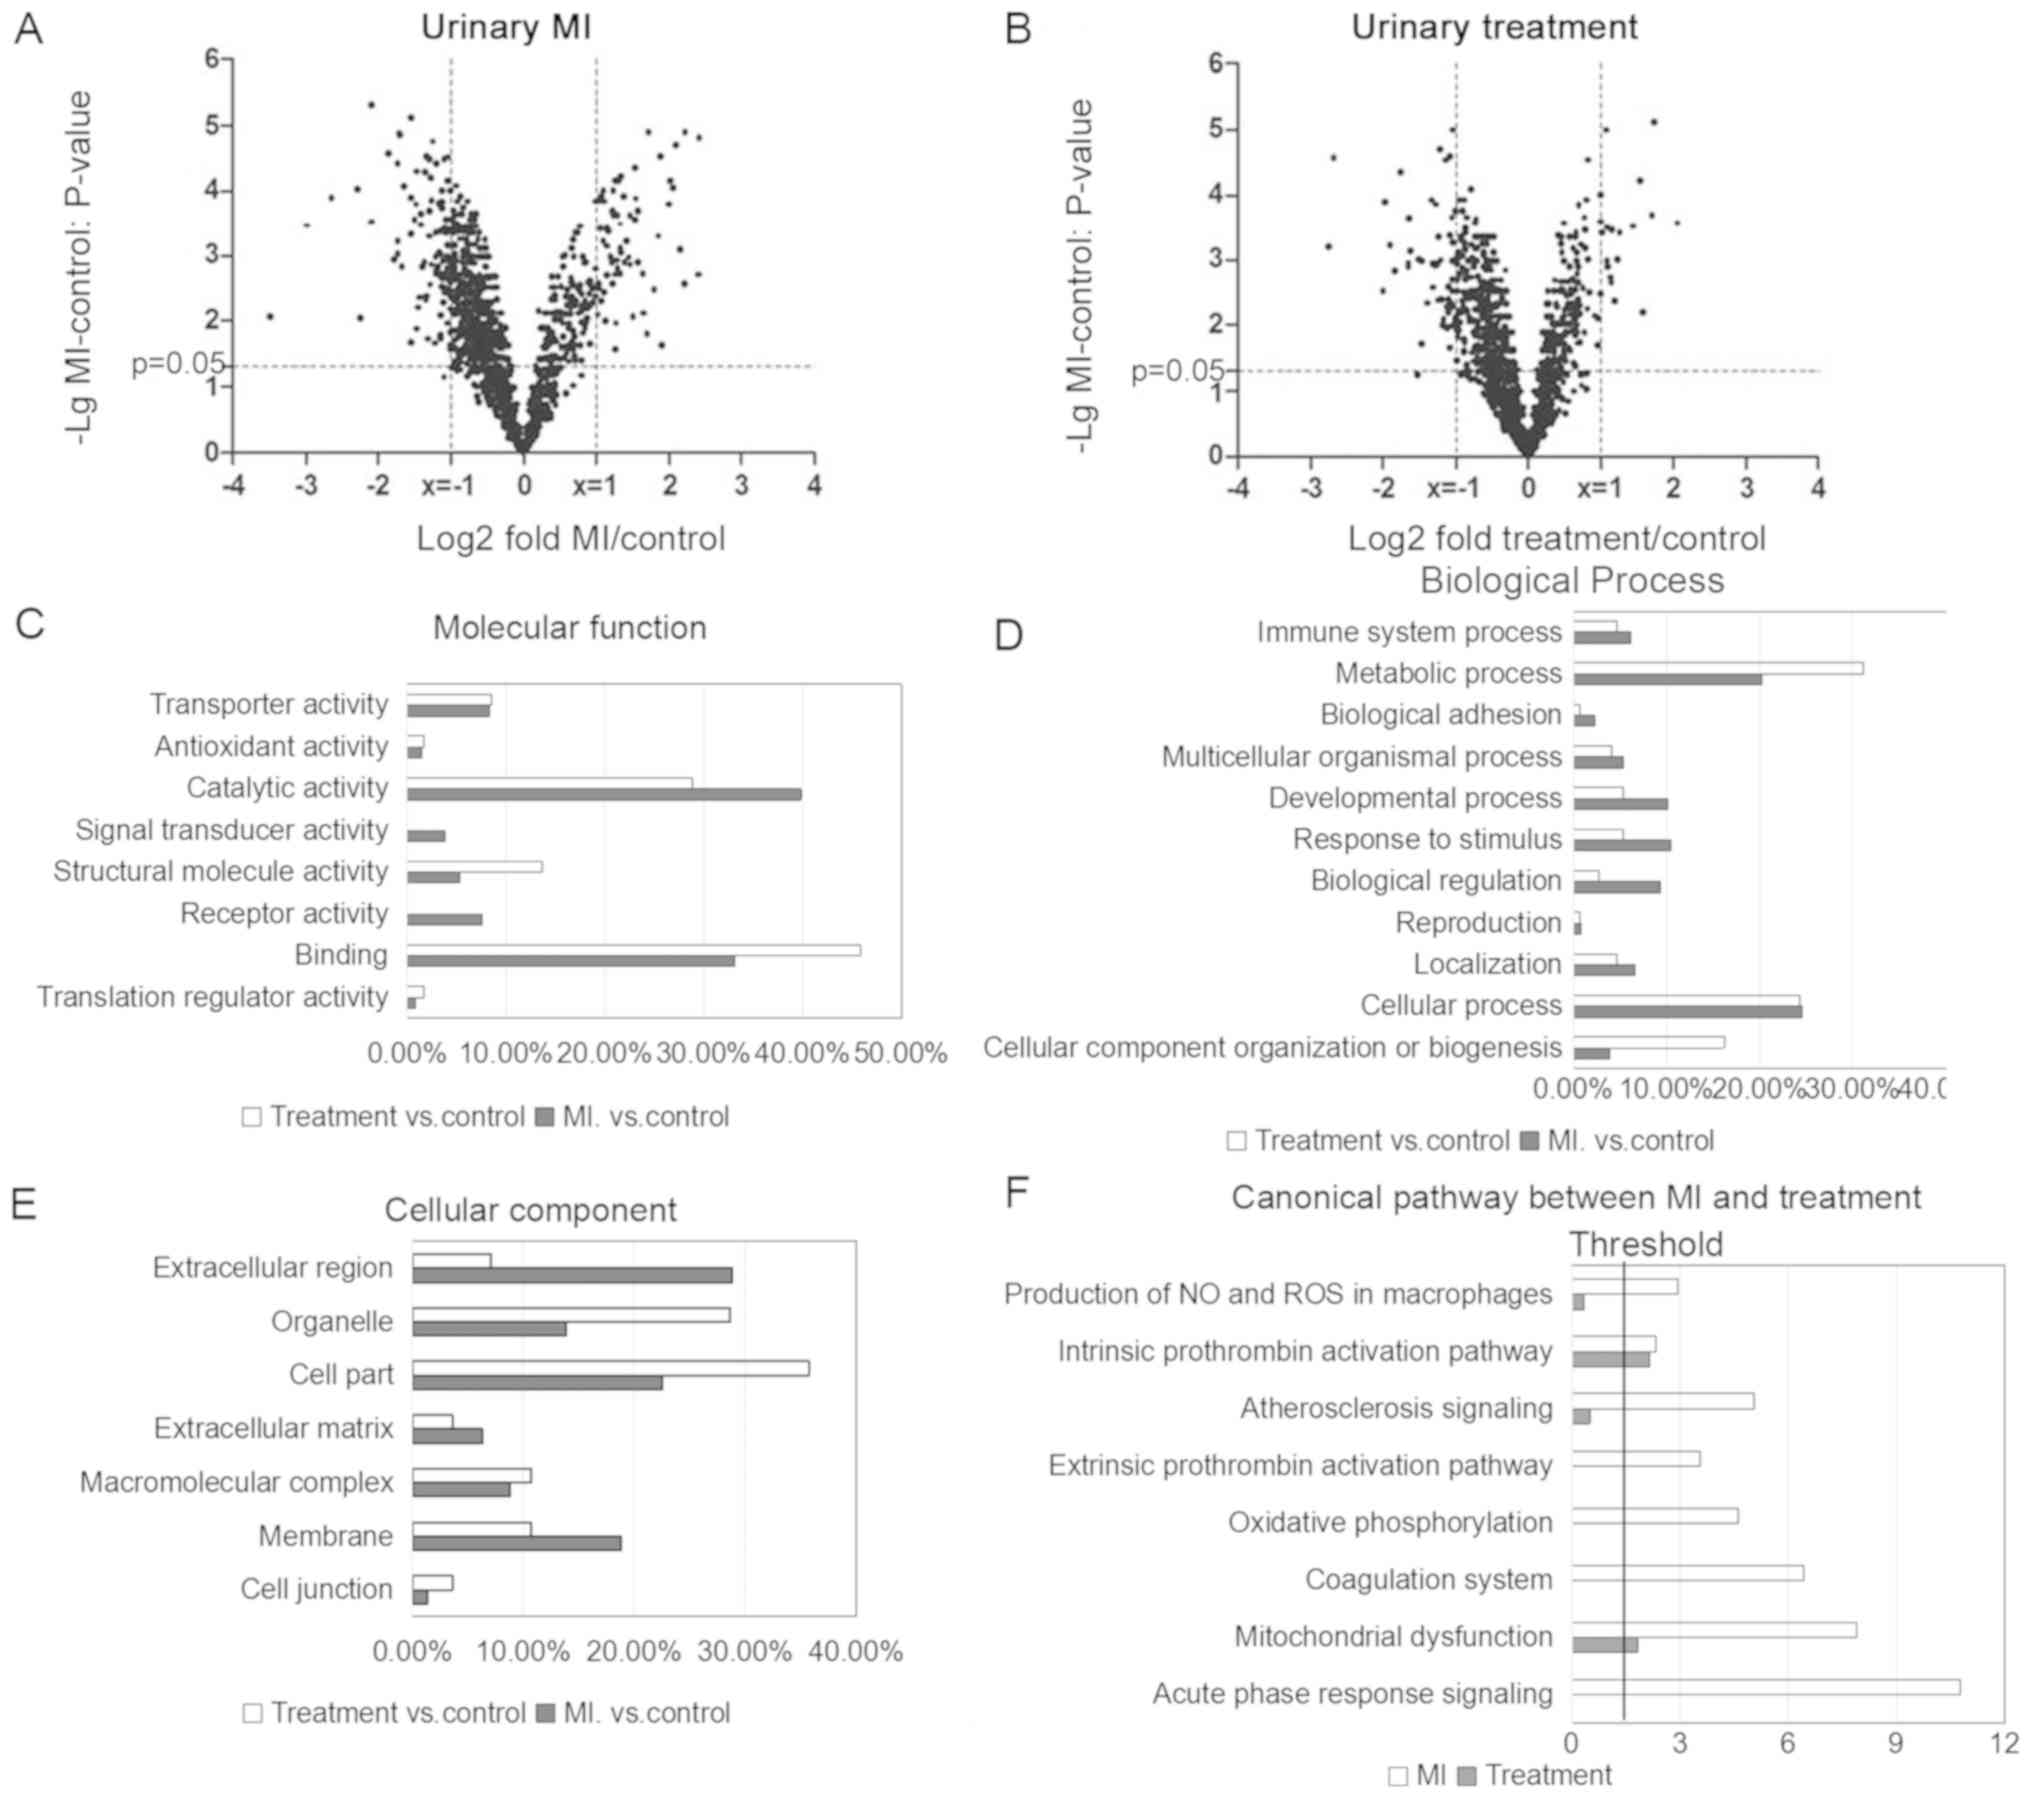
and P<0.05 (using a Bonferroni correction). The distributions of
the total quantified proteins in the MI vs. control comparison and
in the treatment vs. control comparison are presented as volcano
plots of the corresponding fold change (log2 scale)
against the transformed (-log10 scale) P-value in the
urinary proteome (Fig. 3A and B).
A total of 167 and 66 urinary proteins (data not shown) were
defined as differentially expressed in the MI and treatment groups,
respectively.
GO annotation and IPA analysis
Data enrichment analysis was performed using IPA
software and GO annotation. In the ‘molecular function’ category,
the proteins enriched in the MI group exhibited ‘receptor activity’
and ‘catalytic activity’ functions (Fig. 3C). In the ‘biological process’
category, proteins involved in ‘metabolic process’ exhibited
decreased levels of expression in the MI group compared with the
treatment group, and the ‘response to stimulus’ term was enriched
in the MI group (Fig. 3D). In the
‘cellular component’ category, differentially expressed proteins in
the MI group were enriched in ‘extracellular region’ and ‘membrane’
compared with the treatment group (Fig. 3E). Affecting the levels of proteins
in a certain subcellular localization and influencing the levels of
proteins involved in a certain molecular function following MI may
cause a dysregulation of the cellular metabolism, leading to
pathological alterations.
IPA analysis suggested that eight pathways were
significantly associated with MI vs. treatment (Fig. 3F). ‘Acute phase response signaling’
was the most enriched pathway in MI samples
(P=1.73×10⁻¹¹; ratio=0.086). The ‘atherosclerosis
signaling’ pathway (P=8.90×10⁻⁶; ratio=0.0645) was
enriched in the MI group; however, it was not significantly
enriched in the treatment group (P=0.32; ratio=0.00806).
Furthermore, coagulation-associated pathways, including the
‘intrinsic prothrombin activation’(enrichment in the MI group:
P=4.68×10⁻³; ratio=0.0732; enrichment in the treatment
group: P=7.27×10⁻³; ratio=0.0488) and the ‘extrinsic
prothrombin activation’ pathways (enrichment in the MI group:
P=2.86×10⁻⁴; ratio=0.188), and cell
metabolism-associated pathways, including the ‘mitochondrial
dysfunction’ pathway (enrichment in the MI group:
P=1.27×10⁻⁸; ratio=0.073; enrichment in the treatment
group: P=1.49×10⁻²; ratio=0.018), exhibited an increased
enrichment in the MI group compared with the treatment group (data
not shown).
Confirmation of differentially
expressed proteins using MRM
According to IPA, the ‘atherosclerosis signaling’
pathway, coagulation-associated pathways and ‘acute phase response’
signaling pathway were involved in MI. Serum albumin (ALBU),
antithrombin-III (ANT3), α-1-acid glycoprotein 1 (A1AG1),
apolipoprotein A-I, complement C3 (CO3) and serum transferrin
(TRFE) are important proteins in the identified pathways (35–41).
Annexin A1 (ANXA1), neutrophil defensin 1 (DEF1) and intelectin-1
(ITLN1) were previously observed to be involved in the inflammatory
response (42–45), and ANXA1 may have a role in the
tissue damage and protection following ischemia-reperfusion (I/R)
injury in the heart (42,43). Protein δ homolog 1 (DLK1) is
involved in the Notch pathway, affecting cardiac sympathetic
reinnervation in rats following MI (46). Small proline-rich protein 3 (SPRR3)
and cathepsin Z (CATZ) were upregulated and downregulated in the MI
group, respectively, and the protein expression levels of these two
factors were restored following surgical treatment. However, to the
best of our knowledge, the present study is the first to describe
an association between these two proteins and MI.
The aforementioned 12 differentially expressed
proteins were used for the MRM validation. In total, 16 peptides
derived from these 12 proteins were analyzed using the MRM
approach. The transition lists of all 16 peptides are presented in
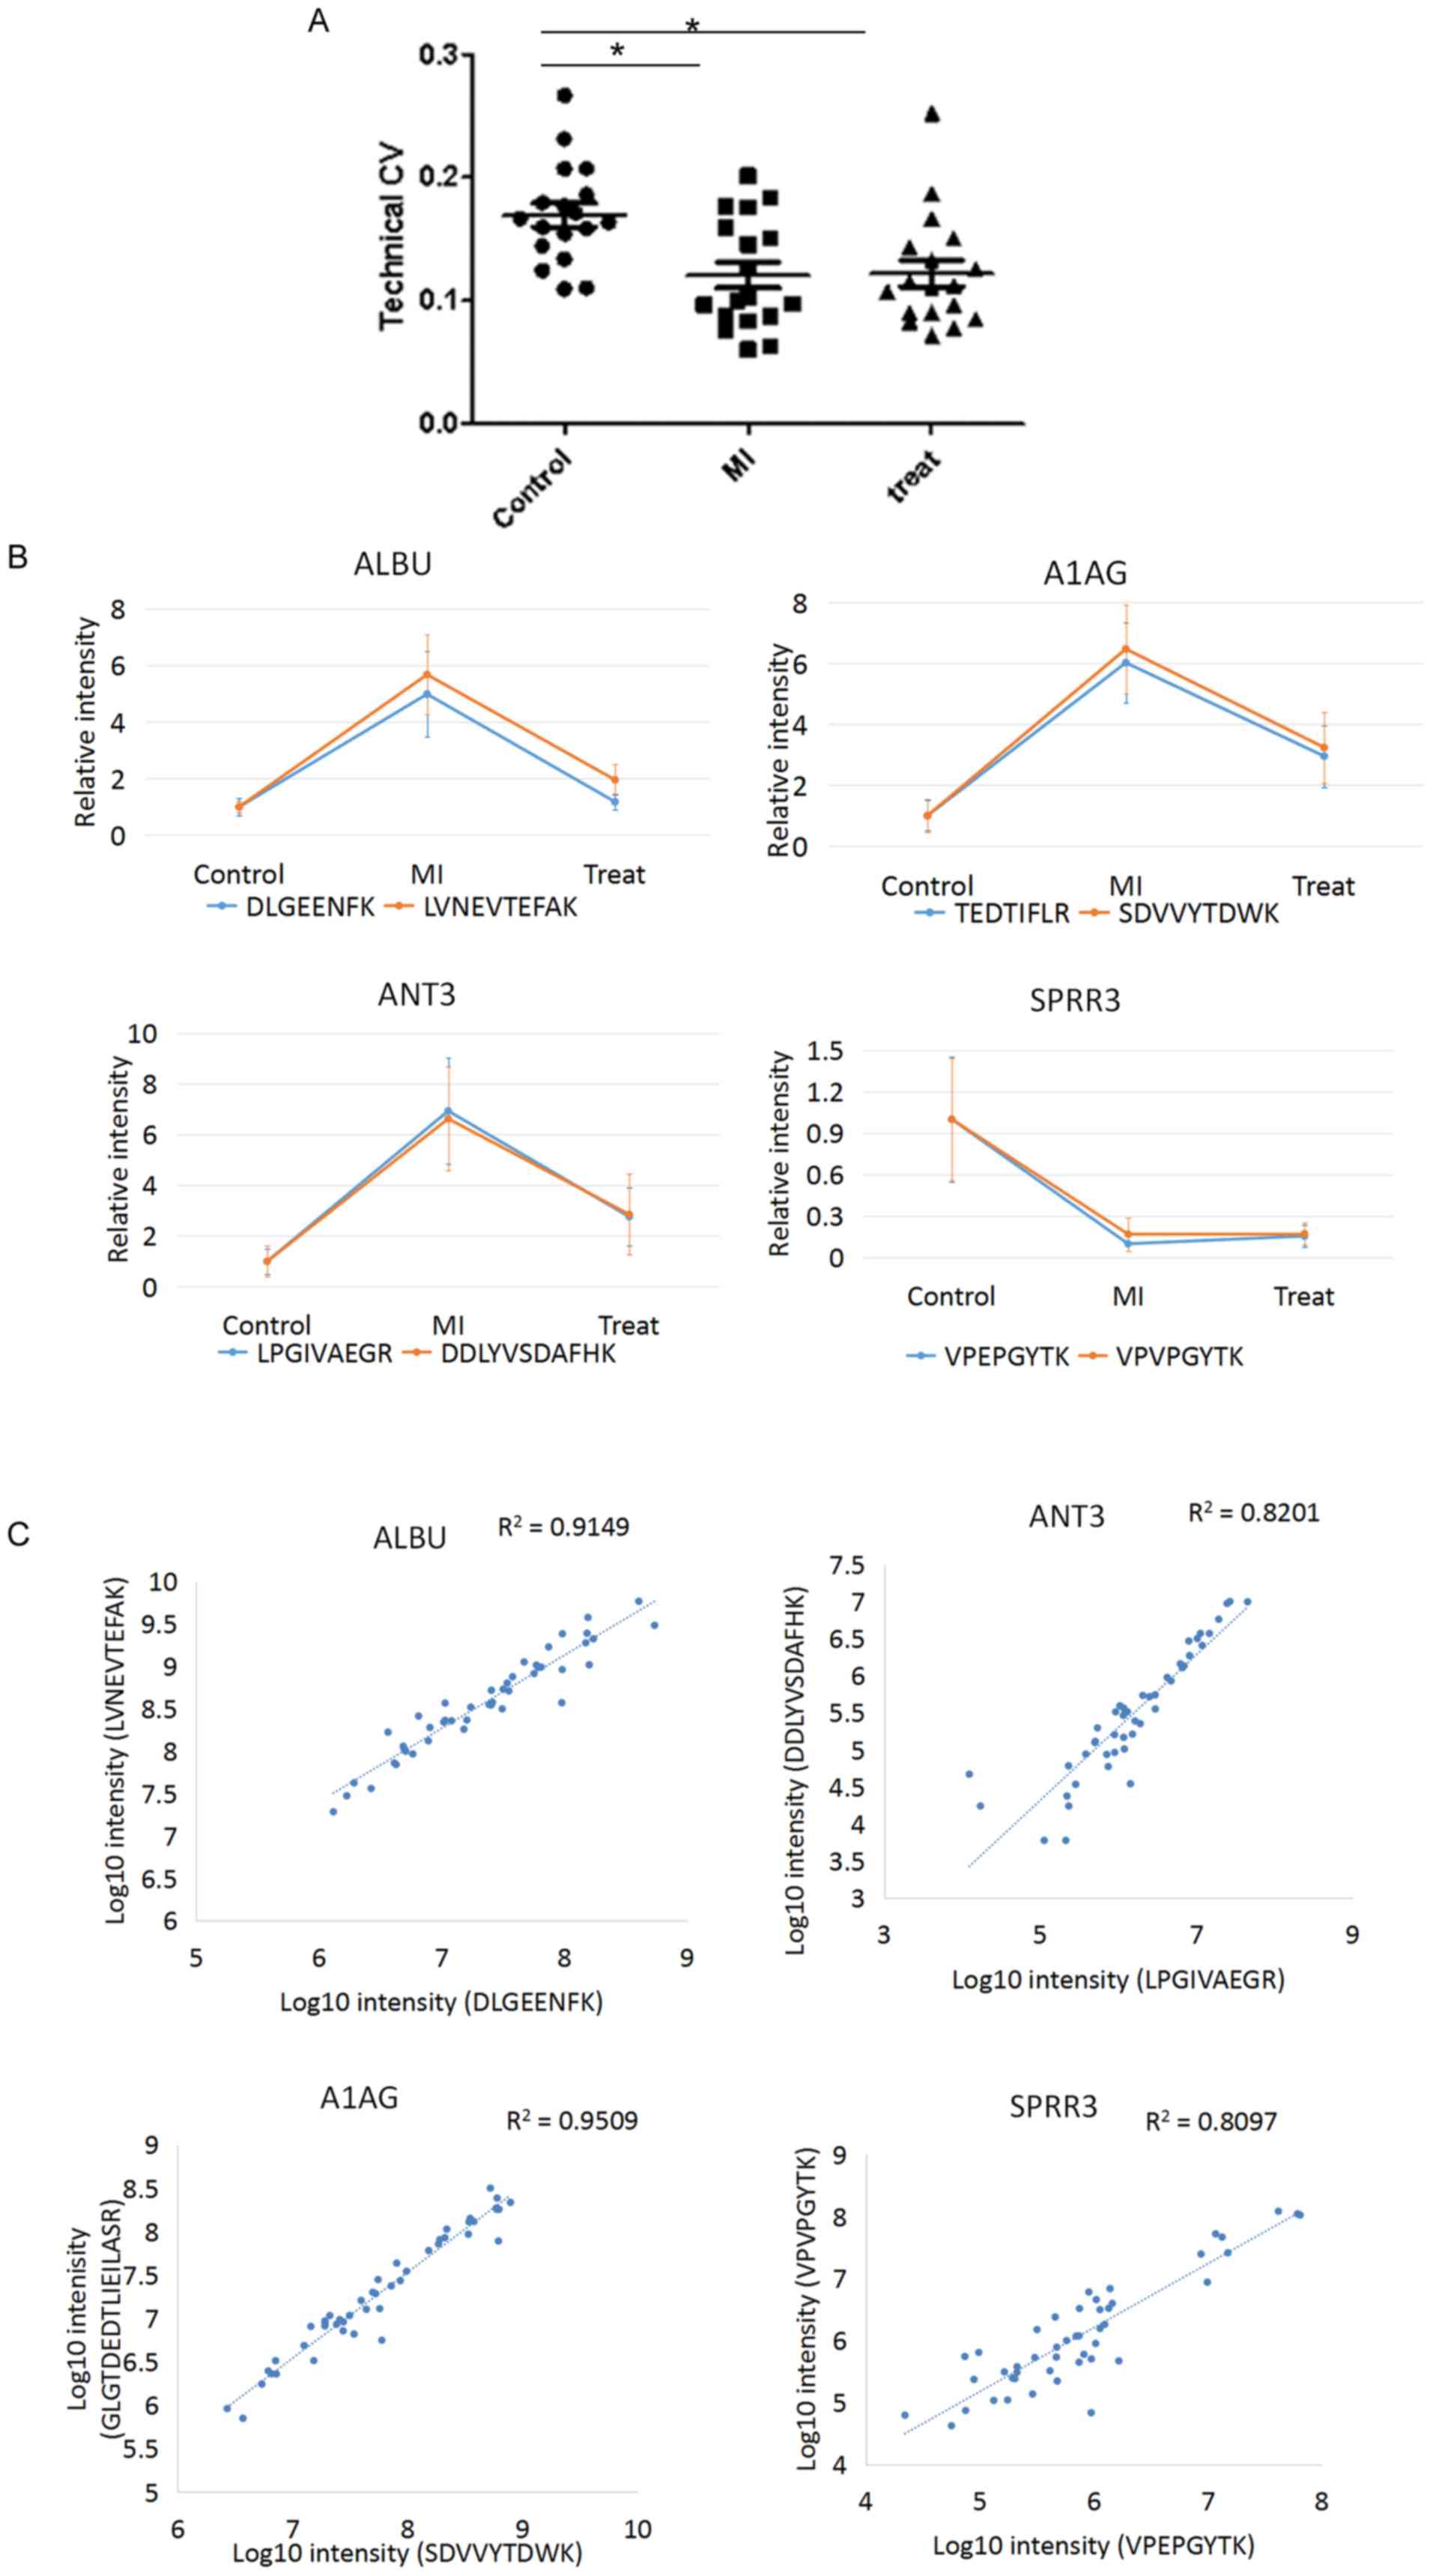
Table II. The technical CVs were
calculated for each peptide. The median technical CVs were 16.4,
10.0 and 11.1% in the control, MI and treatment groups,
respectively, indicating high technical reproducibility (Fig. 4A). In total, four proteins (ALBU,
ANT3, A1AG and SPRR3) presented two peptides each, and these eight
peptides were used for MRM quantification. The two peptides
corresponding to a single protein exhibited comparable expression
levels in all three of the comparison groups (Fig. 4B). By plotting the transformed
intensity (log10 scale) of the two peptides derived from
a single protein in each sample, the R2 ranged between
0.81 and 0.95 for the four proteins analyzed (Fig. 4C). The present results suggested
that the MRM quantification method exhibited high accuracy.
According to the sum of transition areas for every
peptide, the relative intensities of peptides are presented as a
scatter plot in Fig. 5. The
protein expression levels of 16 peptides in patients with MI
compared with the normal controls were consistent with the iTRAQ
data for the 12 proteins analyzed (seven proteins were upregulated
and five were downregulated; Table
IV; Fig. 5).
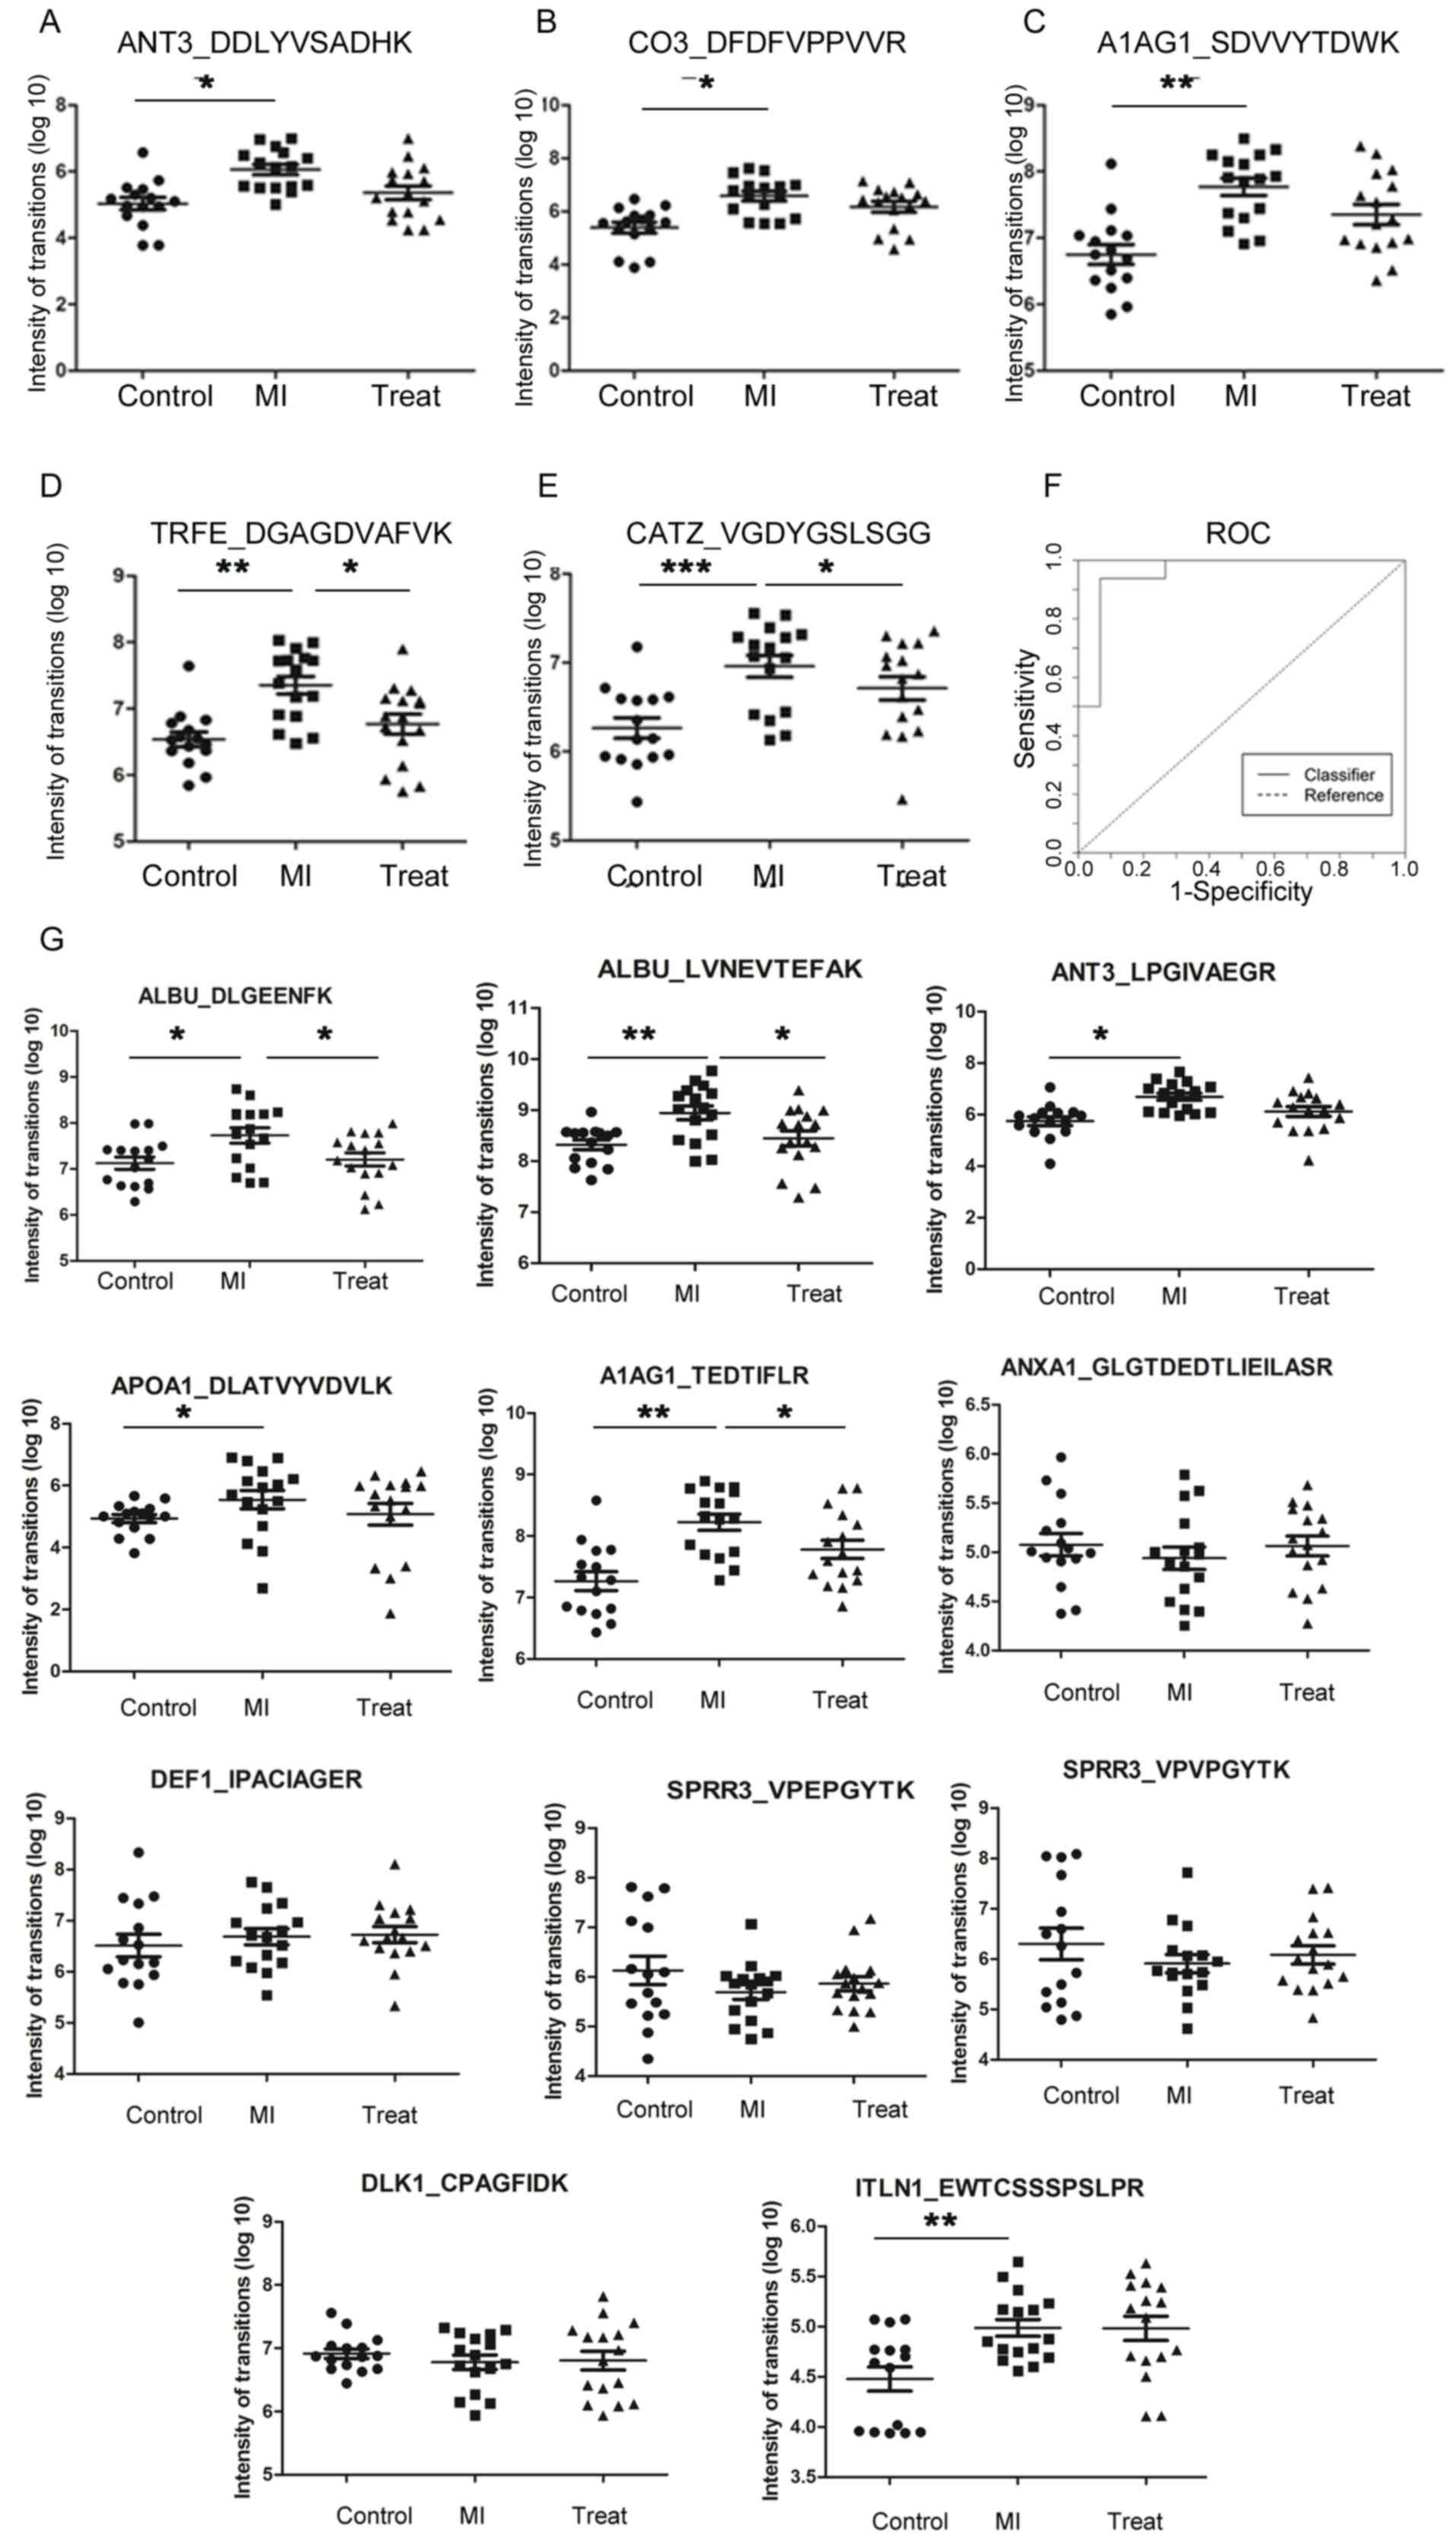 | Figure 5.Multiple reaction monitoring results
for differentially expressed proteins in urine samples. Scatter
plots demonstrating the MRM quantification results in the control,
MI and treatment groups for (A) ANT3, (B) CO3, (C) A1AG1, (D) TRFE
and (E) CATZ. (F) ROC curve analysis was performed by combining the
differential expression levels of five proteins in urine to
discriminate between patients with MI and healthy controls. (G)
Scatter plots of 11 peptides for the control, MI and treatment
groups. Data are presented as the mean ± standard error of the
mean. N=15, 16 and 16 for the control, MI and treatment groups,
respectively. *P<0.05, *P<0.01, ***P<0.001. ANT3,
antithrombin-III; CO3, complement C3; A1AG1, α-1-acid glycoprotein
1; MI, myocardial infarction; TRFE, serum transferrin; CATZ,
cathepsin Z; ROC, receiver operating characteristic; ALBU, albumin;
APOA1, apolipoprotein A-I; ANXA1, Annexin A 1; DEF1, neutrophil
defensin 1; SPRR3, small proline-rich protein 3; DLK1, protein δ
homolog 1; ITLN1, intelectin-1. |
| Table IV.Validation of marker candidates by
MRM analysis. Comparison between MRM and iTRAQ data. |
Table IV.
Validation of marker candidates by
MRM analysis. Comparison between MRM and iTRAQ data.
| Protein symbol | Uniprot accession
number | Peptide
sequence | iTRAQ, fold change
MI/control | MRM, fold change
MI/control | iTRAQ, fold change
MI/treat | MRM, fold change
MI/treat | Frequency of
patients exhibiting a significant different level of the
protein |
|---|
| ALBUb | P02768 | DLGEENFK | 2.47 | 4.99c | 2.00 | 4.23c | 14/16 |
| ALBUb | P02768 | LVNEVTEFAK | 2.47 | 5.68d | 2.00 | 2.90c | 14/16 |
| ANT3a,b | P01008 | LPGIVAEGR | 5.33 | 6.93c | 4.00 | 2.51 | 14/16 |
| ANT3a,b | P01008 | DDLYVSDAFHK | 5.33 | 6.62c | 4.00 | 2.32 | 14/16 |
| CO3a,b | P01024 | DFDFVPPVVR | 2.33 | 15.80c | 2.80 | 2.68 | 14/16 |
| APOA1b | P02647 | DLATVYVDVLK | 2.65 | 14.27c | 3.75 | 2.78 | 13/16 |
| A1AG1a,b | P02763 | TEDTIFLR | 2.05 | 6.02d | 1.28 | 2.04c | 13/16 |
| A1AG1a,b | P02763 | SDVVYTDWK | 2.10 | 6.47d | 1.30 | 1.86 | 13/16 |
| ANXA1 | P04083 |
GLGTDEDTLIEILASR | 0.38 | 0.74 | 1.50 | 0.91 | 10/16 |
| DEF1 | P59665 | IPACIAGER | 0.46 | 0.56 | 1.71 | 0.81 | 7/16 |
| TRFEa,b | P02787 | DGAGDVAFVK | 2.56 | 6.30d | 2.56 | 3.08c | 14/16 |
| SPRR3 | Q9UBC9 | VPEPGYTK | 0.46 | 0.10 | 0.96 | 0.64 | 8/16 |
| SPRR3 | Q9UBC9 | VPVPGYTK | 0.46 | 0.17 | 0.96 | 0.98 | 6/16 |
| CATZa,b | Q9UBR2 | VGDYGSLSGR | 2.41 | 4.70e | 1.71 | 1.68c | 6/16 |
| DLK1 | P80370 | CPAGFIDK | 0.49 | 0.86 | 0.65 | 0.65 | 7/16 |
| ITLN1 | AQ8WW0 | EWTCSSSPSLPR | 2.93 | 2.80d | 1.46 | 0.86 | 10/16 |
Subsequently, the specificity and sensitivity of
differentially expressed proteins as diagnostic biomarkers of MI
were analyzed by binary logistic regression analysis based on the
MRM data (Table V). To increase
the reliability of the diagnostic potential of the protein panel
identified, ROC analysis was performed by combining all the urinary
proteins with an AUC >0.8 that exhibited a normal protein
expression level following surgical treatment. ROC curves suggested
that the combination of five proteins (ANT3, CO3, A1AG1, TRFE and
CATZ) exhibited increased accuracy for MI diagnosis compared with
the single proteins. The combination panel exhibited 94%
sensitivity and 93% specificity, with an AUC of 0.95 (Fig. 5F).
| Table V.Sensitivity, specificity and receiver
operating characteristic AUC values for urinary proteins. |
Table V.
Sensitivity, specificity and receiver
operating characteristic AUC values for urinary proteins.
| Protein symbol | Accession no. | Peptide
sequence | Sensitivity | Specificity | AUC |
|---|
| ALBU | P02768 | DLGEENFK | 0.69 | 0.87 | 0.78 |
| ALBU | P02768 | LVNEVTEFAK | 0.69 | 0.93 | 0.80 |
| ANT3 | P01008 | LPGIVAEGR | 1.00 | 0.67 | 0.89 |
| ANT3 | P01008 | DDLYVSDAFHK | 0.88 | 0.87 | 0.88 |
| CO3 | P01024 | DFDFVPPVVR | 0.69 | 0.93 | 0.86 |
| A1AG1 | P02647 | TEDTIFLR | 0.88 | 0.73 | 0.86 |
| A1AG1 | P02763 | SDVVYTDWK | 0.81 | 0.87 | 0.90 |
| APOA1 | P04083 |
GLGTDEDTLIEILASR | 0.25 | 0.73 | 0.40 |
| DEF1 | P59665 | IPACIAGER | 0.81 | 0.47 | 0.60 |
| TRFE | P02787 | DGAGDVAFVK | 0.81 | 0.93 | 0.90 |
| SPRR3 | Q9UBC9 | VPEPGYTK | 0.63 | 0.40 | 0.38 |
| SPRR3 | Q9UBC9 | VPVPGYTK | 0.88 | 0.33 | 0.44 |
| CATZ | Q9UBR2 | VGDYGSLSGR | 0.69 | 0.93 | 0.84 |
| DLK1 | P80370 | CPAGFIDK | 0.38 | 0.80 | 0.45 |
| ITLN1 | Q8WWA0 | EWTCSSSPSLPR | 0.56 | 0.80 | 0.80 |
| ANXA1 | P04083 |
GLGTDEDTLIEILASR | 0.25 | 0.73 | 0.40 |
| Combination of
ANT3, CO3, A1AG1, TRFE and CATZ |
|
| 0.94 | 0.93 | 0.95 |
TNNT2 is one of the most used biomarkers for MI, and
high levels of TNNT2 are detectable for ≤2 weeks following MI
(6). In the present study, the
expression levels of all five candidate biomarkers (ANT3, CO3,
A1AG1, TRFE and CATZ) were identified to be notably decreased
following treatment in iTRAQ and MRM quantification analysis. In
total, the protein expression levels of three proteins (A1AG1, TRFE
and CATZ) were significantly restored to normal levels following
treatment compared with the MI group (P<0.05) (Table IV). ANT3, CO3 and TRFE were
restored to normal levels in 14 out of 16 patients; whereas A1AG1
in 13 out of 16 patients. Therefore, the identified candidate
diagnostic biomarkers may be potentially used for monitoring the
disease status and the potential therapeutic effects of a certain
treatment.
Furthermore, a correlation analysis between the five
proteins identified and a currently used biomarker, troponin I,
cardiac muscle (TNNI3) (47), was
performed. CO3, ANT3 and TRFE exhibited a moderate positive
correlation with the protein expression level of TNNI3 in patients
with MI (R2=0.42, 0.43 and 0.32, respectively). A1AG1
and CATZ were not correlated with the protein expression levels of
TNNI3 (R2=−0.14 and −0.11, respectively; data not
shown). The present results suggested that the five urine
biomarkers identified in the present study and TNNI3 may be
associated with two distinct processes occurring in patients with
MI. Additionally, the present results were compared with the
results from previous studies using CE-MS (Table VI) (17–20).
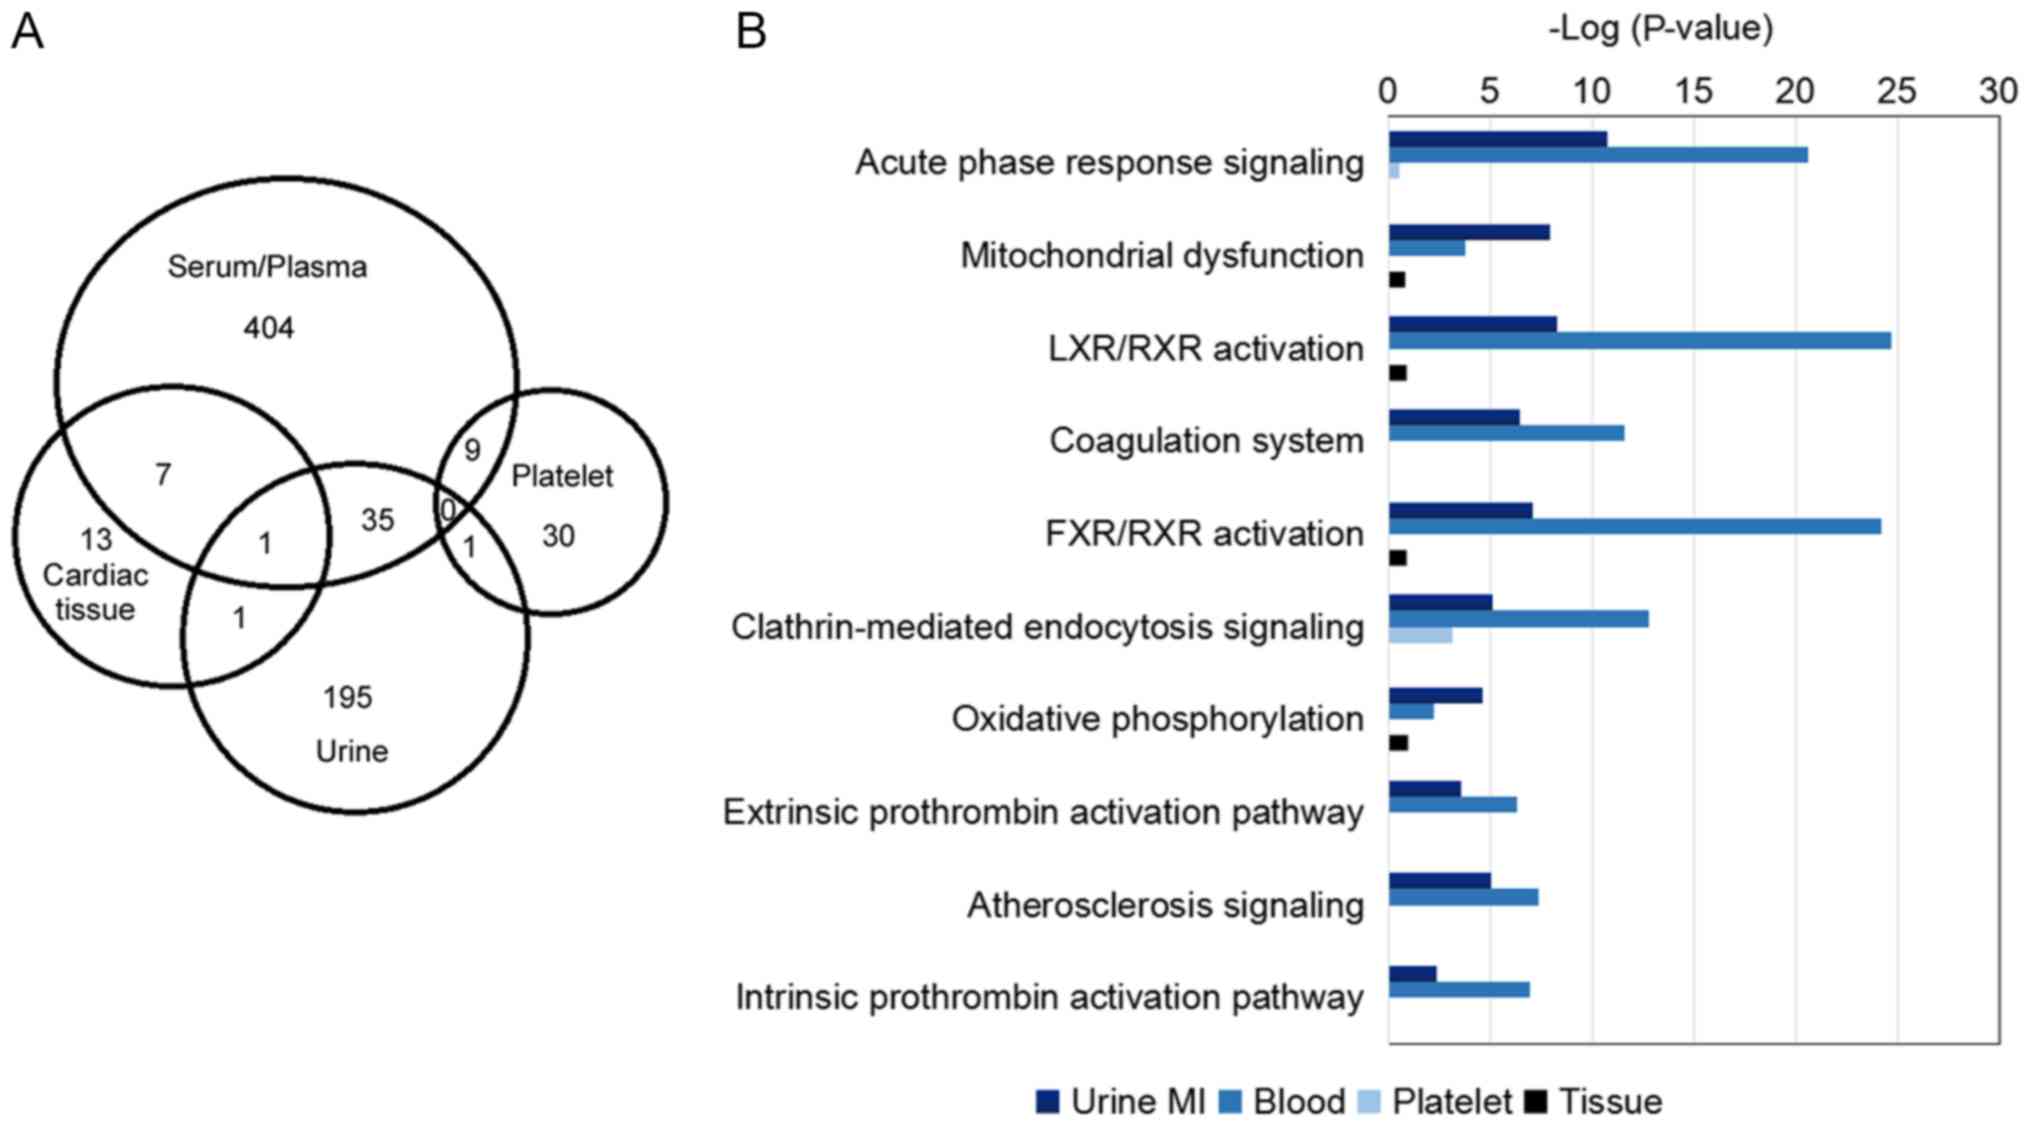
To further investigate the differentially expressed proteins
associated with MI, 14 proteomics studies on MI were combined and
analyzed, and 503 nonredundant biomarkers were identified, 456 of
which were identified in the blood (data not shown). In addition,
the present results were combined with previous studies, and 38
common proteins were identified. In total, 24 proteins exhibited a
similar trend. A total of 696 proteins were identified to be
differentially expressed in four types of samples, including
cardiac tissues, platelets, blood and urine. The combined analysis
suggested that the differentially expressed proteins from the four
samples were distinct, and only 54 proteins were found in more than
two samples (Fig. 6A).
Furthermore, the differentially expressed proteins from four types
of samples suggested various pathophysiological alterations
(Fig. 6B). Biomarkers identified
in blood were primarily involved in ‘LXR/RXR activation’, ‘acute
phase response signaling’, ‘clathrin-mediated endocytosis
signaling’, ‘glycolysis’ and ‘atherosclerosis signaling’.
Conversely, biomarkers identified in platelets were associated with
alterations in ‘epithelial adherens junction signaling’, ‘actin
cytoskeleton’ and ‘integrin signaling’ (data not shown). In
addition to the enrichment of ‘acute phase response signaling’,
‘LXR/RXR activation’, ‘coagulation system’ and ‘clathrin-mediated
endocytosis signaling’, the urine proteome exhibited alterations in
‘mitochondrial dysfunction’ and ‘oxidative phosphorylation’
pathways; however, no pathway was identified to be enriched in
differential proteomes derived from cardiac tissues. Therefore, the
urinary proteome may contain more information compared with the
other three sample types, and it may be used to investigate
intracellular and extracellular alterations.
| Table VI.Comparison between the proteins
identified in the present study and the proteins significantly
upregulated in previous capillary electrophoresis-mass spectrometry
studies. |
Table VI.
Comparison between the proteins
identified in the present study and the proteins significantly
upregulated in previous capillary electrophoresis-mass spectrometry
studies.
| Protein name | Uniprot accession
number | Differentially
expressed in the present study |
|---|
| Collagen α-1(I)
chain | P02452 | No |
| Collagen α-1(III)
chain | P02461 | No |
|
α-1-antitrypsin | P01009 | No |
| Granin-like
neuroendocrine peptide precursor | Q9UHG2 | No |
| Membrane-associated
progesterone receptor component 1 | O00264 | No |
|
Sodium/potassium-transporting adenosine
triphosphatase subunit γ | P57410 | No |
| Fibrinogen α
chain | P02671 | No |
| Pro-epidermal
growth factor | P01133 | Yes,
upregulated |
| Kidney
androgen-regulated protein | P61110 | No |
Discussion
In the present study, urinary proteomes were used to
identify novel MI biomarkers. A total of 2,086 urinary proteins
were identified. A total of 233 urinary proteins were
differentially expressed. By performing IPA analysis, the
‘atherosclerosis signaling’ pathway was identified to be enriched
in the urine of patients with MI, and it is associated with the
pathology of MI. The ‘acute phase response signaling’ pathway was
enriched in the urine of patients with MI, possibly due to the
inflammatory response involved in MI, repair and remodeling
(48). The coagulation-associated
pathways were enriched in the urine of patients with MI, possibly
due to the thrombotic processes occurring in MI. Additionally, cell
metabolism-associated pathways, including the ‘mitochondrial
dysfunction’ and ‘oxidative phosphorylation’ pathways, were
enriched in the urine of patients with MI. MI-induced prolonged
ischemia in myocardial cells may lead to myocardial necrosis,
resulting in dysfunctions of cell metabolism following MI (48). In total, 12 differentially
expressed proteins were validated by MRM analysis. Additionally, a
panel of five proteins may be used to diagnose MI, since, in the
present study, the combination of five biomarkers exhibited a
sensitivity of 94% and a specificity of 93%, and these five
proteins were identified to be restored following treatment.
CK-MB and TNNT2 are the most widely used MI
biomarkers. However, CK-MB exhibits low specificity (0.591–0.842)
(2,3), similarly to TNNT2 (0.54–0.85), which
exhibits high sensitivity and a low positive predictive value
(0.61–0.87) (4). In the present
study, using iTRAQ quantification and MRM validation, 12 protein
biomarkers for the early diagnosis of MI were identified. Notably,
a five-protein panel containing ANT3, CO3, A1AG1, TRFE and CATZ
exhibited 94% sensitivity and 93% specificity for the diagnosis of
MI, with an AUC of ~0.95.
Among these 12 candidate biomarkers of MI, TRFE was
observed to be differentially expressed in urine of patients with
MI in a previous study (49). In
the present study, the protein expression levels of TRFE were
identified to be increased in the urine of patients with MI,
similarly to patients with coronary artery stenosis (49) and in line with the serum levels of
ischemic patients (50). In the
aforementioned panel, six proteins were previously identified to be
differentially expressed in sera of patients with MI; however, to
the best of our knowledge, the present study is the first to
associate the urine levels of these proteins with MI. ALBU, ANT3,
CO3 and A1AG1 were identified to be upregulated, and ANXA1 to be
downregulated in the urine of patients with MI in the present
study, in line with previous proteomic study results performed on
sera (8,13,14,16,26).
APOA1 was identified to be upregulated in the urine of patients
with MI in the present study, in line with the proteomics study
performed on plasma samples by Keshishian et al (16); however, this present results are in
contrast with the study by Májek et al (13). A previous study demonstrated that
ANXA1 may protect from I/R injury in the heart (42). ANXA1 binds to and activates
proteins of the formyl peptide receptor family (a type of G
protein-coupled receptor), which inhibits neutrophil activation,
migration and infiltration (43).
A previous study investigating the cardioprotective actions of
ANXA1 and its peptide mimetics examined its anti-inflammatory
effects as a mechanism of preserving the viability of myocardial
cells following I/R injury (43).
In addition to the aforementioned seven proteins,
five proteins were identified to be associated with MI in the
present study, including DEF1, ITLN1, DLK1, SPRR3 and CATZ. DEF1
(44), ITLN1 (45) and DLK1 (46) were demonstrated to be involved in
the inflammatory response in previous studies. In the present
study, DEF1 was identified to be decreased, and ITLN1 to be
increased, following MI; however, the expression levels of these
two proteins were not restored to normal levels following surgical
treatment. Therefore, it was hypothesized that these
inflammation-associated proteins may be involved in myocardial cell
death following MI. DLK1 exhibited a decreased protein expression
level in patients with MI and increased following treatment. DLK1
is an inhibitor of Notch signaling (46). A previous study observed that the
Notch signaling pathway may regulate macrophage-mediated
inflammatory response, affecting cardiac sympathetic reinnervation
in rats following MI (51).
Potentially, the decreased expression level of DLK1 may be
associated with the regulation of the Notch signaling pathway
during MI. SPRR3 was downregulated in the urine of patients with
MI. SPRR3 belongs to the small proline-rich protein family and was
identified to be associated with malignant tumorigenesis (52). An increased expression level of
CATZ was detected in MI urine samples in the present study. CATZ is
a cysteine proteinase that exhibits carboxy-monopeptidase
activities, and is involved in tumorigenesis (53–55).
The molecular mechanism and the functions of these two proteins in
myocardial infarction require further investigation.
TNNT2 is frequently used to diagnose MI, its protein
expression level increases within 4–6 h after MI; however, the
levels remain high for up to 2 weeks (6) Therefore, TNNT2 is not a reliable
marker for monitoring the MI disease status and the therapeutic
effects of a treatment. Among the five novel protein biomarkers
identified in the present study, the protein expression levels of
two proteins increased to normal levels; however, not
significantly. By contrast, the expression levels of three other
proteins was significantly restored to normal levels by 7 days
after treatment. These three proteins may exhibit a diagnostic
potential for early MI with high sensitivity and specificity, and
may be additionally used for monitoring the MI disease status and
the therapeutic effects of a certain treatment. Further studies are
required to investigate the diagnostic potential of these proteins
in monitoring the effects of a certain treatment on the MI status
by comparing an effective treatment with an ineffective
treatment.
A number of previous studies (17–20)
used the CE-MS approach to find CAD-associated biomarkers in urine.
These previous studies identified polypeptide panels able to
distinguish patients with CAD and normal controls in both clinical
samples and animal models and the panels of biomarkers identified
exhibited 79–98% sensitivity and 83–100% specificity. The present
study used iTRAQ technology to identify and validate a five-protein
panel with 94% sensitivity and 93% specificity, results in line
with the previous studies using CE-MS. CE-MS approach is able to
selectively identify urinary polypeptides derived from a protein
and these polypeptide may be indirectly associated with the
pathology of MI. The present study used the urinary proteome based
on iTRAQ technology to identify differentially expressed proteins
following MI. The protein identified may be directly associated
with the pathological alterations of MI. Using CE-MS, nine common
proteins were identified in previous studies (17–20)
[collagen α-1(I) chain, collagen α-1(III) chain, α-1-antitrypsin,
granin-like neuroendocrine peptide precursor, membrane-associated
progesterone receptor component 1, sodium/potassium-transporting
adenosine triphosphatase γ chain, fibrinogen-α chain, epidermal
growth factor and kidney androgen-regulated protein]. The present
study identified 233 differentially expressed proteins in patients
with MI. Notably, only one protein was identified in the present
study and in the previous CE-MS-based studies, indicating that the
urine peptidome and proteome may be used to investigate distinct
aspects of MI.
In addition, significant differences were identified
between proteomes derived from various types of tissues. Therefore,
a comprehensive study of the MI proteome from multiple sources may
facilitate the identification of sensitive and specific diagnostic
biomarkers. The present results suggested that the urinary proteome
may be associated with pathophysiological alterations caused by MI
and may provide useful diagnostic insights. The candidate
biomarkers identified in the urinary proteome may be used for the
early diagnosis of MI and to monitor the MI disease status and the
therapeutic effect of a certain treatment. Collectively, the
present study may facilitate the application of the urinary
proteome to diagnose MI.
Acknowledgements
Not applicable.
Funding
The present study was supported by The National
Basic Research Program of China (grant nos. 2013CB530805 and
2014CBA02005), National Key Research and Development Program of
China (grant no. 2016 YFC 1306300), The Key Basic Research Program
of the Ministry of Science and Technology of China (grant no.
2013FY114100), the National Natural Science Foundation of China
(grant nos. 30970650, 31200614, 31400669, 81371515, 81170665 and
81560121), The Science and Technology Yuanjiang Project of The
Xinjiang Uygur Autonomous Region (grant no. 2013911114), The CAMS
Innovation Fund for Medical Sciences (grant no. 2017-I2M-1-009),
The Biologic Medicine Information Center of China and The National
Scientific Data Sharing Platform for Population and Health.
Availability of data and materials
The datasets generated and/or analyzed during the
current study are available at http://www.iprox.org. Project Name: Differential
urinary proteomics analysis of myocardial infarction using iTRAQ
quantification, https://www.iprox.org//page/project.html?id=IPX0000772000.
Authors' contributions
WS and XW conceived and designed the study. WS
supervised the study. LZ drafted the manuscript. ZG and WS wrote,
reviewed and edited the manuscript. WS and ZG acquired the funding.
WS and HS coordinated the project. LZ and WS performed the
experiments. CS and YY analyzed the data in silico. ZG and
HS performed the validation experiments. LZ and HS interpreted the
data. XW provided resources. All authors have read and approved the
final manuscript.
Ethics approval and consent to
participate
Samples were collected for clinical examination and
the present study analyzed the remaining parts of the samples. As
the identity of the patients was anonymized for the duration of the
study, the requirement for patient consent was waived by The
Institutional Review Board of The Institute of Basic Medical
Sciences (Beijing, China). The present study was approved by The
Institutional Review Board of The Institute of Basic Medical
Sciences and followed the ethical guidelines of The Declaration of
Helsinki.
Patient consent for publication
Not applicable.
Competing interests
The authors declare that they have no competing
interests.
References
|
1
|
Cabello JB, Burls A, Emparanza JI, Bayliss
S and Quinn T: Oxygen therapy for acute myocardial infarction.
Cochrane Database Syst Rev. CD0071602013.doi:
10.1002/14651858.CD007160.pub3. PubMed/NCBI
|
|
2
|
Task Force on the management of ST-segment
elevation acute myocardial infarction of the European Society of
Cardiology (ESC); Steg PG, James SK, Atar D, Badano LP,
Blomstrom-Lundqvist C, Borger MA, Di Mario C, Dickstein K, Ducrocq
G, et al: ESC Guidelines for the management of acute myocardial
infarction in patients presenting with ST-segment elevation. Eur
Heart J. 33:2569–2619. 2012. View Article : Google Scholar : PubMed/NCBI
|
|
3
|
Wang Y, Guo Z and Huang L: Value of
different biochemical markers in early diagnosis of acute
myocardial infarction. Nan Fang Yi Ke Da Xue Xue Bao. 34:1347–1350.
2014.(In Chinese). PubMed/NCBI
|
|
4
|
Kitamura M, Hata N, Takayama T, Hirayama
A, Ogawa M, Yamashina A, Mera H, Yoshino H, Nakamura F and Seino Y:
High-sensitivity cardiac troponin T for earlier diagnosis of acute
myocardial infarction in patients with initially negative troponin
T test-comparison between cardiac markers. J Cardiol. 62:336–342.
2013. View Article : Google Scholar : PubMed/NCBI
|
|
5
|
Paixao AR and de Lemos JA: Acute troponin
elevation and the classification of myocardial infarction. JAMA.
312:2032–2033. 2014. View Article : Google Scholar : PubMed/NCBI
|
|
6
|
Eisenman A: Troponin assays for the
diagnosis of myocardial infarction and acute coronary syndrome:
Where do we stand? Expert Rev Cardiovasc Ther. 4:509–514. 2006.
View Article : Google Scholar : PubMed/NCBI
|
|
7
|
Azzalini L, Candilio L, McCullough PA and
Colombo A: Current risk of contrast-induced acute kidney injury
after coronary angiography and intervention: A reappraisal of the
literature. Can J Cardiol. 33:1225–1228. 2017. View Article : Google Scholar : PubMed/NCBI
|
|
8
|
Ghatge M, Nair J, Sharma A and Vangala RK:
Integrative gene ontology and network analysis of coronary artery
disease associated genes suggests potential role of ErbB pathway
gene EGFR. Mol Med Rep. 17:4253–4264. 2018.PubMed/NCBI
|
|
9
|
Guo Y, Cui L and Jiang S, Zhang A and
Jiang S: Proteomics of acute heart failure in a rat post-myocardial
infarction model. Mol Med Rep. 16:1946–1956. 2017. View Article : Google Scholar : PubMed/NCBI
|
|
10
|
Marshall J, Kupchak P, Zhu W, Yantha J,
Vrees T, Furesz S, Jacks K, Smith C, Kireeva I, Zhang R, et al:
Processing of serum proteins underlies the mass spectral
fingerprinting of myocardial infarction. J Proteome Res. 2:361–372.
2003. View Article : Google Scholar : PubMed/NCBI
|
|
11
|
Parguina AF, Grigorian-Shamagian L, Agra
RM, Lopez-Otero D, Rosa I, Alonso J, Teijeira-Fernandez E,
Gonzalez-Juanatey JR and Garcia A: Variations in platelet proteins
associated with ST-elevation myocardial infarction: Novel clues on
pathways underlying platelet activation in acute coronary
syndromes. Arterioscler Thromb Vasc Biol. 31:2957–2964. 2011.
View Article : Google Scholar : PubMed/NCBI
|
|
12
|
Cubedo J, Ramaiola I, Padro T,
Martin-Yuste V, Sabate-Tenas M and Badimon L: High-molecular-weight
kininogen and the intrinsic coagulation pathway in patients with de
novo acute myocardial infarction. Thromb Haemost. 110:1121–1134.
2013. View Article : Google Scholar : PubMed/NCBI
|
|
13
|
Májek P, Reicheltova Z, Suttnar J, Maly M,
Oravec M, Pečánková K and Dyr JE: Plasma proteome changes in
cardiovascular disease patients: Novel isoforms of apolipoprotein
A1. J Transl Med. 9:842011. View Article : Google Scholar : PubMed/NCBI
|
|
14
|
Addona TA, Shi X, Keshishian H, Mani DR,
Burgess M, Gillette MA, Clauser KR, Shen D, Lewis GD, Farrell LA,
et al: A pipeline that integrates the discovery and verification of
plasma protein biomarkers reveals candidate markers for
cardiovascular disease. Nat Biotechnol. 29:635–643. 2011.
View Article : Google Scholar : PubMed/NCBI
|
|
15
|
Kakimoto Y, Ito S, Abiru H, Kotani H,
Ozeki M, Tamaki K and Tsuruyama T: Sorbin and SH3 domain-containing
protein 2 is released from infarcted heart in the very early phase:
Proteomic analysis of cardiac tissues from patients. J Am Heart
Assoc. 2:e0005652013. View Article : Google Scholar : PubMed/NCBI
|
|
16
|
Keshishian H, Burgess MW, Gillette MA,
Mertins P, Clauser KR, Mani DR, Kuhn EW, Farrell LA, Gerszten RE
and Carr SA: Multiplexed, quantitative workflow for sensitive
biomarker discovery in plasma yields novel candidates for early
myocardial injury. Mol Cell Proteomics. 14:2375–2393. 2015.
View Article : Google Scholar : PubMed/NCBI
|
|
17
|
Zimmerli LU, Schiffer E, Zurbig P, Good
DM, Kellmann M, Mouls L, Pitt AR, Coon JJ, Schmieder RE, Peter KH,
et al: Urinary proteomic biomarkers in coronary artery disease. Mol
Cell Proteomics. 7:290–298. 2008. View Article : Google Scholar : PubMed/NCBI
|
|
18
|
Delles C, Schiffer E, von Zur Muhlen C,
Peter K, Rossing P, Parving HH, Dymott JA, Neisius U, Zimmerli LU,
Snell-Bergeon JK, et al: Urinary proteomic diagnosis of coronary
artery disease: Identification and clinical validation in 623
individuals. J Hypertens. 28:2316–2322. 2010. View Article : Google Scholar : PubMed/NCBI
|
|
19
|
von Zur Muhlen C, Schiffer E, Zuerbig P,
Kellmann M, Brasse M, Meert N, Vanholder RC, Dominiczak AF, Chen
YC, Mischak H, et al: Evaluation of urine proteome pattern analysis
for its potential to reflect coronary artery atherosclerosis in
symptomatic patients. J Proteome Res. 8:335–345. 2009. View Article : Google Scholar : PubMed/NCBI
|
|
20
|
von zur Muhlen C, Schiffer E, Sackmann C,
Zurbig P, Neudorfer I, Zirlik A, Htun N, Iphöfer A, Jänsch L,
Mischak H, et al: Urine proteome analysis reflects atherosclerotic
disease in an ApoE-/- mouse model and allows the discovery of new
candidate biomarkers in mouse and human atherosclerosis. Mol Cell
Proteomics. 11:M111.0138472012. View Article : Google Scholar : PubMed/NCBI
|
|
21
|
Ganz W: The thrombolysis in myocardial
infarction (TIMI) trial. N Engl J Med. 313:10181985. View Article : Google Scholar : PubMed/NCBI
|
|
22
|
World Medical Association, . World Medical
Association Declaration of Helsinki ethical principles for medical
research involving human subjects. JAMA. 310:2191–2194. 2013.
View Article : Google Scholar : PubMed/NCBI
|
|
23
|
Wisniewski JR, Zougman A, Nagaraj N and
Mann M: Universal sample preparation method for proteome analysis.
Nat Methods. 6:359–362. 2009. View Article : Google Scholar : PubMed/NCBI
|
|
24
|
Mi H, Huang X, Muruganujan A, Tang H,
Mills C, Kang D and Thomas PD: PANTHER version 11: Expanded
annotation data from Gene Ontology and Reactome pathways, and data
analysis tool enhancements. Nucleic Acids Res. 45:D183–D189. 2017.
View Article : Google Scholar : PubMed/NCBI
|
|
25
|
MacLean B, Tomazela DM, Shulman N,
Chambers M, Finney GL, Frewen B, Kern R, Tabb DL, Liebler DC and
MacCoss MJ: Skyline: An open source document editor for creating
and analyzing targeted proteomics experiments. Bioinformatics.
26:966–968. 2010. View Article : Google Scholar : PubMed/NCBI
|
|
26
|
Cubedo J, Padro T and Badimon L:
Coordinated proteomic signature changes in immune response and
complement proteins in acute myocardial infarction: The implication
of serum amyloid P-component. Int J Cardiol. 168:5196–5204. 2013.
View Article : Google Scholar : PubMed/NCBI
|
|
27
|
Mateos-Caceres PJ, Garcia-Méndez A, López
Farré A, Macaya C, Núñez A, Gomez J, Alonso-Orgaz S, Carrasco C,
Burgos ME, de Andres R, et al: Proteomic analysis of plasma from
patients during an acute coronary syndrome. J Am Coll Cardiol.
44:1578–1583. 2004. View Article : Google Scholar : PubMed/NCBI
|
|
28
|
Kiernan UA, Nedelkov D and Nelson RW:
Multiplexed mass spectrometric immunoassay in biomarker research: A
novel approach to the determination of a myocardial infarct. J
Proteome Res. 5:2928–2934. 2006. View Article : Google Scholar : PubMed/NCBI
|
|
29
|
Rezeli M, Végvári Á, Donnarumma F, Gidlöf
O, Smith JG, Erlinge D and Marko-Varga G: Development of an MRM
assay panel with application to biobank samples from patients with
myocardial infarction. J Proteomics. 87:16–25. 2013. View Article : Google Scholar : PubMed/NCBI
|
|
30
|
Peronnet E, Becquart L, Poirier F,
Cubizolles M, Choquet-Kastylevsky G and Jolivet-Reynaud C:
SELDI-TOF MS analysis of the Cardiac Troponin I forms present in
plasma from patients with myocardial infarction. Proteomics.
6:6288–6299. 2006. View Article : Google Scholar : PubMed/NCBI
|
|
31
|
Cubedo J, Padro T, Garcia-Moll X, Pinto X,
Cinca J and Badimon L: Proteomic signature of Apolipoprotein J in
the early phase of new-onset myocardial infarction. J Proteome Res.
10:211–220. 2011. View Article : Google Scholar : PubMed/NCBI
|
|
32
|
Dong SY, Sun XN, Zeng Q, Xu Y, Sun J and
Ma LH: Proteomic analysis of adverse outcomes in patients with
acute coronary syndromes. Clin Chim Acta. 416:60–66. 2013.
View Article : Google Scholar : PubMed/NCBI
|
|
33
|
Fawcett T: An Introduction to ROC
Analysis. Pattern Recognition Lett. 27:861–874. 2006. View Article : Google Scholar
|
|
34
|
Guo Z, Wang Z, Lu C, Yang S, Sun H, Reziw,
Guo Y, Sun W and Yue H: Analysis of the differential urinary
protein profile in IgA nephropathy patients of Uygur ethnicity. BMC
Nephrol. 19:3582018. View Article : Google Scholar : PubMed/NCBI
|
|
35
|
Chistiakov DA, Orekhov AN and Bobryshev
YV: ApoA1 and ApoA1-specific self-antibodies in cardiovascular
disease. Lab Invest. 96:708–718. 2016. View Article : Google Scholar : PubMed/NCBI
|
|
36
|
Arques S: Human serum albumin in
cardiovascular diseases. Eur J Intern Med. 52:8–12. 2018.
View Article : Google Scholar : PubMed/NCBI
|
|
37
|
Porez G, Gross B, Prawitt J, Gheeraert C,
Berrabah W, Alexandre J, Staels B and Lefebvre P: The hepatic
orosomucoid/α1-acid glycoprotein gene cluster is regulated by the
nuclear bile acid receptor FXR. Endocrinology. 154:3690–3701. 2013.
View Article : Google Scholar : PubMed/NCBI
|
|
38
|
Szabo R, Netzel-Arnett S, Hobson JP,
Antalis TM and Bugge TH: Matriptase-3 is a novel phylogenetically
preserved membrane-anchored serine protease with broad serpin
reactivity. Biochem J. 390:231–242. 2005. View Article : Google Scholar : PubMed/NCBI
|
|
39
|
Sai K, Kurose K, Koizumi T, Katori N,
Sawada J, Matsumura Y, Saijo N, Yamamoto N, Tamura T, Okuda H and
Saito Y: Distal promoter regions are responsible for differential
regulation of human orosomucoid-1 and −2 gene expression and acute
phase responses. Biol Pharm Bull. 37:164–168. 2014. View Article : Google Scholar : PubMed/NCBI
|
|
40
|
Hajri T, Elliott-Bryant R, Sipe JD, Liang
JS, Hayes KC and Cathcart ES: The acute phase response in
apolipoprotein A-1 knockout mice: Apolipoprotein serum amyloid A
and lipid distribution in plasma high density lipoproteins. Biochim
Biophys Acta. 1394:209–218. 1998. View Article : Google Scholar : PubMed/NCBI
|
|
41
|
Schrödl W, Büchler R, Wendler S, Reinhold
P, Muckova P, Reindl J and Rhode H: Acute phase proteins as
promising biomarkers: Perspectives and limitations for human and
veterinary medicine. Proteomics Clin Appl. 10:1077–1092. 2016.
View Article : Google Scholar : PubMed/NCBI
|
|
42
|
Nadkarni S, Cooper D, Brancaleone V, Bena
S and Perretti M: Activation of the Annexin A1 pathway underlies
the protective effects exerted by estrogen in polymorphonuclear
leukocytes. Arterioscler Thromb Vasc Biol. 31:2749–2759. 2011.
View Article : Google Scholar : PubMed/NCBI
|
|
43
|
Qin C, Yang YH, May L, Gao X, Stewart AG,
Tu Y, Woodman OL and Ritchie RH: Cardioprotective potential of
Annexin-A1 mimetics in myocardial infarction. Pharmacol Ther.
148:47–65. 2015. View Article : Google Scholar : PubMed/NCBI
|
|
44
|
Brook M, Tomlinson GH, Miles K, Smith RW,
Rossi AG, Hiemstra PS, van't Wout EF, Dean JL, Gray NK, Lu W and
Gray M: Neutrophil-derived alpha defensins control inflammation by
inhibiting macrophage mRNA translation. Proc Natl Acad Sci USA.
113:4350–4355. 2016. View Article : Google Scholar : PubMed/NCBI
|
|
45
|
Kerr SC, Carrington SD, Oscarson S,
Gallagher ME, Solon M, Yuan S, Ahn JN, Dougherty RH, Finkbeiner WE,
Peters MC and Fahy JV: Intelectin-1 is a prominent protein
constituent of pathologic mucus associated with eosinophilic airway
inflammation in asthma. Am J Respir Crit Care Med. 189:1005–1007.
2014. View Article : Google Scholar : PubMed/NCBI
|
|
46
|
González MJ, Ruiz-García A, Monsalve EM,
Sánchez-Prieto R, Laborda J, Díaz-Guerra MJ and Ruiz-Hidalgo MJ:
DLK1 is a novel inflammatory inhibitor which interferes with NOTCH1
signaling in TLR-activated murine macrophages. Eur J Immunol.
45:2615–2627. 2015. View Article : Google Scholar : PubMed/NCBI
|
|
47
|
Sandoval Y, Smith SW, Sexter A, Thordsen
SE, Bruen CA, Carlson MD, Dodd KW, Driver BE, Hu Y, Jacoby K, et
al: Type 1 and 2 myocardial infarction and myocardial injury:
Clinical transition to high-sensitivity cardiac Troponin I. Am J
Med. 130:1431–1439.e4. 2017. View Article : Google Scholar : PubMed/NCBI
|
|
48
|
Frangogiannis NG: The inflammatory
response in myocardial injury, repair, and remodelling. Nat Rev
Cardiol. 11:255–265. 2014. View Article : Google Scholar : PubMed/NCBI
|
|
49
|
Yang W, Yu XC, Guan X and Guan XR:
Analysis on the relationship between urine transferring, CHD and
coronary artery stenosis. Lab Med Clin. 12:1560–1561. 2015.
|
|
50
|
Wang JR, Da LGN, Qi FX and Hu Y: Serum
transferrin in prognosis in patients with ischemic vascular. Clin
Med. 24:1601–1602. 2009.
|
|
51
|
Yin J, Hu H, Li X, Xue M, Cheng W, Wang Y,
Xuan Y, Li X, Yang N, Shi Y and Yan S: Inhibition of Notch
signaling pathway attenuates sympathetic hyperinnervation together
with the augmentation of M2 macrophages in rats post-myocardial
infarction. Am J Physiol Cell Physiol. 310:C41–C53. 2016.
View Article : Google Scholar : PubMed/NCBI
|
|
52
|
Tesfaigzi J and Carlson DM: Expression,
regulation, and function of the SPR family of proteins. A review.
Cell Biochem Biophys. 30:243–265. 1999. View Article : Google Scholar : PubMed/NCBI
|
|
53
|
Nägler DK, Zhang R, Tam W, Sulea T,
Purisima EO and Ménard R: Human cathepsin X: A cysteine protease
with unique carboxypeptidase activity. Biochemistry.
38:12648–12654. 1999. View Article : Google Scholar : PubMed/NCBI
|
|
54
|
Puzer L, Cotrin SS, Cezari MH, Hirata IY,
Juliano MA, Stefe I, Turk D, Turk B, Juliano L and Carmona AK:
Recombinant human cathepsin X is a carboxymonopeptidase only: A
comparison with cathepsins B and L. Biol Chem. 386:1191–1195. 2005.
View Article : Google Scholar : PubMed/NCBI
|
|
55
|
Wang J, Chen L, Li Y and Guan XY:
Overexpression of cathepsin Z contributes to tumor metastasis by
inducing epithelial-mesenchymal transition in hepatocellular
carcinoma. PLoS One. 6:e249672011. View Article : Google Scholar : PubMed/NCBI
|