Introduction
Adipose tissue-derived stem cells (ADSCs), with
their multilineage mesodermal, neuroectodermal and definitive
endodermal potential, may be an alternative to the use of
pluripotent embryonic stem cells (ESCs) in the lab and clinical
practice. Due to the easy availability and expandable nature of
ADSCs, these cells are widely used as a source of autologous adult
stem cells in regenerative medicine and tissue engineering
(1,2). The Hoffa pad/infrapatellar fat pad
(IFP) tissue is emerging as a new source of ADSCs, termed
infrapatellar fat pad-derived stem cells (IFPSCs), which can be
obtained arthroscopically or from knee arthroplasty. It is
important to highlight the features of this specific adipose
tissue, which is elastic and highly innervated with nerve fibers
and, therefore, associated with anterior knee pain during damage or
inflammation (3). The majority of
the progenitor cells are believed to reside in the stromal vascular
fraction (SVF) of this adipose tissue (4). An important feature of ADSCs is their
immunomodulatory effects and their ability to secrete growth
factors. Our previous studies have reported the expression of ESC
markers by IFPSCs, the neurogenic potential of IFPSCs, and the
surface characterization of bone-derived osteoclast and
IFPSCs-derived osteogenic cells (5–7),
demonstrating their stemness and differentiation potential.
Therefore, IFPSCs may be an important source of cells for
autologous cell-based therapies used in regenerative medicine
(4,7).
Obtaining a sufficient number of cells for cellular
therapy and tissue engineering applications requires ex vivo
expansion of IFPSCs. Certain studies have reported the use of vast
numbers of mesenchymal stem cells (MSCs) for cellular therapy,
which required >10 weeks of expansion (8); however, sequential cell passaging has
been demonstrated to result in the loss of proliferative,
clonogenic and differentiation potential (9,10).
Though numerous studies have used ADSCs for tissue engineering
applications, not all laboratories use the same isolation procedure
and passage number. Few studies have compared the characteristics
and differentiation potential of IFPSCs (11); thus, it is important to determine
the consistency of the stemness during ex vivo expansion of
IFPSCs to enable their application in tissue engineering.
In the current study, the serial changes in the
expression of stem cell markers were investigated in IFPSCs, and
the correlation of markers with the stemness of these cells was
assessed to identify the ideal time point for cell differentiation
and cell therapy applications. Prolonged culture and maintenance of
IFPSCs beyond P6 resulted in the loss of stemness and the ability
to differentiate into neuronal cells, due to autocrine/paracrine
signaling mediated by secreted neurotrophic factors. Large-scale
ex vivo expansion of cells without compromising pluripotency
and long-term self-renewing capacity is required for efficient
cell-based therapies.
Materials and methods
Ethical approval
Written informed consent was obtained from patients
prior to enrollment in the present study. All the procedures were
conducted in accordance with the guidelines of the Institutional
Ethical Committee and the Institutional Committee for Stem Cell
Research of MIOT Institute of Research and National Foundation of
Liver Research, Cell Laboratory, Gleneagles Global Health City.
Isolation and culture of IFPSCs
Human IFP tissue was obtained from 6 patients (4
females and 2 males), with an age ranging between 65 and 68 years
and a mean (± standard error) age of 66.16±1.16 years. The fat
tissue was washed with Dulbecco's phosphate-buffered saline (DPBS)
without calcium and magnesium (Gibco; Thermo Fisher Scientific,
Inc., Waltham, MA, USA) to remove the blood. Small vessels and
fascia were separated from the fat tissue. Isolated fat tissue was
minced and stored in a sterile 50-ml tube with 7–10 ml (depending
on the quality of the tissue) of 0.075% collagenase type I
(PAN-Biotech, Aidenbach, Germany) dissolved in DPBS and digested at
37°C for 12 h. An equal volume of Dulbecco's modified Eagle's
medium (DMEM; Thermo Fisher Scientific, Inc.) was added to the
enzyme-digested tissue and filtered through a 70-µm mesh filter (BD
Biosciences, Franklin, Lakes, NJ, USA) to remove any debris.
Following centrifugation of the filtrate at 489 × g for 8 min at
4°C, the pellets (containing the SVF) were plated onto cell culture
dishes (58 cm2; Cellstar®; Greiner Bio-One
GmbH, Frickenhausen, Germany) in DMEM with 10% fetal bovine serum
(FBS) and 60 µg/ml antibiotic-antimycotic mixture (Invitrogen;
Thermo Fisher Scientific, Inc.) (7). This stage of the primary cell culture
was considered as passage 0 (P0), and cells were cultured until
100% confluency was reached. The cells were then detached using
EDTA with 0.25% trypsin (Invitrogen; Thermo Fisher Scientific,
Inc.) and counted. Subsequently, 5×10⁵ cells were
further seeded in culture dishes (58 cm2) and cultured
for 7 days (P1). This procedure was repeated until P8 and the time
points associated with the different passages were as follows: P0,
days 0–7; P1, days 7–14; P2, days 14–21; P3, days 21–28; P4, days
28–35; P5, days 35–42; P6, days 42–49; and P7, days 49–56. In
between each passage, the total cell number in the culture dish was
calculated to monitor the proliferation index. Phase contrast
images were captured using a Nikon binocular inverted microscope
(model TS100 F; Nikon Corporation, Tokyo, Japan).
Proliferation analysis
For proliferation analysis, 5×10⁵ cells
of each passage were plated onto 100-mm dishes in triplicate. Cells
were trypsinized when 100% confluency (after 7 days) was reached,
and live cells were counted using trypan blue dye exclusion assay
in a hemocytometer. The population doubling time (PDT) was
calculated with the following equation:
TC=0.3Tlog(AA0)
Where TC is the PDT, T is
the incubation time in any units [in the present study, time is in
day(s)], A is the final cell number, and A0 is the
initial cell number used for seeding (12).
Differentiation of three germ
layers
IFPSCs from P2 (n=2) were used in the present study.
The cells were divided into three groups, and appropriate protocols
were followed for neuroectodermal, definitive endodermal and
mesodermal osteogenic induction, as described later in the text.
The IFPSC-derived differentiated cells were then examined for the
expression of germ layer-specific molecular markers using reverse
transcription-polymerase chain reaction (RT-PCR) and
immunocytochemistry.
Neuroectodermal induction
Stem cells at P2 were collected and differentiated
to neural lineage using basic fibroblast growth factor (bFGF;
Thermo Fisher Scientific, Inc.) in serum-free DMEM. The cells were
continuously exposed to 20 ng/ml bFGF for 2 weeks, after which
intermittent exposure was used to maintain the neuronal
culture.
Definitive endodermal induction
Stem cells at P2 were preconditioned with Iscove's
modified Dulbecco's medium (IMDM; Gibco; Thermo Fisher Scientific,
Inc.) containing 20 ng/ml epidermal growth factor and 10 ng/ml
bFGF, following which they were differentiated into hepatocytes
using a two-step protocol (13).
The cells were then treated with differentiation medium, consisting
of IMDM supplemented with 20 ng/ml hepatocyte growth factor (Thermo
Fisher Scientific, Inc.), 10 ng/ml bFGF (Thermo Fisher Scientific,
Inc.) and 0.61 g/l nicotinamide (Sigma-Aldrich; Merck KGaA) for 7
days. Subsequently, cells were transferred to maturation medium,
consisting of IMDM with 20 ng/ml oncostatin M, 1 µmol/l
dexamethasone and 50 mg/ml insulin-transferrin-selenium mix (all
from Thermo Fisher Scientific, Inc.). The obtained cells were
maintained in this medium (13).
Mesodermal osteogenic induction
Stem cells at P2 were collected for osteocyte
differentiation as described by Zuk et al (1). Cells were maintained in osteogenic
culture medium, consisting of DMEM with 10% FBS, 0.1 µM
dexamethasone, 10 mM β-glycerophosphate (Thermo Fisher Scientific,
Inc.) and 60 µg/ml ascorbic acid (Sigma-Aldrich; Merck KGaA) for 14
days.
Immunocytochemical assay
Analysis of stem cell markers in early passages
(P1-4) and neuronal-specific markers in later passages (P>6) was
performed using specific antibodies against the stem cell, germ
layer and neuron-specific markers. IFPSCs from day 14 (P2), day 28
(P4) and day 48 (P>6) were cultured on sterile glass coverslips
and fixed in 4% paraformaldehyde. The cells were washed three times
in washing buffer (DPBS), permeabilized with 0.2% Triton X-100 in
DPBS, washed for a further three times and then incubated in
blocking buffer containing 1% bovine serum albumin in DPBS for 1 h.
Cells were washed three times in washing buffer and incubated
overnight with the primary antibody. Subsequently, the cells were
washed extensively with washing buffer and incubated for 2 h in the
appropriate fluorescein isothiocyanate-conjugated secondary
antibody (goat anti-mouse and donkey anti-goat IgG; Santa Cruz
Biotechnology, Inc., Dallas, TX, USA). The cells were then washed
three times with washing buffer and mounted in aqueous mounting
medium. The markers used for stem cell characterization included
nucleostemin (NS), CD166, Nanog, CD105 and CD13. The pan-neural
markers used in the present study were neuron-specific enolase
(NSE), neurofilament-L (NF-L), growth-associated protein 43
(GAP43), synaptosomal-associated protein 25 (SNAP25), syntabulin,
oligodendrocyte transcription factor 2 (Olig2) and
microtubule-associated protein 2 (MAP2). The primary and secondary
antibodies used in this study are listed in Table I. Images were captured using a
Nikon binocular inverted microscope (model TS100 F; Nikon
Corporation).
 | Table I.Antibodies used in
immunocytochemistry. |
Table I.
Antibodies used in
immunocytochemistry.
| Antibody | Antibody
hosta | IgG isotype | Supplier | Cat. no. |
|---|
| Primary |
|
|
|
|
| CD166 | Goat | IgG | Santa Cruz
Biotechnology, Inc. | sc-74558 |
| Nanog | Goat |
IgG1 | Santa Cruz
Biotechnology, Inc. | sc-293121 |
| Nucleostemin | Mouse | IgG | Santa Cruz
Biotechnology, Inc. | sc-166460 |
| CD105 | Mouse | IgG | Santa Cruz
Biotechnology, Inc. | sc-71042 |
| CD13 | Mouse | IgG | Santa Cruz
Biotechnology, Inc. | sc-166270 |
| NSE | Mouse |
IgG1 | Santa Cruz
Biotechnology, Inc. | sc-21738 |
| NF-L | Mouse |
IgG1 | Santa Cruz
Biotechnology, Inc. | sc-71678 |
| SNAP25 | Goat | IgG | Santa Cruz
Biotechnology, Inc. | sc-7538 |
| GAP43 | Goat | IgG | Santa Cruz
Biotechnology, Inc. | sc-7457 |
| MAP2 | Mouse | IgG | Santa Cruz
Biotechnology, Inc. | sc-135979 |
| Syntabulin | Mouse | IgG | Santa Cruz
Biotechnology, Inc. | sc-87447 |
| Olig2 | Goat | IgG1 | Santa Cruz
Biotechnology, Inc. | sc-19967 |
| Collagen I | Mouse | IgG1 | Santa Cruz
Biotechnology, Inc. | sc-59772 |
| Sox17 | Mouse | IgG2b, κ | BioLegend | 698501 |
| Secondary |
|
|
|
|
| Donkey anti-goat
IgG-FITC | Donkey | IgG | Santa Cruz
Biotechnology, Inc. | sc-2024 |
| Mouse anti-goat
IgG-FITC | Mouse |
IgG1 | Santa Cruz
Biotechnology, Inc. | sc-2356 |
| m-IgGkBP-FITC | – | IgG | Santa Cruz
Biotechnology, Inc. | sc-516140 |
| Goat anti mouse
IgG-FITC | Goat | IgG | Santa Cruz
Biotechnology, Inc. | sc-2010 |
Flow cytometry
Stem cell characterization and differential
expression at P2 and P3 were examined using flow cytometric
analysis. Briefly, cells from P2 and P3 (early passages) were
harvested using trypsin-EDTA digestion, centrifuged at 489 × g for
8 min at 4°C and re-suspended at a concentration of 106
cells/ml in DMEM/2% FBS. Aliquots containing 105 cells
were incubated with individual surface antigen-specific
fluorescent-labeled antibodies (Table
II) for 30 min at room temperature, and cells were then washed
in PBS containing 2% FBS. For the analysis of the intracellular
proteins nestin and SRY-box 2 (Sox2), permeabilization medium
(Intra prep; Beckman Coulter, Inc., Brea, CA, USA) was used prior
to the addition of the primary antibody. Finally, the cells were
fixed in 10% formalin prepared in PBS containing 2% FBS, and
analyzed using a flow cytometer (Beckman Coulter flow cytometry
system with CXP software analysis; Beckman Coulter, Inc., Brea, CA,
USA).
| Table II.Antibodies used in flow cytometric
analysis. |
Table II.
Antibodies used in flow cytometric
analysis.
| Antibody | Manufacturer | Cat. no. | Antibody volume
(µl)/100 µl cell suspension |
|---|
| FITC anti-human
CD45 | BioLegend | 368507 | 5 |
| APC anti-human
CD105 | BioLegend | 323207 | 5 |
| PE anti-human
Sox2 | BioLegend | 656103 | 5 |
| Alexa Fluor 488
anti-human β-tubulin III | Stemcell
Technologies, Inc. | 60100AD.1 | 5 |
| FITC anti-human
CD90 | BioLegend | 328107 | 5 |
| PE anti-human
CD166 | BioLegend | 343903 | 5 |
| Alexa Flour 488
anti-human nestin | Stemcell
Technologies, Inc. | 60091AD.1 | 5 |
Stem cell characterization
The analysis of surface epitope patterns and stem
cell marker proteins can aid the isolation and characterization of
IFPSCs. For stem cell characterization, cells from incubation day
14 (P2) were used. The cells were screened for MSC markers (CD90,
CD166 and CD105), an ESC marker (Sox2), a hematopoietic stem cell
(HSC) marker (CD45) and an early neuronal marker (nestin) using
flow cytometry analysis.
Differential expression analysis
between passages
As small neurite extensions appeared between P4 and
P5, nestin, an intermediate filament protein that is expressed in
dividing cells during the very early stages of development in the
central nervous system (14,15),
was also screened along with two MSC markers (CD90 and CD166) in
early passages of homogenous IFPSCs (P2 and P3). As CD105 and Sox2
were expressed in IFPSCs and in differentiating neurons, they were
not considered for further examination. IFPSCs in later passages
(P6) had a similar morphology to neuronal cells. β-tubulin III, a
neuron-specific protein used to confirm the neuronal commitment,
was screened in early and late passages of IFPSCs (P3 and P6).
RT-PCR detection
Semi-quantitative gene expression analysis was
performed using RT-PCR for stem cells, spontaneously differentiated
stem cells without external stimuli and stem cells with external
stimuli-induced differentiation. Briefly, RNA samples were isolated
using a Qiagen kit (Qiagen GmbH, Hilden, Germany) as per the
manufacturer's recommendations. RNA purity was confirmed by
determining the 260/280 nm absorbance ratio, and it was quantified
using the Bio Photometer D30 (Eppendorf, Hamburg, Germany). A total
of 1 µg RNA was then reverse transcribed into cDNA using
Omniscript® Reverse Transcriptase (Qiagen GmbH), as
described in the kit protocol. The reaction was performed at 37°C
for 60 min in a Master Cycler Pro-S (Eppendorf). The samples
selected for cDNA synthesis were highly pure, with a 260/280 ratio
between 1.8 and 2.0. Each reaction was prepared in a total reaction
mixture of 20 µl, containing 1 µg total RNA. Subsequently, PCR
amplification was performed using primers specifically designed to
amplify human NS, Nanog, neurotrophic receptor tyrosine kinase 1
(NTRK1), octamer-binding transcription factor 4 (Oct4), Sox2, CD105
and CD166 mRNA transcripts. A total of 3 µl RT product (cDNA) and
the HotStarTaq® Master Mix PCR kit (Qiagen GmbH) were
used for PCR in a total volume of 25 µl, according to the
manufacturer's protocol. The thermal cycler was programmed
according to the manufacturer's instructions. The PCR strips were
placed into the thermal cycler, and the cycling program was
started. Following amplification, the samples were stored at 4°C,
or at −30°C to −15°C for longer-term storage. GAPDH was used as an
endogenous control. All the primer sequences were determined using
established gene sequences and are listed in Table III. PCR products were separated
by 1.5% Ultra-pure agarose gel electrophoresis (Thermo Fisher
Scientific, Inc.) and DNA was visualized using ethidium bromide (20
µl). Semi-quantification of RT-PCR was conducted using ImageJ
software (version 1.52a; National Institutes of Health, Bethesda,
MD, USA) and results were normalized to GAPDH. The data were
analyzed using GraphPad Prism software (version 8; GraphPad
Software, Inc., La Jolla, CA, USA).
| Table III.Oligonucleotide primers used in
polymerase chain reaction. |
Table III.
Oligonucleotide primers used in
polymerase chain reaction.
| Genes | Primer
sequences | bp |
|---|
| Nanog | F:
5′-gtcttctgctgagatgcctcaca-3′ |
|
|
| R:
5′-cttctgcgtcacaccattgctat-3 | 262 |
| Nucleostemin | F:
5′-gggaagataaccaagcgtgtg-3′ |
|
|
| R:
5′-cctccaagaagtttccaaagg-3′ | 98 |
| Oct4 | F:
5′-gttgatcctcggacctggcta-3′ |
|
|
| R:
5′-ggttgcctctcactcggttct-3′ | 646 |
| Sox2 | F:
5′-gccgagtggaaacttttgtcg-3′ |
|
|
| R:
5′-gcagcgtgtacttatccttctt-3 | 154 |
| CD105 | F:
5′-tgtctcacttcatgcctcagct-3′ |
|
|
| R:
5′-aggctgtccatgttgaggagt-3′ | 377 |
| CD166 | F:
5′-agataccattatcatcataccttgccgact-3′ |
|
|
|
R:5′-tgtctttgtattcgtgtacatcgtcg-3′ | 157 |
| NSE |
F:5′-ctgatgctggagttggatgg-3′ |
|
|
| R:
5′-ccattgatcacgttgaaggc-3′ | 188 |
| NF-L | F:
5′-tcctactacaccagccatgt-3′ |
|
|
| R:
5′-tccccagcaccttcaacttt-3′ | 284 |
| MDK | F:
5′-cgactgcaagtacaagtttgagaac-3′ |
|
|
| R:
5′-tctcctggcactgagcattg-3′ | 110 |
| GFAP | F:
5′-cctctccctggctcgaatg-3′ |
|
|
| R:
5′-ggaagcgaaccttctcgatgta-3′ | 161 |
| Collagen I | F:
5′-gcgagagcatgaccgatgga-3′ |
|
|
| R:
5′-gcggatctcgatctcgttgga-3′ | 218 |
| CBFA1 | F:
5′-cagaccagcagcactccata-3′ |
|
|
| R:
5′-ttcaatatggtcgccaaaca-3′ | 256 |
| Osteocalcin | F:
5′-atgagagccctcacactcctc-3′ |
|
|
| R:
5′-gccgtagaagcgccgataggc-3′ | 297 |
| RANKL |
F:5′-gggaattacaaagtgcaccag-3′ |
|
|
| R:
5′-ggtcgggcaattctgaatt-3′ | 790 |
| TAT | F:
5′-tgagcagtctgtccactgcc-3′ |
|
|
| R:
5′-atgtgaatgaggaggatctgag-3′ | 358 |
| TO | F:
5′-atacagagacttcagggagc-3′ |
|
|
| R:
5′-tggttgggttcatcttcggtat-3′ | 299 |
| Albumin | F:
5′-tgcttgaatgtgctgatgacagg-3′ |
|
|
| R:
5′-aaggcaagtcagcaggcatctcatc-3′ | 161 |
| GAPDH | F:
5′-gggctgcttttaactctgct-3′ |
|
|
| R:
5′-tggcaggtttttctagacgg-3′ | 496 |
Stem cell characterization using
RT-PCR detection
To analyze the expression pattern of stem cell
markers in consecutive passages from days 14–42, total RNA samples
were extracted from 100% confluent IFPSCs on days 14 (P2), 28 (P4)
and 42 (P6), and subjected to RT-PCR.
Characterization of spontaneously
differentiated neurons using RT-PCR detection
To analyze the expression of pan-neural markers of
spontaneously differentiated neuronal cells, RNA was isolated from
IFPSCs at days 14 (P2), 35 (P5) and 62 (P7). Subsequently, PCR
amplification was performed using primers specifically designed to
amplify human NSE, glial fibrillary acidic protein (GFAP) and
midkine (MDK). GAPDH served as an endogenous control.
Characterization of differentiated
stem cells (as three germ layers)
IFPSC from day 14 (P2) served as a control in the
characterization of stem cells differentiated into three germ
layers. At the appropriate days after induction, total RNA was
isolated from the induced groups to demonstrate the differentiation
of the three germ layers. PCR amplification was performed using
primers specifically designed to amplify human neuronal markers
(NSE, NF-L and MDK), hepatocyte markers [tyrosine aminotransferase
(TAT), tryptophan 2,3-dioxygenase (TO) and albumin], osteogenic
markers [collagen I, core-binding factor subunit α-1 (CBFA1),
osteocalcin and receptor activator of nuclear factor-κΒ ligand
(RANKL)] and GAPDH.
Western blot analysis
Reduced expression of NS at later passages was
examined using western blot analysis. Protein samples were
extracted from 100% confluent IFPSCs on days 14 (P2), 28 (P4) and
42 (P6). Briefly, IFPSCs were rinsed three times with ice-cold
DPBS, then lysed in 300 µl cold RIPA buffer (containing 50 mM
Tris-HCl, pH 7.4, 150 mM NaCl, 2 mM EDTA, 1% Nonidet P-40 and 0.1%
SDS) and kept on ice for 30 min with occasional swirling to enable
uniform spreading. The cell lysate was collected using a cell
scraper and centrifuged at 2,770 × g for 30 min at 4°C, and the
supernatant was stored at −71°C. Total protein concentration was
measured using the Lowry method. Next, protein (35–40 µg) was
loaded into each well of a 10% SDS gel and electrophoresed.
Electrophoresed bands from polyacrylamide gels were then
transferred to a nitrocellulose membrane. The membranes were
blocked for 2 h at room temperature with skimmed milk powder,
washed and probed with specific primary antibodies overnight at 4°C
(1:500 dilutions). Affinity-purified mouse monoclonal antibody for
NS (cat. no. sc-166460) and mouse monoclonal antibody specific for
GAPDH (cat. no. sc-47724) were used as the primary antibodies.
Following washing, the membranes were incubated with horseradish
peroxidase-conjugated goat anti-mouse IgG (cat. no. sc-2005)
secondary antibody for 2 h at room temperature (1:1,000). All
primary and secondary antibodies were purchased from Santa Cruz
Biotechnology, Inc. Subsequent to washing three times with
DPBS/0.1% Tween, the blots were developed using an enhanced
chemiluminescence kit (GE Healthcare, Chicago, IL, USA).
Semi-quantification was conducted by measuring band intensity in
developed x-ray films using ImageJ software (version 1.52a;
National Institute of Health) and results were normalized to GAPDH
(16). Data were analyzed using
GraphPad Prism software (version 8; GraphPad Software, Inc.).
Characterization of conditioned medium
secreted by IFPSCs
A marked difference in the expression of markers was
observed at P3, and neurotrophic factors may be secreted by IFPSCs
in early passage (P2) in the discarded medium. Therefore, medium
collected at P2 was used for biophysical characterization. When the
cells reached confluence, the medium was changed to serum-free
DMEM, and IFPSCs were maintained in this medium for 72 h.
Subsequently, conditioned media were collected from IFPSCs using
Amicon Ultra-15 Centrifugal Filter Units 3000 at molecular weight
cutoffs. Conditioned medium was subjected to biophysical
characterization to analyze the functional groups present and to
compare them with neurotrophic factor-specific peaks using a
Fourier transform infrared (FTIR) spectrometer (FTIR-6300; JASCO
International Co., Ltd., Tokyo, Japan). The data obtained were
analyzed using the Origin Pro 8.0 software (Origin Lab Corporation,
Northampton, MA, USA), and the graph was plotted.
Statistical analysis
All experiments were performed at least three times
independently. The proliferation analysis experiment was also
performed in triplicate. The data were analyzed using GraphPad
Prism software (version 7; GraphPad Software, Inc.) and subjected
to one-way analysis of variance with post-hoc Tukey test to
determine the significant difference of PDT between P1, P3 and P6.
Data are presented as the mean ± standard error of the mean.
P<0.05 was considered to indicate a statistically significant
difference.
Results
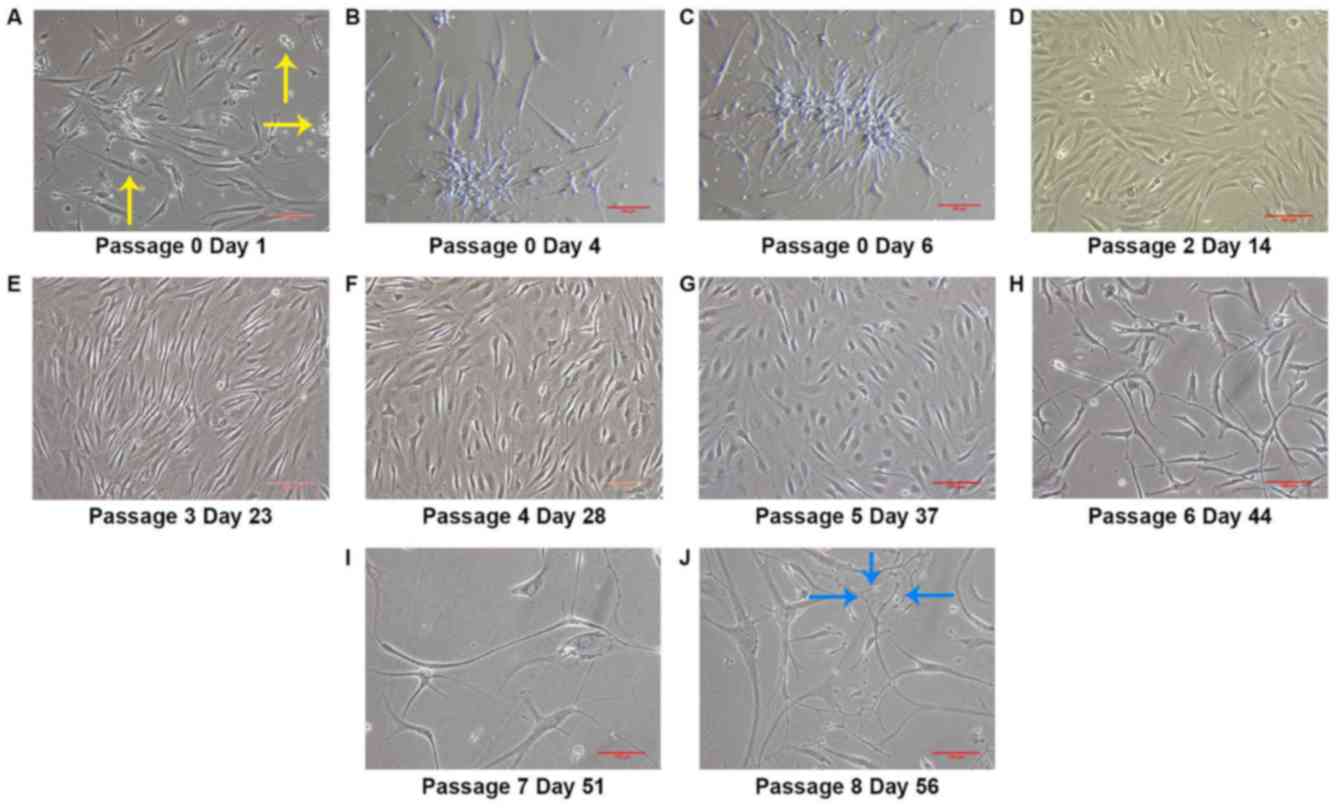
Loss of fibroblast morphology on
sequential passaging
Morphological analysis revealed that the stem cells
lost their fibroblast morphology and acquired neural lineage cell
morphology following sequential passaging. At day 0 (P0), cells
obtained from SVF were not uniform and contained both adherent and
non-adherent cells, appearing as a mixed culture containing
morphologically different types of cells (Fig. 1A). At day 4 (P0), IFPSCs formed
small colonies and were densely distributed with a spindle-shaped
morphology (Fig. 1B). The colonies
continued to grow (Fig. 1C) and
reached confluence on day 7. Following two passages, IFPSCs formed
a homogenous population of fibroblast-like spindle-shaped cells
forming a monolayer, and all the cells adhered to the surface of
the culture dish (Fig. 1D). After
P4, the cells became very thin, but maintained fibroblast-like
structures. No significant difference was observed in cell growth
until day 35 (Fig. 1E, F). The
spindle-shaped cells observed initially (P2-4) began to
differentiate toward neuronal lineage, exhibiting neurite-like
projections at P5 between days 35 and 42 (Fig. 1G). It was observed that the
differentiation of IFPSCs toward a neurogenic phenotype occurred
without any induction at later passages (after P5). Cells became
long and thin, with prominent neurite outgrowth, and the cell body
consisted of a nucleus and two or more fibers interlinked with each
other (Fig. 1H-J). Thus, the
results indicated that IFPSCs remained undifferentiated until day
35 of culture.
P2 IFPSCs express MSC markers and
morphologically resemble MSCs
Flow cytometric analysis of P2 cells, which were
cultured and expanded in the absence of any induction stimuli,
revealed that the undifferentiated stromal cells were consistently
positive for a number of MSC surface markers, including CD105
(82.2%), CD166 (100%) and CD90 (100%), whereas they were negative
for nestin and the HSC marker CD45 (0%). These cells also expressed
the transcription factor Sox2 (92.3%; Fig. 2A). In addition, immunocytochemical
analysis revealed the positive expression of stem cell markers,
including NS, Nanog, CD166, CD105 and CD13, in these cells
(Fig. 2B). NS is a proliferative
stromal cell marker, whereas CD105 and CD166 serve a crucial role
in stem cell maintenance. It was observed that CD13, a
multifunctional aminopeptidase cell surface molecule involved in
stem cell maintenance, was densely expressed on P2 IFPSCs. Taken
together, these results confirmed that the isolated IFPSCs
exhibited MSC-like features with good initial viability, and high
adherence and proliferation ability.
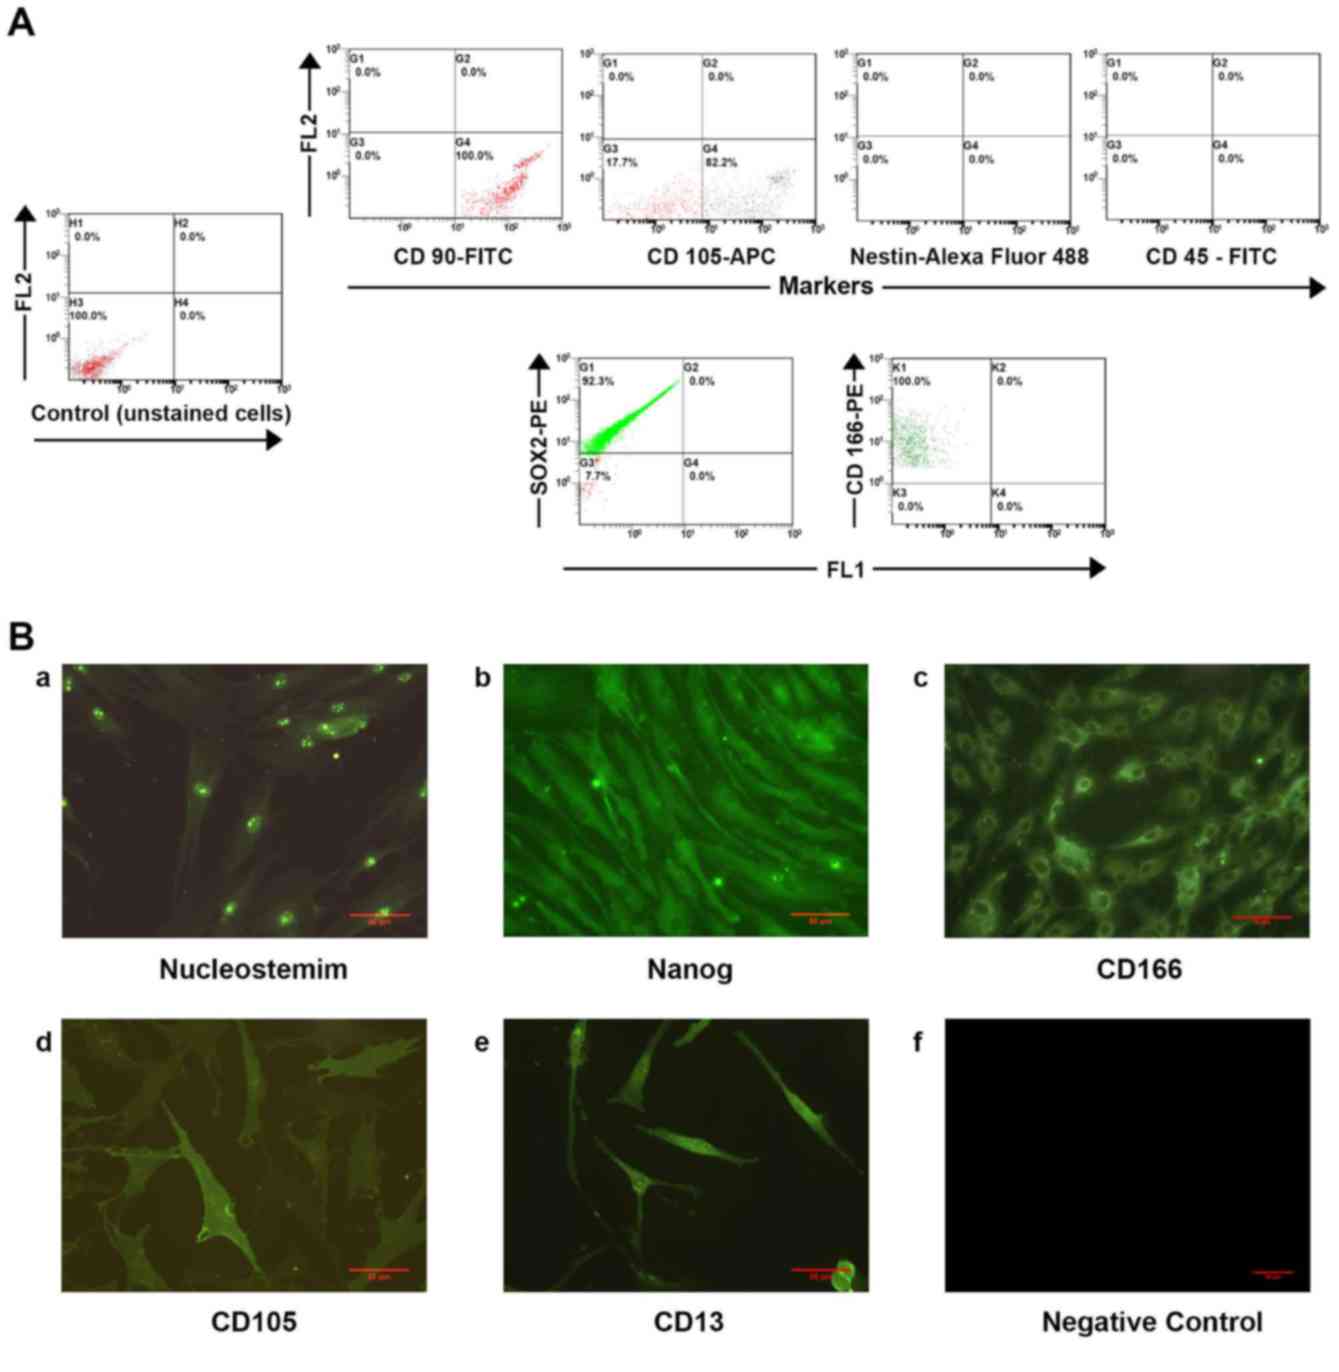 | Figure 2.(A) Flow cytometric characterization
of IFPSCs at day 14 (P2), with unstained cells serving as the
negative control. The cells were characterized according to the
surface antigen expression of CD90, CD105, CD166 and CD45, as well
as the transcription factor Sox2 and early neuronal marker nestin.
(B) Immunocytochemical analysis of IFPSCs for stem cell markers at
day 14 (P2; magnification, ×20). FITC-stained images show the
positive expression of the following stem cell-specific markers:
(a) Nucleostemin, (b) Nanog, (c) CD166, (d) CD105 and (e) CD13,
with (f) unstained cells serving as the negative control. Scale
bar, 50 µm. IFPSCs, infrapatellar fat pad-derived stem cells; FITC,
fluorescein isothiocyanate; PE, phycoerythrin; APC,
allophycocyanin; Sox2, SRY-box 2. |
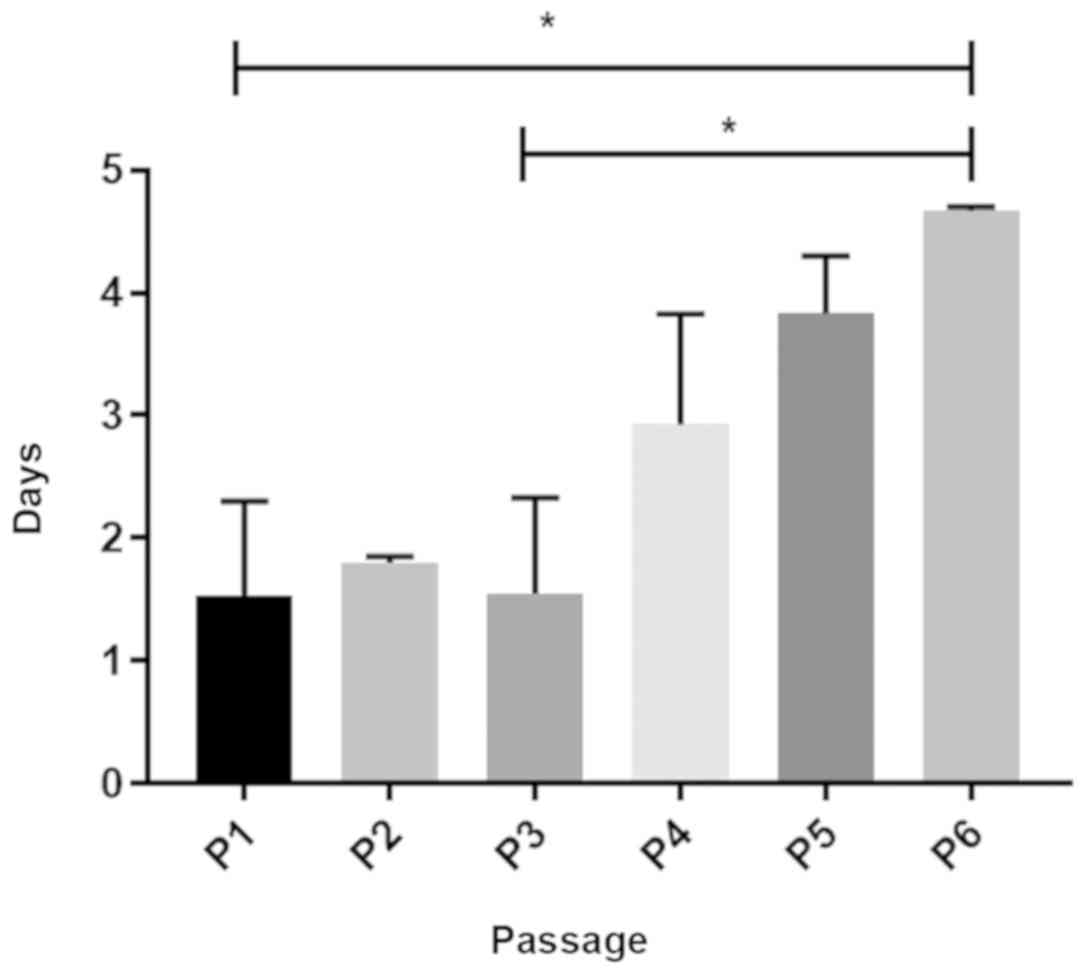
Increase in PDT at later passages
reveals decreased proliferative index
The growth rate of IFPSCs was analyzed between days
14 (P2) and 49 (P7). For all passages, 5×10⁵ cells were
initially seeded in triplicates (n=3). Fig. 3 presents a graphical representation
of the PDT of IFPSCs in prolonged culture. P2 cells exhibited a
lower PDT, indicating a high proliferative capacity. A gradual
increase in PDT was observed after P4, and the cell number was
reduced considerably by day 42. These results were accompanied by
changes in cell morphology at >5 passages (Fig. 1). At P6, the PDT was significantly
increased when compared with that at P2 and P3 (P<0.05; Fig. 3). Passages beyond P7 were also
maintained, however, the growth rate could not be analyzed as the
cells failed to reach 100% confluence even after 14 days in
culture.
IFPSCs exhibit reduced expression of
the markers CD166 and NS on increased passage
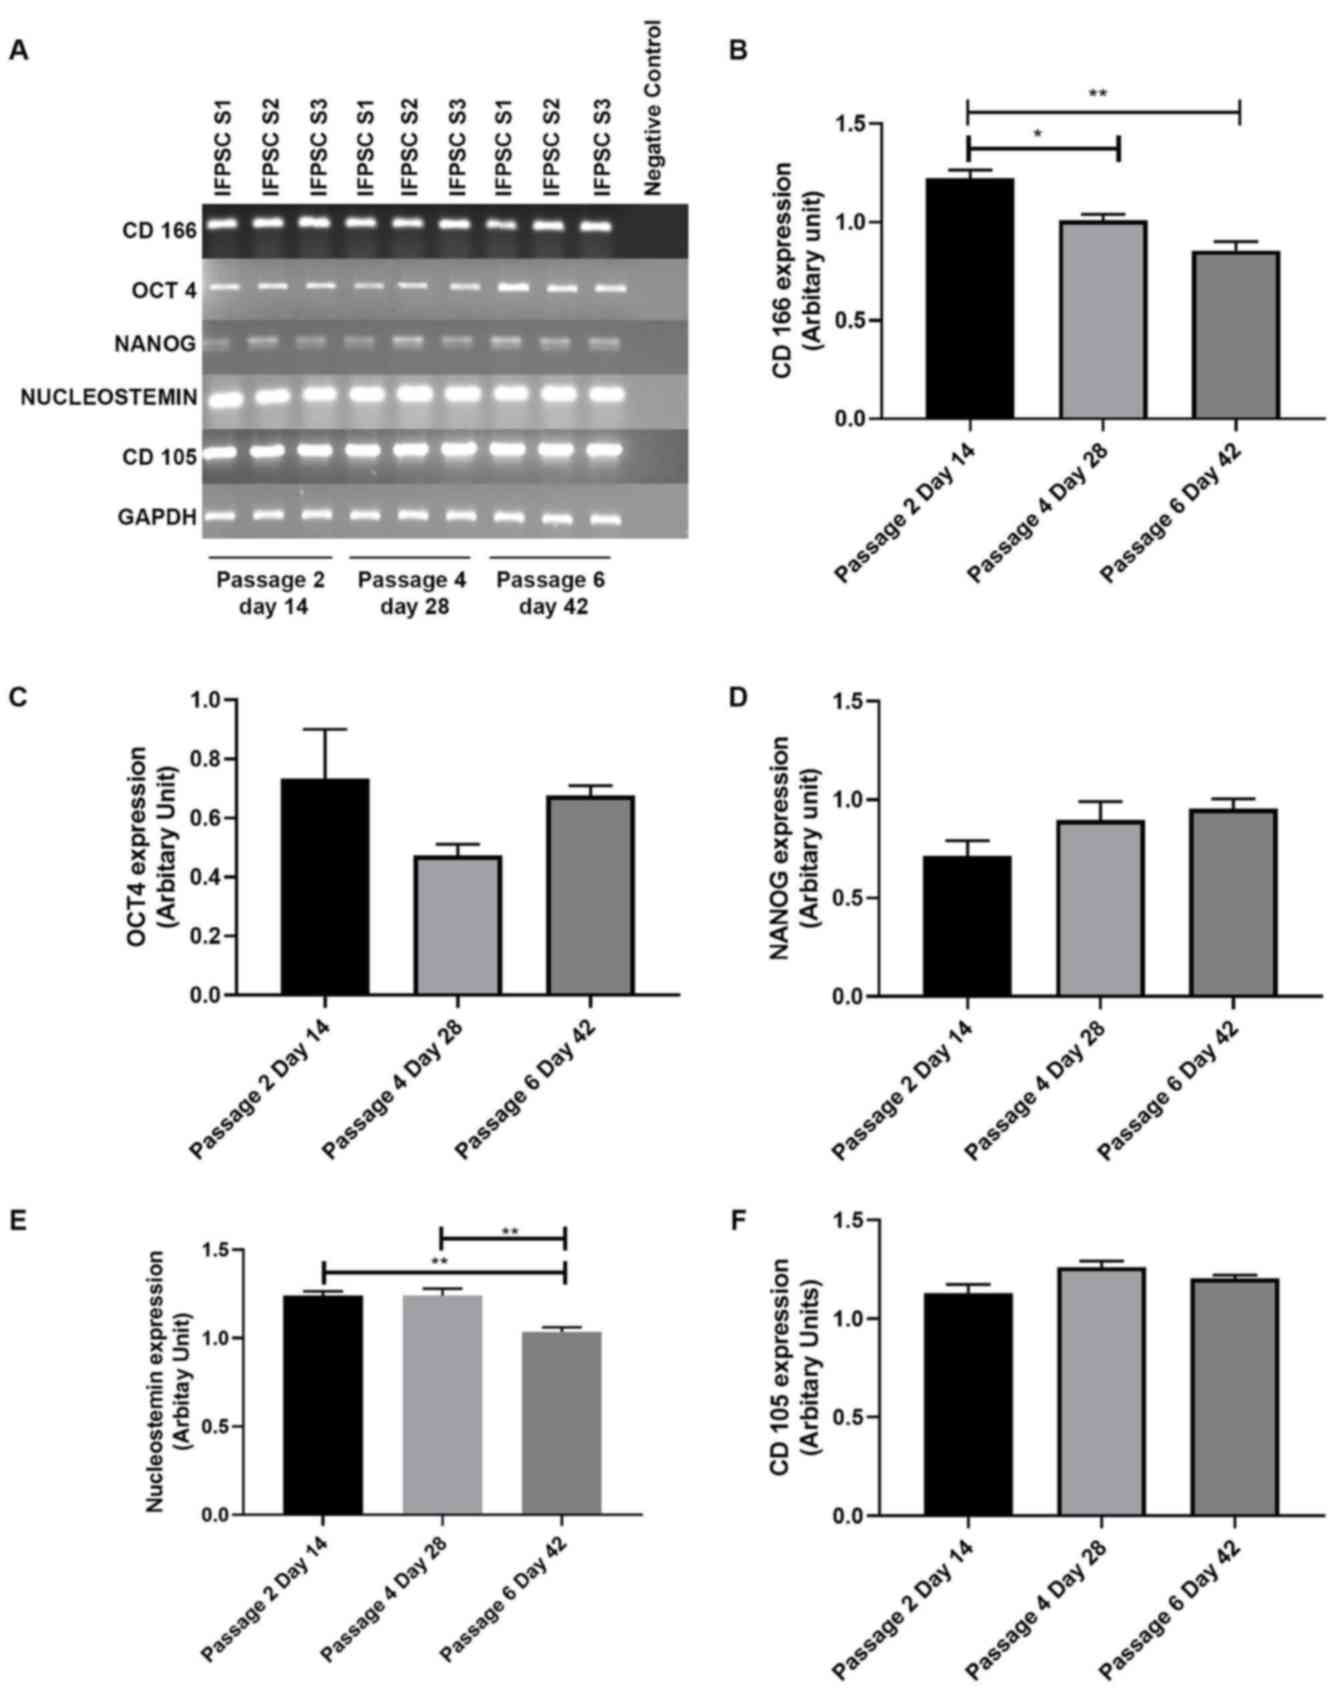
To analyze the stemness properties of IFPSCs during
prolonged culture in consecutive passages at days 0–42, the
expression levels of several stem cell markers, including NS,
Nanog, Oct4, GAPDH, CD105 and CD166, were analyzed in different
passages of IFPSCs (P2-6) using RT-PCR. GAPDH served as the
endogenous control in the experiment (Fig. 4A). As shown in Fig. 4B and 4E, significant differences in the mRNA
levels of CD166 and NS markers were detected on P6 day 42 compared
with on P2 day 14. Conversely, there was no significant difference
in the expression levels of Nanog, Oct4 and CD105 (Fig. 4C, D and F). Reduced expression of
CD166, which serves a crucial role in stem cell maintenance, and
NS, a stromal proliferation marker, clearly indicated that IFPSCs
lose stemness properties on increased passage.
Expression of neuronal-specific
markers in IFPSCs at later passages
As mentioned earlier, morphological analysis
revealed changes in the cell structure toward a differentiated
neuronal-like phenotype in cells at later passages (P>6).
Therefore, immunocytochemical staining was subsequently performed
to detect the expression of neural lineage markers, including
GAP43, syntabulin, NSE, Snap25, NF-L, MAP2 and Olig2, in prolonged
cultures of IFPSCs. Prolonged culturing of IFPSCs resulted in
neural lineage marker expression, whereas IFPSCs from early
passages were negative for neuronal markers (data not shown). As
shown in Fig. 5A, GAP43, a protein
associated with nerve growth, was expressed in the cytoplasm and
was present in the dynamic nerve filaments. Syntabulin, a
Golgi-localized protein involved in the anterograde axonal
transport, was present in the perinuclear region and protracted
along the neuronal processes. Furthermore, the presynaptic fusion
protein SNAP25 was concentrated in the perinuclear region and
distributed sparsely along the neuronal filaments. NF-L, which is
involved in transport, was widely expressed all over the cells and
appeared in the form of discrete pockets of expression. Expression
of MAP2, which is associated with dendrite elongation, was also
detected in the cells. Finally, Olig2, a transcription factor
involved in ventral neuroectodermal progenitor cell fate, was also
expressed in the differentiating cells (Fig. 5A).
 | Figure 5.(A) Immunocytochemical analysis of
IFPSCs on day 42 (>P6) indicated positivity for all the neuronal
markers tested (magnification, ×20), as follows: (a) NSE; (b)
GAP43, with the purple arrow indicating that axons are concentrated
with GAP43; (c) NF-L, with the yellow arrow indicating discrete
points of NF-L positivity in the filament and cytoplasm; (d)
SNAP25, with the blue arrow showing its concentration in the center
and distribution along the axonal projections; (e) Olig2, with more
uniform distribution observed across the cell compared with the
localized expression of other proteins, where there is a clear
delineation of the nucleus; (f) syntabulin, with the orange arrow
showings its Golgi localization and distribution in a thin line
along the axonal projections; (g) MAP2; and (h) negative control.
Scale bar, 50 µm. (B) Semi-quantitative gene expression profile of
neuronal markers in the protracted culture of IFPSCs at P5, day 35
and P7 day 62. IFPSCs from P2 (day 14) served as the control. (C)
Flow cytometric comparative analysis of fluorescent protein
expression in IFPSCs from P3 and P6. Expression of neuron-specific
marker β-tubulin III was expressed at P6 (89.2%), whereas it was
absent at P3. (D) Semi-quantification of reverse
transcription-polymerase chain reaction was conducted using ImageJ
software and results were normalized to GAPDH. (a) GFAP, (b) NF-L,
(c) NSE and (d) MDK expression was analyzed. Statistical analysis
was conducted using Student's t-test. There was an increase in the
expression of neuronal specific makers NSE, NF-L and MDK at P7 day
62 IFPSCs, infrapatellar fat pad-derived stem cells; NSE,
neuron-specific enolase; GAP43, growth-associated protein 43; MDK,
midkine; NF-L, neurofilament-L; SNAP25, synaptosomal-associated
protein 25; Olig2, oligodendrocyte transcription factor 2; MAP2,
microtubule-associated protein 2. |
As shown in Fig.
5B, semi-quantitative gene expression analysis revealed the
stage-specific expression of GFAP and NF-L in the early and late
passages, respectively (17–20).
As these intermediate filaments are cell-type specific, early
neural stem/precursor cells exhibited high GFAP expression at P5,
whereas its expression was reduced at P7; however, at P5, cells
exhibited low NF-L expression, whereas upon neuronal
differentiation these cells exhibited higher NF-L expression levels
at passage P7 (Fig. 5Da and b).
NSE, which has neurotrophic and neuroprotective properties, was
sparsely expressed in the early passages and strongly expressed in
later passages (Fig. 5Dc).
Similarly the neurite outgrowth-promoting factor MDK was not
expressed in cells at day 14 (P2), but was expressed by P5 and 7
(Fig. 5Dd). In addition, as shown
in Fig. 5C, the expression of
neural-specific marker β-tubulin III was considerably increased at
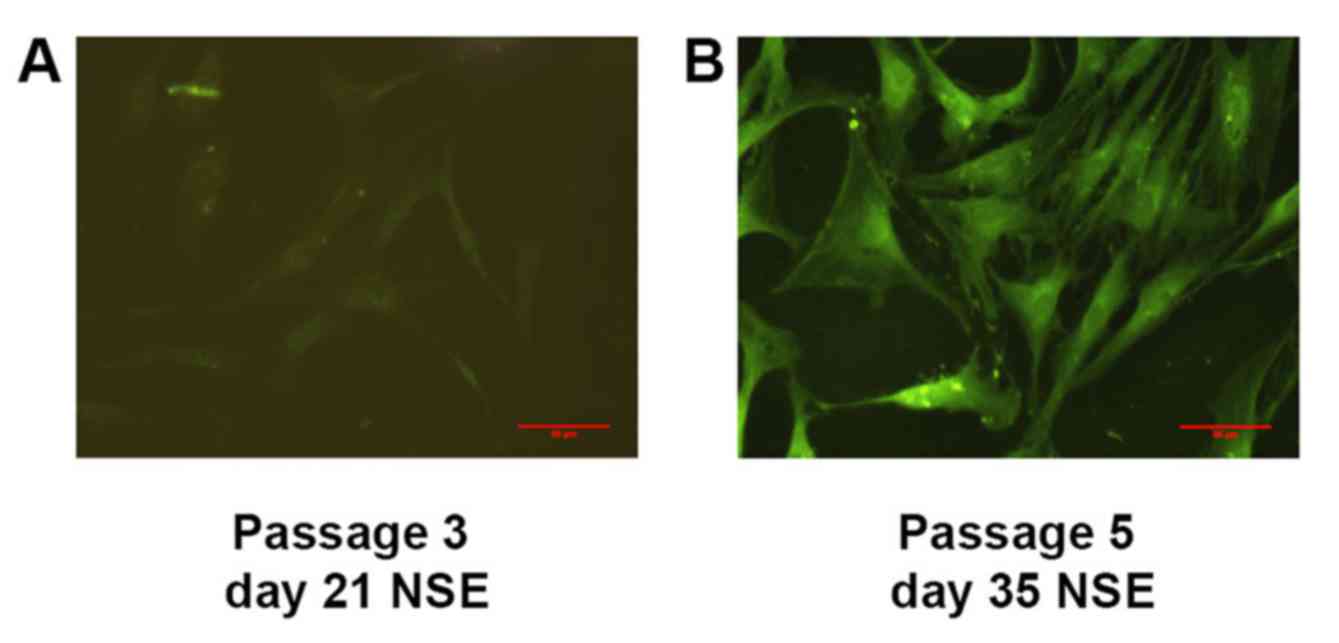
P6, despite this being absent at P3. Parallel immunostaining also
revealed that NSE was localized in the cytoplasm of IFPSCs from P5,
whereas faint expression of NSE was observed earlier, at day 21
(P3; Fig. 6); however, the cells
were negative for expression of other neuron-specific markers.
Taken together, these results indicated that IFPSCs spontaneously
acquire expression of neuronal markers at later passages and become
neural lineage cells.
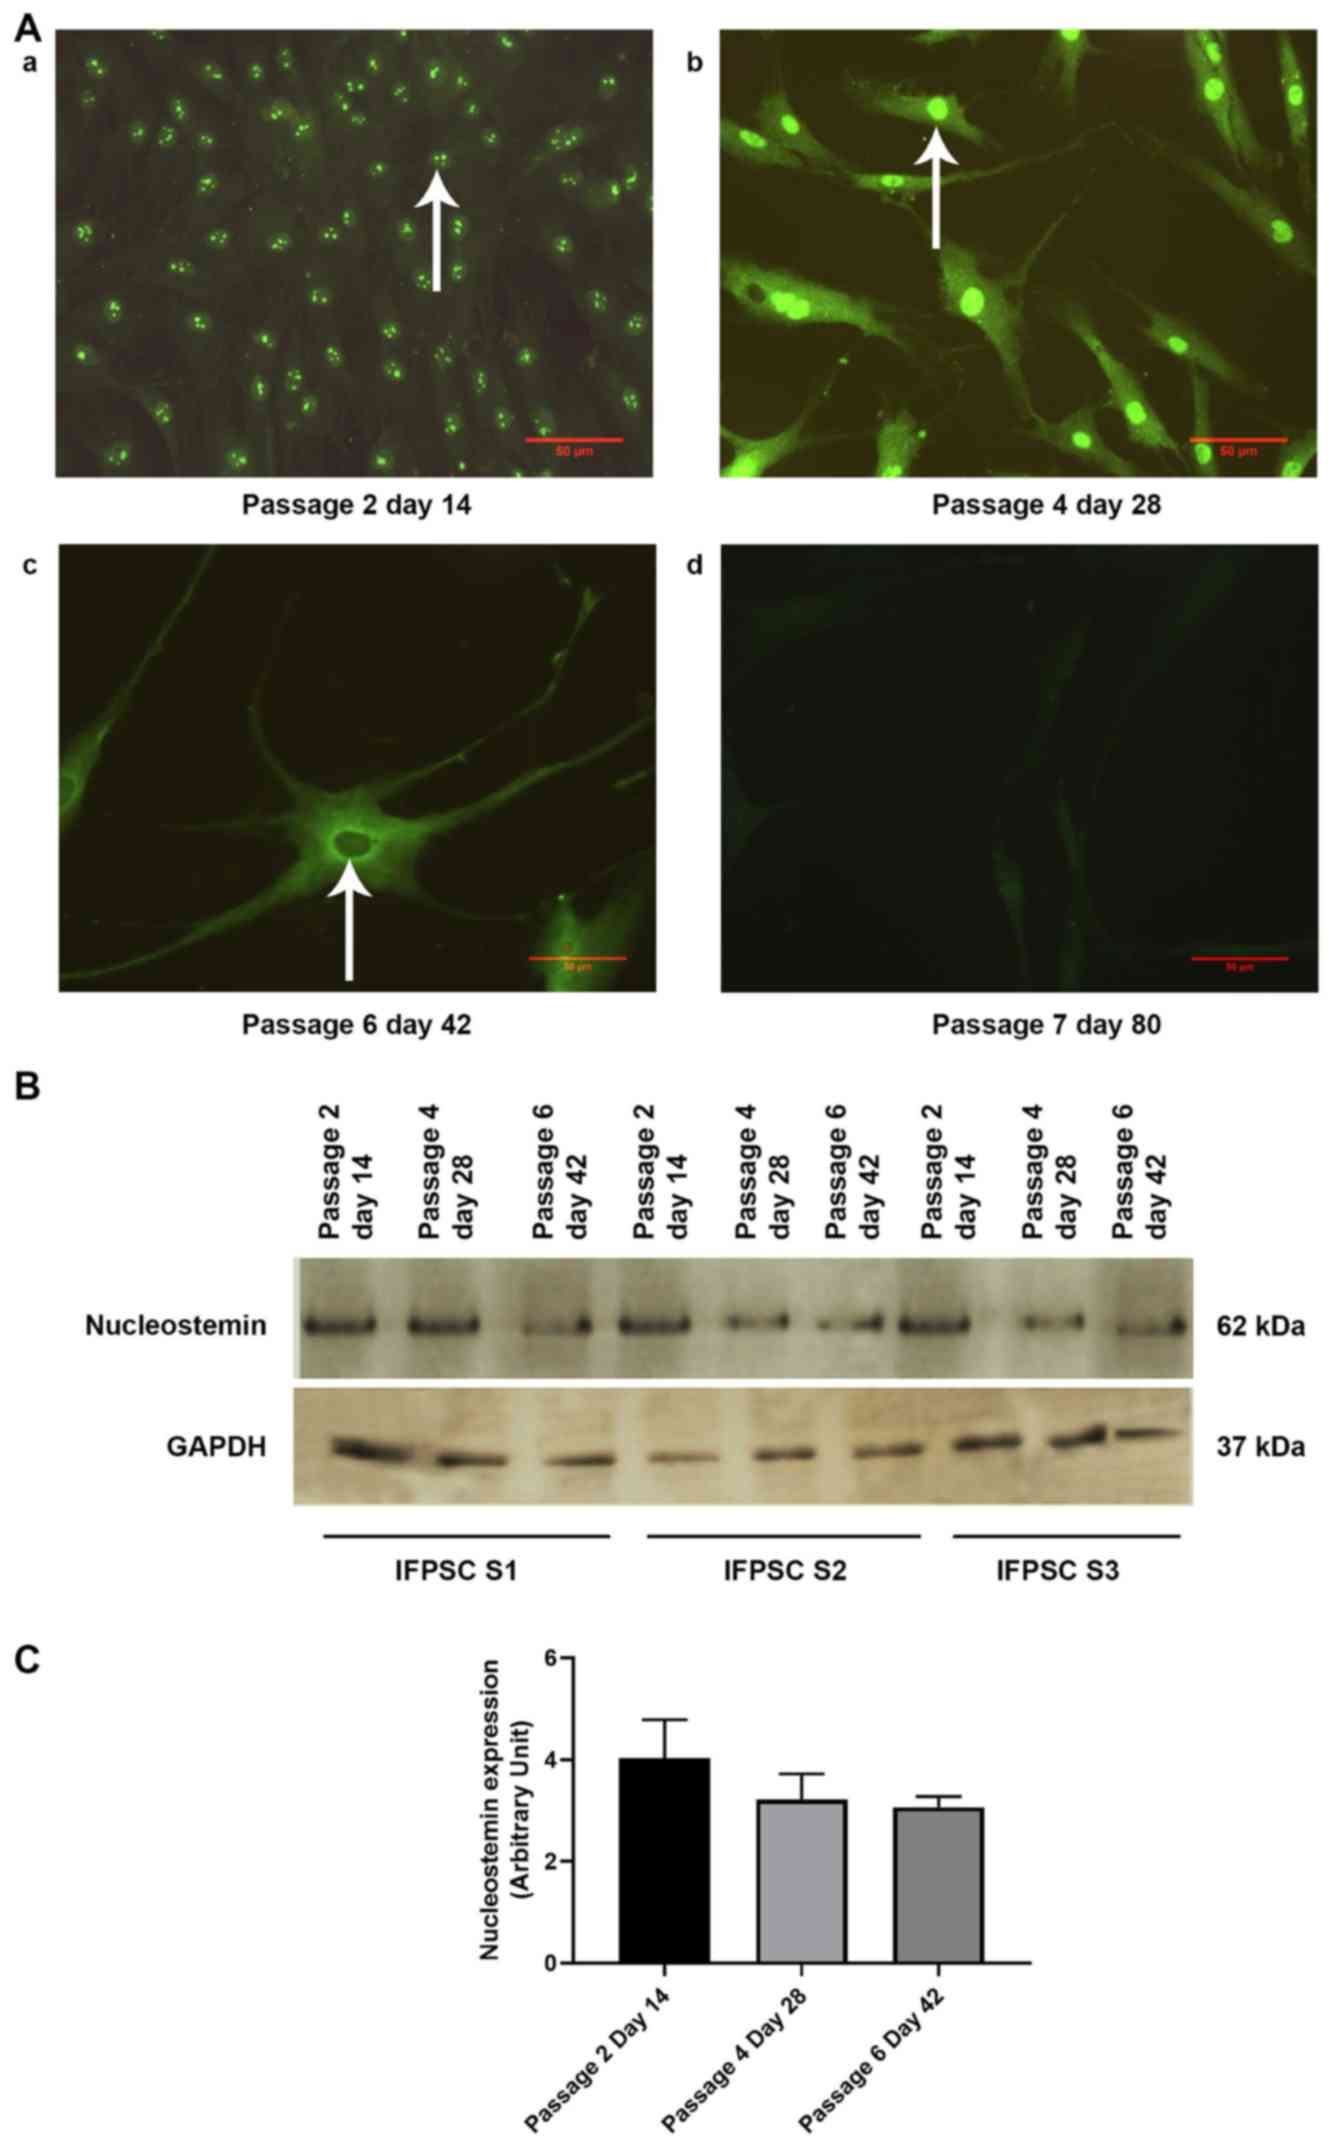
Loss of NS in the nuclear compartment
and reduction in the expression of NS during prolonged culture of
IFPSCs may predict loss of stemness
At day 14 (P2), NS was localized predominantly in
the nucleolus, and was expressed in the nucleoplasm at day 28 (P4).
As the cells spontaneously progressed toward neuronal
differentiation, the cellular localization of NS disappeared from
the nucleus and was completely lost at later stages (Fig. 7A). No changes in the localization
pattern of CD166 and CD105 were observed between days 0 and 28. As
a reduction in cell number was observed at later passages, the
expression of NS was analyzed in the IFPSCs from all three samples
on days 14, 28 and 42, with GAPDH serving as the endogenous
control. This analysis revealed a slight reduction in NS expression
at day 42 (Fig. 7B and C).
Early IFPSCs (P2 day 14) express high levels of
NS and have the ability to differentiate into all three germ
layers
Differentiation into the
neuroectodermal lineage
IFPSCs at day 14 (P2) of culture were differentiated
into neural lineage cells when cultured in DMEM serum-free media
supplemented with bFGF, an established neural inducer. Once the
neural induction media were added, the cells became elongated with
numerous neurite outgrowths formed. Reduced cell proliferation was
observed as the differentiation progressed further. At day 18 after
induction, the cells were immunostained with the neural-specific
marker MAP2, confirming neurogenic differentiation. Additionally,
the gene expression analysis revealed that bFGF-induced cells
expressed the neuron-specific proteins NSE, NF-L and MDK, with a
gradual increase in the expression levels of NSE and NF-L detected
by western blot analysis (Fig.
8A-C).
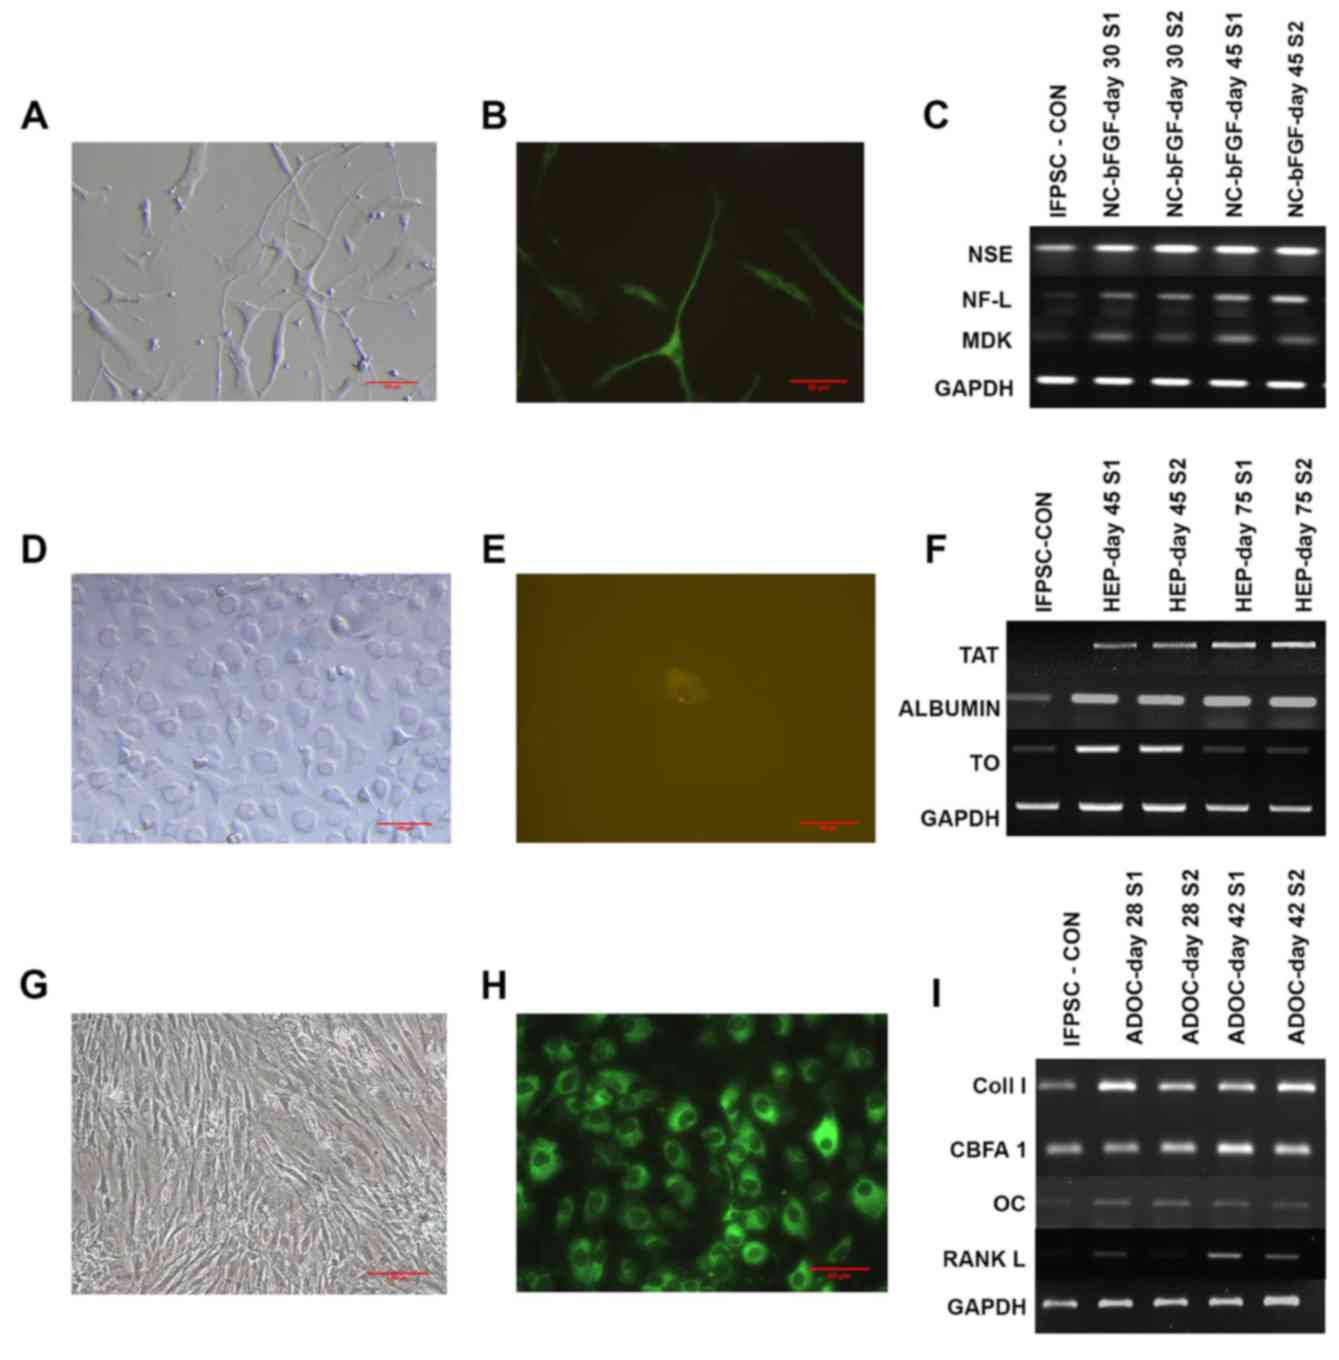 | Figure 8.Differentiation of
nucleostemin-expressed cells (early P2 day 14) to all three germ
layers proved their stemness. Morphological analysis
(magnification, ×10; scale bar, 100 µm) validated the cell
differentiation, immunocytochemical analysis (magnification, ×20;
scale bar, 50 µm) indicated the cell specificity, and
semi-quantitative gene analysis validated their functionality. (A)
Morphological analysis of neuroectoderm neuronal lineage cells, (B)
immunocytochemical analysis of neuronal marker MAP2 at day 18 after
neural induction, and (C) neural-specific gene expression. (D)
Morphological analysis of definitive endoderm hepatocytes, (E)
immunocytochemical analysis of their marker Sox17 at day 28 after
induction, and (F) hepatocyte-specific gene expression. (G)
Morphological analysis of mesoderm osteogenic cells, (H)
immunocytochemical analysis of the marker collagen I at day 18
after induction, and (I) osteogenic gene expression. S1 and S2
represent samples 1 and 2, respectively. MAP2,
microtubule-associated protein 2; Sox17, SRY-box 17. |
Differentiation into hepatocyte
lineage
Cells at day 14 (P2) of culture were supplemented
with the pre-induction medium, followed by hepatic induction and
hepatic maturation media. During hepatic transdifferentiation, the
IFPSCs retained their spindle shape during preconditioning, whereas
exposure to the induction medium resulted in the cells becoming
flat and broad. Later, during the maturation phase, the cells
acquired the classical cuboidal to polygonal shape of hepatocytes.
Unlike for the other two lineages, the endoderm lineage
differentiation occurred much more slowly. At day 28 after
induction, the cells were positive for the definitive endoderm
marker Sox17, confirming the lineage specificity. Functional
hepatocyte-specific markers were expressed in differentiated
hepatocytes, including TAT, albumin and TO. When TAT and albumin
were constitutively expressed, there was a reduction in the
expression of TO, which indicated stringent maintenance of
differentiated hepatocytes in vitro (Fig. 8D-F).
Differentiation into osteogenic
lineage
When day 14 (P2) IFPSCs were cultured in osteogenic
induction media, they differentiated into osteogenic lineage cells
and exhibited mineralization. Compared with the IFPSCs, the
proliferation of adipose tissue-derived osteogenic cells (ADOCs)
was considerably higher. Cells formed reticular structures, rather
than the classical spindle-shaped stem cells. Osteogenic
differentiation at day 18 after induction was confirmed by
immunostaining with collagen I antibody. The differentiated cells
synthesized the collagen fibers required to create the
extracellular matrix for bone tissue. Furthermore, the gene
expression analysis revealed that the ADOCs expressed CBFA1, which
is an essential transcription factor involved in osteogenic
differentiation. ADOCs also expressed osteocalcin, a
non-collagenous bone hormone, and RANKL, which regulates osteogenic
differentiation (Fig. 8G-I).
Taken together, these results confirmed the
generation of three specific germ layers from NS-rich day 14 (P2)
cells that was induced by specific culture conditions.
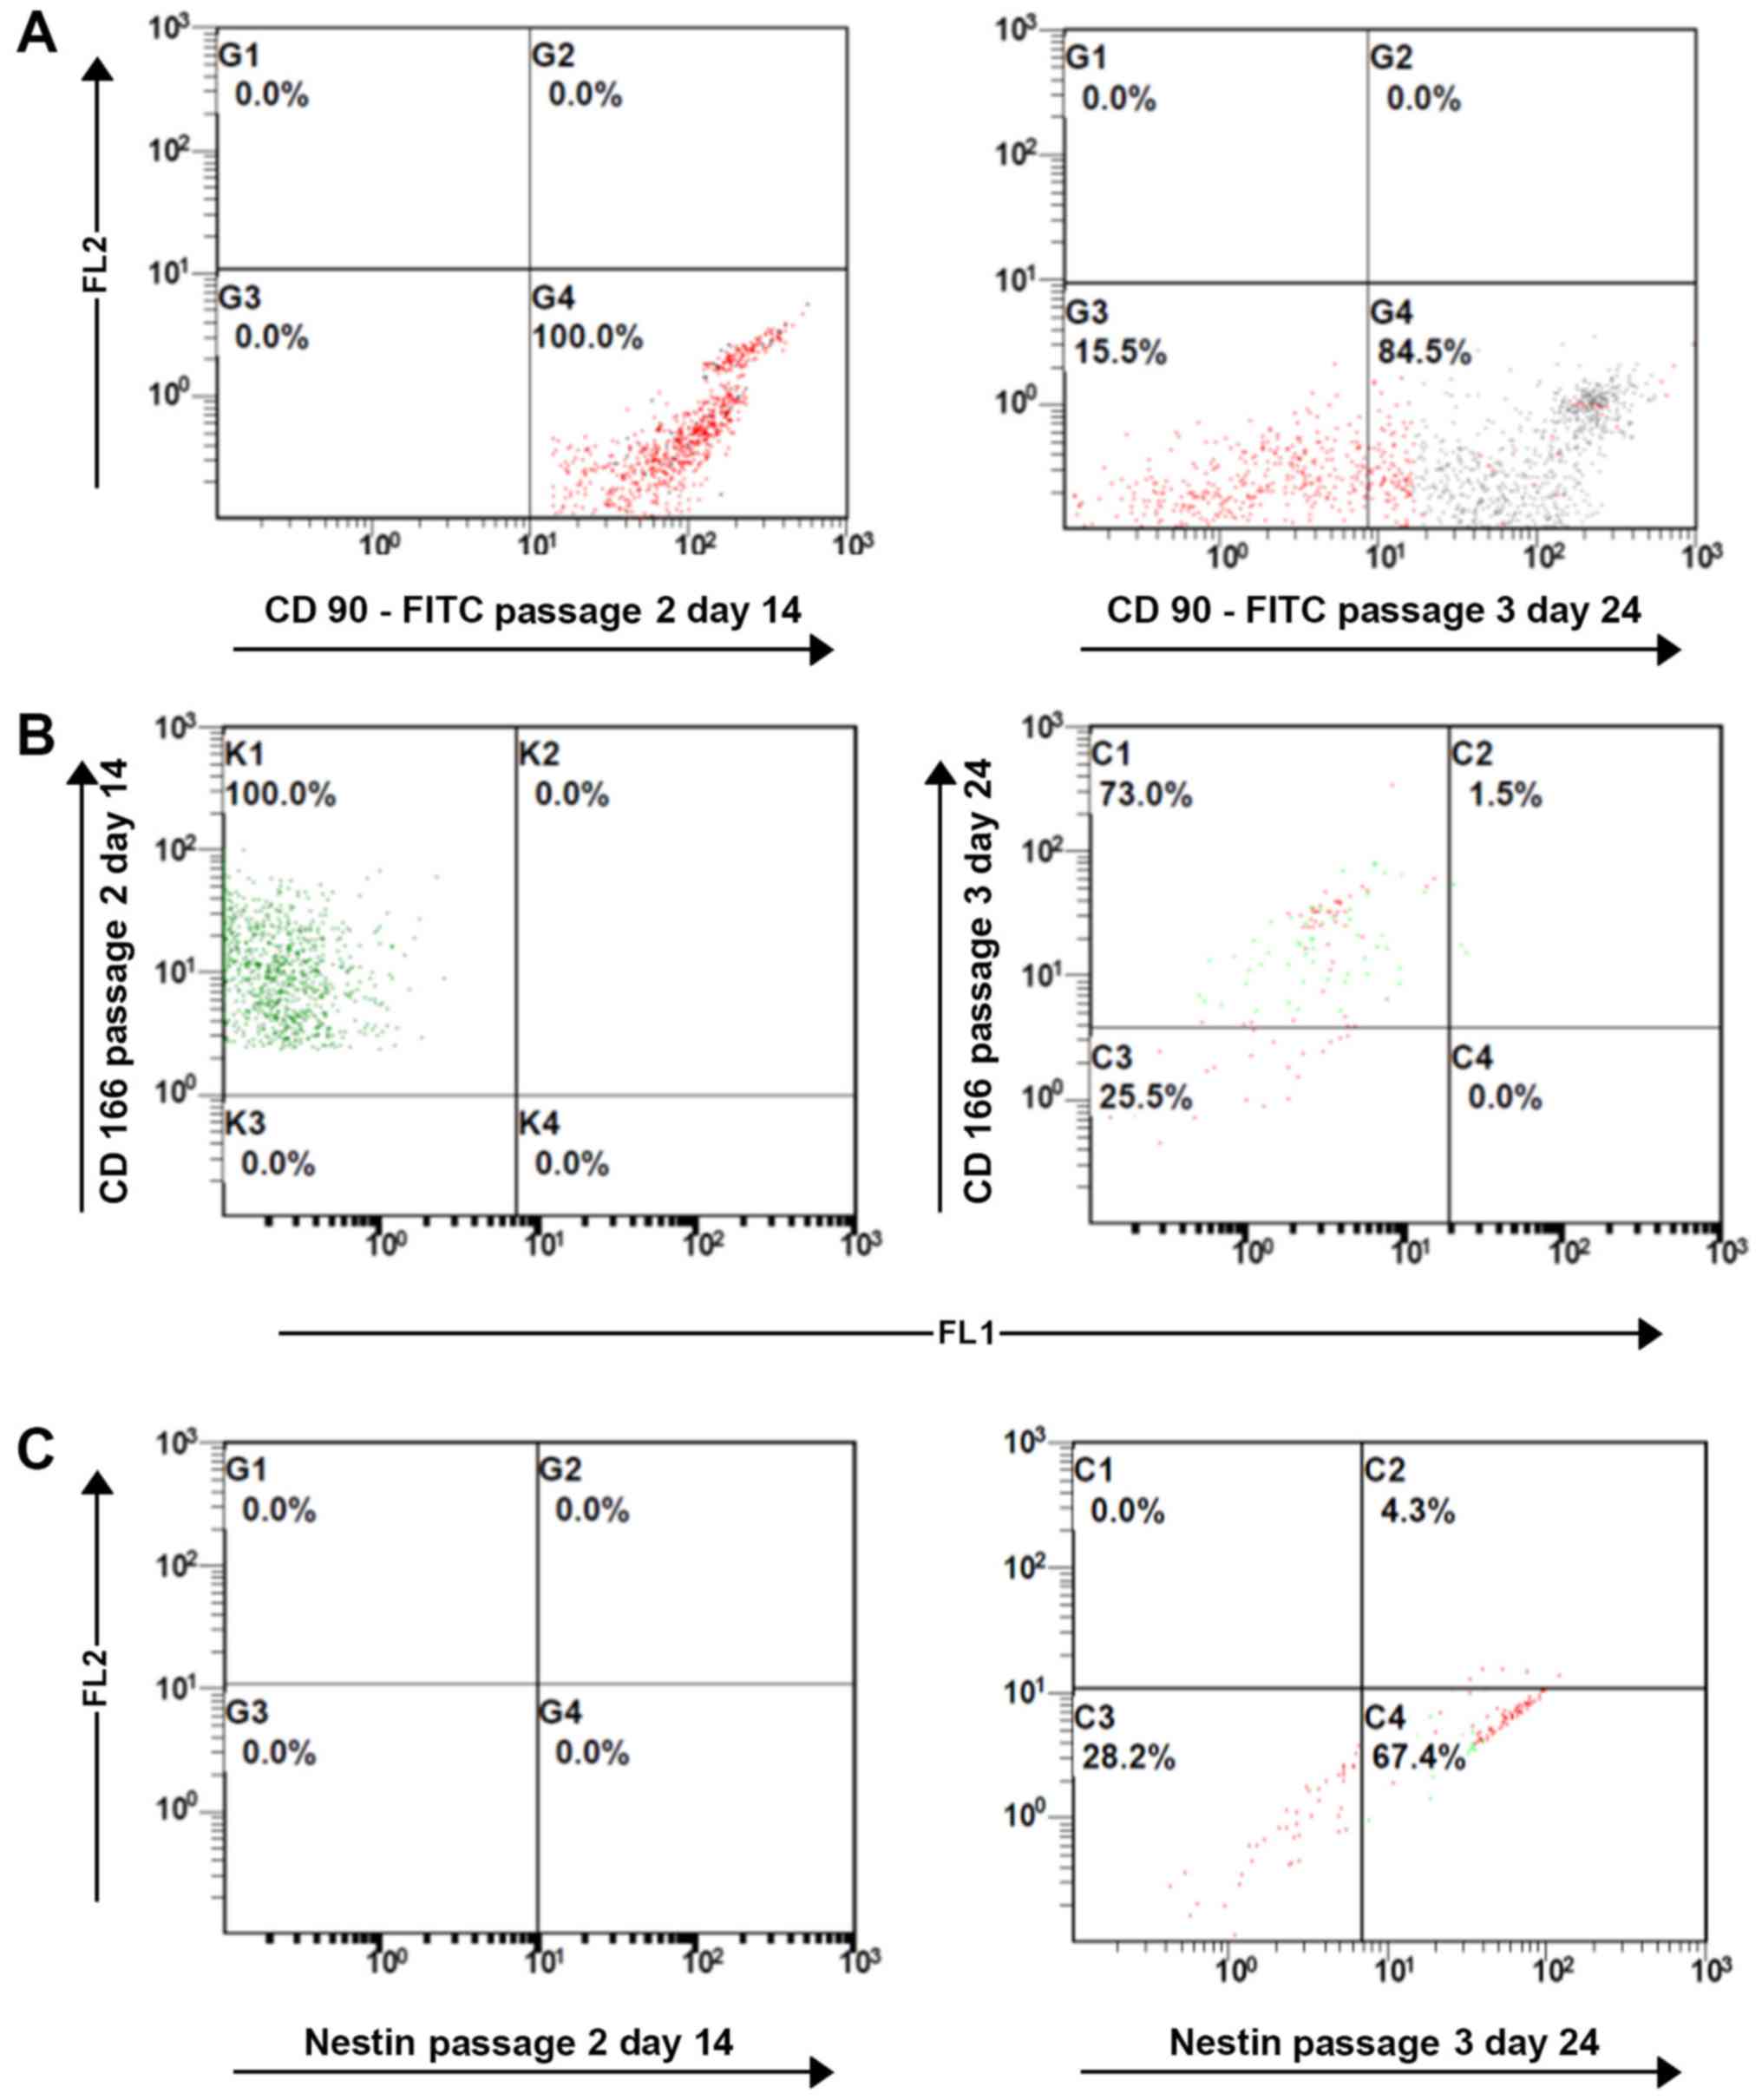
Immunophenotypic characterization of
IFPSCs using flow cytometric analysis
The expression of stem cell markers CD90 and CD166
was considerably reduced in P3 IFPSCs compared with that in P2
IFPSCs. By contrast, nestin, an intermediary filament protein
expressed in early neuronal cells, was absent in P1 and P2 cells;
however, nestin was expressed in P3 IFPSCs (Fig. 9A-C). This indicated that passaging
has an impact on the stemness of IFPSCs, as the cells moved toward
a more specialized cell phenotype.
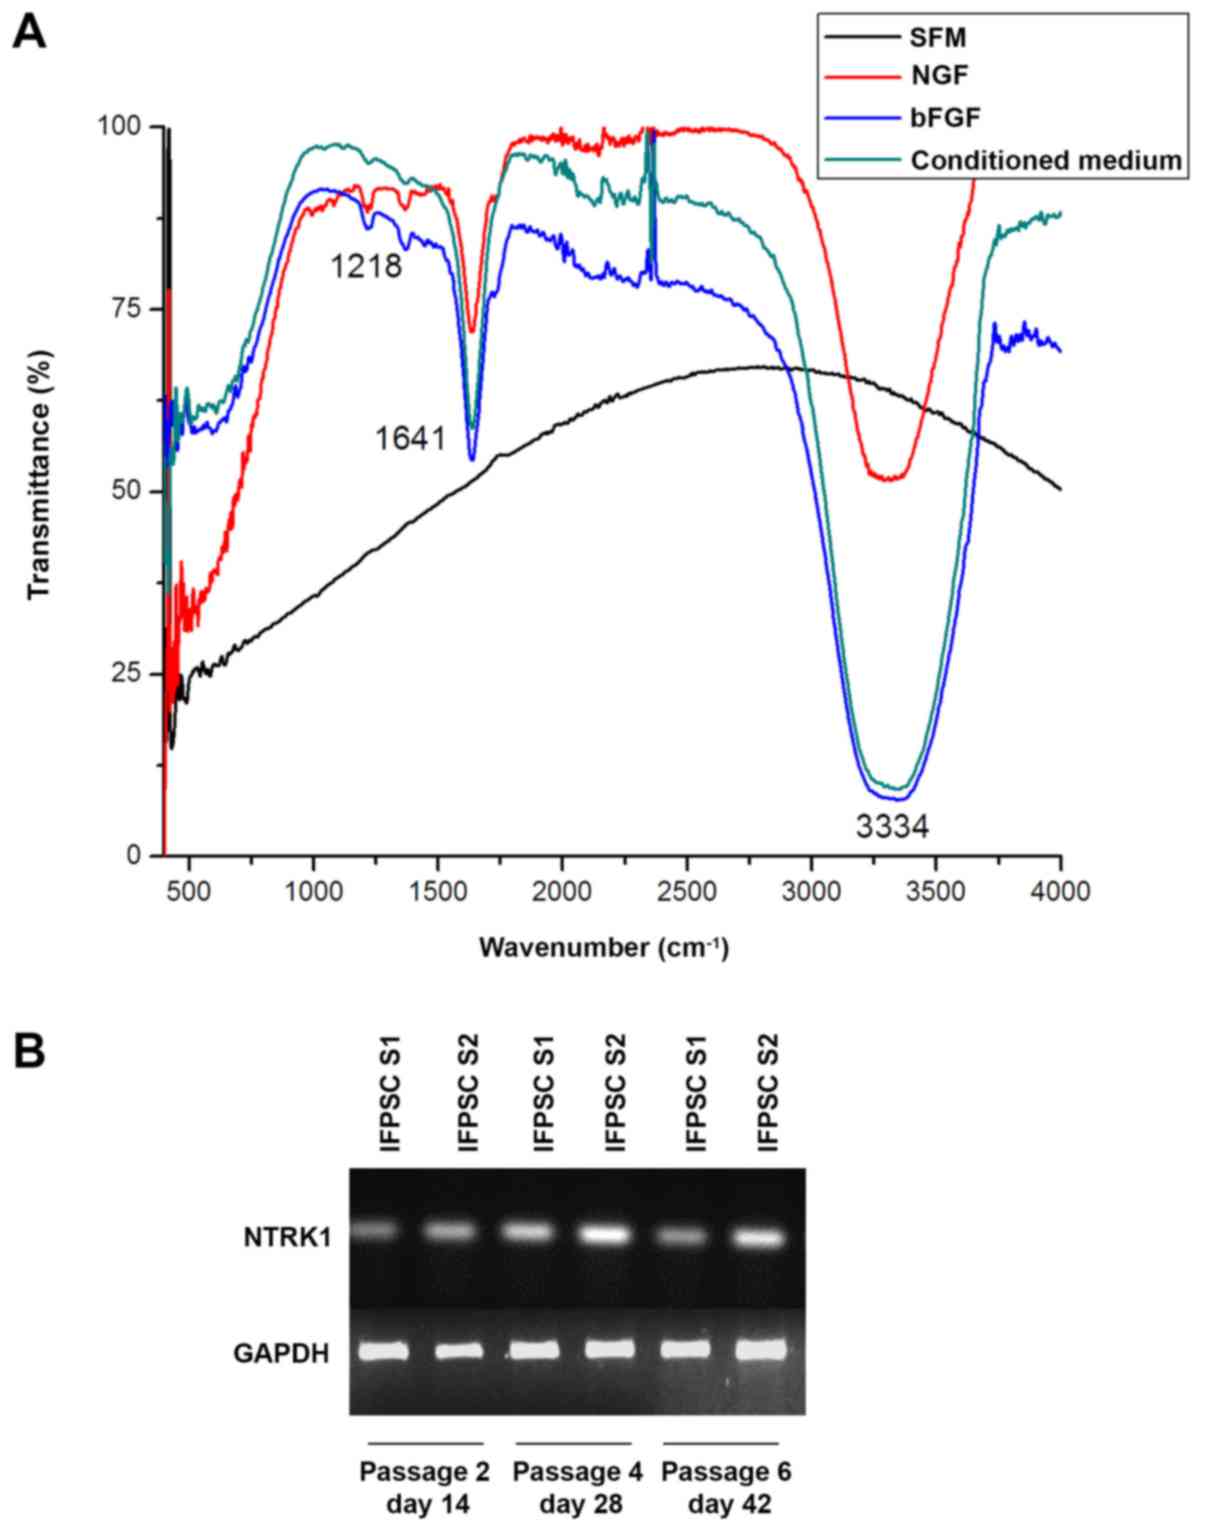
IFPSCs secrete neurotrophic factors
and express neurotrophic receptors
The FTIR spectrum produced from analysis of the
collected conditioned medium is presented in Fig. 10A. Three prominent peaks were
observed at 1,218, 1,641 and 3,334 cm−1 in the
conditioned medium obtained from all samples. The peak at 1,218
cm−1 reflects the C-N and N-H bending of secondary
structures of proteins (21),
whereas the peak at 1,641 cm−1 corresponds to the
β-sheet of secondary structures that is present in nerve growth
factors, including brain-derived neurotrophic factor, neurotrophin
3, and nerve growth factor (NGF) (22,23).
The 3,334 cm−1 peak in the conditioned medium spectrum
corresponds to the amide bond and C=C-H asymmetric stretch of the
aromatic rings of phenylalanine (22,23)
that is present in neurotrophic factors. These results confirmed
the presence of neurotrophic growth factors in the conditioned
medium.
Expression of NTRK1 in early passages
of IFPSCs
It is well established that neurotrophic factors
exert their function by binding to the neurotrophic tyrosine kinase
receptor NTRK1/TrkA (24,25). Thus, the present study investigated
whether IFPSCs at early passages express NTRK1 and whether this
expression may lead to the progression of IFPSCs toward neuronal
differentiation spontaneously. As shown in Fig. 10B, the results of the present
study confirmed the expression of NTRK1 on IFPSCs at day 14 (P2),
day 28 (P4) and day 35 (P5). Taken together, neurotrophic factors
secreted by the IFPSCs may bind to the receptor in an
autocrine/paracrine manner, which may induce cell signaling and
drive IFPSCs towards neuronal differentiation.
Discussion
The present study investigated whether IFP tissue is
a good source of autologous stem cells. IFP can be collected as
medical waste during knee arthroplasty or harvested using simple
arthroscopic techniques (26). The
yield of MSCs obtained from IFP is significantly higher than that
of bone marrow-derived stem cells (BMSCs) and subcutaneous adipose
tissue (4,11). In this study, it was demonstrated
that IFPSCs possess a good proliferation capacity. The mean time of
culture required for IFPSCs to reach P2 from P0 ranged at 12.25±2.5
days. In addition, it was confirmed that IFPSCs were clonogenic and
expressed ADSC surface markers. IFPSCs at P2 were enriched in
stemness characteristics and had differentiation potential,
expressing MSC and ESC markers. Taken together, IFPSCs should be
considered as a suitable candidate cells for use in autologous
cell-based therapies; however, obtaining clinical-grade stem cells
in large numbers without the loss of phenotype and stemness remains
a great challenge for tissue engineering and stem cell-based
therapies.
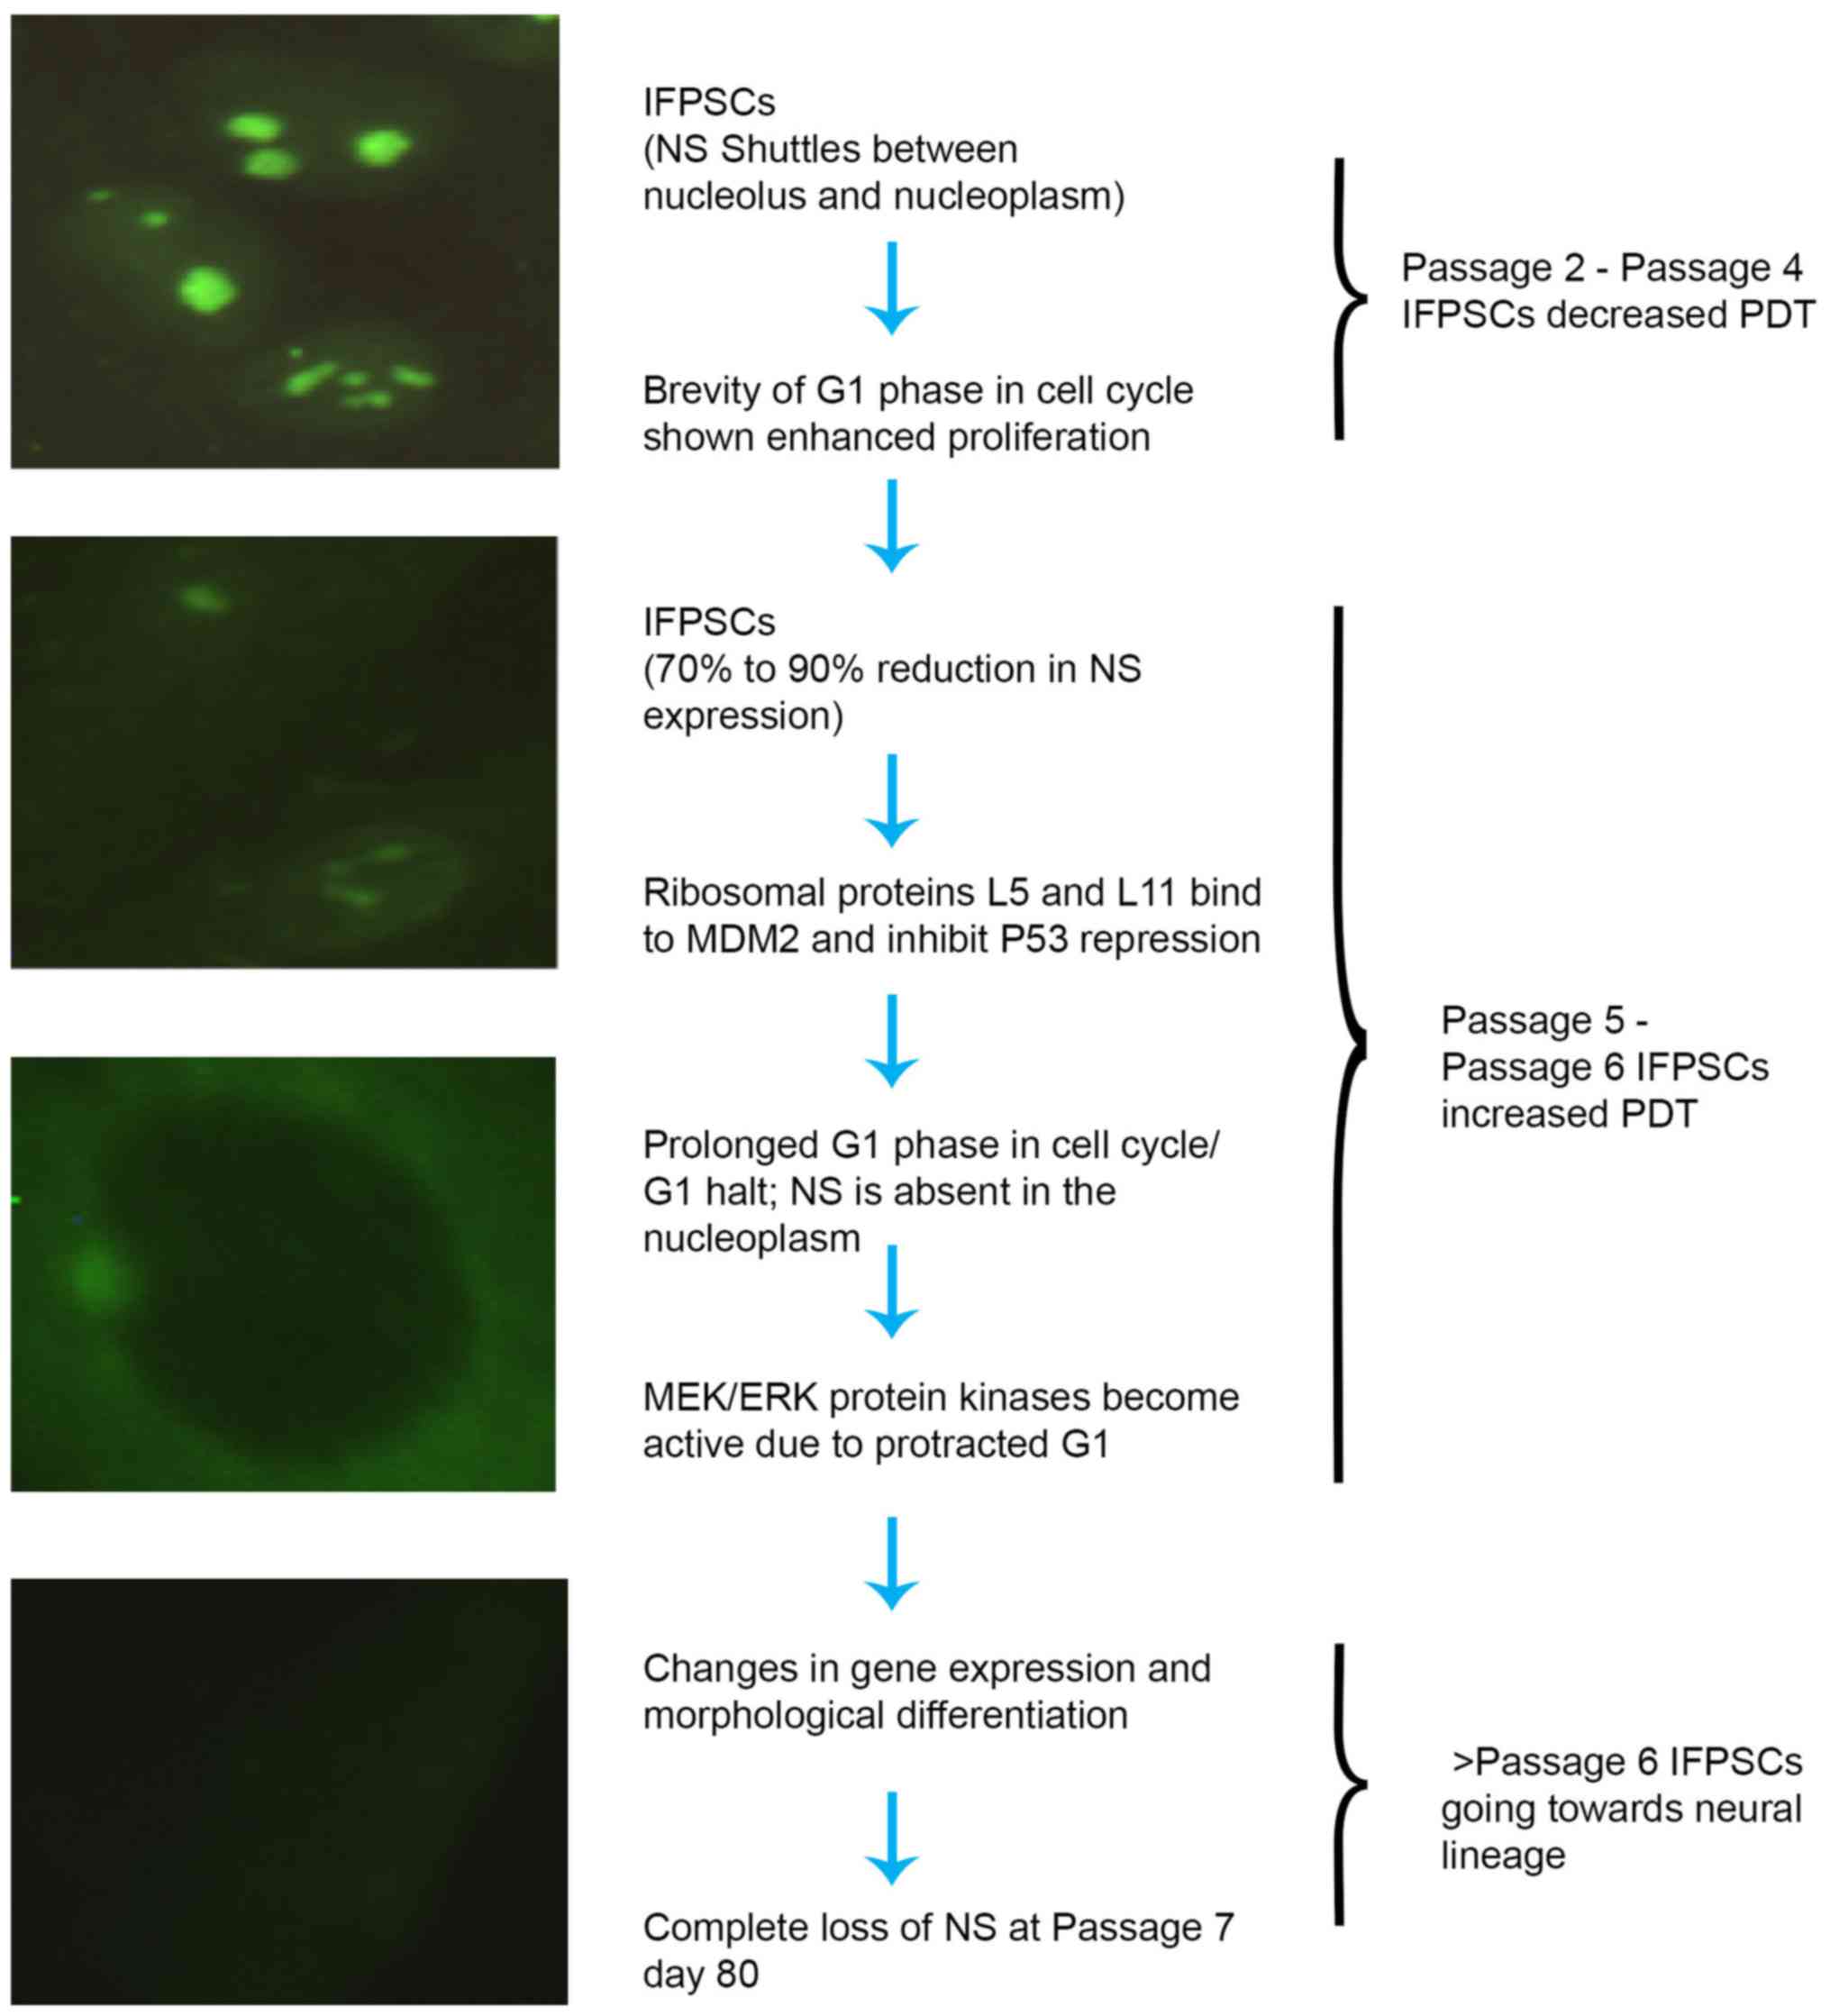
The present study demonstrated that, during
prolonged in vitro expansion of IFPSCs, the number of
passages had a significant impact on the stemness, indicated by
differential expression of the proliferative marker NS at the
subcellular level. A previous study by Ali et al (27) supported the use of NS-based
predictive indication of proliferation and reported the importance
of NS in subgrouping HSCs from the aspirates of bone marrow. HSCs
with high NS expression have been proven to have specific stem cell
signatures and characteristics. NS, in general, regulates the
proliferation rate of stem/progenitor cells in vivo via
p53-dependent and p53-independent mechanisms (28). In the current study, a stage-wise
change in the intensity and cellular localization of NS over P2
(predominantly in the nucleolus), P4 (in the nucleoplasm), P5
(diminished in the nucleoplasm) and P6-7 (completely absent in the
nucleus) was observed. In addition to its nucleolar and nucleoplasm
localization in interphase cells, the presence of NS at chromosome
arms during mitosis was observed. The presence of NS in the
cytoplasm at later passages may be due to the disruption of
microtubule-induced dissociation of NS from the chromosome arms at
interphase (29). The present
study also observed that at P7 (>day 80), NS was completely
absent from the differentiated cells. In a spatiotemporal
expression study of NS in stem cells derived from umbilical cord
and deciduous dental pulp samples, Oktar et al (29) demonstrated that NS is a
proliferation marker that directly reflects in vitro
expansion capabilities, which is downregulated following induced
adipogenic differentiation. Additionally, marked downregulation of
NS occurs prior to terminal differentiation (30–32).
The marked decrease in NS results in prolonged G1 phase or G1
arrest in cells, with activation of mitogen-activated protein
kinase kinase/extracellular signal-regulated kinase signaling for
stem/progenitor cells to acquire the gene expression and
morphological differentiation (32). A schematic representation of the
postulated mechanism associated with the expression of NS is
presented in Fig. 11 (32–34).
Thus, in the present study, the downregulation of NS after P5,
prior to spontaneous differentiation of IFPSCs, indicates the loss
of stemness. The role of NS expression in conferring and
identifying stemness in IFPSCs also requires further investigation
in vivo.
Morphological assessment in the current study
further revealed that IFPSCs at later passages (>P5) lost their
fibroblastic structure that is characteristic in early passages
(P2-P4). At later passages, cells were long and thin, with two or
more nerve fibers resembling dendrite and axonal outgrowths of
neurons. In our previous study, a subset of IFPSCs was found to
differentiate into neuronal lineage cells without any specific
induction (6); thus, in the
present study, the cells were analyzed for early neuronal markers
at each passage. A steep increase in the expression of nestin was
observed at P3. In later passages, in order to rule out that
cell-cell outgrowths were filopodia, specific immunostaining was
performed with antibodies specific to GAP43, a protein involved in
axonal growth, and MAP2, which is involved in dendrite elongation.
Along with these markers, IFPSCs at later passages expressed an
array of neural-lineage specific markers, including NSE, SNAP25,
syntabulin and NF-L (Fig. 5).
A technical limitation of the present study is the
use of fluorescence microscopy without multiple filters, which
could not support co-localization studies. As discussed earlier,
the study was performed without using an external induction
stimulus, except for the differentiation of the three germ layers.
Thus, it is apparent that IFPSCs have the intrinsic ability to
secrete inducible neurogenic factors. Additionally, medium from P2
cells (serum-free conditioned medium) was examined using FTIR
spectrometry. The results revealed peaks at 1,218, 1,641 and 3,334
cm−1, which corresponded to protein secondary structures
that are characteristic of the neurotrophic factors NGF and bFGF
(22,23,35,36),
as well as demonstrated the ability of IFPSCs to secrete known
neural inducers. Previous studies have established the role of bFGF
in cell proliferation through the autocrine and paracrine signaling
mechanisms (37–42). Another study indicated that bFGF
can only induce neuronal differentiation of BMSCs in vitro
(43). The present study further
confirmed that IFPSCs express NTRK1, which is a receptor for NGF.
These findings indicated that IFPSCs are able to secrete
neurotrophic factors for autocrine/paracrine signaling, leading to
differentiation of IFPSCs into neurons at later passages.
Furthermore, the spontaneous neural induction was also demonstrated
quantitatively with β-tubulin III protein expression in IFPSCs from
P6. The current study, thus, suggests that IFPSCs are an ideal
candidate for use in neurological cell-based therapies.
A change was identified in the characteristics of
IFPSCs when cultured for long durations compared with early passage
cells. The changes included increased PDT with an increase in
passage number. Cells at passages >5 exhibited a longer PDT and
reduced proliferative ability. Multiple studies have reported the
association between the increase in mean doubling time and the
increase in the passage number of MSCs (44,45).
The IFPSCs used in the current study were isolated from medical
waste obtained during knee arthroplasty that was performed on aged
patients with arthritis. Despite the samples being from aged
patients with arthritis, the IFPSCs obtained were rich in stemness
markers and demonstrated a capacity for three germ layer
differentiation. Therefore, rejuvenation of cultured IFPSCs may
reverse the impaired proliferative ability and loss of stemness at
later passages. Culturing the cells in hypoxic conditions or with
sera obtained from younger individuals would provide a
microenvironment that is more similar to the physiological
conditions (46,47). The use of 5-azacytidine, an
epigenetic modulator, has been reported to reduce the global
methylation level in stem cells obtained from aged donors (45,48).
Future studies should focus on large-scale production of clinical
grade IFPSCs, using rejuvenating factors to prolong their
stemness.
Finally, Wu et al (49) have supported the use of MSCs for
therapeutic purposes; however, the number of passages used should
be selected with the utmost care when designing cell-based
therapeutic strategies. In a clinical study of acute graft versus
host disease, patients were treated with MSCs from P1-4 (50). The MSCs from P1 and P2 exhibited
improved responses and a higher survival rate (71%) in patients; by
contrast, patients treated with P3 and P4 MSCs had a lower survival
rate (21%), although the cells exhibited no morphological and
functional differences in vitro (50). Furthermore, Moll et al
(51) reported that there was an
increased instant blood-mediated inflammatory reaction following
systemic infusion of MSCs that had been expanded for a prolonged
duration ex vivo, which is highly deleterious. The
functionality of these therapeutic cells can be retained using
low-passage clinical grade MSCs. The findings of the present study
further suggest that reduced clinical efficacy may be due to the
loss of stemness with the increasing number of passages.
In conclusion, in the current study, early passage
IFPSCs (P2 and P3) were identified to be MSCs with various stem
cell characteristics. Prolonged culture of IFPSCs led to the loss
of the proliferative marker NS in the nucleolus and the
nucleoplasm, along with the development of a neurogenic phenotype.
The intensity and subcellular localization of NS may be useful as a
dynamic marker for stemness. Finally, well-characterized IFPSCs
from early passages (P2-4) may be useful in differentiation
protocols and cell-based therapies.
Acknowledgements
Not applicable.
Funding
The present study was funded by the Department of
Science and Technology, Ministry of Science and Technology,
Government of India (grant no. SR/WOS-A/LS-193/2012).
Availability of data and materials
All data generated or analyzed during the present
study are included in this published article.
Authors' contributions
SR and OAT participated in the conception and design
of the study. SR and CAM performed the experiments. SR, MSR and SS
collected and analyzed the data. SR, CAM and MC performed the flow
cytometric analysis and biophysical characterization. NK designed
and analyzed the biophysical characterization experiments. SR wrote
the manuscript. MR supervised the study and gave final approval of
the study, and was also involved in analyzing and interpreting the
data. MR and SS critically reviewed and edited the article. All the
authors have read and approved the final version of this
manuscript.
Ethics approval and consent to
participate
The Ethical Committee of MIOT Institute of Research
(IEC/MIR/0003/14) and National Foundation for Liver Research
(HR/2016/MS/004) approved the study, and the Institutional
Committee for stem cell research of these two centers approved the
respective protocol. Informed consent was obtained from all the
participants.
Patient consent for publication
All patients provided written informed consent for
the publication of data in this study.
Competing interests
The authors declare that they have no competing
interests.
References
|
1
|
Zuk PA, Zhu M, Mizuno H, Huang J, Futrell
WJ, Katz AJ, Benhaim P, Lorenz HP and Hedrick MH: Multilineage
cells from human adipose tissue: Implications for cell-based
therapies. Tissue Eng. 7:211–226. 2001. View Article : Google Scholar : PubMed/NCBI
|
|
2
|
Zuk PA: The adipose-derived stem cell:
Looking back and looking ahead. Mol Biol Cell. 21:1783–1787. 2010.
View Article : Google Scholar : PubMed/NCBI
|
|
3
|
Davies DV and White JE: The structure and
weight of synovial fat pads. J Anat. 95:30–37. 1961.PubMed/NCBI
|
|
4
|
Dragoo JL and Chang W: Arthroscopic
harvest of adipose-derived mesenchymal stem cells from the
infrapatellar fat pad. Am J Sports Med. 45:3119–3127. 2017.
View Article : Google Scholar : PubMed/NCBI
|
|
5
|
Arumugam SB, Trentz OA, Arikketh D,
Senthinathan V, De Rosario B and Mohandas PV: Detection of
embryonic stem cell markers in adult human adipose tissue-derived
stem cells. Indian J Pathol Microbiol. 54:501–508. 2011. View Article : Google Scholar : PubMed/NCBI
|
|
6
|
Radhakrishnan S, Trentz OA, Parthasarathy
VK and Sellathamby S: Human adipose tissue-derived stem cells
differentiate to neuronal-like lineage cells without specific
induction. Cell Biol (Henderson NV). 6:2017. View Article : Google Scholar
|
|
7
|
Trentz OA, Arikketh D, Sentilnathan V,
Hemmi S, Handschin AE, de Rosario B, Mohandas P and Mohandas PV:
Surface proteins and osteoblast markers: Characterization of human
adipose tissue-derived osteogenic cells. Eur J Trauma Emerg Surg.
36:457–463. 2010. View Article : Google Scholar : PubMed/NCBI
|
|
8
|
Turinetto V, Vitale E and Giachino C:
Senescence in human mesenchymal stem cells: Functional changes and
implications in stem cell-based therapy. Int J Mol Sci. 17(pii):
E11642016. View Article : Google Scholar : PubMed/NCBI
|
|
9
|
Wall ME, Bernacki SH and Loboa EG: Effects
of serial passaging on the adipogenic and osteogenic
differentiation potential of adipose-derived human mesenchymal stem
cells. Tissue Engg. 13:1291–1298. 2007. View Article : Google Scholar
|
|
10
|
Madeira A, da Silva CL, dos Santos F,
Camafeita E, Cabral JM and Sá-Correia I: Human mesenchymal stem
cell expression program upon extended ex-vivo cultivation, as
revealed by 2-DE-based quantitative proteomics. PLoS One.
7:e435232012. View Article : Google Scholar : PubMed/NCBI
|
|
11
|
Tangchitphisut P, Srikaew N, Numhom S,
Tangprasittipap S, Woratanarat P, Wongsak S, Kijkunasathian C,
Hongeng S, Murray IR and Tawonsawatruk T: Infrapatellar fat pad: An
alternative source of adipose-derived mesenchymal stem cells.
Arthritis. 2016:40198732016. View Article : Google Scholar : PubMed/NCBI
|
|
12
|
Kim HJ, Ryu YH, Ahn JI, Park JK and Kim
JC: Characterization of immortalized human corneal endothelial cell
line using HPV 16 E6/E7 on lyophilized human amniotic membrane.
Korean J Ophthalmol. 20:47–54. 2006. View Article : Google Scholar : PubMed/NCBI
|
|
13
|
Bishi DK, Mathapati S, Venugopal JR,
Guhathakurta S, Cherian KM, Ramakrishnaa S and Verma RS:
Trans-differentiation of human mesenchymal stem cells generate
functional hepatospheres on poly(L-lactic
acid)-co-poly(ε-caprolactone)/collagen nanofibrous scaffolds. J
Mater Chem B. 1:3972–3984. 2013. View Article : Google Scholar
|
|
14
|
Lendahl U, Zimmerman LB and McKay RD: CNS
stem cells express a new class of intermediate filament protein.
Cell. 60:585–595. 1990. View Article : Google Scholar : PubMed/NCBI
|
|
15
|
Lenka N and Ramasamy SK: Neural induction
from ES cells portrays default commitment but instructive
maturation. PLoS One. 2:e13492007. View Article : Google Scholar : PubMed/NCBI
|
|
16
|
Gallo-Oller G, Ordoñezb R and Dotorc J: A
new background subtraction method for Western blot densitometry
band quantification through image analysis software. J Immunol
Methods. 457:1–5. 2008. View Article : Google Scholar
|
|
17
|
Shim JW, Park CH, Bae YC, Bae JY, Chung S,
Chang MY, Koh HC, Lee HS, Hwang SJ, Lee KH, et al: Generation of
functional dopamine neurons from neural precursor cells isolated
from the subventricular zone and white matter of the adult rat
brain using Nurr1 overexpression. Stem Cells. 25:1252–1262. 2007.
View Article : Google Scholar : PubMed/NCBI
|
|
18
|
Casper KB and McCarthy KD: GFAP-positive
progenitor cells produce neurons and oligodendrocytes throughout
the CNS. Mol Cell Neurosci. 31:676–684. 2006. View Article : Google Scholar : PubMed/NCBI
|
|
19
|
Lariviere RC and Julien JP: Functions of
intermediate filaments in neuronal development and disease. J
Neurobiol. 58:131–48. 2004. View Article : Google Scholar : PubMed/NCBI
|
|
20
|
Liu Y, Namba T, Liu J, Suzuki R, Shioda S
and Seki T: Glial fibrillary acidic protein-expressing neural
progenitors give rise to immature neurons via early intermediate
progenitors expressing both glial fibrillary acidic protein and
neuronal markers in the adult hippocampus. Neuroscience.
166:241–25. 2010. View Article : Google Scholar : PubMed/NCBI
|
|
21
|
Kong J and Yu S: Fourier transform
infrared spectroscopic analysis of protein secondary structures.
Acta Biochim Biophys Sin (Shanghai). 39:549–559. 2007. View Article : Google Scholar : PubMed/NCBI
|
|
22
|
Narhi LO, Rosenfeld R, Talvenheimo J,
Prestrelski SJ, Arakawa T, Lary JW, Kolvenbach CG, Hecht R, Boone
T, Miller JA, et al: Comparison of the biophysical characteristics
of human brain-derived neurotrophic factor, neurotrophin-3, and
nerve growth factor. J Biol Chem. 268:13309–13317. 1993.PubMed/NCBI
|
|
23
|
Travaglia A, Satriano C, Giuffrida ML,
Mendola DL, Rampazzo E, Prodid L and Rizzarelliab E:
Electrostatically driven interaction of silica-supported lipid
bilayer nano platforms and a nerve growth factor-mimicking peptide.
Soft Matter. 9:4648–4654. 2013. View Article : Google Scholar
|
|
24
|
Segal RA: Selectivity in neurotrophin
signaling: Theme and variations. Annu Rev Neurosci. 26:299–330.
2003. View Article : Google Scholar : PubMed/NCBI
|
|
25
|
Windisch JM, Marksteiner R and Schneider
R: Nerve growth factor binding site on TrkA mapped to a single
24-amino acid leucine-rich motif. J Biol Chem. 270:28133–28138.
1995. View Article : Google Scholar : PubMed/NCBI
|
|
26
|
Doner GP and Noyes FR: Arthroscopic
resection of fat pad lesions and infrapatellar contractures.
Arthrosc Tech. 3:e413–e416. 2014. View Article : Google Scholar : PubMed/NCBI
|
|
27
|
Ali MAE, Fuse K, Tadokoro Y, Hoshii T,
Ueno M, Kobayashi M, Nomura N, Vu HT, Peng H, Hegazy AM, et al:
Functional dissection of hematopoietic stem cell populations with a
stemness-monitoring system based on NS-GFP transgene expression.
Sci Rep. 7:114422017. View Article : Google Scholar : PubMed/NCBI
|
|
28
|
Beekman C, Nichane M, De Clercq S, Maetens
M, Floss T, Wurst W, Bellefroid E and Marine JC: Evolutionarily
conserved role of nucleostemin: Controlling proliferation of
stem/progenitor cells during early vertebrate development. Mol Cell
Biol. 18:9291–9301. 2006. View Article : Google Scholar
|
|
29
|
Oktar PA, Yildirim S, Balci D and Can A:
Continual expression throughout the cell cycle and downregulation
upon adipogenic differentiation makes nucleostemin a vital human
MSC proliferation marker. Stem Cell Rev. 7:413–424. 2011.
View Article : Google Scholar : PubMed/NCBI
|
|
30
|
Tsai RY and McKay RD: A multistep,
GTP-driven mechanism controlling the dynamic cycling of
nucleostemin. J Cell Biol. 168:179–184. 2005. View Article : Google Scholar : PubMed/NCBI
|
|
31
|
Kafienah W, Mistry S, Williams C and
Hollander AP: Nucleostemin is a marker of proliferating stromal
stem cells in adult human bone marrow. Stem Cells. 24:1113–1120.
2006. View Article : Google Scholar : PubMed/NCBI
|
|
32
|
Qu J and Bishop JM: Nucleostemin maintains
self-renewal of embryonic stem cells and promotes reprogramming of
somatic cells to pluripotency. J Cell Biol. 197:731–745. 2012.
View Article : Google Scholar : PubMed/NCBI
|
|
33
|
Ma H and Pederson T: Nucleostemin: A
multiplex regulator of cell-cycle progression. Trends Cell Biol.
18:575–579. 2008. View Article : Google Scholar : PubMed/NCBI
|
|
34
|
Lo D and Lu H: Nucleostemin: Another
nucleolar ‘Twister’ of the p53-MDM2 loop. Cell Cycle. 9:16,
3227–3232. 2010. View Article : Google Scholar
|
|
35
|
Zaragosi LE, Ailhaud G and Dani C:
Autocrine fibroblast growth factor 2 signaling is critical for
self-renewal of human multipotent adipose-derived stem cells. Stem
Cells. 24:2412–2419. 2006. View Article : Google Scholar : PubMed/NCBI
|
|
36
|
Rider DA, Dombrowski C, Sawyer AA, Ng GH,
Leong D, Hutmacher DW, Nurcombe V and Cool SM: Autocrine fibroblast
growth factor 2 increases the multipotentiality of human
adipose-derived mesenchymal stem cells. Stem Cells. 26:1598–1608.
2008. View Article : Google Scholar : PubMed/NCBI
|
|
37
|
Chou CH and Modo M: Human neural stem
cell-induced endothelial morphogenesis requires autocrine/paracrine
and juxtacrine signalling. Sci Rep. 6:290292016. View Article : Google Scholar : PubMed/NCBI
|
|
38
|
Cohen MA, Itsykson P and Reubinoff BE: The
role of FGF-signaling in early neural specification of human
embryonic stem cells. Dev Biol. 340:450–458. 2010. View Article : Google Scholar : PubMed/NCBI
|
|
39
|
Frautschya SA, Gonzaleza AM, Martinez
Murillo R, Carcellerb F, Cuevasb P and Bairda A: Expression of
basic fibroblast growth factor and its receptor in the rat
subfornical organ. Neuroendocrinology. 54:55–61. 1991.
|
|
40
|
Gensburger C, Labourdette G and
Sensenbrenner M: Brain basic fibroblast growth factor stimulates
the proliferation of rat neuronal precursor cells in vitro. FEBS
Lett. 217:1–5. 1987. View Article : Google Scholar : PubMed/NCBI
|
|
41
|
Gnecchi M, Zhang Z, Ni A and Dzau VJ:
Paracrine mechanisms in adult stem cell signaling and therapy. Circ
Res. 103:1204–1219. 2008. View Article : Google Scholar : PubMed/NCBI
|
|
42
|
Ying QL, Stavridis M, Griffiths D, Li M
and Smith A: Conversion of embryonic stem cells into
neuroectodermal precursors in adherent monoculture. Nat Biotechnol.
21:183–186. 2003. View
Article : Google Scholar : PubMed/NCBI
|
|
43
|
Yang H, Xia Y, Lu SQ, Soong TW and Feng
ZW: Basic fibroblast growth factor-induced neuronal differentiation
of mouse bone marrow stromal cells requires FGFR-1, MAPK/ERK, and
transcription factor AP-1. J Biol Chem. 283:5287–5295. 2008.
View Article : Google Scholar : PubMed/NCBI
|
|
44
|
Gruber HE, Somayaji S, Riley F, Hoelscher
GL, Norton HJ, Ingram J and Hanley EN Jr: Human adipose-derived
mesenchymal stem cells: Serial passaging, doubling time and cell
senescence. Biotech Histochem. 87:303–311. 2012. View Article : Google Scholar : PubMed/NCBI
|
|
45
|
Seeliger C, Culmes M, Schyschka L, Yan X,
Damm G, Wang Z, Kleeff J, Thasler WE, Hengstler J, Stöckle U, et
al: Decrease of global methylation improves significantly hepatic
differentiation of Ad-MSCs: Possible future application for urea
detoxification. Cell Transplant. 22:119–131. 2013. View Article : Google Scholar : PubMed/NCBI
|
|
46
|
Ahmed AS, Sheng MH, Wasnik S, Baylink DJ
and Lau KW: Effect of ageing on stem cells. World J Exp Med.
7:1–10. 2017. View Article : Google Scholar : PubMed/NCBI
|
|
47
|
Ho AD, Wagner W and Mahlknecht U: Stem
cells and aging. EMBO Rep. 6 (Suppl 1):S35–S38. 2005. View Article : Google Scholar : PubMed/NCBI
|
|
48
|
Yan X, Ehnert S, Culmes M, Bachmann A,
Seeliger C, Schyschka L, Wang Z, Rahmanian-Schwarz A, Stöckle U, De
Sousa PA, et al: 5-azacytidine improves the osteogenic
differentiation potential of aged human adipose-derived mesenchymal
stem cells by DNA demethylation. PLoS One. 9:e908462014. View Article : Google Scholar : PubMed/NCBI
|
|
49
|
Wu PK, Wang JY, Chen CF, Chao KY, Chang
MC, Chen WM and Hung SC: Decreased radiosensitivity and increased
DNA repair activity a demethylation. PLoS One. 9:e90846PubMed/NCBI
|
|
50
|
von Bahr L, Sundberg B, Lönnies L, Sander
B, Karbach H, Hägglund H, Ljungman P, Gustafsson B, Karlsson H, Le
Blanc K and Ringdén O: Long-term complications, immunologic
effects, and role of passage for outcome in mesenchymal stromal
cell therapy. Biol Blood Marrow Transplant. 18:557–564. 2012.
View Article : Google Scholar : PubMed/NCBI
|
|
51
|
Moll G, Rasmusson-Duprez I, von Bahr L,
Connolly-Andersen AM, Elgue G, Funke L, Hamad OA, Lönnies H,
Magnusson PU, Sanchez J, et al: Are therapeutic human mesenchymal
stromal cells compatible with human blood? Stem Cells.
30:1565–1574. 2012. View Article : Google Scholar : PubMed/NCBI
|