Introduction
Type 2 diabetes mellitus (T2DM) is a metabolic
disorder characterized by hyperglycemia caused by a relative lack
of insulin. The number of cases of T2DM are increasing worldwide
and it has become an important health concern. According to a
survey by the International Diabetes Federation, the prevalence if
T2DM is expected to exceed 10% of the global adult population by
2040 (1). The main causes of T2DM
are insulin resistance and an insulin secretion defect. The
majority of patients with insulin resistance are obese and exhibit
symptoms, such as slight fatigue and thirst in the early stages of
T2DM (2). Research suggests that
alterations in multiple genes and signaling pathways are involved
in regulating the development of T2DM. However, a lack of research
on the precise molecular mechanisms of T2DM progression limits the
treatment efficacy of the disease at present. Therefore,
understanding the molecular mechanisms of T2DM occurrence and
development is of utmost importance for non-invasive diagnosis and
targeted therapy in the future.
Pancreatic cells, particularly β-cells, play an
important role in the occurrence and development of T2DM (3). Initial-phase insulin secretion
dysfunction in pancreatic β-cells is the primary feature of T2DM. A
number of studies have explored the factors that contribute to
impaired pancreatic β-cell function in T2DM, including endoplasmic
reticulum stress, lipotoxicity, mitochondrial dysfunction,
oxidative stress, low inflammation of islets and glucotoxicity
(4,5). For example, Park et al
(6) found that the deposition of
islet amyloid polypeptide (IAPP) upregulated the Fas receptor of
pancreatic β-cells and initiated an apoptotic cascade. Although
pancreatic β-cell damage is observed in patients with T2DM, the
mechanisms and signaling pathways involved remain unknown.
Bioinformatic analysis of microarrays enables the overall analysis
of differentially expressed genes (DEGs) in the development of
T2DM. Marselli et al (7),
gathered pancreatic β-cell samples from tissues by laser capture
microdissection (LCM) and detected DEGs between patients with T2DM
and normal donors. However, the interactions between DEGs, signal
pathway interaction networks and transcription factors (TFs)
warrant further comprehensive analysis.
In the present study, we selected GSE20966 from the
Gene Expression Omnibus (GEO) database, and used the limma package
in R software to screen DEGs. Subsequently, we analyzed the Gene
Ontology (GO) functions and Kyoto Encyclopedia of Genes and Genomes
(KEGG) pathways associated with the resulting DEGs. Moreover, a
protein-protein interaction (PPI) network of the DEGs was
established and TFs were selected. We also identified core genes by
a comprehensive analysis.
Materials and methods
Microarray profile data
The microarray dataset GSE20966, based on the
GPL1352 platform (Affymetrix Human X3P Array), was obtained from
the GEO (www.ncbi.nlm.nih.gov/geo/) database. The GSE20966
dataset was provided by Marselli et al, who collected
pancreatic β cells by LCM (7). In
addition, 10 non-diabetic samples and 10 diabetic samples were used
in the microarray.
Identification of DEGs
The original CEL GSE20966 data were pre-processed
into expression estimates and background correction was then
performed. A CEL file generated by a scanner that contains the
processing intensity values for each spot. The intensity of each
spot indicates the binding intensity of the probe to the gene. The
impute package was used to predict the expression values of genes
that were not measured. This imputation method is based on the KNN
(k-nearest neighbor) algorithm. The KNN method searches for other
genes with similar expression profiles to the genes with missing
values, and the missing values are then filled in using the
expression values of these similar genes (8). The normalizeBetweenArrays function in
the limma package was applied to normalize the intensity of
expression (9). Then, t-tests were
performed in the limma package to identify DEGs. The threshold
value for DEGs was selected by a P-value <0.05 and
|log2 fold change (FC)| ≥1.
GO function and KEGG pathway
analyses
Functional annotation tools were provided by the
Database of Annotation, Visualization and Integrated Discover
(DAVID, david.abcc.ncifcrf.gov/) to comprehend the biological
function of the genes. GO function analysis was applied to annotate
DEGs from biological processes (BP), cellular components (CC) and
molecular functions (MF), and KEGG was applied to annotate the DEG
pathways. Subsequently, we selected the false discovery rate (FDR)
as a screening criterion, to limit the FDR to an acceptable range
while testing as many positive results as possible.
TF enrichment analysis
The Enrichr (amp.pharm.mssm.edu/lib/chea.jsp) and WebGestalt
software (www.webgestalt.org/option.php) were applied to select
key TFs involved in the regulation of DEGs in T2DM. The threshold
value of enrichment was selected by a P-value <0.05. Significant
TFs that regulated the DEGs were selected.
PPI network construction and
analysis
Since proteins rarely perform biological functions
independently, it is important to be aware of protein interactions
by studying functional groups. A PPI network was established by the
STRING app (http://apps.cytoscape.org/apps/stringapp) in Cytoscape
software version 3.6.0. The software used the default parameters
for analysis, and the connectivity degree of each node in the
network was calculated by connectivity analysis. DEGs with a degree
of connectivity ≥5 were defined as having high degrees of
connectivity and were used to screen for core genes.
Screening for core genes
Core genes were identified using the following 3
conditions: i) participation in the enriched KEGG pathways; ii)
calculated to have a high degree of connectivity; and iii) a target
gene of key TFs.
Cells and cell culture
The mouse pancreatic β-cell line, MIN-6, was
obtained from the American Type Culture Collection (ATCC). The
low-glucose group cultured in low-glucose Dulbecco's modified
Eagle's medium (Thermo Fisher Scientific, Inc.) with 15% fetal
bovine serum (Thermo Fisher Scientific, Inc.), 1% antibiotics (100
U/ml penicillin; 100 U/ml streptomycin) and 5 µM 2-Mercaptoethanol
(Sigma-Aldrich Co., LLC). In addition to the same components as the
low-glucose group, the high-glucose group additionally dissolved
α-D-glucose (Solarbio) at a final concentration of 25 mM in the
medium. All cells cultured in the atmosphere containing 5%
CO2 at 37°C for 2 weeks.
RNA isolation and reverse
transcription-quantitative polymerase chain reaction (RT-qPCR)
Total RNA was extracted from the 2 groups with using
PureLink™ RNA Mini kit (Thermo Fisher Scientific, Inc.) according
to the manufacturer's protocol. RNA quality was detected by
Nanodrop 2000 (Thermo Fisher Scientific, Inc.). The synthesis of
cDNA was using a SuperScript IV first-strand cDNA synthesis kit
(Thermo Fisher Scientific, Inc.) according to the RT-PCR
manufacturer's protocol. qPCR was performed with an ABI
StepOnePlus™ system (Thermo Fisher Scientific, Inc.) using the
PowerUp™ SYBR™-Green Master Mix kit (Thermo Fisher Scientific,
Inc.). The cycling conditions were as follows: UDG activation 50°C
for 2 min; denaturation 95°C for 2 min; followed by 40 cycles of
95°C for 15 sec; 60°C for 1 min; 62°C for 1 min. The primer
sequences were as follows: Alanyl aminopeptidase, membrane
(ANPEP) forward, ATGGAAGGAGGCGTCAAGAAA and reverse,
CGGATAGGGCTTGGACTCTTT; serpin family G member 1 (SERPING1)
forward, TAGAGCCTTCTCAGATCCCGA and reverse, ACTCGTTGGCTACTTTACCCA;
and GAP DH forward, AGGTCGGTGTGAACGGATTTG and reverse,
TGTAGACCATGTAGTTGAGGTCA. The relative expression of ANPEP
and SERPING1 were normalized to GAPDH and analyzed using the
2−ΔΔCq method (10).
Statistical analysis
Statistical analyses were performed in GraphPad
Prism 8.0 software (GraphPad Software, Inc.). Statistical analysis
in this study was performed by two-tailed Student's t-tests. The
data from each group are expressed as the means ± standard error of
the mean, and a P-value <0.05 was considered to represent a
statistically significant difference.
Results
Identification of DEGs
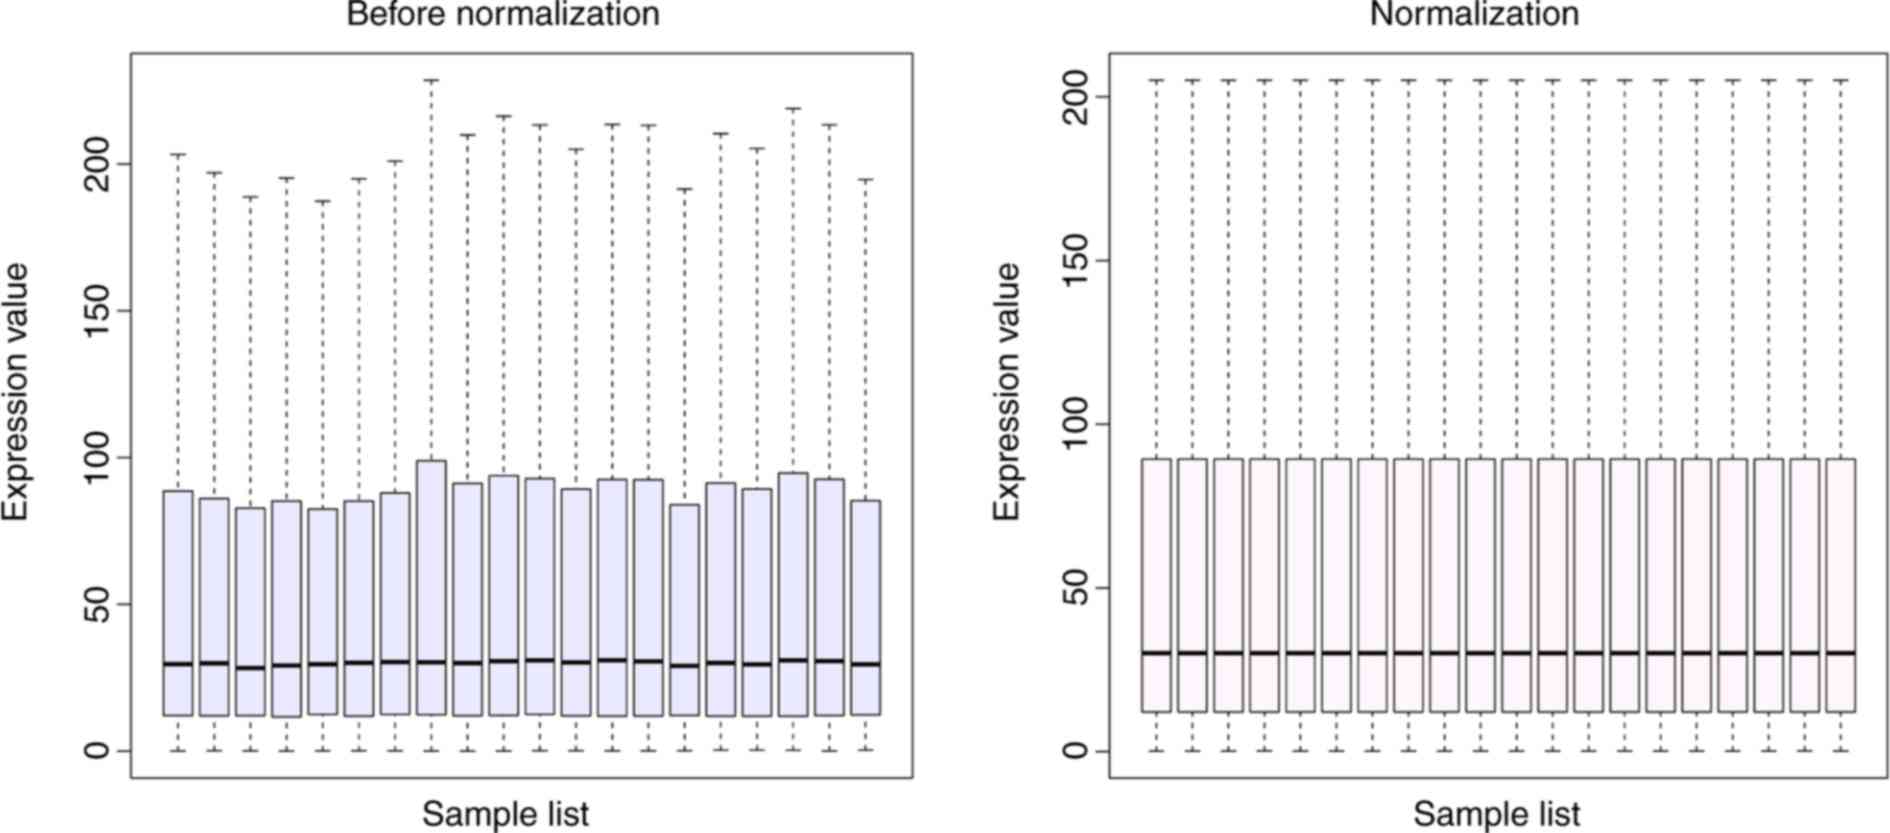
The results of standardizing the microarray gene
expression are displayed in Fig.
1. This process yields the intensities in a set of arrays
similar distributions. The expression dataset was selected using
the limma package (P-value <0.05, |log2 FC| ≥1) in R
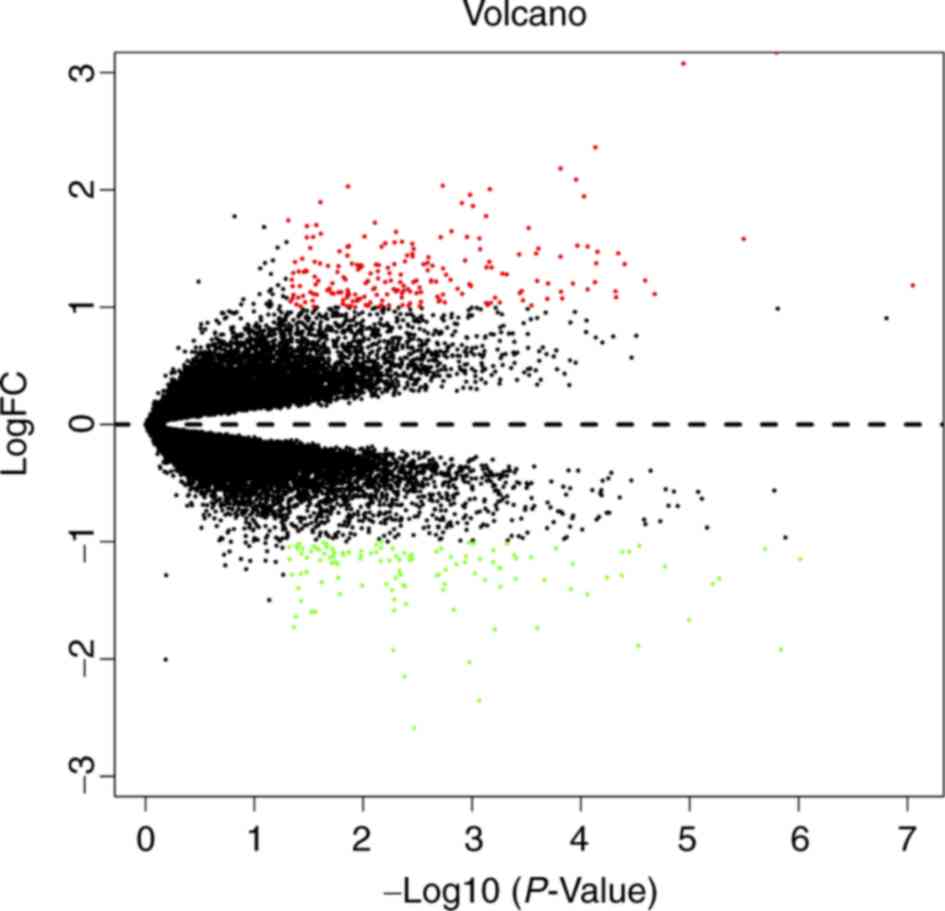
software. Overall, 329 DEGs were obtained, including 208
upregulated and 121 downregulated genes. A volcano diagram was
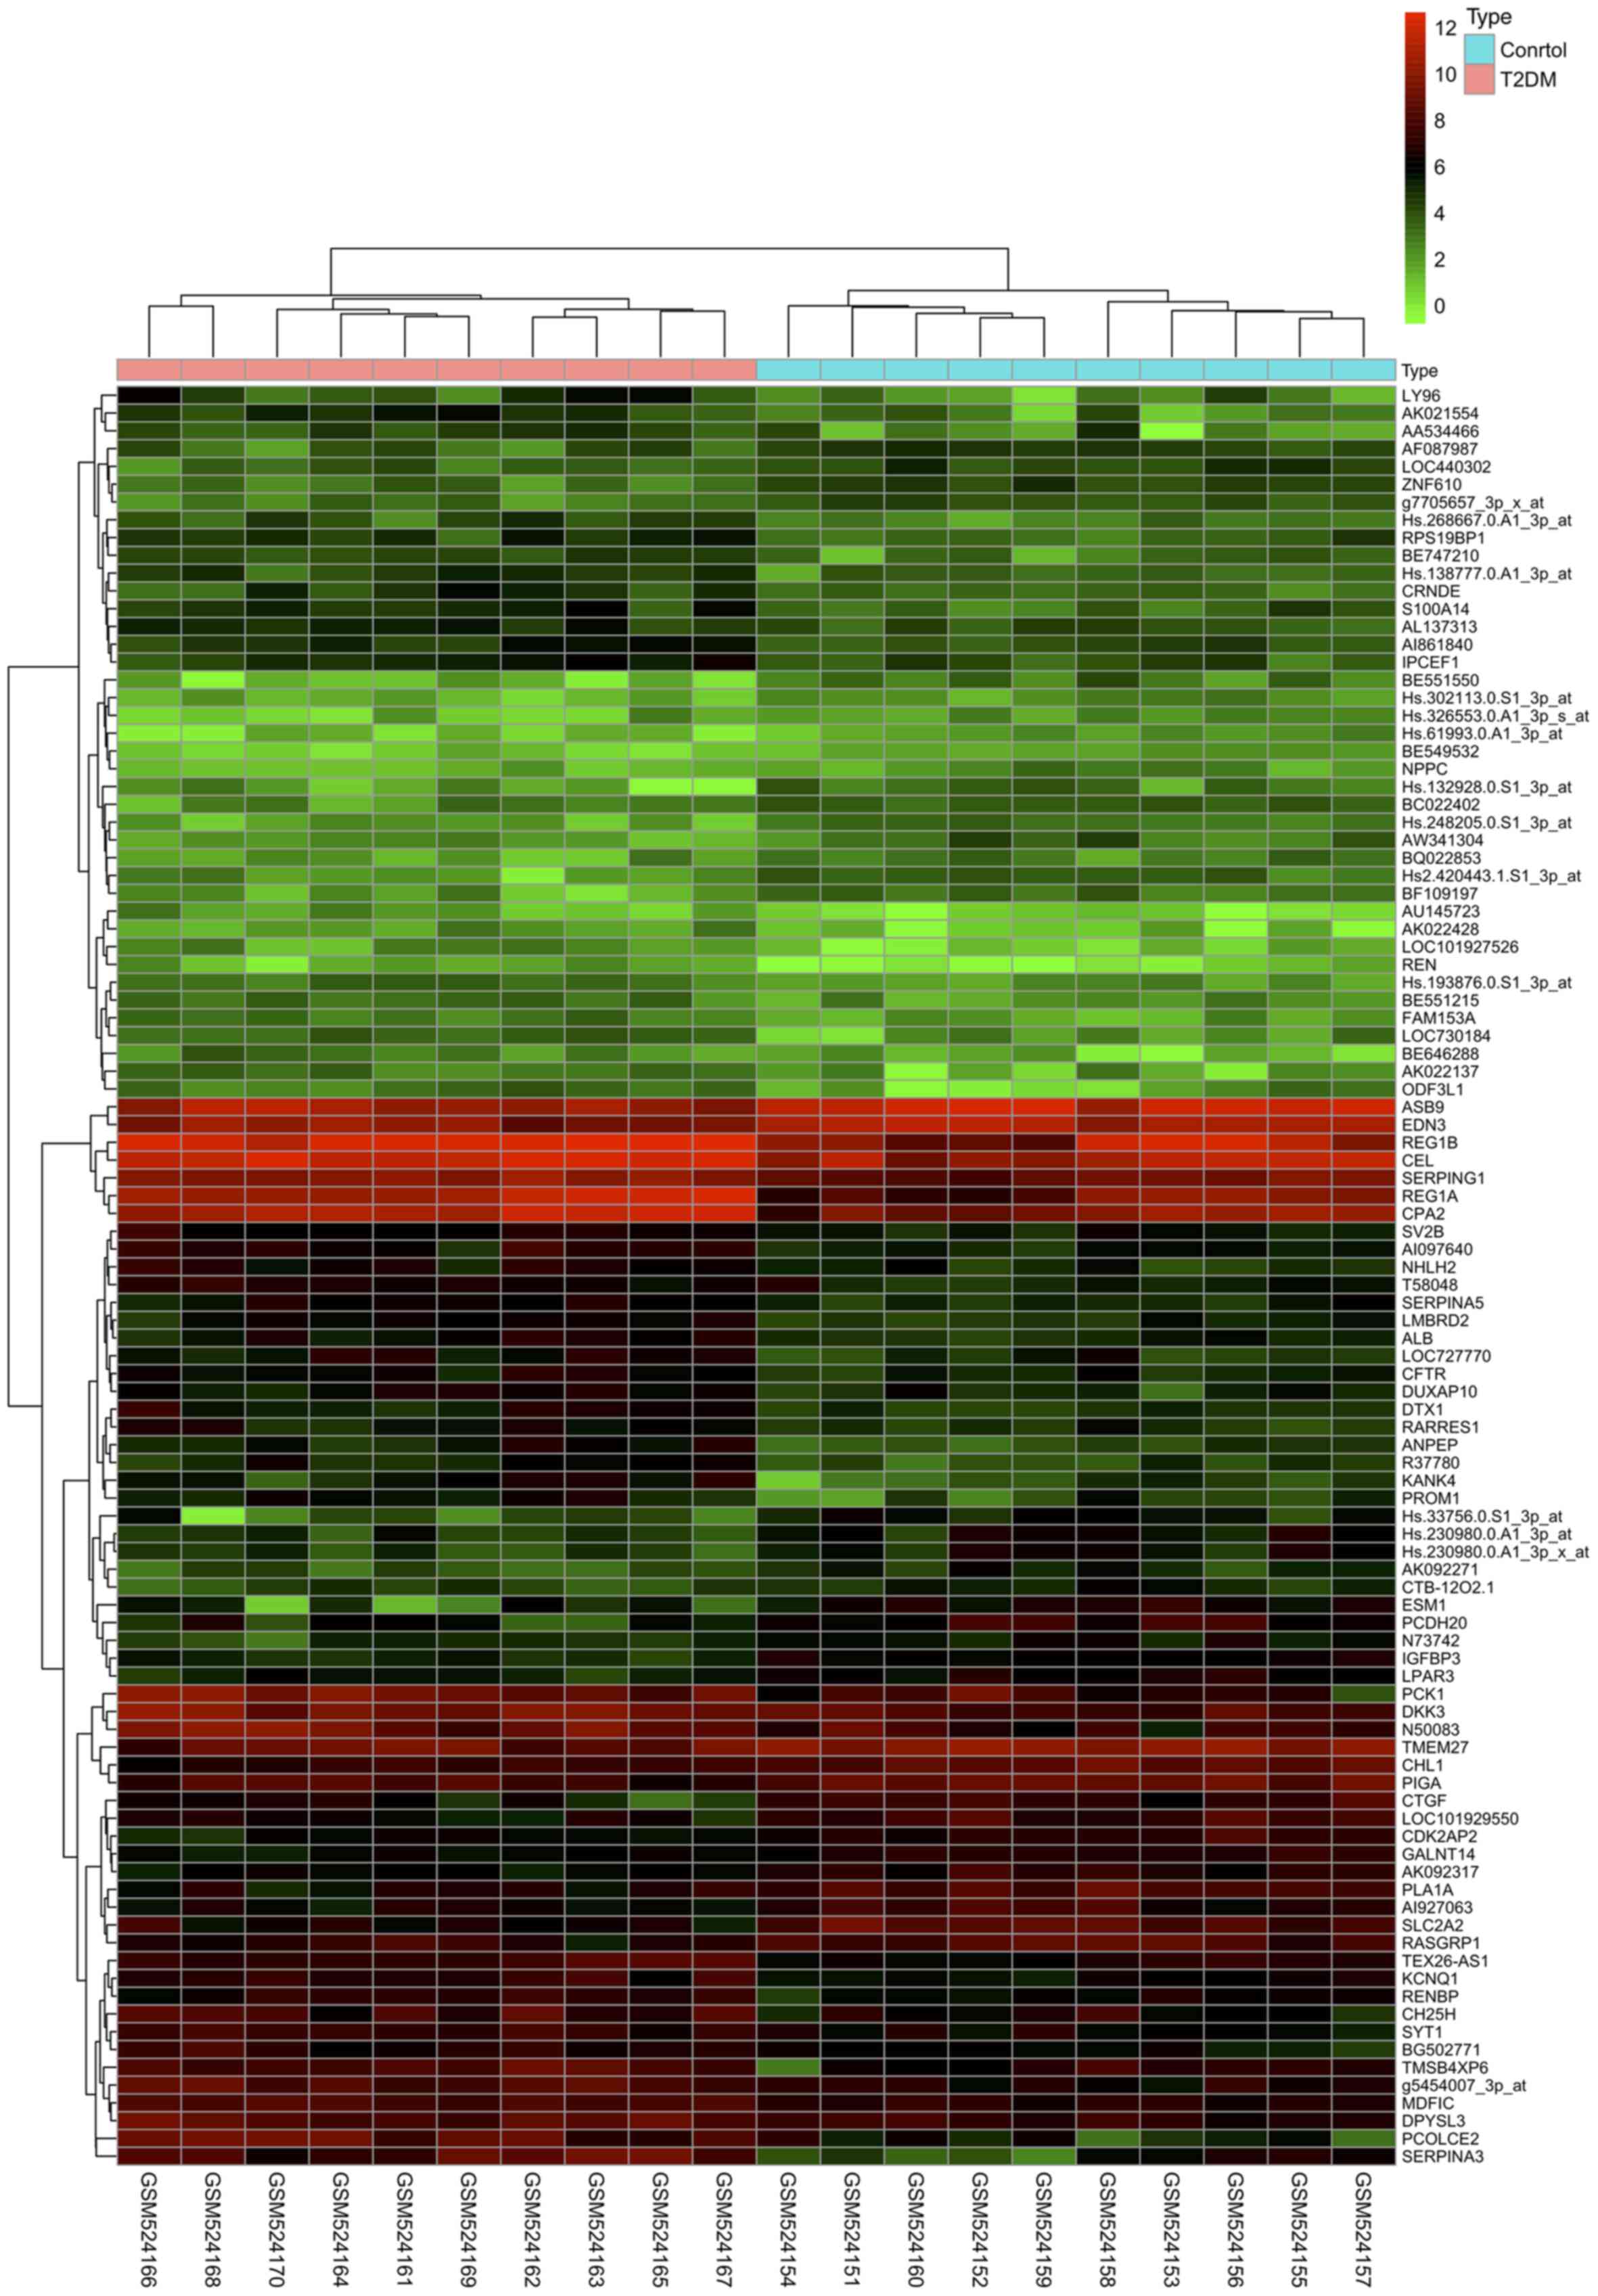
constructed for the DEGs and is presented in Fig. 2. The top 100 DEGs are presented by
a cluster heatmap in Fig. 3.
GO function and KEGG pathway
analysis
GO functional analysis and KEGG enrichment pathway
analysis in the DAVID online software were applied for a deeper
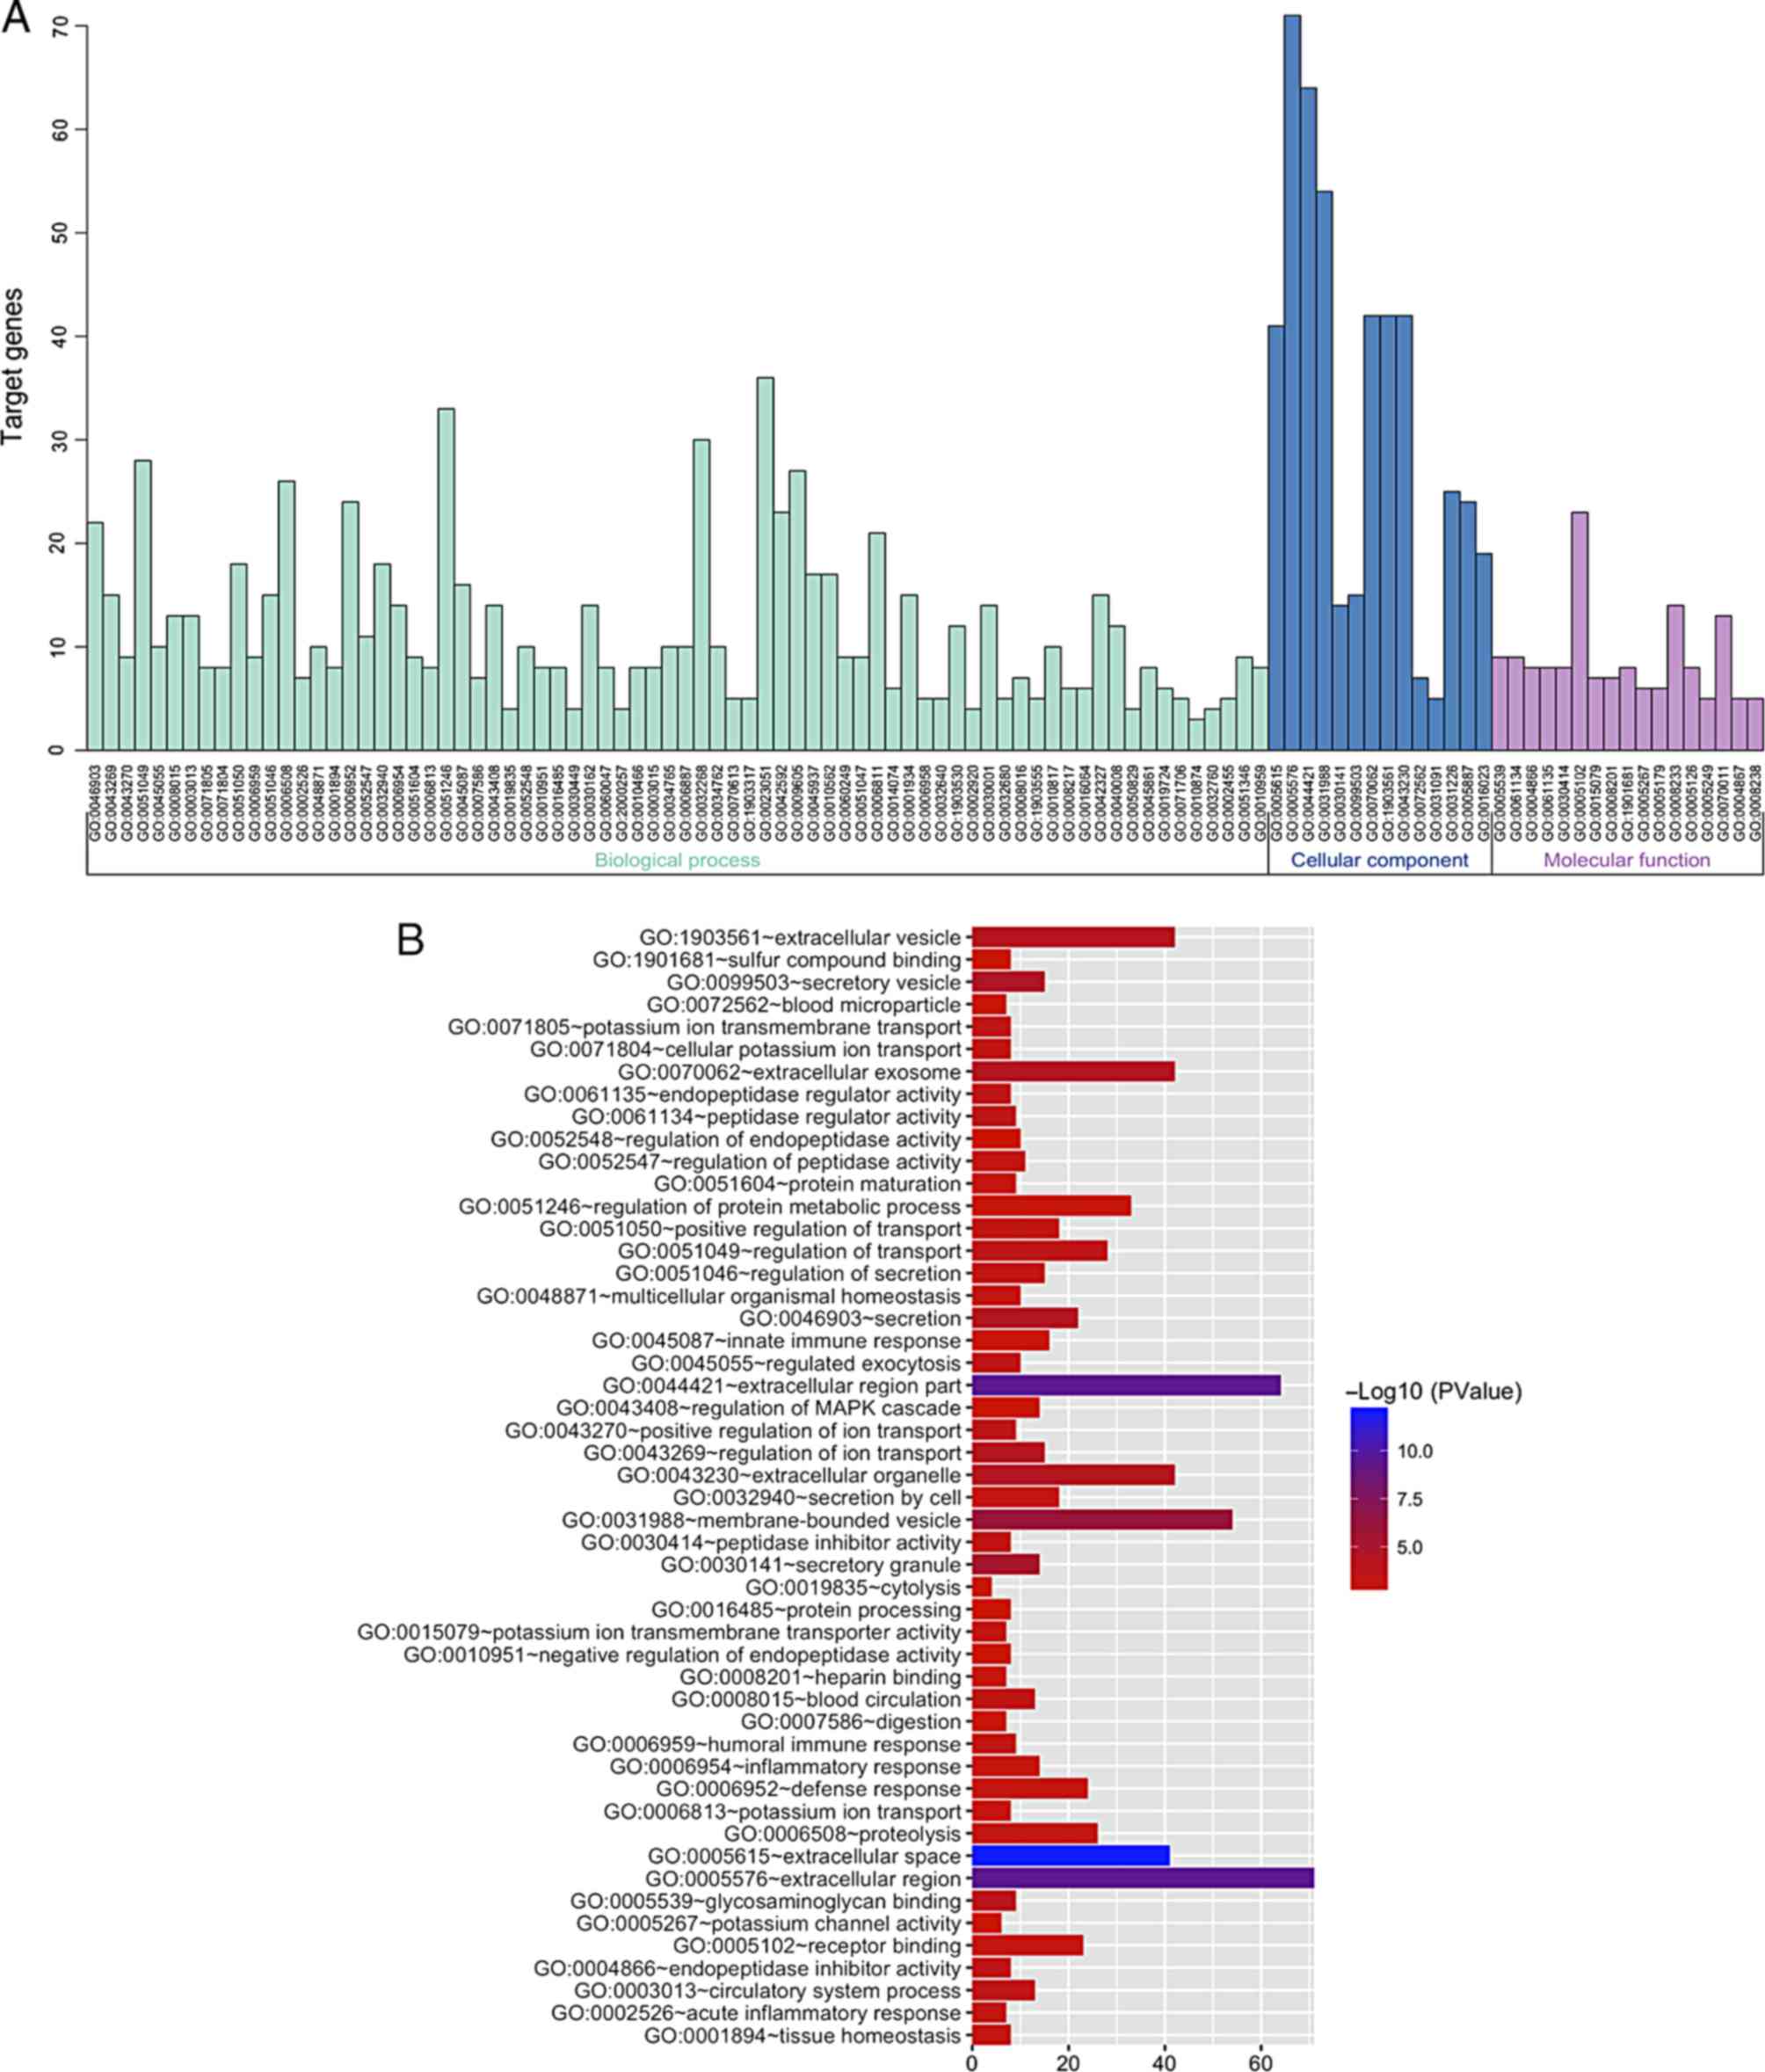
comprehension of the identified DEGs. The GO functional analysis of
the DEGs was divided into 3 functional groups, including BP, CC MF.
The significant results are presented in Fig. 4 and Table I. In the BP group, the upregulated
genes were mainly clustered in defense response, regulated
exocytosis and the acute inflammatory response, and the
downregulated genes were mainly clustered in regulation of ion
transport, heart contraction and heart process. For the CC group,
the upregulated genes were primarily clustered in extracellular
space, extracellular region part, and extracellular region. The
downregulated genes were primarily clustered in extracellular space
and extracellular region, as well as a cluster of actin-based cell
projections. The upregulated genes in the MF group were mostly
clustered in peptidase regulator activity, endopeptidase inhibitor
activity, and endopeptidase regulator activity, and the
downregulated genes were mostly clustered in insulin-like growth
factor binding, growth factor binding, and channel regulator
activity.
 | Table I.Gene Ontology analysis of DEGs
associated with T2DM. |
Table I.
Gene Ontology analysis of DEGs
associated with T2DM.
| Expression | Category | Term/gene
function | Gene count | % | P-value | FDR |
|---|
| Upregulated | GOTERM_BP | GO:0006952~defense
response | 19 | 16.52 | 6.42E-04 | 1.11E+00 |
|
| GOTERM_BP |
GO:0045055~regulated exocytosis | 8 | 6.96 | 7.21E-04 | 1.25E+00 |
|
| GOTERM_BP | GO:0002526~acute
inflammatory response | 6 | 5.22 | 7.40E-04 | 1.28E+00 |
|
| GOTERM_BP |
GO:0006508~proteolysis | 20 | 17.39 | 8.68E-04 | 1.50E+00 |
|
| GOTERM_BP |
GO:0052547~regulation of peptidase
activity | 9 | 7.83 | 1.00E-03 | 1.73E+00 |
|
| GOTERM_CC |
GO:0005615~extracellular space | 32 | 27.83 | 2.14E-11 | 2.72E-08 |
|
| GOTERM_CC |
GO:0044421~extracellular region part | 50 | 43.48 | 5.23E-10 | 6.66E-07 |
|
| GOTERM_CC |
GO:0005576~extracellular region | 54 | 46.96 | 1.89E-09 | 2.40E-06 |
|
| GOTERM_CC |
GO:0031988~membrane-bounded vesicle | 43 | 37.39 | 3.70E-07 | 4.72E-04 |
|
| GOTERM_CC |
GO:0070062~extracellular exosome | 34 | 29.57 | 1.32E-05 | 1.68E-02 |
|
| GOTERM_MF |
GO:0061134~peptidase regulator
activity | 8 | 6.96 | 1.40E-04 | 1.95E-01 |
|
| GOTERM_MF |
GO:0004866~endopeptidase inhibitor
activity | 7 | 6.09 | 2.80E-04 | 3.87E-01 |
|
| GOTERM_MF |
GO:0061135~endopeptidase regulator
activity | 7 | 6.09 | 3.35E-04 | 4.65E-01 |
|
| GOTERM_MF |
GO:0030414~peptidase inhibitor
activity | 7 | 6.09 | 3.66E-04 | 5.07E-01 |
|
| GOTERM_MF |
GO:0005539~glycosaminoglycan binding | 7 | 6.09 | 7.21E-04 | 9.96E-01 |
| Downregulated | GOTERM_BP |
GO:0043269~regulation of ion
transport | 8 | 15.09 | 1.57E-04 | 2.60E-01 |
|
| GOTERM_BP | GO:0060047~heart
contraction | 6 | 11.32 | 1.72E-04 | 2.85E-01 |
|
| GOTERM_BP | GO:0003015~heart
process | 6 | 11.32 | 1.82E-04 | 3.02E-01 |
|
| GOTERM_BP |
GO:0023051~regulation of signaling | 17 | 32.08 | 2.93E-04 | 4.85E-01 |
|
| GOTERM_BP | GO:0043270~positive
regulation of ion transport | 5 | 9.43 | 1.11E-03 | 1.83E+00 |
|
| GOTERM_CC |
GO:0005615~extracellular space | 9 | 16.98 | 1.35E-02 | 1.44E+01 |
|
| GOTERM_CC |
GO:0005576~extracellular region | 17 | 32.07 | 3.37E-02 | 3.23E+01 |
|
| GOTERM_CC | GO:0098862~cluster
of actin-based cell projections | 3 | 5.66 | 4.16E-02 | 3.84E+01 |
|
| GOTERM_CC | GO:0045177~apical
part of cell | 4 | 7.55 | 4.79E-02 | 4.29E+01 |
|
| GOTERM_CC |
GO:0005789~endoplasmic reticulum
membrane | 6 | 11.32 | 7.29E-02 | 5.78E+01 |
|
| GOTERM_MF |
GO:0005520~insulin-like growth factor
binding | 3 | 5.66 | 1.51E-03 | 1.90E+00 |
|
| GOTERM_MF | GO:0019838~growth
factor binding | 3 | 5.66 | 2.86E-02 | 3.08E+01 |
|
| GOTERM_MF | GO:0016247~channel
regulator activity | 3 | 5.66 | 3.16E-02 | 3.35E+01 |
|
| GOTERM_MF |
GO:0015077~monovalent inorganic cation
transmembrane transporter activity | 4 | 7.55 | 3.58E-02 | 3.71E+01 |
|
| GOTERM_MF |
GO:0015079~potassium ion transmembrane
transporter activity | 3 | 5.66 | 3.92E-02 | 3.98E+01 |
The top significantly enriched KEGG pathways for the
DEGs were also displayed by the DAVID online software and are
presented in Table II. The
upregulated genes were associated with pancreatic secretion and the
complement and coagulation cascades, while the downregulated genes
were involved in carbohydrate digestion and absorption, insulin
secretion, and the Toll-like receptor (TLR) signaling pathway.
| Table II.KEGG enrichment pathway analysis of
DEGs associated with T2DM. |
Table II.
KEGG enrichment pathway analysis of
DEGs associated with T2DM.
| Category | Term | Gene count | % | P-value | Genes |
|---|
| Upregulated
DEGs | hsa04972:Pancreatic
secretion | 6 | 5.2 | 6.83E-04 | CEL, PLA2G10,
PRSS3, CPA2, CPB1, KCNQ1 |
|
| hsa04610:Complement
and coagulation cascades | 5 | 4.3 | 1.85E-03 | C3, SERPINA5, C6,
SERPING1, C1R |
|
|
hsa05133:Pertussis | 5 | 4.3 | 2.51E-03 | C3, LY96, SFTPA2,
SERPING1, C1R |
|
|
hsa04614:Renin-angiotensin system | 3 | 2.6 | 1.32E-02 | REN, ANPEP,
KLK1 |
|
|
hsa04145:Phagosome | 5 | 4.3 | 2.92E-02 | NOX3, C3, SFTPA2,
C1R, THBS2 |
| Downregulated
DEGs |
hsa04973:Carbohydrate digestion and
absorption | 2 | 3.8 | 8.75E-02 | FXYD2, SLC2A2 |
|
| hsa04911:Insulin
secretion | 2 | 3.8 | 1.70E-01 | FXYD2, SLC2A2 |
|
| hsa04620:Toll-like
receptor signaling pathway | 2 | 3.8 | 2.07E-01 | IFNA6, TLR9 |
|
|
hsa05146:Amoebiasis | 2 | 3.8 | 2.07E-01 | C9, ARG2 |
|
|
hsa05162:Measles | 2 | 3.8 | 2.53E-01 | IFNA6, TLR9 |
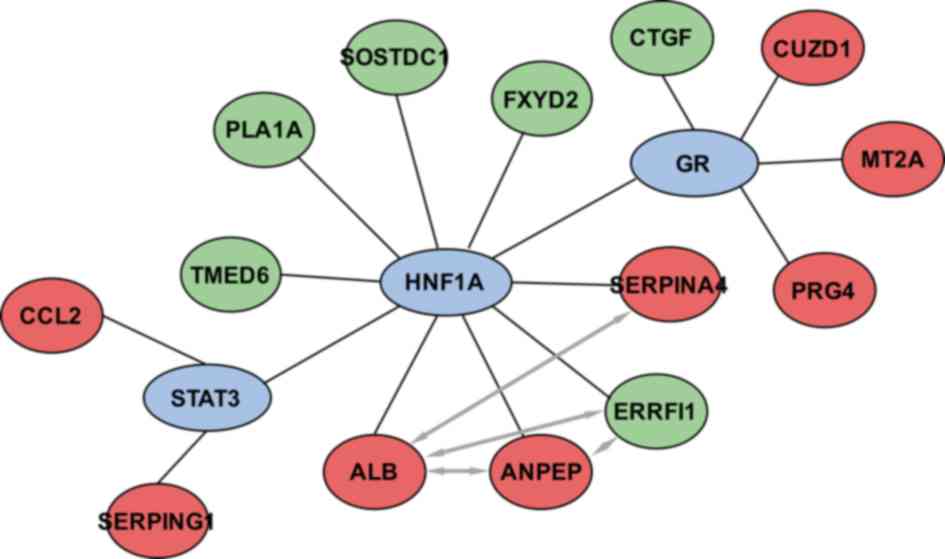
TF enrichment analysis
Key TFs that are associated with T2DM were
identified by WebGestalt and Enrichr software. The results revealed
that hepatocyte nuclear factor 1-alpha (HNF1A), signal
transducer and activator of transcription 3 (STAT3) and
glucocorticoid receptor (GR) were involved in the regulation
of the DEGs. As shown in Fig. 5,
HNF1A, STAT3 and GR regulate 8, 2 and 4 DEGs, respectively, in
pancreatic β-cells.
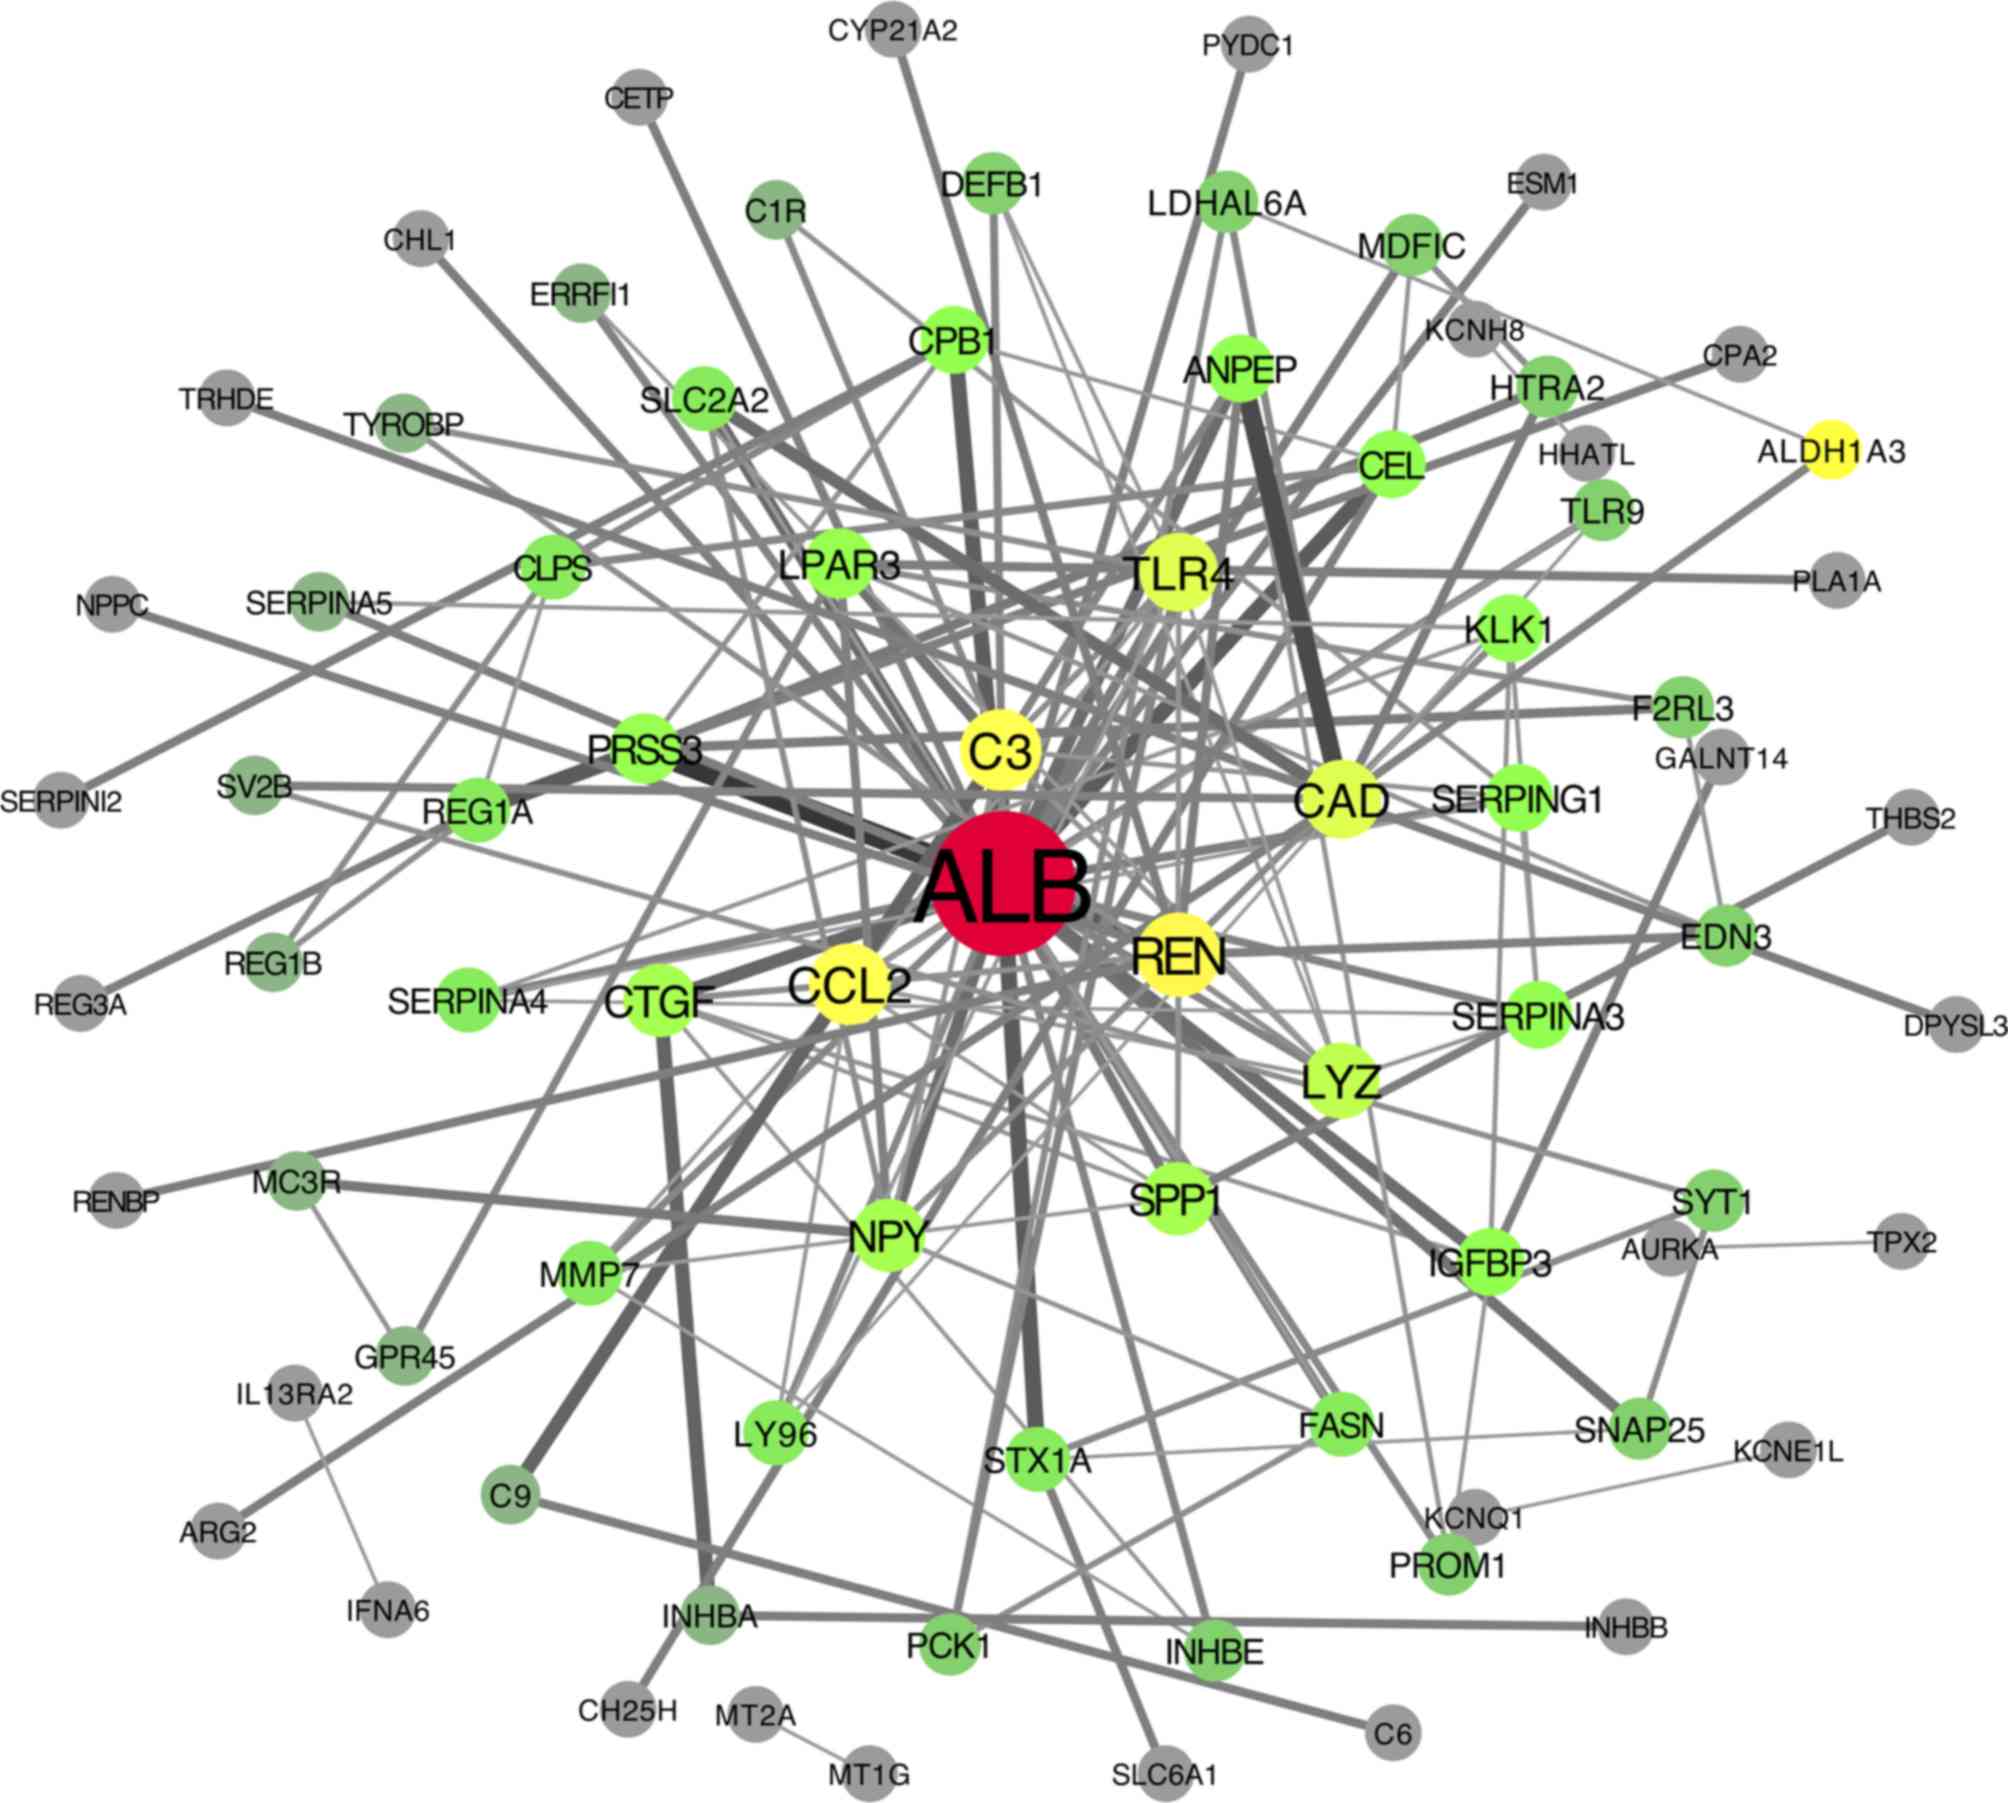
PPI network construction and module
screening
The DEG expression products in T2DM were constructed
into PPI networks using the STRING app in Cytoscape software. By
removing the separated and separately connected nodes, a complex
network of DEGs was constructed and is presented in Fig. 6. Cytoscape software was applied to
calculate the connectivity of each node in the PPI network. Twenty
DEGs were selected by a degree of connectivity ≥5. The degrees of
connectivity of all nodes are shown in Table III.
| Table III.Connectivity degree of each node in
the PPI network. |
Table III.
Connectivity degree of each node in
the PPI network.
| Gene | Degree | Gene | Degree | Gene | Degree | Gene | Degree |
|---|
| ALB | 33 | SLC2A2 | 4 | TYROBP | 2 | CHL1 | 1 |
| REN | 11 | CLPS | 4 | ALDH1A3 | 2 | TRHDE | 1 |
| CCL2 | 10 | REG1A | 4 | SERPINA5 | 2 | NPPC | 1 |
| C3 | 10 | SERPINA4 | 4 | SV2B | 2 | SERPINI2 | 1 |
| CAD | 9 | MMP7 | 4 | REG1B | 2 | REG3A | 1 |
| TLR4 | 9 | LY96 | 4 | MC3R | 2 | RENBP | 1 |
| LYZ | 8 | STX1A | 4 | GPR45 | 2 | ARG2 | 1 |
| CTGF | 7 | PROM1 | 3 | C9 | 2 | IL13RA2 | 1 |
| NPY | 7 | INHBE | 3 | INHBA | 2 | IFNA6 | 1 |
| SPP1 | 7 | PCK1 | 3 | C1R | 2 | CH25H | 1 |
| PRSS3 | 6 | DEFB1 | 3 | GALNT14 | 1 | MT2A | 1 |
| LPAR3 | 6 | LDHAL6A | 3 | THBS2 | 1 | MT1G | 1 |
| ANPEP | 5 | MDFIC | 3 | HHATL | 1 | SLC6A1 | 1 |
| CPB1 | 5 | HTRA2 | 3 | KCNH8 | 1 | C6 | 1 |
| CEL | 5 | TLR9 | 3 | PLA1A | 1 | INHBB | 1 |
| KLK1 | 5 | F2RL3 | 3 | CPA2 | 1 | KCNQ1 | 1 |
| IGFBP3 | 5 | EDN3 | 3 | ESM1 | 1 | KCNE1L | 1 |
| SERPINA3 | 5 | SYT1 | 3 | PYDC1 | 1 | AURKA | 1 |
| SERPING1 | 5 | SNAP25 | 3 | CYP21A2 | 1 | TPX2 | 1 |
| FASN | 4 | ERRFI1 | 2 | CETP | 1 | DPYSL3 | 1 |
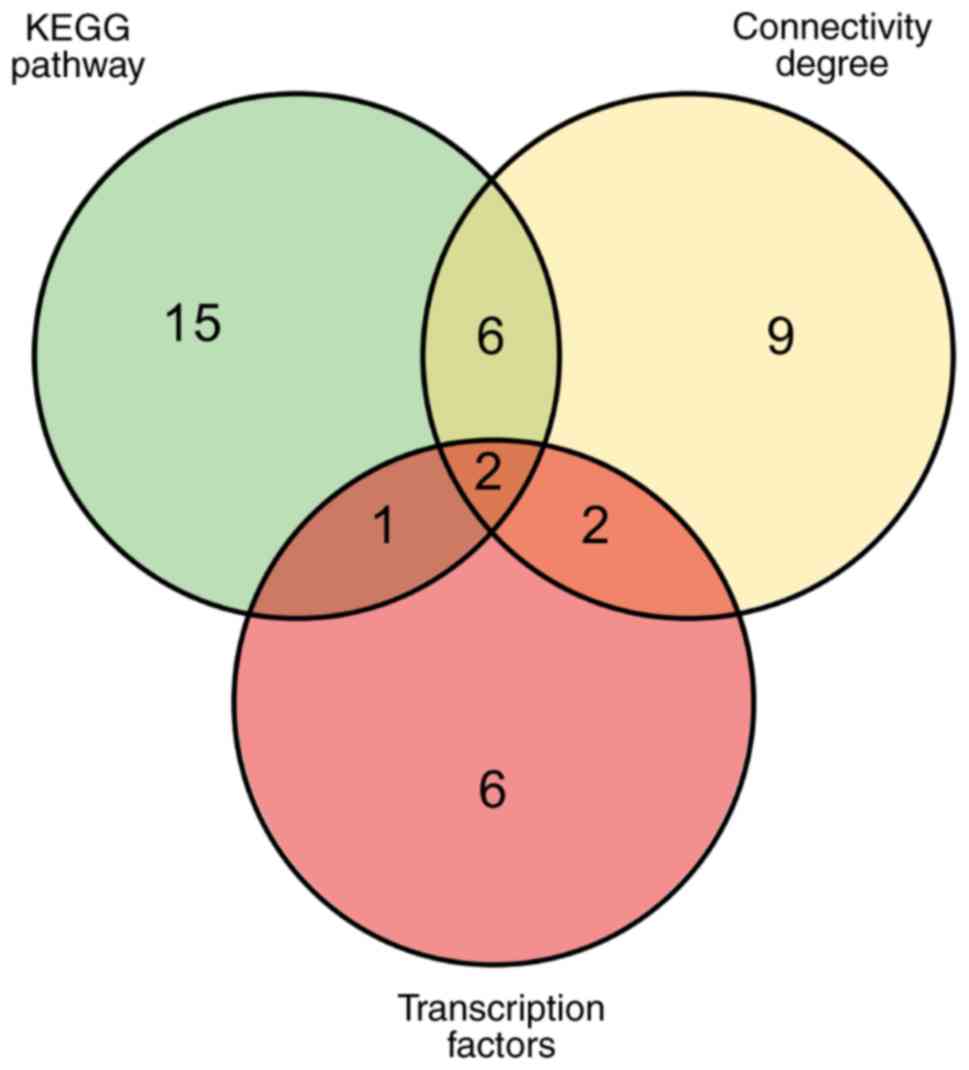
Screening for core genes
The Venn diagram presented in Fig. 7 illustrates the overlaps between
DEGs that are involved in the enriched KEGG pathways, that exhibit
a high degree of connectivity, and that are regulated by key TFs.
When comparing genes in the KEGG pathways and with a high degree of
connectivity, there were 6 overlapping genes: Carboxyl ester lipase
(CEL), serine protease 3 (PRSS3), carboxypeptidase B1
(CPB1), complement C3 (C3), renin (REN) and
kallikrein 1 (KLK1). When comparing genes in the KEGG
pathways and those regulated by key TFs, the overlapping gene was
FXYD domain containing ion transport regulator 2 (FXYD2).
When comparing genes with a high degree of connectivity and those
regulated by key TFs, there were 2 overlapping genes: Albumin
(ALB) and C-C motif chemokine ligand 2 (CCL2).
Finally, two core genes were identified that were present for all
three conditions: SERPING1 and ANPEP.
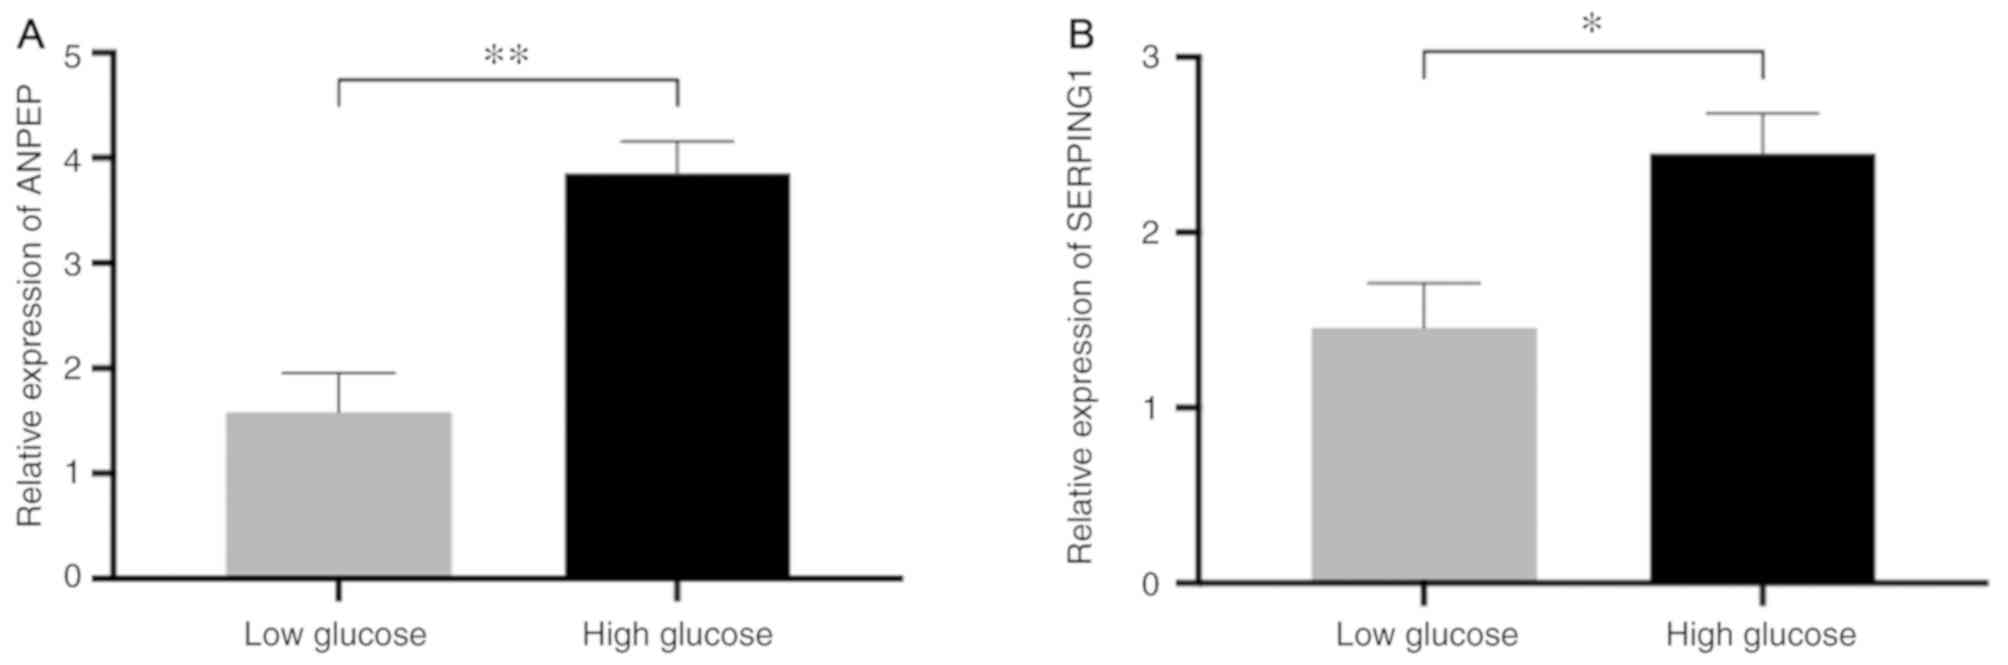
Identification of ANPEP and SERPING1
expression
To investigate the expression ANPEP and
SERPING1, and expression was assessed by comparing the
high-glucose group with the low-glucose group. The results of
RT-qPCR indicated that ANPEP (P-value <0.01) and
SERPING1 (P-value <0.05) were expressed at a higher level
in the high=glucose group compared with the low-glucose group
(Fig. 8). These findings indicate
that ANPEP and SERPING1 may be associated with high
glucose levels in pancreatic β-cells.
Discussion
The rapid development of high-throughput sequencing
technology allows biological problems to be addressed by gene
sequencing. Currently, high-throughput sequencing is beginning to
be widely used to find candidate genes for numerous diseases. Since
the pathogenesis of T2DM is not clear, comprehension of the
molecular mechanisms of T2DM is required for non-invasive diagnosis
and targeted therapies.
Laser capture microdissection (LCM) technology has
been utilized to extract samples. LCM obtains target cells directly
from frozen or paraffin-embedded tissue sections without destroying
the surrounding tissue morphology. It is often utilized to
accurately separate individual cells from tissue (11). The accurate separation of
pancreatic β-cells from heterogeneous tissue is a prerequisite for
continuous and meaningful bioinformatic analysis. Marselli et
al gathered pancreatic β-cells from patients with T2DM and
healthy controls by LCM for microarray analysis. In this study, we
extracted the expression data from GSE20966, and identified 208
upregulated and 121 downregulated DEGs by bioinformatic analysis.
To further investigate the interactions between the DEGs, GO
function and KEGG pathway enrichment analyses were performed.
The GO analysis indicated that the upregulated DEGs
were primarily involved in the defense response, regulated
exocytosis, and the acute inflammatory response, while the
downregulated DEGs were primarily associated with regulation of ion
transport, heart contraction and process and the regulation of
signaling. Insulin resistance and pancreatic β-cell structural
dysfunction are caused by an inflammatory response and lead to the
development of T2DM (12,13). Moreover, the knockdown of the
Na+/K+ ATPase subunit FXYD2 in the ion
transport pathway improved mouse pancreatic β-cell proliferation
and glucose tolerance (14,15).
Furthermore, the enriched KEGG pathways of the upregulated DEGs
were involved in pancreatic secretion and the complement and
coagulation cascades. The complement pathway is primarily related
to host defense and inflammation (16). The expression of C1q and C5a in the
complement pathway are associated with diabetic vascular
complications, such as diabetic retinopathy and diabetic
nephropathy (17,18). The downregulated DEGs were
primarily involved in carbohydrate digestion and absorption,
insulin secretion and the TLR pathway. Solute carrier family 2
member 2 (SLC2A2) was associated with carbohydrate
digestion, absorption pathway and the insulin secretion pathway.
SLC2A2, also known as glucose transporter 2 (GLUT2), is the
transmembrane carrier protein that transports glucose primarily in
the liver and blood (19). SLC2A2
can detect the presence of extracellular sugar and signal to
regulate insulin secretion by the pancreatic β-cells (20). Mutation of the SLC2A2 gene
conveys a high risk for the conversion of impaired glucose
tolerance (IGT) patients to T2DM patients (21). The TLR pathway can promote the
synthesis of many cellular activity factors, adhesion molecules and
inflammatory factors, ultimately affecting immunity and the
inflammatory response (22). The
TLR pathway is associated with the pathogenesis and development of
diabetes (23). Intercellular
adhesion molecule-1 (ICAM-1) exhibits an upregulated
expression in the retinal e ndothelial cells of diabetic
retinopathy rats. Through the accumulation and adhesion of
leukocytes, ICAM-1 can cause retinal vascular damage and destroy
the blood-retinal barrier (24).
Rajamani and Jiala found that TLR2 and TLR4
expression were upregulated in hyperglycemia-induced human
microvascular retinal endothelial cells (HMVRECs), and activated
NF-κB to produce biomediators of inflammation and ICAM-1 (25). Therefore, these pathways are most
likely to be important in the development of diabetes and diabetic
complications. Additional studies are required to identify all the
DEGs in T2DM.
The primary function of TFs is to bind a specific
site of a gene and regulate the expression of the target gene in
the cell. In this study, the TFs, HNF1A, STAT3 and
GR, were shown to be potential modulators of T2DM. HNF1A
belongs to the HNF1 homeobox family, and HNF1A is essential for the
regulation of pancreatic β-cell differentiation. The I27L
polymorphism of HNF1A decreases β-cell mass or impairs function and
leads to a high risk of T2DM (26,27).
HNF1A is a key transcription factor mediating the expression of
dipeptidyl peptidase-4 (DPP4) and angiotensin converting
enzyme 2 (ACE2) in pancreatic β-cells, both of which may
have therapeutic potential for T2DM (28,29).
Notably, ACE2 expression activates STAT3, shown herein to be an
important TF. The activation of the JAK/STAT3 pathway has been
reported to encourage the development of vasculopathy in T2DM
(30). However, Tiano et al
concluded that the activation of STAT3 signaling inhibits the
synthesis and accumulation of fatty acids in pancreatic cells of
diabetic mice induced by a high-fat diet, thus preventing
pancreatic β-cell damage (31). In
addition, STAT3 signaling activation has been demonstrated to
enhance the function of insulin secretion (32). This indicates that STAT3 is a
double-edged sword in the development of T2DM, preventing the
pancreatic cells from further damage and maintaining the secretion
of insulin, while aggravating the development of vascular
complications. GR, also known as NR3C1, is the receptor bound by
cortisol and other glucocorticoids. Recent studies have
demonstrated that the Bcl1 polymorphism in intron 2 of GR is
associated with insulin resistance and hyperinsulinemia, although
the underlying mechanisms remain unclear (33,34).
Therefore, additional research is required to explore the role of
GR in T2DM insulin resistance.
In this study, we also constructed a PPI network for
the DEGs, and there were 4 genes with a connectivity level ≥10:
ALB, REN, C3 and CCL2. ALB was the DEG with
the highest degree of connectivity. The serum glycated ALB level in
patients with T2DM is related to coronary artery disease (CAD). As
the level of serum glycated ALB increases, the presence and
severity of CAD increases (35,36).
Rodiño-Janeiro et al also reported that the elevated
expression of glycated ALB upregulated NAPDH oxidase in
vitro, and the enhanced oxidative stress may mediate diabetic
vasculopathy (37). REN is
important in the development of diabetic vasculopathies, such as
diabetic retinopathy and diabetic nephropathy (38,39).
A subsequent study using biopsy samples from diabetic patients
revealed that renin plays a role in diabetic vascular disease by
activating a renin-angiotensin system (40). In this study, we found that the
gene expression of C3 (log2 FC=1.44, P-value
<0.01) was upregulated in pancreatic β-cells of patients with
T2DM. In the complement signaling pathway, C3 is a key protein in
both the alternative pathway and the classical pathway. Elevated
rates of diabetes and insulin resistance are closely related to
increased serum C3 (41–43). The main feature of T2DM is
pancreatic β-cell damage and dysfunction, due to a shift of β-cell
status from proliferative to apoptotic (44). Notably, a recent study demonstrated
that C3 stimulated intracellular calcium and ATP levels by
activating the C3/C3aR signaling pathway, and increased
glucose-dependent insulin secretion and protection against
apoptosis (45). Dos Santos et
al also reported that C3 silencing led to apoptosis under
normal physiological conditions and following exposure to
cytokines. The addition of exogenous C3 prevents cytokine-induced
apoptosis in β cells through C3-mediated activation of the AKT
signaling pathway and inhibition of c-Jun N-terminal kinase
activity (46). Therefore, it is
conceivable that elevated C3 may have a protective effect on
apoptosis in T2DM, indicating that C3 may be a potential
therapeutic target for T2DM. CCL2 belongs to the CC chemokine
family, and is also known as monocyte chemoattractant protein 1
(MCP1). In vitro studies on patients with
proliferative diabetic retinopathy have demonstrated that the level
of CCL2 is significantly increased in patients compared with
healthy controls (47). Liu et
al found that hyperglycemia may affect hypomethylation of the
CpG site in the CCL2 promoter region, and enhanced
differential expression of serum CCL2 was important in the
occurrence and development of vasculopathy in T2DM (48). Recent studies have proposed that
the CCL2 2518A/G polymorphism is associated with diabetic
retinopathy in T2DM; as the number of G alleles increased, the
prevalence of diabetic retinopathy was elevated (47,49).
In the present study, we identified two core genes,
SERPING1 and ANPEP. SERPING1, also known as the
C1-inhibitor (C1INH), is a protease inhibitor that belongs
to the SERPIN superfamily. The STAT3 signaling pathway regulates
the expression of SERPING1. The function of SERPING1 is to inhibit
activation of both the classical pathway and the lectin pathway to
reduce production of C3 convertase. Notably, the expression levels
of SERPING1 and C3 were both upregulated in this
study, indicating that the activation of the complement system may
be achieved by the alternative pathway. The accumulation of C3
in vivo is probably caused by the effect of SERPING1
inhibiting C3 convertase. We hypothesized that the STAT3 signaling
pathway stimulates the expression of SERPING1 and promotes the
accumulation of C3 to produce an anti-apoptotic effect in
pancreatic β-cells. Moreover, the SERPING1-mediated regulation of
the complement pathway may inhibit the inflammatory response in
pancreatic β-cells. Thus, SERPING1 may play a dual role, an
anti-inflammatory one, while maintaining an anti-apoptotic effect.
Further studies are required to confirm this hypothesis. ANPEP, a
broadly specific aminopeptidase, is associated with a number of
cellular process, including cell proliferation, apoptotic
differentiation, angiogenesis, and chemotaxis (50). The results presented in Fig. 5 suggest that HNF1A simultaneously
regulates the expression of ANPEP and ALB, and that
there is an interaction between ALB and ANPEP. Expression of ALB
stimulates the production of reactive oxygen species (ROS) by the
NADPH enzyme to activate oxidative stress (37). The expression levels of both ANPEP
and REN in our study are upregulated. Both of them activate the
renin-angiotensin signaling pathway to stimulate ROS generation.
Pancreatic β cells are more sensitive to ROS, and so this can lead
to direct damage of pancreatic β cells and promote apoptosis.
Therefore, we suggest that HNF1A-mediated ANPEP and ALB expression
may accelerate pancreatic β-cell damage and insulin resistance
through oxidative stress. Pedersen et al compared the direct
overlap between heterogeneous islet diabetes-associated genomes by
genome-wide association studies (GWAS) to establish ANPEP as
a diabetes susceptibility gene (51). Locke et al found that
ANPEP had a significant allelic expression imbalance by
comparing the allelic expression of RNA and DNA from islets of
diabetic and non-diabetic individuals. This suggests that ANPEP is
a pathogenic gene for T2DM (52).
However, the precise mechanisms of action of ANPEP in T2DM remain
unknown, and further research is required to confirm this
hypothesis. In our further studies, we aim to validate the selected
SERPING1 and ANPEP genes in T2DM tissue samples from
patients and animal models.
In conclusion, in the present study, we conducted a
thorough bioinformatics analysis of DEGs by GSE20966 data screening
and identified several genes implicated in the development and
progression of T2DM. A total of 329 genes were identified, of which
SERPING1 and ANPEP are probable core genes of T2DM.
This study reveals a series of valuable genes for further research
into the non-invasive diagnosis and targeted therapy of T2DM.
However, bioinformatics analyses merely indicate a general
direction for further research. To confirm the functions of DEGs in
T2DM, molecular biology experiments are required.
Acknowledgements
Not applicable.
Funding
The present study was supported by Medical Health
Science and Technology Project of Zhejiang Provincial Health
Commission (No. 2019RC300), Jinhua Municipal Science and Technology
Project (No. 2018-4-036) and Youth Foundation of Jinhua Municipal
Central Hospital (No. JY-2017-1-01).
Availability of data and materials
The datasets used or analyzed during the present
study are available from the corresponding author on reasonable
request.
Authors' contributions
LD and YX designed the experiments. LF and XX
performed the experiments. JF analyzed the data. All authors have
read and approved the final manuscript.
Ethics approval and consent to
participate
This analysis was based on a previously published
study and no ethical approval and patient consent is required.
Patient consent for publication
Not applicable.
Competing interests
The authors declare that they have no competing
interests.
References
|
1
|
Ogurtsova K, da Rocha Fernandes JD, Huang
Y, Linnenkamp U, Guariguata L, Cho NH, Cavan D, Shaw JE and
Makaroff LE: IDF diabetes atlas: Global estimates for the
prevalence of diabetes for 2015 and 2040. Diabetes Res Clin Pract.
128:40–50. 2017. View Article : Google Scholar : PubMed/NCBI
|
|
2
|
Zhao Q, Zhang A, Zong W, An N, Zhang H,
Luan Y, Sun H, Wang X and Cao H: Exploring potential biomarkers and
determining the metabolic mechanism of type 2 diabetes mellitus
using liquid chromatography coupled to high-resolution mass
spectrometry. RSC Adv. 7:441862017. View Article : Google Scholar
|
|
3
|
Leibowitz G, Kaiser N and Cerasi E:
Balancing needs and means: The dilemma of the beta-cell in the
modern world. Diabetes Obes Metab. 11 (Suppl 4):S1–S9. 2009.
View Article : Google Scholar
|
|
4
|
Hoshino A, Ariyoshi M, Okawa Y, Kaimoto S,
Uchihashi M, Fukai K, Iwai-Kanai E, Ikeda K, Ueyama T, Ogata T and
Matoba S: Inhibition of p53 preserves Parkin-mediated mitophagy and
pancreatic β-cell function in diabetes. Proc Natl Acad Sci USA.
111:3116–3121. 2014. View Article : Google Scholar : PubMed/NCBI
|
|
5
|
Chaurasia B and Summers SA:
Ceramides-lipotoxic inducers of metabolic disorders. Trends
Endocrinol Metab. 26:538–550. 2015. View Article : Google Scholar : PubMed/NCBI
|
|
6
|
Park YJ, Lee S, Kieffer TJ, Warnock GL,
Safikhan N, Speck M, Hao Z, Woo M and Marzban L: Deletion of Fas
protects islet beta cells from cytotoxic effects of human islet
amyloid polypeptide. Diabetologia. 1–Feb;2012.(Epub ahead of
print). View Article : Google Scholar :
|
|
7
|
Marselli L, Thorne J, Dahiya S, Sgroi DC,
Sharma A, Bonner-Weir S, Marchetti P and Weir GC: Gene expression
profiles of beta-cell enriched tissue obtained by laser capture
microdissection from subjects with type 2 diabetes. PLoS One.
5:e114992010. View Article : Google Scholar : PubMed/NCBI
|
|
8
|
Troyanskaya O, Cantor M, Sherlock G, Brown
P, Hastie T, Tibshirani R, Botstein D and Altman RB: Missing value
estimation methods for DNA microarrays. Bioinformatics. 17:520–525.
2001. View Article : Google Scholar : PubMed/NCBI
|
|
9
|
Bolstad BM, Irizarry RA, Astrand M and
Speed TP: A comparison of normalization methods for high density
oligonucleotide array data based on variance and bias.
Bioinformatics. 19:185–193. 2003. View Article : Google Scholar : PubMed/NCBI
|
|
10
|
Livak KJ and Schmittgen TD: Analysis of
relative gene expression data using real-time quantitative PCR and
the 2(-Delta Delta C(T)) method. Methods. 25:402–408. 2001.
View Article : Google Scholar : PubMed/NCBI
|
|
11
|
Espina V, Wulfkuhle JD, Calvert VS,
VanMeter A, Zhou W, Coukos G, Geho DH, Petricoin EF III and Liotta
LA: Laser-capture microdissection. Nat Protoc. 1:586–603. 2006.
View Article : Google Scholar : PubMed/NCBI
|
|
12
|
Lontchi-Yimagou E, Sobngwi E, Matsha TE
and Kengne AP: Diabetes mellitus and inflammation. Curr Diab Rep.
13:435–444. 2013. View Article : Google Scholar : PubMed/NCBI
|
|
13
|
Velloso LA, Eizirik DL and Cnop M: Type 2
diabetes mellitus-an autoimmune disease? Nat Rev Endocrinol.
9:750–755. 2013. View Article : Google Scholar : PubMed/NCBI
|
|
14
|
Arystarkhova E, Liu YB, Salazar C,
Stanojevic V, Clifford RJ, Kaplan JH, Kidder GM and Sweadner KJ:
Hyperplasia of pancreatic beta cells and improved glucose tolerance
in mice deficient in the FXYD2 subunit of Na,K-ATPase. J Biol Chem.
288:7077–7085. 2013. View Article : Google Scholar : PubMed/NCBI
|
|
15
|
Arystarkhova E: Beneficial renal and
pancreatic phenotypes in a mouse deficient in FXYD2 regulatory
subunit of Na,K-ATPase. Front Physiol. 7:882016. View Article : Google Scholar : PubMed/NCBI
|
|
16
|
Markiewski MM and Lambris JD: The role of
complement in inflammatory diseases from behind the scenes into the
spotlight. Am J Pathol. 171:715–727. 2007. View Article : Google Scholar : PubMed/NCBI
|
|
17
|
Huang C, Fisher KP, Hammer SS, Navitskaya
S, Blanchard GJ and Busik JV: Plasma exosomes contribute to
microvascular damage in diabetic retinopathy by activating
classical complement pathway. Diabetes. 67:1639–1649. 2018.
View Article : Google Scholar : PubMed/NCBI
|
|
18
|
Flyvbjerg A: The role of the complement
system in diabetic nephropathy. Nat Rev Nephrol. 13:311–318. 2017.
View Article : Google Scholar : PubMed/NCBI
|
|
19
|
Uldry M and Thorens B: The SLC2 family of
facilitated hexose and polyol transporters. Pflugers Arch.
447:480–489. 2004. View Article : Google Scholar : PubMed/NCBI
|
|
20
|
Laukkanen O, Lindström J, Eriksson J,
Valle TT, Hämäläinen H, Ilanne-Parikka P, Keinänen-Kiukaanniemi S,
Tuomilehto J, Uusitupa M and Laakso M; Finnish Diabetes Prevention
Study, : Polymorphisms in the SLC2A2 (GLUT2) gene are associated
with the conversion from impaired glucose tolerance to type 2
diabetes: The finnish diabetes prevention study. Diabetes.
54:2256–2260. 2005. View Article : Google Scholar : PubMed/NCBI
|
|
21
|
Leturque A, Brot-Laroche E and Le Gall M:
GLUT2 mutations, translocation, and receptor function in diet sugar
managing. Am J Physiol Endocrinol Metab. 296:E985–E992. 2009.
View Article : Google Scholar : PubMed/NCBI
|
|
22
|
Takeda K, Kaisho T and Akira S: Toll-like
receptors. Annu Rev Immunol. 21:335–376. 2003. View Article : Google Scholar : PubMed/NCBI
|
|
23
|
Dasu MR, Devaraj S, Zhao L, Hwang DH and
Jialal I: High glucose induces toll-like receptor expression in
human monocytes: Mechanism of activation. Diabetes. 57:3090–3098.
2008. View Article : Google Scholar : PubMed/NCBI
|
|
24
|
Miyahara S, Kiryu J, Yamashiro K, Miyamoto
K, Hirose F, Tamura H, Katsuta H, Nishijima K, Tsujikawa A and
Honda Y: Simvastatin inhibits leukocyte accumulation and vascular
permeability in the retinas of rats with streptozotocin-induced
diabetes. Am J Pathol. 164:1697–1706. 2004. View Article : Google Scholar : PubMed/NCBI
|
|
25
|
Rajamani U and Jialal I: Hyperglycemia
induces Toll-like receptor-2 and −4 expression and activity in
human microvascular retinal endothelial cells: Implications for
diabetic retinopathy. J Diabetes Res. 2014:7909022014. View Article : Google Scholar : PubMed/NCBI
|
|
26
|
Chiu KC, Chuang LM, Chu A, Yoon C and Wang
M: Comparison of the impact of the I27L polymorphism of the
hepatocyte nuclear factor-1alpha on estimated and measured beta
cell indices. Eur J Endocrinol. 148:641–647. 2003. View Article : Google Scholar : PubMed/NCBI
|
|
27
|
Morita K, Saruwatari J, Tanaka T, Oniki K,
Kajiwara A, Otake K, Ogata Y and Nakagawa K: Associations between
the common HNF1A gene variant p.I27L (rs1169288) and risk of type 2
diabetes mellitus are influenced by weight. Diabetes Metab.
41:91–94. 2015. View Article : Google Scholar : PubMed/NCBI
|
|
28
|
Gu N, Tsuda M, Matsunaga T, Adachi T,
Yasuda K, Ishihara A and Tsuda K: Glucose regulation of dipeptidyl
peptidase IV gene expression is mediated by hepatocyte nuclear
factor-1alpha in epithelial intestinal cells. Clin Exp Pharmacol
Physiol. 35:1433–1439. 2008.PubMed/NCBI
|
|
29
|
Pedersen KB, Chhabra KH, Nguyen VK, Xia H
and Lazartigues E: The transcription factor HNF1α induces
expression of angiotensin-converting enzyme 2 (ACE2) in pancreatic
islets from evolutionarily conserved promoter motifs. Biochim
Biophys Acta. 1829:1225–1235. 2013. View Article : Google Scholar : PubMed/NCBI
|
|
30
|
Banes-Berceli AK, Ketsawatsomkron P, Ogbi
S, Patel B, Pollock DM and Marrero MB: Angiotensin II and
endothelin-1 augment the vascular complications of diabetes via
JAK2 activation. Am J Physiol Heart Circ Physiol. 293:H1291–H1299.
2007. View Article : Google Scholar : PubMed/NCBI
|
|
31
|
Tiano JP, Delghingaro-Augusto V, Le May C,
Liu S, Kaw MK, Khuder SS, Latour MG, Bhatt SA, Korach KS, Najjar
SM, et al: Estrogen receptor activation reduces lipid synthesis in
pancreatic islets and prevents β cell failure in rodent models of
type 2 diabetes. J Clin Invest. 121:3331–3342. 2011. View Article : Google Scholar : PubMed/NCBI
|
|
32
|
Ezzat S, Zheng L, Florez JC, Stefan N,
Mayr T, Hliang MM, Jablonski K, Harden M, Stančáková A, Laakso M,
et al: The cancer-associated FGFR4-G388R polymorphism enhances
pancreatic insulin secretion and modifies the risk of diabetes.
Cell Metab. 17:929–940. 2013. View Article : Google Scholar : PubMed/NCBI
|
|
33
|
Geelen CC, van Greevenbroek MM, van Rossum
EF, Schaper NC, Nijpels G, 't Hart LM, Schalkwijk CG, Ferreira I,
van der Kallen CJ and Sauerwein HP: BclI glucocorticoid receptor
polymorphism is associated with greater body fatness: The Hoorn and
CODAM studies. J Clin Endocrinol Metab. 98:E595–E599. 2013.
View Article : Google Scholar : PubMed/NCBI
|
|
34
|
Syed AA, Halpin CG, Irving JA, Unwin NC,
White M, Bhopal RS, Redfern CP and Weaver JU: A common intron 2
polymorphism of the glucocorticoid receptor gene is associated with
insulin resistance in men. Clin Endocrinol (Oxf). 68:879–884. 2008.
View Article : Google Scholar : PubMed/NCBI
|
|
35
|
Lu L, Pu LJ, Xu XW, Zhang Q, Zhang RY,
Zhang JS, Hu J, Yang ZK, Lu AK, Ding FH, et al: Association of
serum levels of glycated albumin, C-reactive protein and tumor
necrosis factor-alpha with the severity of coronary artery disease
and renal impairment in patients with type 2 diabetes mellitus.
Clin Biochem. 40:810–816. 2007. View Article : Google Scholar : PubMed/NCBI
|
|
36
|
Jin C, Lu L, Zhang RY, Zhang Q, Ding FH,
Chen QJ and Shen WF: Association of serum glycated albumin,
C-reactive protein and ICAM-1 levels with diffuse coronary artery
disease in patients with type 2 diabetes mellitus. Clin Chim Acta.
408:45–49. 2009. View Article : Google Scholar : PubMed/NCBI
|
|
37
|
Rodiño-Janeiro BK, González-Peteiro M,
Ucieda-Somoza R, González-Juanatey JR and Alvarez E: Glycated
albumin, a precursor of advanced glycation end-products,
up-regulates NADPH oxidase and enhances oxidative stress in human
endothelial cells: Molecular correlate of diabetic vasculopathy.
Diabetes Metab Res Rev. 26:550–558. 2010. View Article : Google Scholar : PubMed/NCBI
|
|
38
|
Ichihara A, Sakoda M, Mito-Kurauchi A and
Itoh H: Activated prorenin as a therapeutic target for diabetic
nephropathy. Diabetes Res Clin Pract. 82 (Suppl 1):S63–S66. 2008.
View Article : Google Scholar : PubMed/NCBI
|
|
39
|
Yokota H, Nagaoka T, Tani T, Takahashi A,
Sato E, Kato Y and Yoshida A: Higher levels of prorenin predict
development of diabetic retinopathy in patients with type 2
diabetes. J Renin Angiotensin Aldosterone Syst. 12:290–294. 2011.
View Article : Google Scholar : PubMed/NCBI
|
|
40
|
Kamiyama M, Urushihara M, Morikawa T,
Konishi Y, Imanishi M, Nishiyama A and Kobori H: Oxidative
stress/angiotensinogen/renin-angiotensin system axis in patients
with diabetic nephropathy. Int J Mol Sci. 14:23045–23062. 2013.
View Article : Google Scholar : PubMed/NCBI
|
|
41
|
Engström G, Hedblad B, Eriksson KF, Janzon
L and Lindgärde F: Complement C3 is a risk factor for the
development of diabetes: A population-based cohort study. Diabetes.
54:570–575. 2005. View Article : Google Scholar : PubMed/NCBI
|
|
42
|
Yang S, Li Q, Song Y, Tian B, Cheng Q,
Qing H, Zhong L and Xia W: Serum complement C3 has a stronger
association with insulin resistance than high-sensitivity
C-reactive protein in women with polycystic ovary syndrome. Fertil
Steril. 95:1749–1753. 2011. View Article : Google Scholar : PubMed/NCBI
|
|
43
|
Wlazlo N, van Greevenbroek MM, Ferreira I,
Feskens EJ, van der Kallen CJ, Schalkwijk CG, Bravenboer B and
Stehouwer CD: Complement factor 3 is associated with insulin
resistance and with incident type 2 diabetes over a 7-year
follow-up period: The CODAM study. Diabetes Care. 37:1900–1909.
2014. View Article : Google Scholar : PubMed/NCBI
|
|
44
|
Ribbing J, Hamrén B, Svensson MK and
Karlsson MO: A model for glucose, insulin, and beta-cell dynamics
in subjects with insulin resistance and patients with type 2
diabetes. J Clin Pharmacol. 50:861–872. 2010. View Article : Google Scholar : PubMed/NCBI
|
|
45
|
Atanes P, Ruz-Maldonado I, Pingitore A,
Hawkes R, Liu B, Zhao M, Huang GC, Persaud SJ and Amisten S: C3aR
and C5aR1 act as key regulators of human and mouse β-cell function.
Cell Mol Life Sci. 75:715–726. 2018. View Article : Google Scholar : PubMed/NCBI
|
|
46
|
Dos Santos RS, Marroqui L, Grieco FA,
Marselli L, Suleiman M, Henz SR, Marchetti P, Wernersson R and
Eizirik DL: Protective role of complement C3 against
cytokine-mediated β-cell apoptosis. Endocrinology. 158:2503–2521.
2017. View Article : Google Scholar : PubMed/NCBI
|
|
47
|
Nawaz MI, Van Raemdonck K, Mohammad G,
Kangave D, Van Damme J, Abu El-Asrar AM and Struyf S: Autocrine
CCL2, CXCL4, CXCL9 and CXCL10 signal in retinal endothelial cells
and are enhanced in diabetic retinopathy. Exp Eye Res. 109:67–76.
2013. View Article : Google Scholar : PubMed/NCBI
|
|
48
|
Liu ZH, Chen LL, Deng XL, Song HJ, Liao
YF, Zeng TS, Zheng J and Li HQ: Methylation status of CpG sites in
the MCP-1 promoter is correlated to serum MCP-1 in Type 2 diabetes.
J Endocrinol Invest. 35:585–589. 2012.PubMed/NCBI
|
|
49
|
Ninomiya H, Katakami N, Osonoi T, Saitou
M, Yamamoto Y, Takahara M, Kawamori D, Matsuoka TA, Yamasaki Y and
Shimomura I: Association between new onset diabetic retinopathy and
monocyte chemoattractant protein-1 (MCP-1) polymorphism in Japanese
type 2 diabetes. Diabetes Res Clin Pract. 108:e35–e37. 2015.
View Article : Google Scholar : PubMed/NCBI
|
|
50
|
Mina-Osorio P: The moonlighting enzyme
CD13: Old and new functions to target. Trends Mol Med. 14:361–371.
2008. View Article : Google Scholar : PubMed/NCBI
|
|
51
|
Pedersen HK, Gudmundsdottir V and Brunak
S: Pancreatic islet protein complexes and their dysregulation in
type 2 diabetes. Front Genet. 8:432017. View Article : Google Scholar : PubMed/NCBI
|
|
52
|
Locke JM, Hysenaj G, Wood AR, Weedon MN
and Harries LW: Targeted allelic expression profiling in human
islets identifies cis-regulatory effects for multiple variants
identified by type 2 diabetes genome-wide association studies.
Diabetes. 64:1484–1491. 2015. View Article : Google Scholar : PubMed/NCBI
|