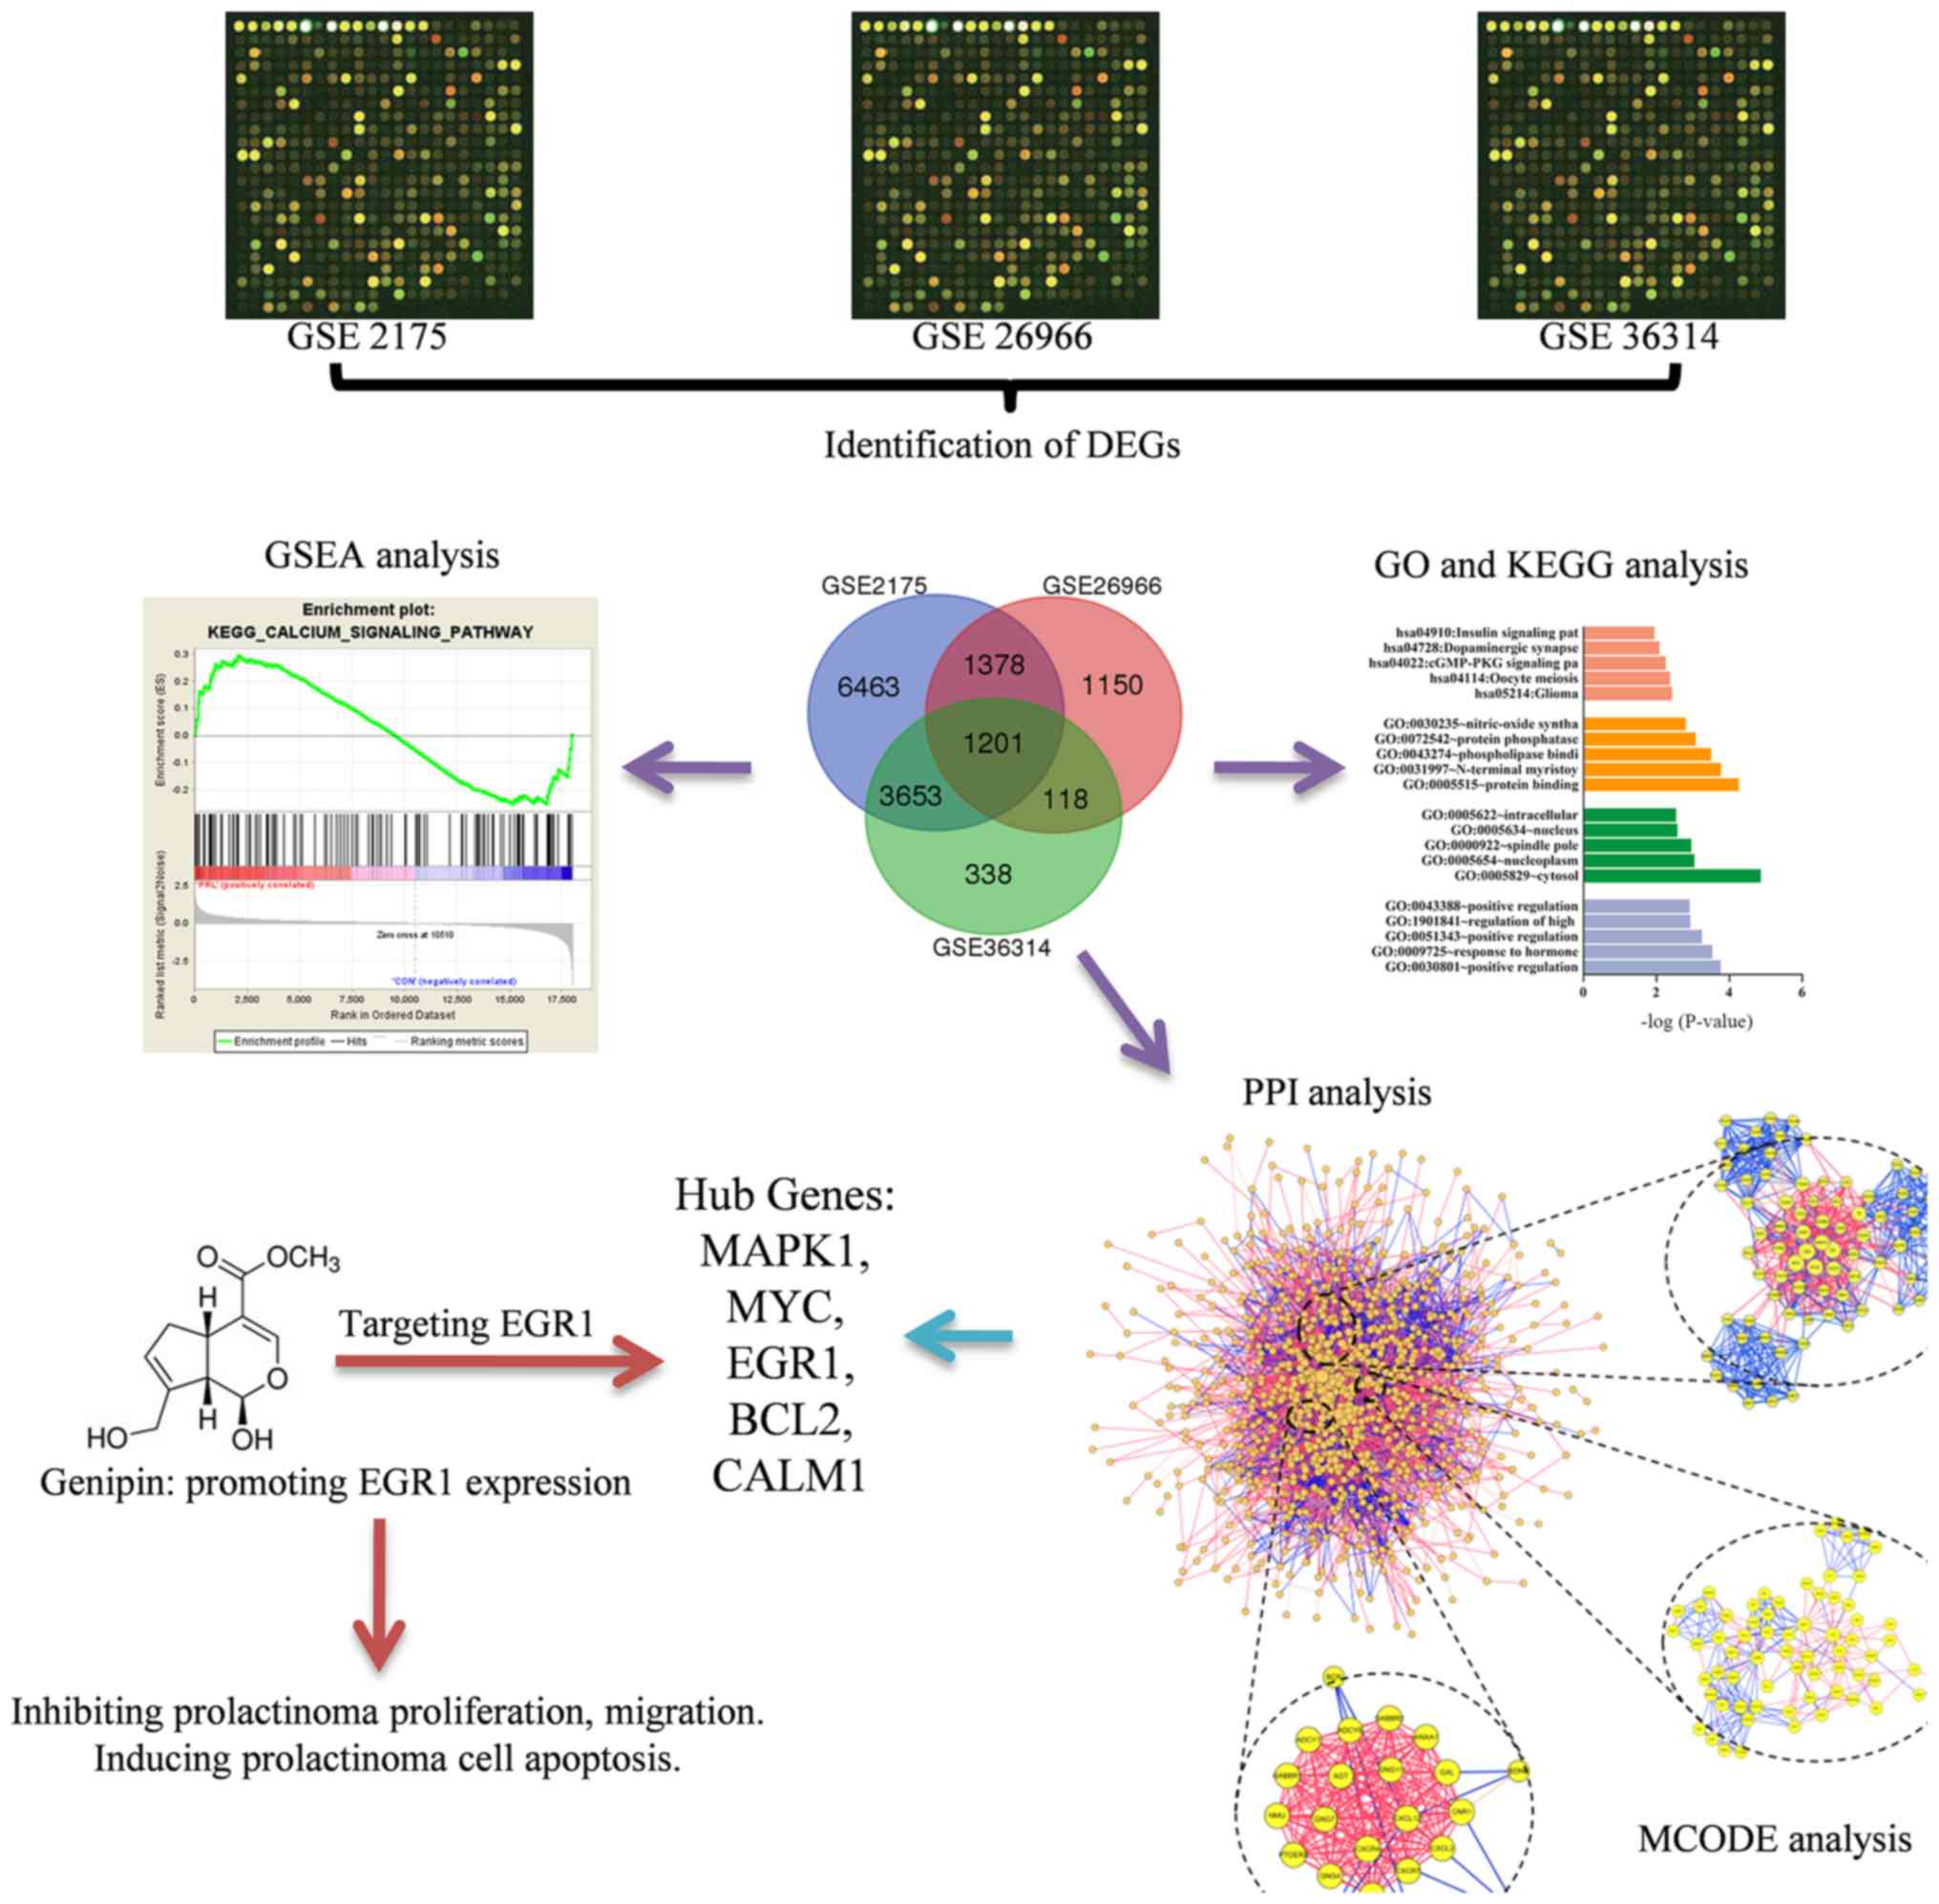
Introduction
Prolactinoma is one of the most common central
nervous system tumors, which is derived from the hormone secreting
epithelial cells in the anterior of the pituitary gland (1). According to the 2016 World Health
Organization classification of tumors, prolactinomas are grade I/II
(2), which are considered to be
benign tumors. In addition, prolactinoma is one of the functional
pituitary tumors, which are classified into adrenocorticotropic
hormone-secreting pituitary adenoma, growth hormone-secreting
pituitary adenoma and prolactinoma (3).
Recently, imaging has become important in the
diagnosis of prolactinoma. As the most important tool for imaging
diagnosis of prolactinoma, MRI can clearly display the size, shape
and position of prolactinoma, as well as its interaction with
surrounding structures. Medicinal therapy has become the first
choice treatment for prolactinoma, with surgery coming second and
other treatments, such as gene therapy, molecular therapeutics,
chemotherapeutics, radiotherapy and physiotherapy, used as
adjunctive therapy. The dopamine agonists (DAs) are the best
medicinal treatment of prolactinoma and can reduce the secretion of
prolactin: 70–90% of patients with microadenomas have normalized
prolactin levels after DAs treatment, with menstruation resuming,
lactation ceasing, fertility restored and shrinkage of the tumor
(4). However, its side effects and
adverse reactions cannot be ignored: ≤4% of properly regulated
patients with prolactinoma can develop acromegaly according to a
previous study (5). A recent study
noted that cabergoline, one type of DA, increases the risk of
valvular heart disease. In addition, there are also some studies
indicating that cabergoline is associated with pituitary apoplexy
after initiation of cabergoline therapy (6,7).
Selective resection of prolactinoma is another common treatment
method that results in the symptoms relief after surgery in the
majority of patients. Although prolactinomas can be removed by a
frontal or a butterfly pathway, it is often difficult to completely
excise and postoperative serum prolactin levels are difficult to
recover. A previous study reported that 40–80% surgeries will
result in temporary improvement and half of them will relapse
(8). Thus, a novel treatment
strategy with improved efficacy or fewer side effects is
needed.
Recently, research has focused increasingly on the
initiation, progression and metastasis of prolactinoma using
bioinformatics methods and microarray technology, aiming to reveal
the genetic alteration and molecular mechanisms in prolactinoma
(9–11). For instance, Zhang et al
(12) showed that upregulated
solute carrier family 2, facilitated glucose transporter member 11
and chromogranin B (CHGB) may be important in prolactinoma
progression. Faraoni et al (13) also suggested that the transforming
growth factor β1 system may be involved in prolactinoma
progression. However, the number of studies on the explicit
molecular mechanisms is small, and there is a limited and shallow
understanding of prolactinoma. Therefore, further study of the
molecular mechanisms of prolactinoma is urged, particularly the
identification of differentially expressed genes (DEGs) and key
pathways. In the present study, early growth response 1 (EGR1) was
found to have a significant role in the occurrence and progression
of prolactinoma by complete bioinformatics analysis, while genipin
was reported as an effective targeted drug for EGR1 as it could
upregulate the expression level of EGR1 and p21 (downstream
mediator of EGR1), and was applied to inhibit gastric cancer in a
previous report (14). Therefore,
it is hypothesized that genipin may also be able to treat
prolactinoma by targeting EGR1.
Bioinformatics is a technology that comprehensively
applies biology, computer science and information technology to
analyze numerous complex biological data. Bioinformatics combined
with microarray has been broadly used to identify genetic
alterations during tumorigenesis (15). In the present study, three mRNA
microarray datasets were selected to identify DEGs between
prolactinoma tissues and normal pituitary tissues. Gene ontology
(GO) and Kyoto Encyclopedia of Genes and Genomes (KEGG) analysis
were subsequently conducted. Then, a Cell Counting Kit 8 (CCK8)
assay, colony-forming assay, scratch assay and flow cytometry were
performed to verify the anti-prolactinoma effect of genipin. In
brief, the present study aimed to provide data to determine the
occurrence and progression mechanism of the prolactinoma and
identify precise, promising targets for the treatment of patients
with prolactinoma as well as validation of the anti-prolactinoma
effect of genipin. The framework of the present study is outlined
in Fig. 1.
Materials and methods
Microarray data
Three human gene expression profiles (GSE2175,
GSE26966 and GSE36314) (16–18)
were obtained from the Gene Expression Omnibus (GEO; ncbi.nlm.nih.gov/geo/) database in September 2017.
GSE2175 contained one normal pituitary sample and one prolactinoma
sample. GSE26966 consisted of nine normal pituitary samples and 14
human prolactinoma samples. GSE36314 included three normal
pituitary samples and four prolactinoma samples.
Identification of DEGs
The analysis of three files was performed in
September 2017, using the GeneSpring GX software (version 11.5;
Agilent Technologies, Inc.), which provides powerful, accessible
tools for intuitive data analysis and visualization, and this
software has been extensively applied in bioinformatics analysis
(19). Through the analysis of the
three sequences, the DEGs between prolactinoma samples and normal
samples were identified. Hierarchical clustering analysis and
principal component analysis were applied to determine the probe
quality control in GeneSpring. Probes with intensity values below
the 20th percentile were filtered out using the ‘filter probesets
by expression’ option. Classical t-test was used to identify DEGs,
with a two-fold cutoff and P<0.01 applied to determine
statistical significance, the samples size was increased to reduce
false positives and false negatives. Then, a Venn plot was created
using DEGs of the three datasets
(bioinformatics.psb.ugent.be/webtools/Venn; version 2.1).
GO and pathway enrichment analysis of
DEGs
The Database for Annotation, Visualization and
Integrated Discovery (DAVID, version 6.8) is an online program that
provides a comprehensive set of functional annotation tools for
researchers to understand biological meaning behind plenty of genes
(20). GO analysis is a method
that analyzes gene function, cell component and biological process.
KEGG is a base for gene function analysis and genomic information
link. The two were conducted online based on DAVID, and the
annotation tool applied. Gene Set Enrichment Analysis (GSEA;
broadinstitute.org/gsea/index.jsp) was performed (also
in September, 2017) to determine which sets of genes exhibited
statistical significance.
Protein-protein interaction (PPI)
network construction and module selection
A PPI network of DEGs was constructed through the
Search Tool for the Retrieval of Interacting Genes (STRING)
database. In the present study, Molecular Complex Detection was
performed based on Cytoscape (version 3.4.0) software to reveal
modules of the PPI network (21).
GO and KEGG pathway enrichment analysis were performed for genes in
the modules. The Molecular Complex Detection (MCODE) application
was applied to screen modules of PPI network in Cytoscape with
degree cutoff=2, node score cutoff=0.2.
Cell lines
A rat pituitary tumor cell line (GH3) was obtained
from the American Type Culture Collection and mouse pituitary tumor
cell line (GT1-1) from BeNa Culture Collection. The cell lines were
cultured in DMEM (HyClone; GE Healthcare Life Sciences)
supplemented with 10% FBS (Gibco; Thermo Fisher Scientific, Inc.).
An atmosphere of 5% CO2 and 95% air at 37°C was
maintained for the cultivation of the cell lines. Genipin was
purchased from Apexbio, Inc.
CCK8 assay
A total of 2,000 cells were seeded in 96-well plates
and cultured in DMEM including 10% FBS for 6 days. Then, 10 µl
CCK-8 was added into each well and the plate was incubated at 37°C
for 2 h. The viability of cells was determined at 24 h. The cell
viability was determined by measuring absorbance at 450 nm on an
ELX800 UV universal microplate reader (BioTek Instruments Inc.).
The experiments were repeated three times.
Colony-forming assay
The prolactinoma cells were cultured in Petri dishes
with the density of 50 cells/cm2. They were cultivated
for 24 h in vitro and then treated with different doses of
genipin (0, 0.5 and 2.0 µmol/l). Colonies were counted and
described according to Franken et al after 10 days in
vitro growth (22). Then,
colonies were rinsed with PBS, fixed in 4% paraformaldehyde at 4°C
for 30 min, stained with 5% crystal violet for 10 min at room
temperature and rinsed twice with water. This experiment was
repeated three times.
In vitro scratch assay
The GT1-1 cells were cultured to confluence on
24-well Permanox plates. A 10 µl pipette tip across each well was
used to create a consistent cell-free area which the loose cells
were washed out gently using DMEM. Afterwards, the cells were
exposed to different doses of genipin (0, 0.5 and 2.0 µmol/l).
After the scratch and at 12, 24 h, images of the scraped area were
captured using phase contrast microscopy. The remaining wounded
area and the scratch width at six different points per image were
measured. This experiment was repeated three times.
Flow cytometry
Prolactinoma cells in the log growth phase were
seeded into 6-well plates with a density of 2×10⁵
cells/well and the cells were treated with different doses of
genipin (0, 0.5 and 2.0 µmol/l). Following culture for 48 h, the
cells were harvested using accutase detachment solution
(Sigma-Aldrich; Merck KGaA) and Annexin-V-FITC/propidium labeling
was conducted using Annexin-V-FITC/PI apoptosis detection kit (KGI
Biotechnology. Ltd.) according to the manufacturer's protocol. The
flow cytometer was used to detect the stained cells and the results
analyzed with the FACSDiva version 6.2 (BD Biosciences). This
experiment was repeated three times.
Statistical analysis
All statistical data were entered into SPSS version
18.0 (SPSS Inc.) for analysis. One-way analysis of variance was
performed to analyze quantitative data and Tamhane's T2 was used to
conduct post hoc testing. Data are presented as mean ± standard
deviation. P<0.05 was considered to indicate a statistically
significant difference.
Results
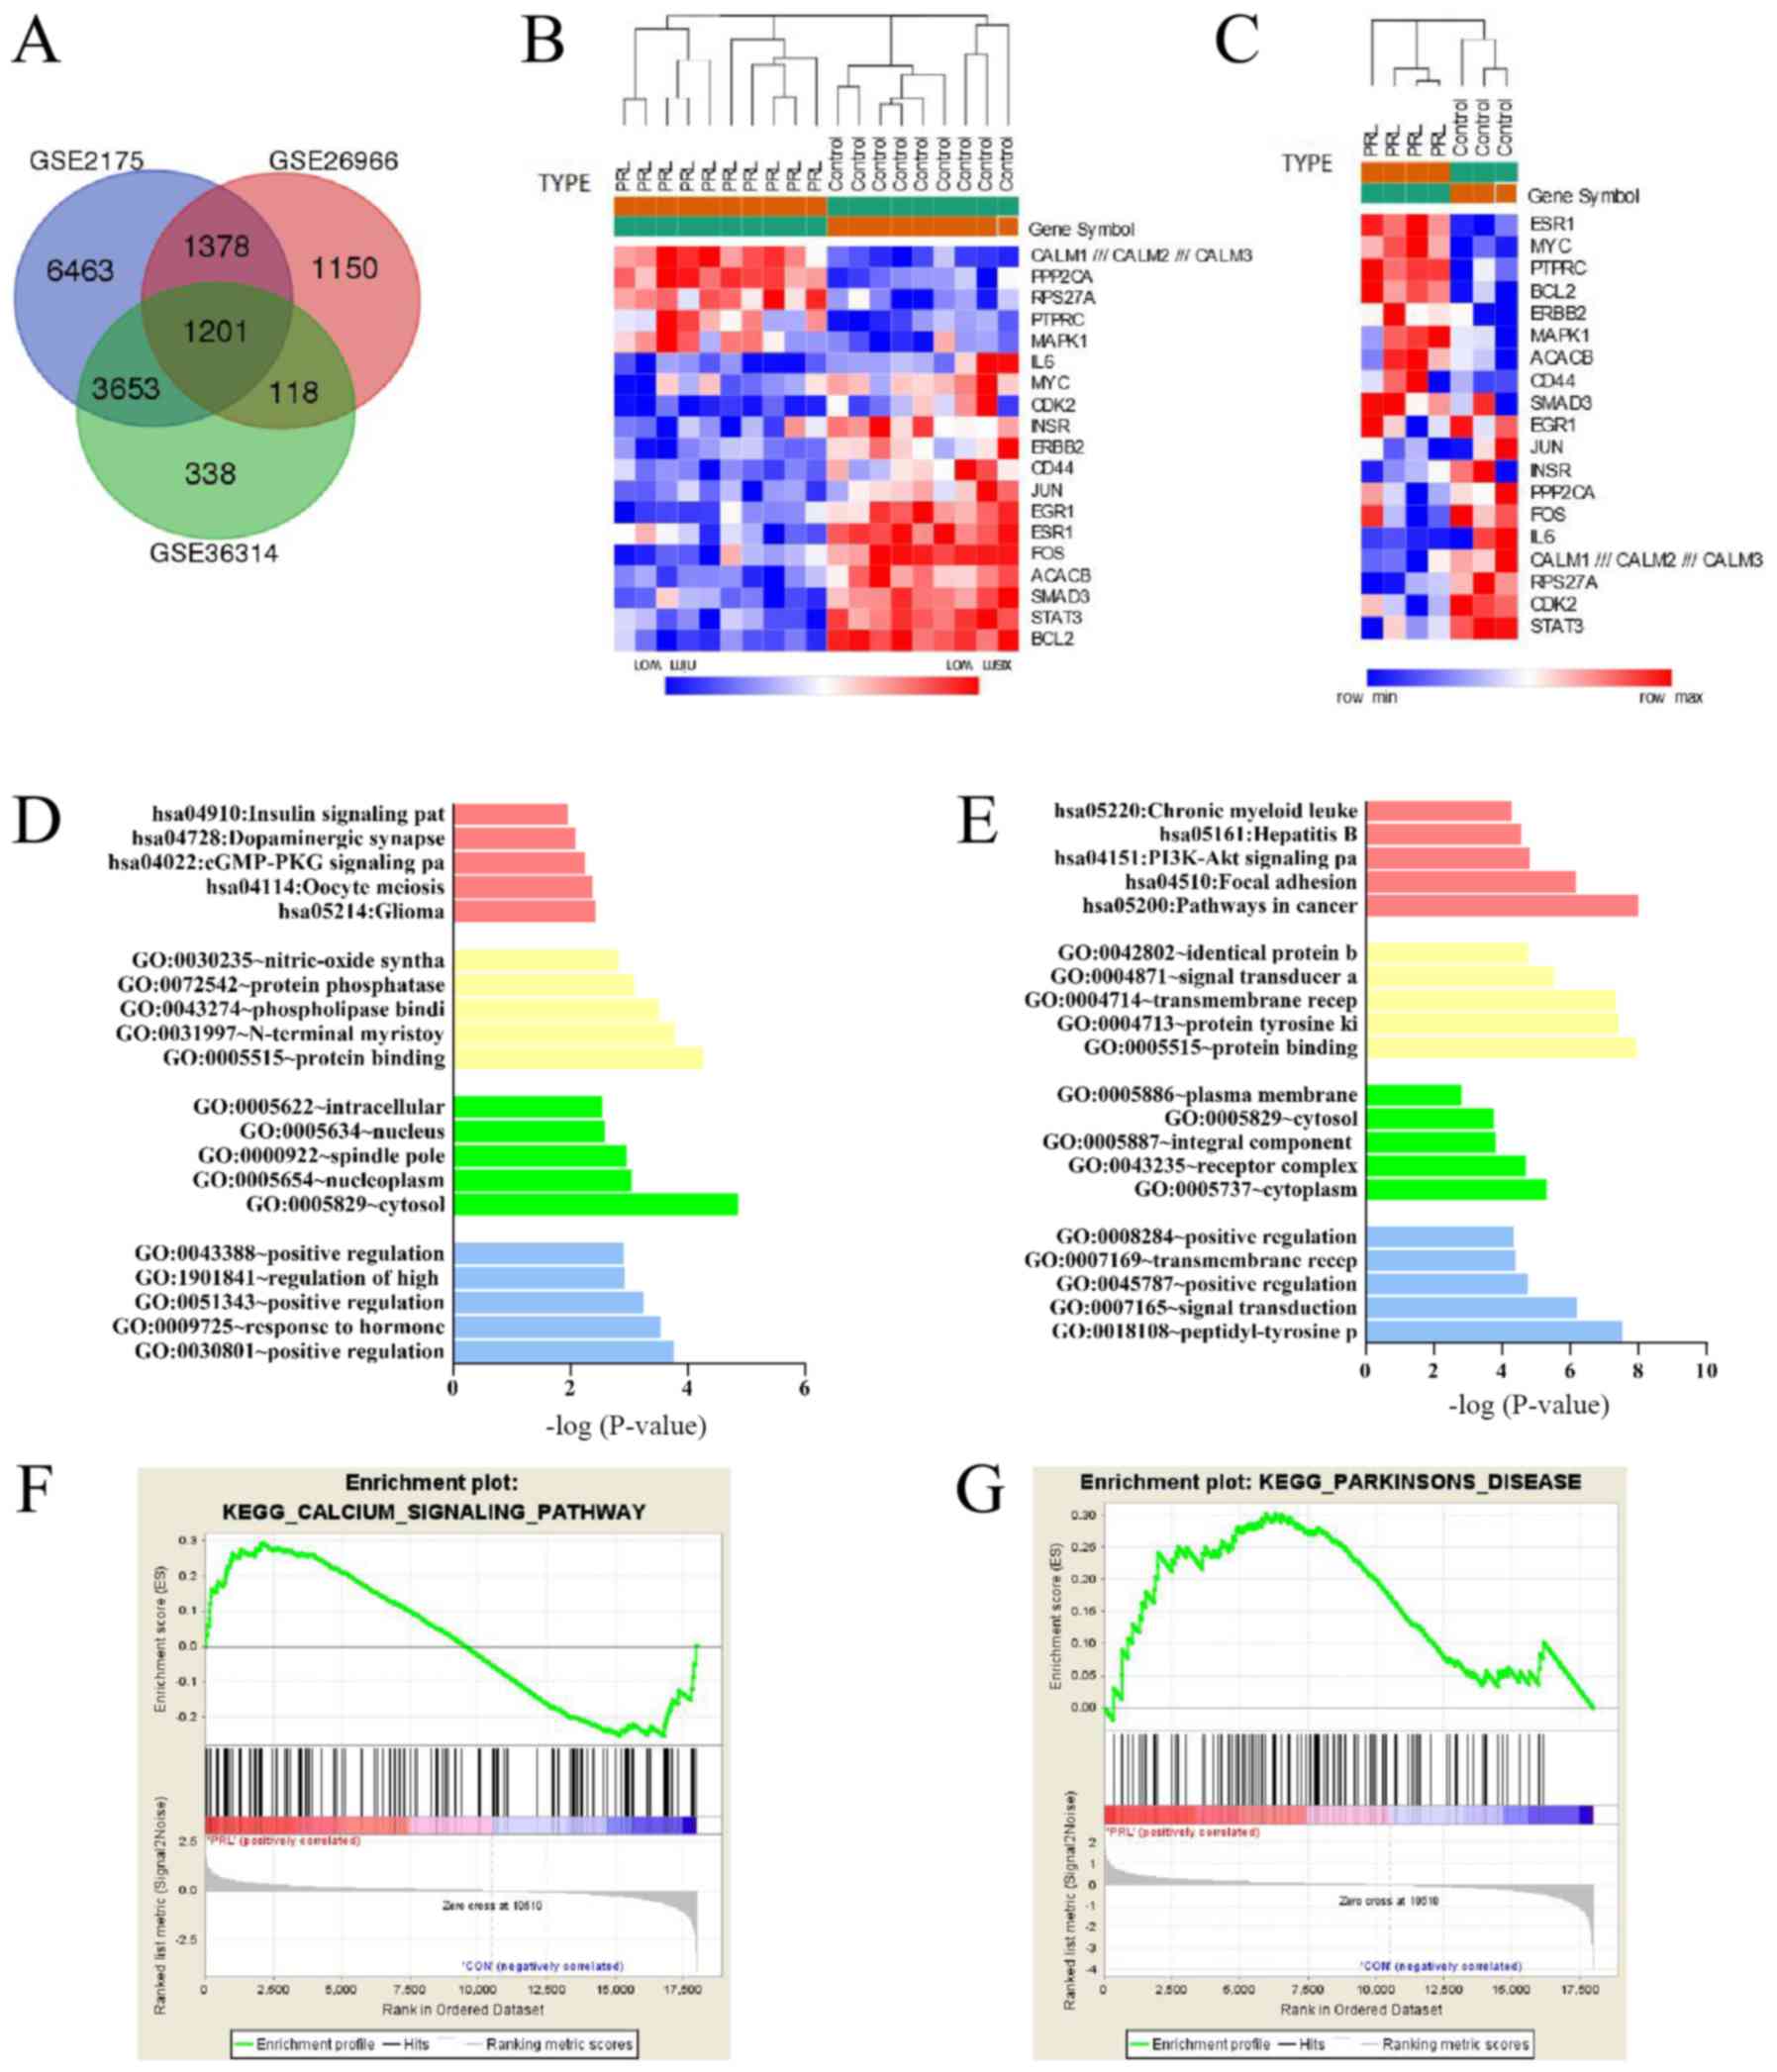
Identification of DEGs
An aggregate of 12,695 DEGs were identified from
GSE2175, of which 8,314 were upregulated and 4,381 were
downregulated. A total of 3,847 DEGs were identified in GSE26966,
among which 1,766 were upregulated and 2,081 were downregulated. A
total of 5,310 DEGs were picked up from GSE36314, which 2,246 genes
were upregulated and 3,064 genes were downregulated. Venn plot
demonstrated that there were 1,201 common DEGs among the three
datasets (Fig. 2A and Table I). Among them, 570 mutual
upregulated genes and 631 mutual downregulated genes were
identified. Heat maps of the DEGs in GSE26966 and GSE36314 that
perform the most important role are presented in Fig. 2B and C.
 | Table I.Venn plot analysis results of DEGs
among the three datasets. |
Table I.
Venn plot analysis results of DEGs
among the three datasets.
| Name | Total DEGs | Elements |
|---|
| GSE2175, GSE26966
and GSE36314 | 1,201 | CREB3L1, SMARCD3,
RALYL, BBOX1, CXCR4… |
| GSE2175 and
GSE26966 | 1,378 | MSRB1, ELMO2,
PKNOX2, CLK4, IRAK1… |
| GSE2175 and
GSE36314 | 3,653 | MMP2, SAMD4A,
GPR98, KCNG1, DECR1… |
| GSE26966 and
GSE36314 | 118 | TMSB10, KCNA6,
NEFH, ID1, CGA… |
| GSE2175 | 6,463 | AACS, RPS11, PNMA1,
HAUS2, A4GNT… |
| GSE26966 | 1,150 | CLMP, CD99P1,
LOC100287896, TMC4, LINC01279… |
| GSE36314 | 338 | RPS18, ZG16,
SERPINF1, NUDT1, LOC101930303 /// TRIM16 /// TRIM16L |
Functional and pathway enrichment
analysis
To further investigate the function of identified
DEGs, the mutual downregulated and upregulated DEGs were entered
into DAVID for GO and KEGG pathways analysis. The GO analysis and
KEGG analysis of DEGs are presented in Table II. For biological process,
upregulated DEGs were significantly enriched in ‘positive
regulation cyclic nucleotide metabolic process’, ‘response to
hormone’ and ‘positive regulation of cyclic-nucleotide
phosphodiesterase activity’ terms, while downregulated DEGs were
enriched in ‘peptidyl-tyrosine phosphorylation’, ‘signal
transduction’ and ‘positive regulation of cell cycle’. For cell
component, the upregulated genes were mainly enriched in the
‘associated cytosol’, ‘nucleoplasm’ and ‘spindle pole’, and the
downregulated DEGs enriched in ‘cytoplasm’, ‘receptor complex’ and
‘integral component of plasma membrane’ terms. For molecular
function, the upregulated DEGs enriched in ‘protein binding’,
‘N-terminal myristoylation domain binding’ and ‘phospholipase
binding’ terms; the downregulated DEGs tended to enrich in ‘protein
binding’, ‘protein tyrosine kinase activity’ and ‘transmembrane
receptor protein tyrosine kinase activity’ terms. Table II also presents the most
significant enriched pathways of the mutual upregulated DEGs and
downregulated DEGs according to KEGG analysis. The upregulated DEGs
were enriched in the terms ‘glioma’, ‘oocyte meiosis’ and ‘cGMP-PKG
signaling pathway’, while the downregulated DEGs were mostly
involved in pathways including ‘cancer’, ‘focal adhesion’ and
‘PI3K-Akt signaling pathway’ (Fig. 2D
and E). In addition, the results of GSEA analysis indicated
that the expression profiles of prolactinomas were mainly enriched
in ‘calcium signaling pathway’ and ‘Parkinson's disease’ (Fig. 2F and G).
| Table II.Functional and pathway enrichment
analysis of upregulated and downregulated genes among three
datasets (the primitive data downloaded from Gene Expression
Omnibus database). |
Table II.
Functional and pathway enrichment
analysis of upregulated and downregulated genes among three
datasets (the primitive data downloaded from Gene Expression
Omnibus database).
| A, Upregulated |
|---|
|
|---|
| Category | Term | Count | % | P-value |
|---|
|
GOTERM_BP_DIRECT | GO:0030801 positive
regulation of cyclic nucleotide metabolic process | 3 | 0.012881618 |
1.72×10⁻⁴ |
|
GOTERM_BP_DIRECT | GO:0009725 response
to hormone | 5 | 0.021469363 |
2.81×10⁻⁴ |
|
GOTERM_BP_DIRECT | GO:0051343 positive
regulation of cyclic-nucleotide phosphodiesterase activity | 3 | 0.012881618 |
5.68×10⁻⁴ |
|
GOTERM_BP_DIRECT | GO:1901841
regulation of high voltage-gated calcium channel activity | 3 | 0.012881618 |
1.18×10⁻³ |
|
GOTERM_BP_DIRECT | GO:0043388 positive
regulation of DNA binding | 4 | 0.017175491 |
1.23×10⁻³ |
|
GOTERM_CC_DIRECT | GO:0005829
cytosol | 45 | 0.193224269 |
1.38×10⁻⁵ |
|
GOTERM_CC_DIRECT | GO:0005654
nucleoplasm | 35 | 0.150285543 |
8.99×10⁻⁴ |
|
GOTERM_CC_DIRECT | GO:0000922 spindle
pole | 6 | 0.025763236 |
1.10×10⁻³ |
|
GOTERM_CC_DIRECT | GO:0005634
nucleus | 55 | 0.236162995 |
2.63×10⁻³ |
|
GOTERM_CC_DIRECT | GO:0005622
intracellular | 20 | 0.085877453 |
2.86×10⁻³ |
|
GOTERM_MF_DIRECT | GO:0005515 protein
binding | 89 | 0.382154665 |
5.46×10⁻⁵ |
|
GOTERM_MF_DIRECT | GO:0031997
N-terminal myristoylation domain binding | 3 | 0.012881618 |
1.68×10⁻⁴ |
|
GOTERM_MF_DIRECT | GO:0043274
phospholipase binding | 4 | 0.017175491 |
3.12×10⁻⁴ |
|
GOTERM_MF_DIRECT | GO:0072542 protein
phosphatase activator activity | 3 | 0.012881618 |
8.26×10⁻⁴ |
|
GOTERM_MF_DIRECT | GO:0030235
nitric-oxide synthase regulator activity | 3 | 0.012881618 |
1.53×10⁻³ |
| KEGG_PATHWAY | hsa05214:
Glioma | 5 | 0.021469363 |
3.70×10⁻³ |
| KEGG_PATHWAY | hsa04114: Oocyte
meiosis | 6 | 0.025763236 |
4.22×10⁻³ |
| KEGG_PATHWAY | hsa04022: cGMP-PKG
signaling pathway | 7 | 0.030057109 |
5.62×10⁻³ |
| KEGG_PATHWAY | hsa04728:
Dopaminergic synapse | 6 | 0.025763236 |
8.28×10⁻³ |
| KEGG_PATHWAY | hsa04910: Insulin
signaling pathway | 6 | 0.025763236 |
1.23×10⁻² |
|
| B,
Downregulated |
|
|
GOTERM_BP_DIRECT | GO:0018108
peptidyl-tyrosine phosphorylation | 13 | 0.050286245 |
2.95×10⁻⁸ |
|
GOTERM_BP_DIRECT | GO:0007165 signal
transduction | 31 | 0.119913353 |
6.22×10⁻⁷ |
|
GOTERM_BP_DIRECT | GO:0045787 positive
regulation of cell cycle | 6 | 0.023209036 |
1.74×10⁻⁵ |
|
GOTERM_BP_DIRECT | GO:0007169
transmembrane receptor protein tyrosine kinase signaling
pathway | 8 | 0.030945381 |
3.96×10⁻⁵ |
|
GOTERM_BP_DIRECT | GO:0008284 positive
regulation of cell proliferation | 16 | 0.061890763 |
4.64×10⁻⁵ |
|
GOTERM_CC_DIRECT | GO:0005737
cytoplasm | 75 | 0.290112951 |
4.95×10⁻⁶ |
|
GOTERM_CC_DIRECT | GO:0043235 receptor
complex | 9 | 0.034813554 |
1.96×10⁻⁵ |
|
GOTERM_CC_DIRECT | GO:0005887 integral
component of plasma membrane | 28 | 0.108308835 |
1.56×10⁻⁴ |
|
GOTERM_CC_DIRECT | GO:0005829
cytosol | 50 | 0.193408634 |
1.74×10⁻⁴ |
|
GOTERM_CC_DIRECT | GO:0005886 plasma
membrane | 55 | 0.212749497 |
1.53×10⁻³ |
|
GOTERM_MF_DIRECT | GO:0005515 protein
binding | 116 | 0.44870803 |
1.13×10⁻⁸ |
|
GOTERM_MF_DIRECT | GO:0004713~protein
tyrosine kinase activity | 12 | 0.046418072 |
3.50×10⁻⁸ |
|
GOTERM_MF_DIRECT | GO:0004714
transmembrane receptor protein tyrosine kinase activity | 8 | 0.030945381 |
4.77×10⁻⁸ |
|
GOTERM_MF_DIRECT | GO:0004871 signal
transducer activity | 12 | 0.046418072 |
2.91×10⁻⁶ |
|
GOTERM_MF_DIRECT | GO:0042802
identical protein binding | 21 | 0.081231626 |
1.76×10⁻⁵ |
| KEGG_PATHWAY | hsa05200: Pathways
in cancer | 23 | 0.088967972 |
9.94×10⁻⁹ |
| KEGG_PATHWAY | hsa04510: Focal
adhesion | 15 | 0.05802259 |
6.84×10⁻⁷ |
| KEGG_PATHWAY | hsa04151: PI3K-Akt
signaling pathway | 17 | 0.065758935 |
1.57×10⁻⁵ |
| KEGG_PATHWAY | hsa05161: Hepatitis
B | 11 | 0.042549899 |
2.67×10⁻⁵ |
| KEGG_PATHWAY | hsa05220: Chronic
myeloid leukemia | 8 | 0.030945381 |
5.28×10⁻⁵ |
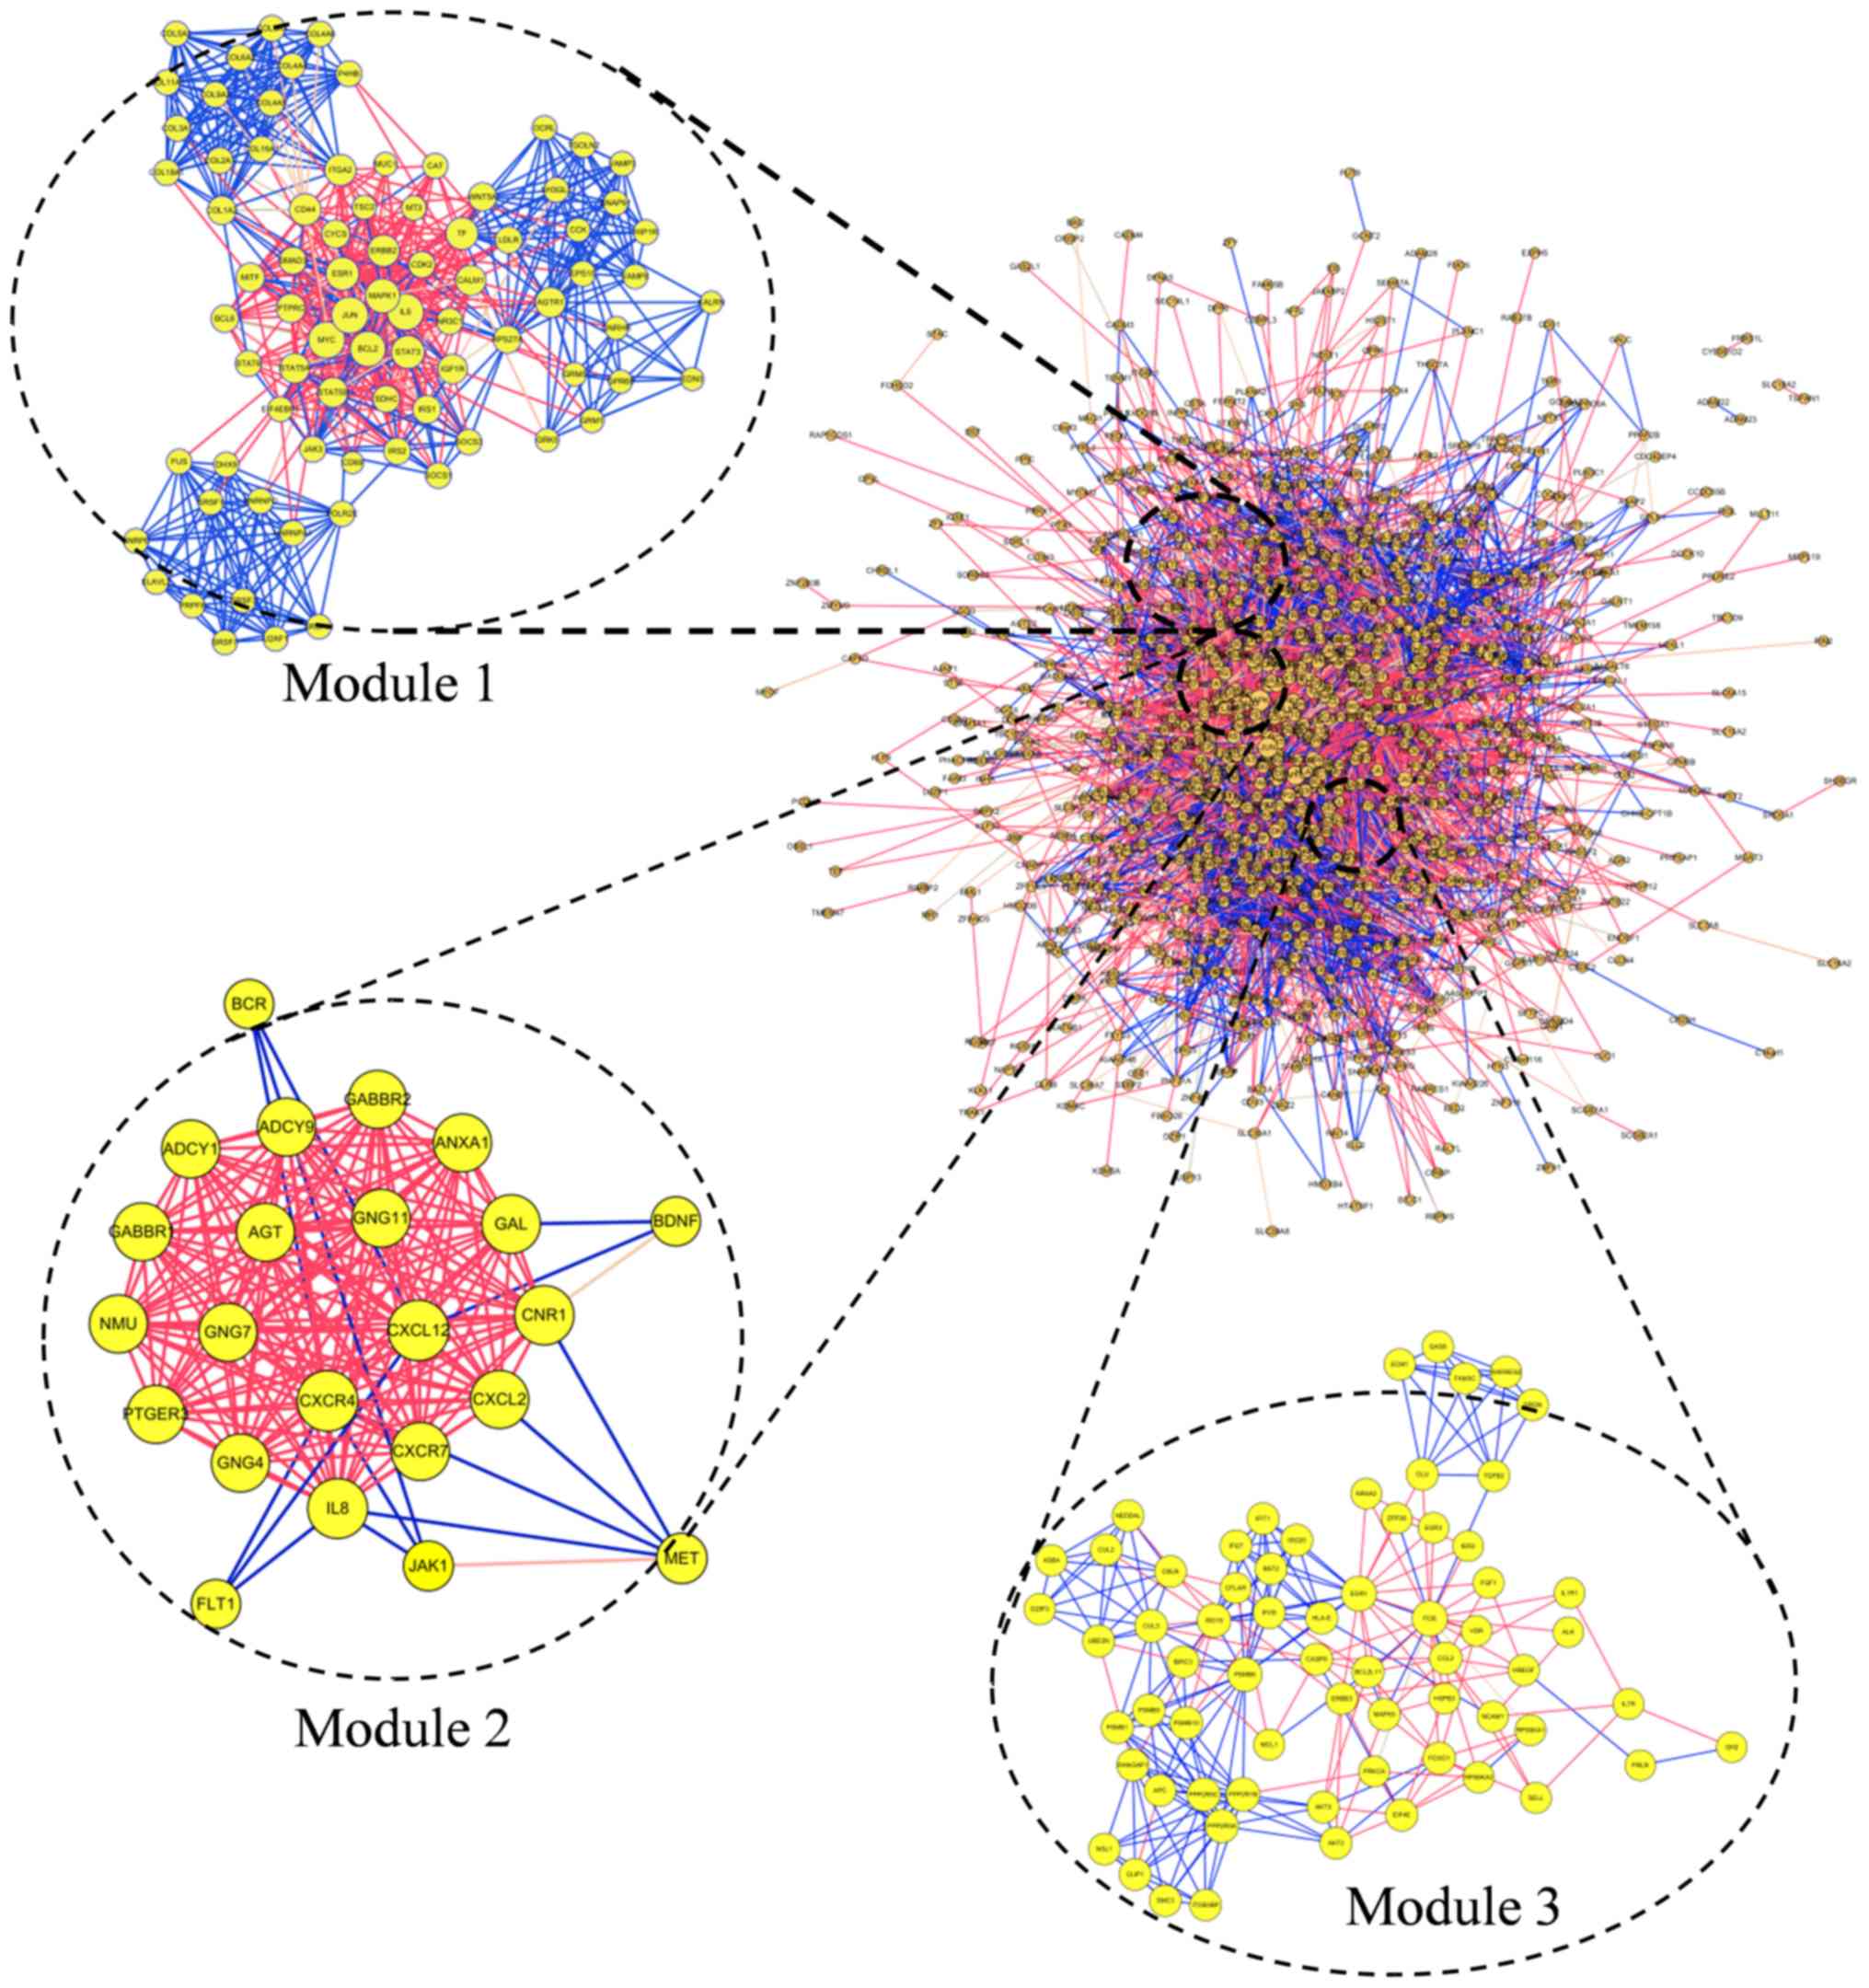
Module screening from the PPI
network
The PPI network of DEGs consisted of 1,142 nodes and
7,278 edges. Degrees >72 were set as the cut-off criterion. A
total of 20 genes were selected as hub genes: MAPK1, JUN, MYC, FOS,
EGR1, Bcl2, IL6, CALM1, IL8, STAT3, ESR1, RPS27A, ACACB, CD44,
INSR, ERBB2, PPP2CA, CDK2, PTPRC and SMAD3 (Table III). Among those genes, the node
degree of Mitogen-activated protein kinase 1 (MAPK1) was the
highest, at 183. The top three significant modules were selected
(Fig. 3). Functional annotation of
the modules genes is shown in Table
IV. The genes of module 1 were associated with cellular
structure, including ‘endoplasmic reticulum lumen’, ‘extracellular
matrix organization’ and ‘collagen trimer’. Genes of module 2 were
associated with ‘cancer’, ‘GABAergic synapse’ and ‘morphine
addiction’. Genes of module 3 associated with ‘type I interferon
signaling pathway’, ‘nucleoplasm’ and ‘PI3K-Akt signaling
pathway’.
| Table III.Hub genes among the three
datasets. |
Table III.
Hub genes among the three
datasets.
| Gene symbol | Degree | Betweenness |
|---|
| MAPK1 | 183 | 0.08796778 |
| JUN | 163 | 0.05703413 |
| MYC | 147 | 0.06479138 |
| FOS | 123 | 0.02616212 |
| EGR1 | 120 | 0.0140681 |
| Bcl2 | 119 | 0.0274578 |
| IL6 | 117 | 0.04994624 |
| CALM1 | 116 | 0.06850938 |
| IL8 | 110 | 0.02885198 |
| STAT3 | 108 | 0.02679268 |
| ESR1 | 103 | 0.03289612 |
| RPS27A | 94 | 0.04228441 |
| ACACB | 89 | 0.04358763 |
| CD44 | 88 | 0.02006192 |
| INSR | 84 | 0.01708239 |
| ERBB2 | 81 | 0.01628601 |
| PPP2CA | 77 | 0.02323539 |
| CDK2 | 73 | 0.02347513 |
| PTPRC | 73 | 0.01304584 |
| SMAD3 | 72 | 0.02005951 |
| Table IV.Functional and pathway enrichment
analysis of the modules genes. |
Table IV.
Functional and pathway enrichment
analysis of the modules genes.
| A, Module 1 |
|---|
|
|---|
| Term | Count | P-value | False discovery
rate | Genes |
|---|
| GO:0005788
endoplasmic reticulum lumen (CC) | 8 |
4.18×10⁻⁷ |
4.93×10⁻⁴ | P4HB, COL9A2,
COL2A1, COL16A1, COL11A1, COL5A2, COL4A6, COL4A5 |
| GO:0030198
extracellular matrix organization (BP) | 8 |
8.27×10⁻⁷ |
1.23×10⁻³ | COL9A2, CD44,
COL2A1, COL16A1, COL11A1, COL5A2, COL4A6, COL4A5 |
| GO:0005581 collagen
trimer (CC) | 6 |
3.06×10⁻⁶ |
3.61×10⁻³ | COL9A2, COL2A1,
COL11A1, COL5A2, COL4A6, COL4A5 |
|
| B, Module
2 |
|
| hsa05200: Pathways
in cancer (KEGG) | 11 |
4.30×10⁻⁹ |
4.68×10⁻⁶ | ADCY1, PTGER3, BCR,
ADCY9, CXCR4, MET, JAK1, GNG11, GNG4, CXCL12, GNG7 |
| hsa04727: GABAergic
synapse (KEGG) | 7 |
3.22×10⁻⁸ |
3.50×10⁻⁵ | ADCY1, ADCY9,
GABBR1, GNG11, GABBR2, GNG4, GNG7 |
| hsa05032: Morphine
addiction (KEGG) | 7 |
4.87×10⁻⁸ |
5.29×10⁻⁵ | ADCY1, ADCY9,
GABBR1, GNG11, GABBR2, GNG4, GNG7 |
|
| C, Module
3 |
|
| GO:0060337 type I
interferon signaling pathway (BP) | 7 |
4.29×10⁻⁹ |
5.96×10⁻⁶ | EGR1, IFI27, IFIT1,
ISG15, BST2, PSMB8, ISG20 |
| GO:0005654
nucleoplasm (CC) | 18 |
5.93×10⁻⁶ |
6.46×10⁻³ | PRKCA, ITGB3BP,
IER2, EGR1, PPP2R5C, FOXO1, SMC3, PSMB8, PSMB9, ISG20, CUL2,
RPS6KA1, ISG15, CASP8, MAPK9, FGF1, AKT3, AKT2 |
| hsa04151: PI3K-Akt
signaling pathway (KEGG) | 9 |
9.02×10⁻⁶ |
1.05×10⁻² | GH2, PRKCA, PRLR,
PPP2R5A, PPP2R5C, FGF1, IL7R, AKT3, AKT2 |
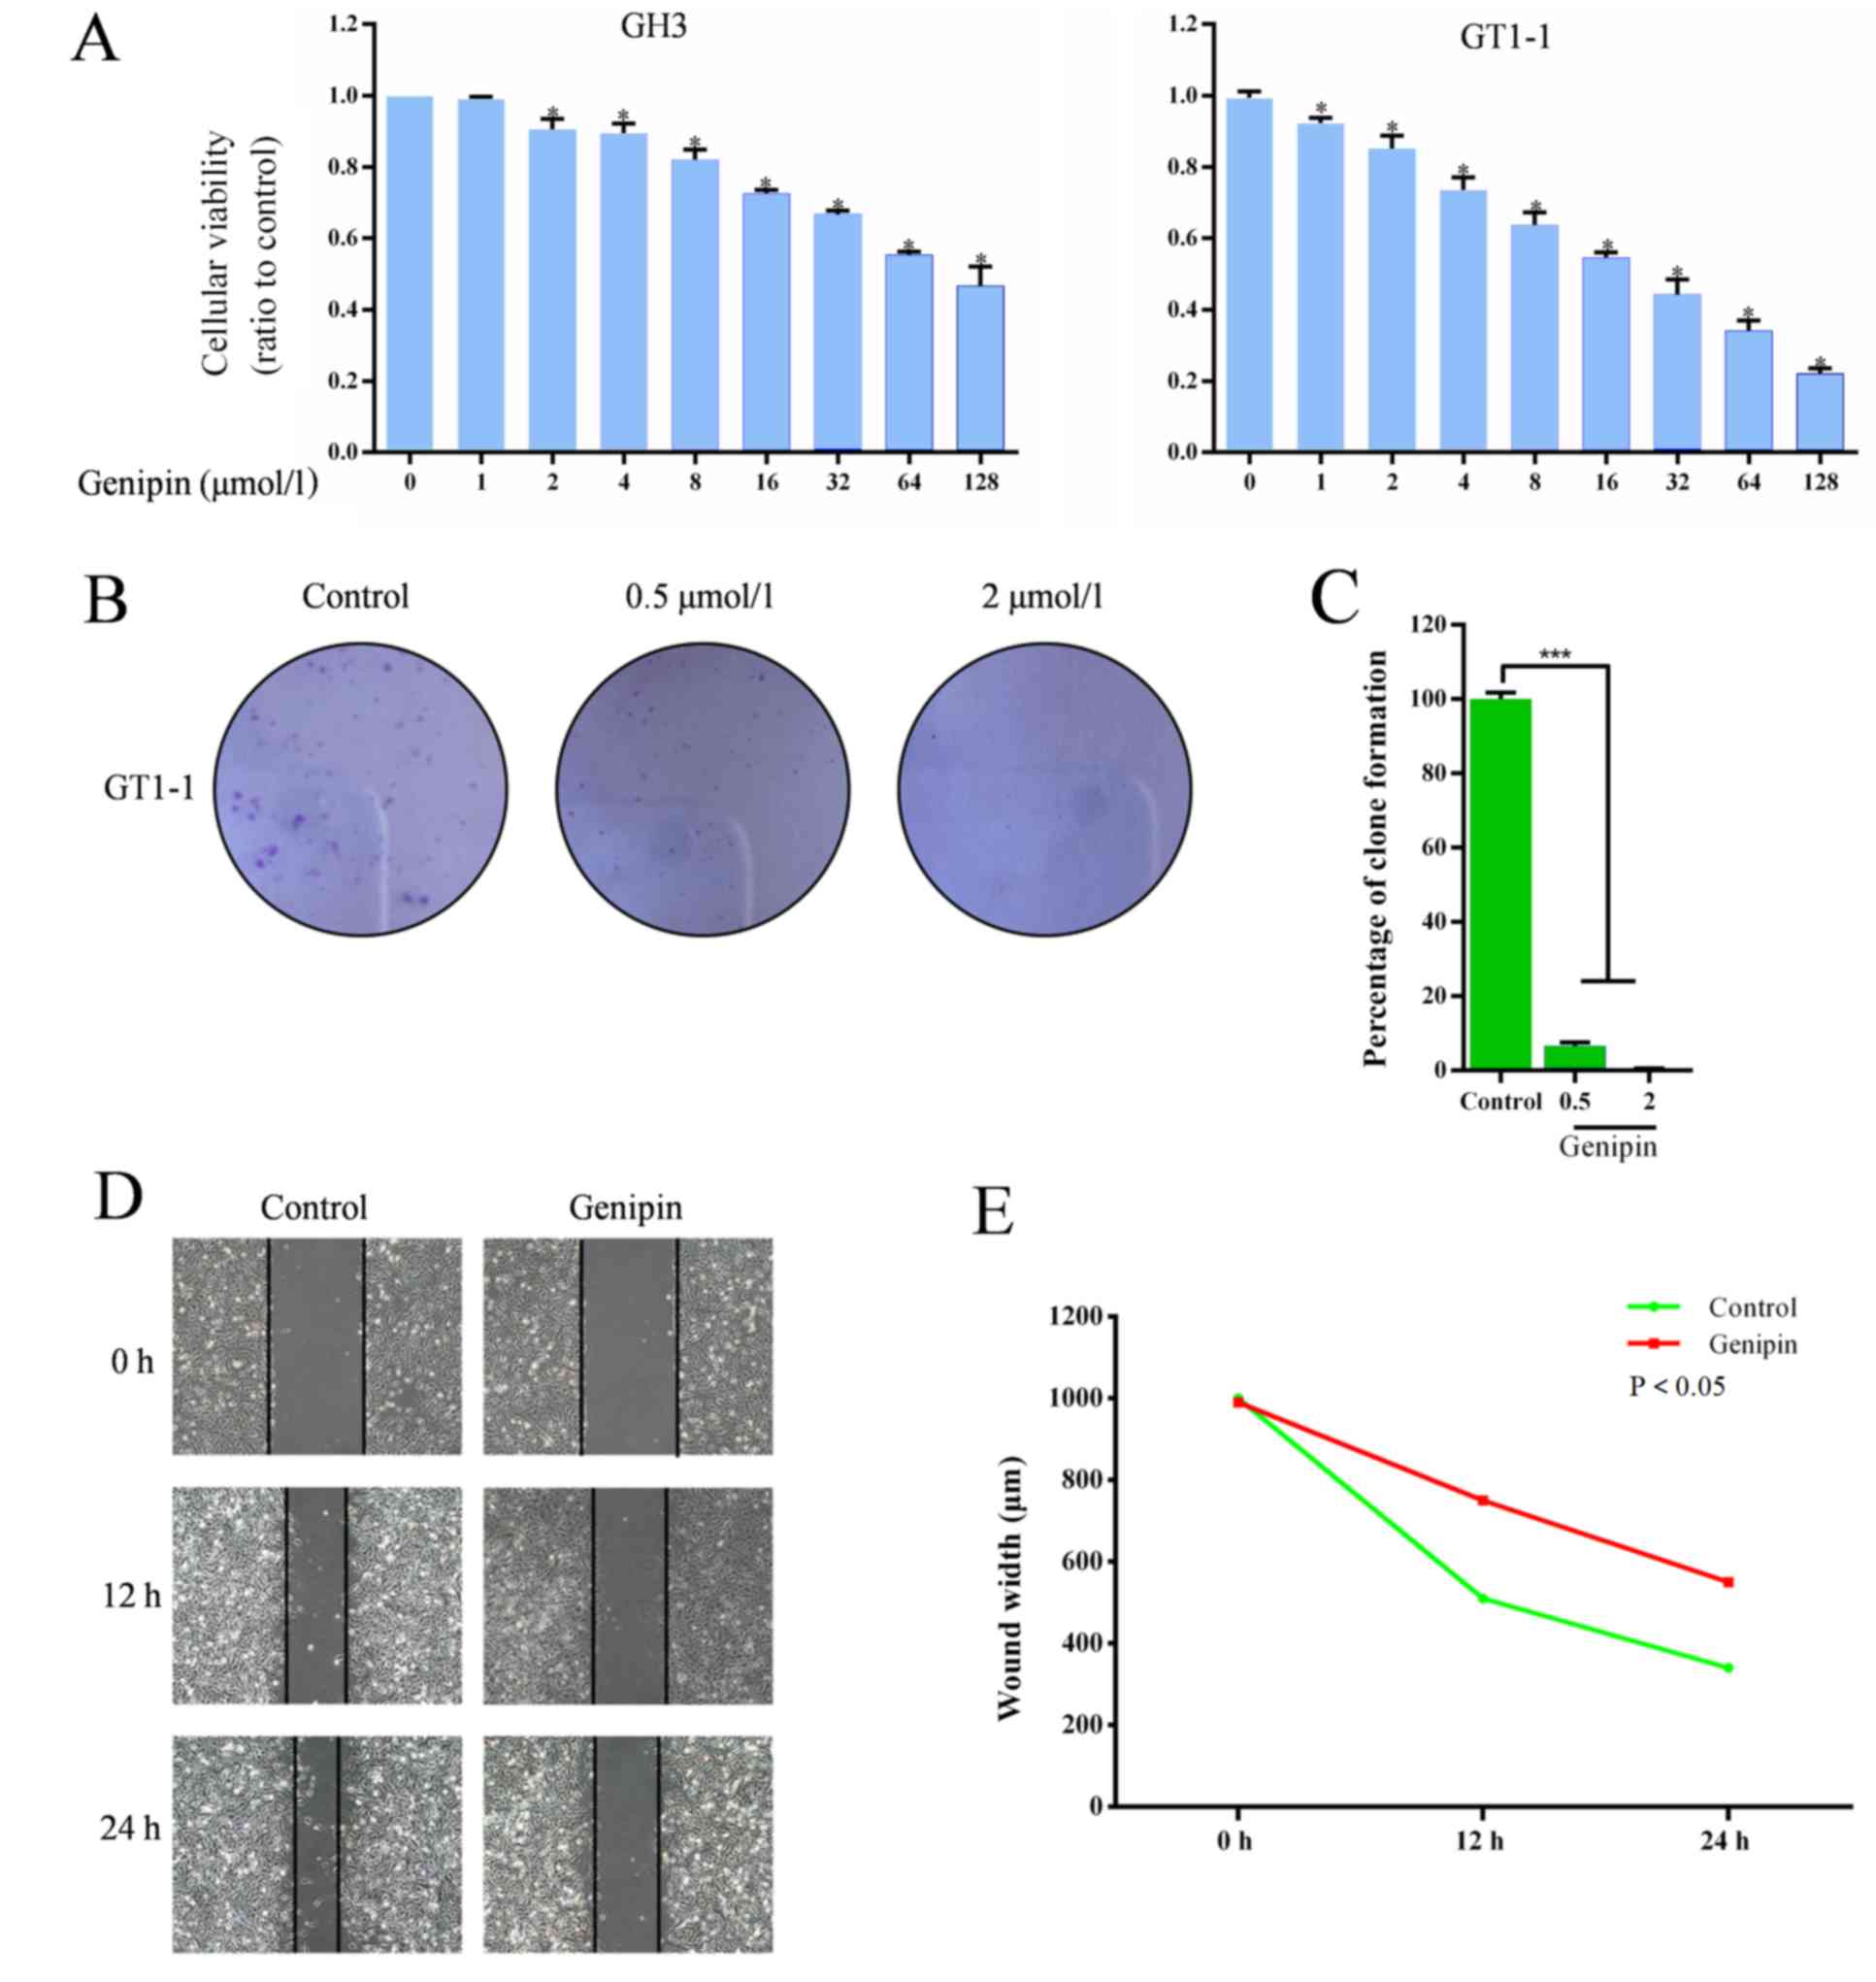
Genipin reduces proliferation of
prolactinoma cells
CCK8 assay was performed to evaluate the effects of
genipin on cell survival. The results revealed that the viability
of cells in cell lines GH3 and GT1-1 were significantly decreased
by genipin, as in Fig. 4A. For
further confirmation, a colony-forming assay was conducted to
define the effects of genipin in prolactinoma cells. As
demonstrated in Fig. 4B and C,
there were fewer and smaller clonogenicities in the genipin group
compared with the control group, and the percentage of clone
formation in the control was significantly higher than the drug
groups (0.5 and 2 µmol/l; P<0.05), and the percentage of clone
formation was found to be significantly different between the two
different drug dose groups.
Genipin induces migration of
prolactinoma cells
A scratch assay was performed to verify the effect
of genipin on invasion and migration of prolactinoma cells, with
the widths of scratched areas recorded 0, 12 and 24 h following the
scratch. As demonstrated in Fig. 4D
and E, the widths of scratched were clearly smaller after 24 h
in the control group, but only slightly decreased in genipin group,
while after 24 h, it was found that the wounds in control group
were also clearly smaller compared with the genipin group. With
time, the wound widths decreased in the control and the genipin
groups, and the control group showed a significant decrease
compared with the genipin group.
Genipin induces apoptosis of
prolactinoma cells
Flow cytometry was performed to clarify the
mechanism of genipin inhibition in prolactinoma cells and the
prolactinoma cells were measured following culture with different
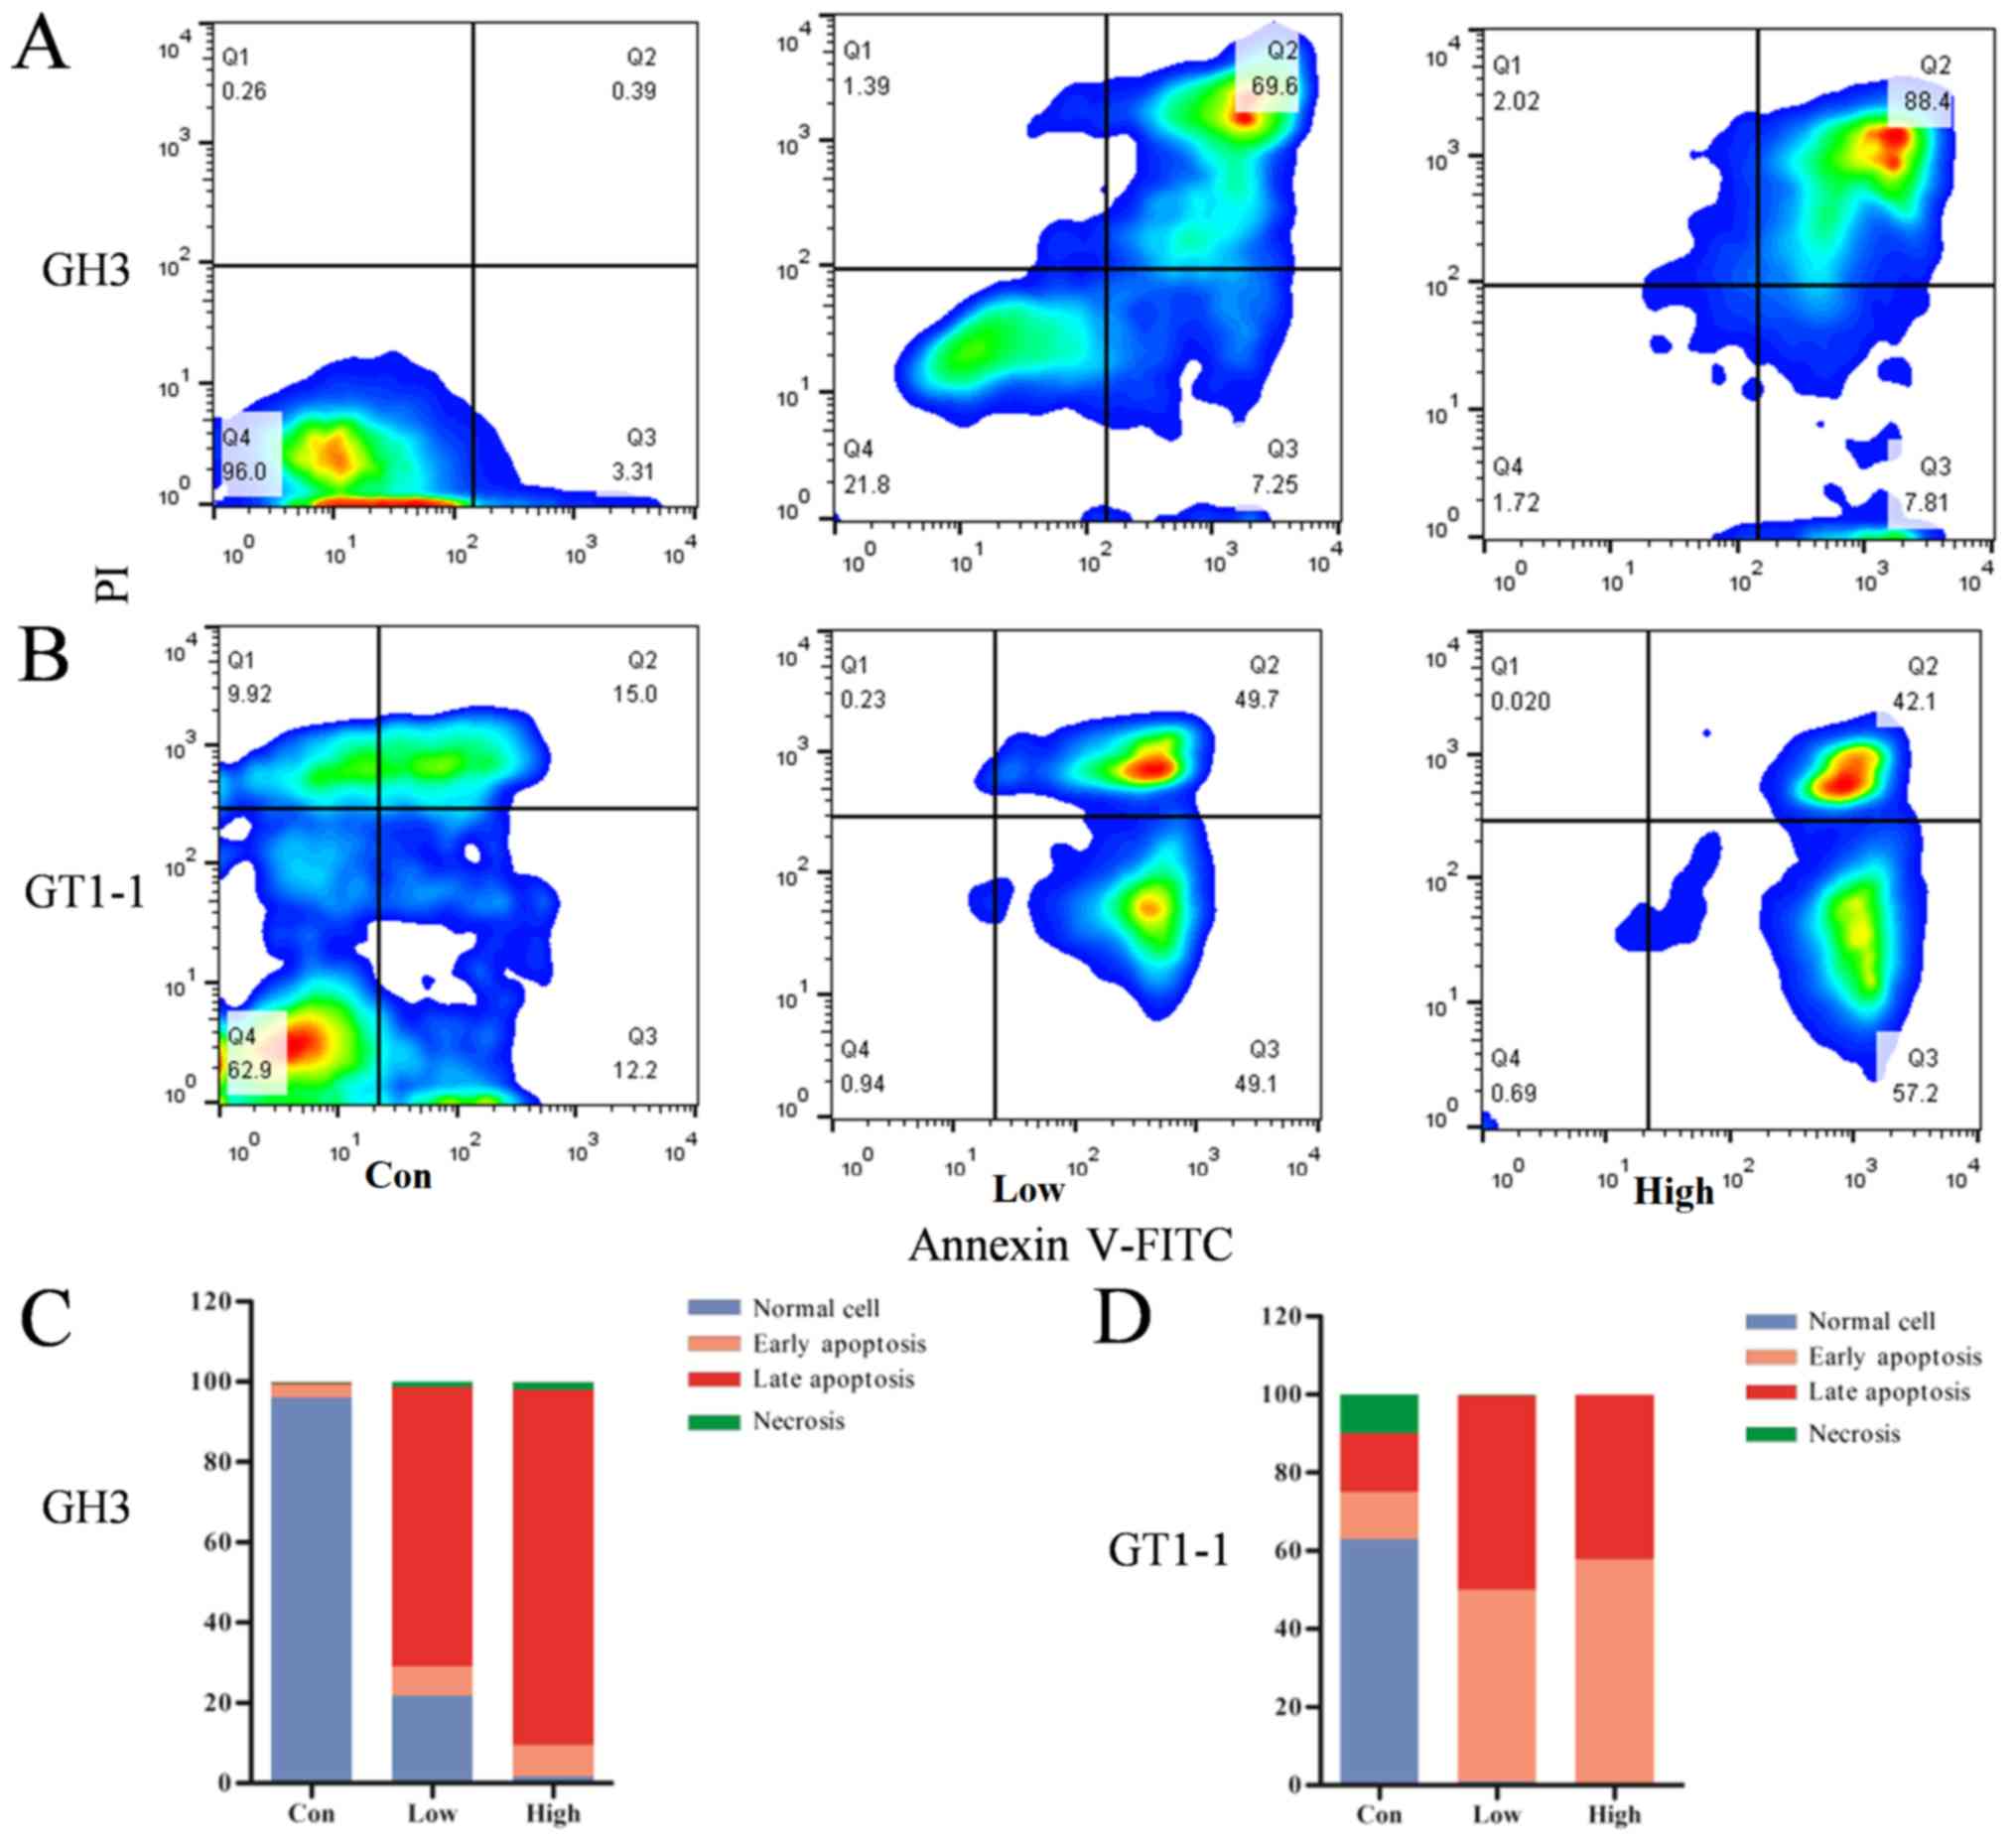
doses of genipin for 48 h. Fig. 5A and
B demonstrate that the percentage of GH3 cells that were
defined as non-apoptotic, necrotic, late apoptosis or early
apoptosis were 96.0, 0.26, 0.39 and 3.31%, respectively, in the
control group, 21.8, 1.39, 69.6 and 7.25% in the low dose group,
and 1.72, 2.02, 88.4 and 7.81% in the high dose group; while the
percentage of non-apoptotic, necrotic, late apoptosis or early
apoptosis GT1-1 cells were 62.9, 9.92, 15.0 and 12.2% in the
control group, 0.94, 0.23, 49.7 and 49.1% in the low dose group,
and 0.69, 0.02, 42.1 and 57.2% in the high dose group,
respectively. Fig. 5C and D
demonstrates that normal (non-apoptotic) cells were dominant in the
control group; in the low and dose groups, the percentage of late
and early apoptosis cells was increased.
Discussion
Prolactinoma is the most common pituitary tumor with
a secretory function. Prolactinoma monoclonal adenomas account for
~15% of primary intracranial neoplasms. Prolactinoma is usually
benign, but secretes excess hormones, which may lead to distinct
endocrine syndromes, and tumor growth or compressive symptoms
(23). Despite the common
application treatment with DAs and selective resection of
prolactinoma, their side effects and adverse reactions are
difficult to ignore. Recently, studies focusing on prolactinoma
have been performed (12,13), but the mechanism of prolactinoma
occurrence remains poorly understood and further study is required.
Therefore, promising therapy targets for prolactinoma and data to
illustrate the progression mechanism of prolactinoma are provided
in the present study. In addition, genipin is reported as a drug
promoting EGR1 expression (14),
which was identified as hub gene in the present study. CCK8 assay,
colony-forming assay, scratch assay and flow cytometry were
performed to verify the anti-prolactinoma effects of genipin.
The present study extracted data from GSE2175,
GSE26966 and GSE36314 datasets, and identified 12,695, 3,847 and
5,310 DEGs, respectively. A total of 1,201 mutual DEGs were
screened among the three datasets, with 570 mutual upregulated DEGs
and 631 mutual downregulated DEGs. These DEGs may have an important
role during the pathogenesis of prolactinoma and could be applied
as diagnostic or prognosis markers and treatment targets in the
future.
GO and KEGG pathway enrichment analysis were
performed in order to gain further insight into the molecular
mechanism of the prolactinoma occurrence. The upregulated DEGs were
mostly associated with ‘spindle pole’, ‘oocyte meiosis’ and
‘nucleus’, which are associated with development of tumors. The
downregulated genes were mainly associated with ‘signal
transduction’, ‘cytoplasm’ and ‘receptor complex’, which meant the
decline of normal cell functions. In addition, it was noted that
‘peptidyl-tyrosine phosphorylation gene’ decreased, which may be
connected with the activation of proto-oncogenes or the
inactivation of the tumor suppressor genes. According to the
results of KEGG analysis, the upregulated DEGs were mainly enriched
in ‘cGMP-PKG signaling pathway’, ‘glioma’ and ‘oocyte meiosis’,
while the downregulated DEGs were associated with ‘focal adhesion’
and ‘PI3K-Akt signaling pathway’. A number of studies have
demonstrated that disruption of the PKG signaling pathway leads to
various pathological changes in the heart, including vascular and
ventricular dysfunction, fibrosis and hypertrophy (24,25).
The cGMP-PKG signaling pathway has also been reported as having a
close association with colon cancer and has been considered as a
therapeutic strategy for colon cancer (26). It has been hypothesized that
blocking the PKG signaling pathway might be an effective solution
for patients with prolactinoma (27). Previous studies have shown that the
PI3K-Akt signaling pathway performs a crucial role in the growth,
proliferation, metabolism, survival and angiogenesis of cancer
cells (28,29). For instance, Wu et al
(30) identified that the PI3K-Akt
signaling pathway effectively ameliorated gastric tumor development
by delaying growth, inducing apoptosis, and inhibiting metastasis
and angiogenesis. The present study hypothesized that reduced
function of PI3K-Akt signaling pathway may be associated with
prolactinoma metastasis and invasion. The GSEA analysis suggested
that prolactinoma has a close association with Parkinson's disease
and the calcium signaling pathway, which supports the results of GO
and KEGG analysis. This indicates that there may be a link between
the progression mechanism of prolactinoma and Parkinson's disease,
but this requires further investigation.
In order to obtain the hub genes among the
identified DEGs, the 1,021 DEGs were analyzed using PPI network
according to the STRING database. A total of 24 genes were selected
with degrees >72; EGR1, MAPK1, MYC, Bcl2 and calmodulin 1
(CALM1). EGR1, a primary response gene that encodes a zinc finger
DNA-binding protein, is reported to be critical in cancer
metastasis and tumor invasion (31). This gene was found to be regulated
by gonadotropin-releasing hormone (GnRH) to regulate the expression
of luteinizing hormone β polypeptide, one of the GnRH-responsive
genes, and was revealed to be associated with prolactinoma in a
previous study (31). Previous
studies have suggested that genipin inhibits the proliferation of
various cancer cells by promoting EGR1 function, such as gastric,
colon and breast cancer (32,33).
Ko et al (14) demonstrated
that genipin can induce apoptosis in the AGS human gastric cancer
cell via a p53-independent EGR1/p21 signaling pathway. Thus, it was
hypothesized that genipin might have the same effect on
prolactinoma. MAPK1 interacts with a series of important signaling
components and phosphorylation events, which are vital in the
process of neoplasia. Extracellular signals are transmitted by
MAPK1, which adjusts cell growth, differentiation, proliferation,
apoptosis and migration (34). For
instance, microRNA-585 can suppress tumor proliferation and
migration in gastric cancer by directly targeting MAPK1 (35). In addition, a previous study
demonstrated that fulvestrant was effective in suppressing
prolactinoma cells by inhibiting the estrogen receptor and MAPK
pathway (36). This implies that
MAPK1 is a potential treatment target for prolactinoma and the role
of MAPK1 in prolactinoma requires further study. MYC, a
transcription factor that is overexpressed in cancers, is a
proto-oncogen, which is extensively expressed in Burkitt lymphoma
(37). MYC was one of hub genes
identified in the present study and exhibited abnormal expression
compared with normal tissue and prolactinoma tissue; it served an
important role in the progression of prolactinoma. Kim et al
(38) demonstrated that MYC is
involved in preventing immune cells from attacking non-small cell
lung cancer cells. A previous study noted that translocations of
MYC contributed to lymphoma, especially involving Bcl2, and
indicated a poor prognosis (39).
High serum LDH levels are often associated with malignant tumor,
which may be related to prolactinoma and play an important role in
the diagnosis of prolactinoma (40). Bcl2, the most important inhibitor
of apoptosis in the Bcl family, is associated with the development
and progression of the majority of cancers. It inhibits cell
apoptosis and resists other forms of cell death leading to an
increase in the number of cells, which has a positive effect on the
growth of tumors (41). A previous
study noted that the expression level of Bcl2 could be changed
apparently by fulvestrant during medical treatment (42). Geng et al (43) also demonstrated that bromocriptine
can induce autophagy-dependent cell death in pituitary adenomas by
decreasing Bcl2. Thus, it was hypothesized that Bcl2 may be another
driver gene in prolactinoma, drug targeting Bcl2 may inhibit
prolactinoma. CALM1 serves a vital role in regulating a series of
cellular functions through interaction with multiple target
proteins (44). Calmodulin and
interconnected calmodulin-regulated systems are involved in tumor
growth, tumor-associated angiogenesis and metastasis (45), which is consistent with the GSEA
results of the current study, which indicated that the expression
profiles of prolactinomas were enriched in ‘calcium signaling
pathway’. These findings suggest that CALM1 may be a potential
therapeutic target for prolactinoma. In addition, the present study
revealed that the genes JUN, FOS, Bcl2, STAT3, RPS27A, ACACB, INSR,
ERBB2, PPP2CA, CDK2 and PTPRC are also associated with
prolactinoma; these genes are potential diagnosis biomarkers,
treatment targets and prognosis markers for patients with
prolactinoma.
The functional analysis and enrichment of modules
genes were also investigated in the present study, those modules
were the most important gene clusters associated with prolactinoma,
and may have vital roles in the occurrence and development
mechanism of prolactinoma. The genes in module 1 were mainly
associated with ‘endoplasmic reticulum lumen’, ‘extracellular
matrix organization’ and ‘collagen trimer’, which were mainly
associated with cellular structure. The endoplasmic reticulum (ER)
is a major site for protein synthesis, lipid production and calcium
storage in eukaryotic cells. When the endoplasmic reticulum is
filled with unfolded proteins, misfolded proteins or changes in
calcium concentration, ER stress (ERS) can be induced, leading to
apoptosis. A number of previous studies have demonstrated that ERS
is associated with progression and proliferation of hepatic
carcinoma and ovarian cancer (46,47).
The genes of module 2 and 3 were associated with ‘GABAergic
synapse’, ‘morphine addiction’, ‘type I interferon signaling
pathway’ and ‘PI3K-Akt signaling pathway’. ‘GABAergic synapses’
regulate the activity of excitatory neurons in different brain
regions. The release of neurotransmitter γ-aminobutyric acid is
caused by the activation of inhibitory neurons (48). Therefore, there is a phenomenon in
which excitatory neurons and inhibitory neurons co-activate during
normal brain activity. The disruption of the balance between
excitability and inhibition of neurons occurs in neurodegenerative
and psychiatric disorders, including epilepsy, schizophrenia and
Parkinson's disease (49,50). Moreover, the enriched KEGG pathways
included ‘morphine addiction’, so it is hypothesized that taking
drugs may increase the risk of prolactinoma.
The anti-prolactinoma effects of genipin were
evaluated in present study with CCK8 assay, colony-forming assay
and scratch assay in vitro. In CCK8 assay, the cellular
viability (ratio to control) in cell lines GH3 and GT1-1 decreased
with increasing drug doses of genipin. In colony-forming assay, the
number and size of clonogenicities in genipin group were clearly
fewer than the control group and the percentage of clone formation
was significantly different in groups with different genipin doses.
Those results verified that the proliferation of prolactinoma cells
was reduced by genipin and the effects were dose-dependent. In
scratch assays, the wound widths in the control group decreased
over time and were smaller than the genipin group after 24 h; this
suggested that genipin reduced the migration of prolactinoma cells.
Flow cytometry was performed to further investigate the
anti-prolactinoma effect of genipin in prolactinoma cells, which
were treated with different dose of genipin for 48 h. The results
demonstrated that the percentage of the apoptosis cells increased
with the genipin dose, implying that the anti-prolactinoma effects
of genipin were caused by inducing apoptosis and that this effect
is dose-dependent. The absence of animal experiments was a
limitation of this study, due to the lack of an ideal prolactinoma
animal model; the effects of genipin in animals requires further
investigation, as do the details of the mechanisms of
prolactinoma.
In summary, an aggregate of 12,695, 3,847 and 5,310
DEGs were identified from datasets GSE2175, GSE26966 and GSE36314
respectively. GO and KEGG analysis showed that the enriched
functions and pathways in upregulated genes were mainly related to
‘spindle pole’, ‘oocyte meiosis’ and ‘nucleus’; while the
downregulated genes were associated with ‘signal transduction’,
‘cytoplasm’ and ‘receptor complex’. MAPK1, MYC, Bcl2, CALM1 and
EGR1 were identified as main hub genes. Genes JUN, FOS, Bcl2,
STAT3, RPS27A, ACACB, INSR, ERBB2, PPP2CA, CDK2 and PTPRC were
revealed to be associated with prolactinoma for the first time, to
the best of our knowledge. The proliferation and invasion of
prolactinoma cells could be reduced by genipin via inducing
apoptosis of prolactinoma cells. The anti-prolactinoma effect of
genipin is dose-dependent. Genipin is a promising and potential
drug for patients with prolactinoma.
Acknowledgements
Not applicable.
Funding
The present study was supported by grants from the
National Natural Science Foundation of China (grants nos. 81672505
and 81772684), the S&T Development Planning Program of Jilin
Province (grants nos. 20160101086JC, 20160312017ZG and
20180101152JC), the Jilin Provincial Education Department ‘13th
Five-Year’ Science and Technology Project (grants no.
JJKH20180191KJ) and the Interdisciplinary Innovation Project of The
First Hospital of Jilin University (grants no. JDYYJC001).
Availability of data and materials
The datasets used and/or analyzed during the present
study are available from the corresponding author upon reasonable
request.
Authors' contributions
SZ, BW, XW and DS were major contributors in writing
the manuscript, downloading datasets and conducting bio-information
analysis. DL, SJ and XL performed the analysis of the results. JG,
YZ and XZ performed cell experiments and contributed to figures and
tables. RJ and YC supervised the study, and contributed to the
experiments and data analysis.
Ethics approval and consent to
participate
Not applicable.
Patient consent for publication
Not applicable.
Competing interests
The authors declare that they have no competing
interests.
Glossary
Abbreviations
Abbreviations:
|
CALM1
|
calmodulin 1
|
|
PKG
|
cGMP-protein kinase G
|
|
DEGs
|
differentially expressed genes
|
|
DAVID
|
Database for Annotation, Visualization
and Integrated Discovery
|
|
EGR1
|
early growth response 1
|
|
GEO
|
Gene Expression Omnibus
|
|
GO
|
gene ontology
|
|
GSEA
|
gene set enrichment analysis
|
|
GnRH
|
gonadotropin-releasing hormone
|
|
KEGG
|
Kyoto Encyclopedia of Genes and
Genomes
|
|
MAPK1
|
mitogen-activated protein kinase 1
|
|
PPI
|
protein-protein interaction
|
|
STRING
|
Search Tool for Retrieval of
Interacting Genes
|
References
|
1
|
Theodros D, Patel M, Ruzevick J, Lim M and
Bettegowda C: Pituitary adenomas: Historical perspective, surgical
management and future directions. CNS Oncol. 4:411–429. 2015.
View Article : Google Scholar : PubMed/NCBI
|
|
2
|
Louis DN, Perry A, Reifenberger G, von
Deimling A, Figarella-Branger D, Cavenee WK, Ohgaki H, Wiestler OD,
Kleihues P and Ellison DW: The 2016 world health organization
classification of tumors of the central nervous system: A summary.
Acta Neuropathol. 131:803–820. 2016. View Article : Google Scholar : PubMed/NCBI
|
|
3
|
Hirohata T, Ishii Y and Matsuno A:
Treatment of pituitary carcinomas and atypical pituitary adenomas:
A review. Neurol Med Chir (Tokyo). 54:966–973. 2014. View Article : Google Scholar : PubMed/NCBI
|
|
4
|
Sinha S, Sharma BS and Mahapatra AK:
Microsurgical management of prolactinomas-clinical and hormonal
outcome in a series of 172 cases. Neurol India. 59:532–536. 2011.
View Article : Google Scholar : PubMed/NCBI
|
|
5
|
Manuylova E, Calvi LM, Hastings C, Vates
GE, Johnson MD, Cave WT Jr and Shafiq I: Late presentation of
acromegaly in medically controlled prolactinoma patients.
Endocrinol Diabetes Metab Case Rep. 2016(pii): 16–0069.
2016.PubMed/NCBI
|
|
6
|
Ghadirian H, Shirani M, Ghazi-Mirsaeed S,
Mohebi S and Alimohamadi M: Pituitary apoplexy during treatment of
prolactinoma with cabergoline. Asian J Neurosurg. 13:93–95. 2018.
View Article : Google Scholar : PubMed/NCBI
|
|
7
|
Chng E and Dalan R: Pituitary apoplexy
associated with cabergoline therapy. J Clin Neurosci. 20:1637–1643.
2013. View Article : Google Scholar : PubMed/NCBI
|
|
8
|
Nakhleh A, Shehadeh N, Hochberg I,
Zloczower M, Zolotov S, Taher R and Daoud Naccache D: Management of
cystic prolactinomas: A review. Pituitary. 21:425–430. 2018.
View Article : Google Scholar : PubMed/NCBI
|
|
9
|
Zhou W, Ma C and Yan Z: Microarray data
analysis reveals differentially expressed genes in prolactinoma.
Neoplasma. 62:53–60. 2015. View Article : Google Scholar : PubMed/NCBI
|
|
10
|
Zhao L, Lin M and Wang S: Identification
of human prolactinoma related genes by DNA microarray. J Cancer Res
Ther. 10:544–548. 2014.PubMed/NCBI
|
|
11
|
Zhan X, Wang X and Cheng T: Human
pituitary adenoma proteomics: New progresses and perspectives.
Front Endocrinol (Lausanne). 7:542016. View Article : Google Scholar : PubMed/NCBI
|
|
12
|
Zhang W, Zang Z, Song Y, Yang H and Yin Q:
Co-expression network analysis of differentially expressed genes
associated with metastasis in prolactin pituitary tumors. Mol Med
Rep. 10:113–118. 2014. View Article : Google Scholar : PubMed/NCBI
|
|
13
|
Faraoni EY, Camilletti MA, Abeledo-Machado
A, Ratner LD, De Fino F, Huhtaniemi I, Rulli SB and Díaz-Torga G:
Sex differences in the development of prolactinoma in mice
overexpressing hCGβ: Role of TGFβ1. J Endocrinol. 232:535–546.
2017. View Article : Google Scholar : PubMed/NCBI
|
|
14
|
Ko H, Kim JM, Kim SJ, Shim SH, Ha CH and
Chang HI: Induction of apoptosis by genipin inhibits cell
proliferation in AGS human gastric cancer cells via Egr1/p21
signaling pathway. Bioorg Med Chem Lett. 25:4191–4196. 2015.
View Article : Google Scholar : PubMed/NCBI
|
|
15
|
Xu Z, Zhou Y, Cao Y, Dinh TL, Wan J and
Zhao M: Identification of candidate biomarkers and analysis of
prognostic values in ovarian cancer by integrated bioinformatics
analysis. Med Oncol. 33:1302016. View Article : Google Scholar : PubMed/NCBI
|
|
16
|
Morris DG, Musat M, Czirják S, Hanzély Z,
Lillington DM, Korbonits M and Grossman AB: Differential gene
expression in pituitary adenomas by oligonucleotide array analysis.
Eur J Endocrinol. 153:143–151. 2005. View Article : Google Scholar : PubMed/NCBI
|
|
17
|
Michaelis KA, Knox AJ, Xu M,
Kiseljak-Vassiliades K, Edwards MG, Geraci M,
Kleinschmidt-DeMasters BK, Lillehei KO and Wierman ME:
Identification of growth arrest and DNA-damage-inducible gene beta
(GADD45beta) as a novel tumor suppressor in pituitary gonadotrope
tumors. Endocrinology. 152:3603–3613. 2011. View Article : Google Scholar : PubMed/NCBI
|
|
18
|
Tong Y, Zheng Y, Zhou J, Oyesiku NM,
Koeffler HP and Melmed S: Genomic characterization of human and rat
prolactinomas. Endocrinology. 153:3679–3691. 2012. View Article : Google Scholar : PubMed/NCBI
|
|
19
|
Abdul Aziz NA, Mokhtar NM, Harun R, Mollah
MM, Mohamed Rose I, Sagap I, Mohd Tamil A, Wan Ngah WZ and Jamal R:
A 19-Gene expression signature as a predictor of survival in
colorectal cancer. BMC Med Genomics. 9:582016. View Article : Google Scholar : PubMed/NCBI
|
|
20
|
Huang DW, Sherman BT and Lempicki RA:
Systematic and integrative analysis of large gene lists using DAVID
Bioinformatics Resources. Nat Protoc. 4:44–57. 2009. View Article : Google Scholar : PubMed/NCBI
|
|
21
|
Shannon P, Markiel A, Ozier O, Baliga NS,
Wang JT, Ramage D, Amin N, Schwikowski B and Ideker T: Cytoscape: A
software environment for integrated models of biomolecular
interaction networks. Genome Res. 13:2498–2504. 2003. View Article : Google Scholar : PubMed/NCBI
|
|
22
|
Franken NA, Rodermond HM, Stao J, Haveman
J and van Bree C: Clonogenic assay of cells in vitro. Nat Protoc.
1:2315–2319. 2006. View Article : Google Scholar : PubMed/NCBI
|
|
23
|
Cooper O, Mamelak A, Bannykh S, Carmichael
J, Bonert V, Lim S, Cook-Wiens G and Ben-Shlomo A: Prolactinoma
ErbB receptor expression and targeted therapy for aggressive
tumors. Endocrine. 46:318–327. 2014. View Article : Google Scholar : PubMed/NCBI
|
|
24
|
Castro-Ferreira R, Neves JS,
Ladeiras-Lopes R, Leite- Moreira AM, Neiva-Sousa M, Almeida-Coelho
J, Ferreira-Martins J and F Leite-Moreira A: Revisiting the slow
force response: The role of the PKG signaling pathway in the normal
and the ischemic heart. Rev Port Cardiol. 33:493–499. 2014.
View Article : Google Scholar : PubMed/NCBI
|
|
25
|
Hou J and Kang YJ: Regression of
pathological cardiac hypertrophy: Signaling pathways and
therapeutic targets. Pharmacol Ther. 135:337–354. 2012. View Article : Google Scholar : PubMed/NCBI
|
|
26
|
Babykutty S, Suboj P, Srinivas P, Nair AS,
Chandramohan K and Gopala S: Insidious role of nitric oxide in
migration/invasion of colon cancer cells by upregulating MMP-2/9
via activation of cGMP-PKG-ERK signaling pathways. Clin Exp
Metastasis. 29:471–492. 2012. View Article : Google Scholar : PubMed/NCBI
|
|
27
|
Browning DD, Kwon IK and Wang R:
cGMP-dependent protein kinases as potential targets for colon
cancer prevention and treatment. Future Med Chem. 2:65–80. 2010.
View Article : Google Scholar : PubMed/NCBI
|
|
28
|
Riquelme I, Tapia O, Espinoza JA, Leal P,
Buchegger K, Sandoval A, Bizama C, Araya JC, Peek RM and Roa JC:
The Gene Expression Status of the PI3K/AKT/mTOR pathway in gastric
cancer tissues and cell lines. Pathol Oncol Res. 22:797–805. 2016.
View Article : Google Scholar : PubMed/NCBI
|
|
29
|
Guo H, German P, Bai S, Barnes S, Guo W,
Qi X, Lou H, Liang J, Jonasch E, Mills GB and Ding Z: The PI3K/AKT
pathway and renal cell carcinoma. J Genet Genomics. 42:343–353.
2015. View Article : Google Scholar : PubMed/NCBI
|
|
30
|
Wu Y, Yuan M, Su W, Zhu M, Yao X, Wang Y,
Qian H, Jiang L, Tao Y, Wu M, et al: The constitutively active PKG
II mutant effectively inhibits gastric cancer development via a
blockade of EGF/EGFR-associated signalling cascades. Ther Adv Med
Oncol. 10:17588340177516352018. View Article : Google Scholar : PubMed/NCBI
|
|
31
|
Chauvin TR, Herndon MK and Nilson JH:
Cold-shock-domain protein A (CSDA) contributes
posttranscriptionally to gonadotropin-releasing hormone-regulated
expression of Egr1 and indirectly to Lhb. Biol Reprod. 86:532012.
View Article : Google Scholar : PubMed/NCBI
|
|
32
|
Kim ES, Jeong CS and Moon A: Genipin, a
constituent of Gardenia jasminoides Ellis, induces apoptosis and
inhibits invasion in MDA-MB-231 breast cancer cells. Oncol Rep.
27:567–572. 2012.PubMed/NCBI
|
|
33
|
Wang R, MoYung KC, Zhao YJ and Poon K: A
mechanism for the temporal potentiation of genipin to the
cytotoxicity of cisplatin in colon cancer cells. Int J Med Sci.
13:507–516. 2016. View Article : Google Scholar : PubMed/NCBI
|
|
34
|
Santarpia L, Lippman SM and El-Naggar AK:
Targeting the MAPK-RAS-RAF signaling pathway in cancer therapy.
Expert Opin Ther Targets. 16:103–119. 2012. View Article : Google Scholar : PubMed/NCBI
|
|
35
|
Hu L, Wu H, Wan X, Liu L, He Y, Zhu L, Liu
S, Yao H and Zhu Z: MicroRNA-585 suppresses tumor proliferation and
migration in gastric cancer by directly targeting MAPK1. Biochem
Biophys Res Commun. 499:52–58. 2018. View Article : Google Scholar : PubMed/NCBI
|
|
36
|
Li C, Sun Z, Gui S, Liu F and Zhang Y:
Effects of fulvestrant, an estrogen receptor antagonist, on MMQ
cells and its mechanism. Neuro Endocrinol Lett. 30:268–274.
2009.PubMed/NCBI
|
|
37
|
Tu WB, Helander S, Pilstål R, Hickman KA,
Lourenco C, Jurisica I, Raught B, Wallner B, Sunnerhagen M and Penn
LZ: Myc and its interactors take shape. Biochim Biophys Acta.
1849:469–483. 2015. View Article : Google Scholar : PubMed/NCBI
|
|
38
|
Kim EY, Kim A, Kim SK and Chang YS: MYC
expression correlates with PD-L1 expression in non-small cell lung
cancer. Lung Cancer. 110:63–67. 2017. View Article : Google Scholar : PubMed/NCBI
|
|
39
|
Li S, Lin P, Young KH, Kanagal-Shamanna R,
Yin CC and Medeiros LJ: MYC/Bcl2 double-hit high-grade B-cell
lymphoma. Adv Anat Pathol. 20:315–326. 2013. View Article : Google Scholar : PubMed/NCBI
|
|
40
|
Zhang J, Yao YH, Li BG, Yang Q, Zhang PY
and Wang HT: Prognostic value of pretreatment serum lactate
dehydrogenase level in patients with solid tumors: A systematic
review and meta-analysis. Sci Rep. 5:98002015. View Article : Google Scholar : PubMed/NCBI
|
|
41
|
Jagani H, Kasinathan N, Meka SR and
Josyula VR: Antiapoptotic Bcl-2 protein as a potential target for
cancer therapy: A mini review. Artif Cells Nanomed Biotechnol.
44:1212–1221. 2016.PubMed/NCBI
|
|
42
|
Okubo S, Kurebayashi J, Otsuki T, Yamamoto
Y, Tanaka K and Sonoo H: Additive antitumour effect of the
epidermal growth factor receptor tyrosine kinase inhibitor
gefitinib (Iressa, ZD1839) and the antioestrogen fulvestrant
(Faslodex, ICI 182,780) in breast cancer cells. Br J Cancer.
90:236–244. 2014. View Article : Google Scholar
|
|
43
|
Geng X, Ma L, Li Z, Li Z, Li J, Li M, Wang
Q, Chen Z and Sun Q: Bromocriptine induces autophagy-dependent cell
death in pituitary adenomas. World Neurosurg. 100:407–416. 2017.
View Article : Google Scholar : PubMed/NCBI
|
|
44
|
Toutenhoofd SL, Foletti D, Wicki R, Rhyner
JA, Garcia F, Tolon R and Strehler EE: Characterization of the
human CALM2 calmodulin gene and comparison of the transcriptional
activity of CALM1, CALM2 and CALM3. Cell Calcium. 23:232–238. 1998.
View Article : Google Scholar
|
|
45
|
Berchtold MW and Villalobo A: The many
faces of calmodulin in cell proliferation, programmed cell death,
autophagy, and cancer. Biochim Biophys Acta. 1843:398–435. 2014.
View Article : Google Scholar : PubMed/NCBI
|
|
46
|
Hughes A, Oxford AE, Tawara K, Jorcyk CL
and Oxford JT: Endoplasmic reticulum stress and unfolded protein
response in cartilage pathophysiology; contributing factors to
apoptosis and osteoarthritis. Int J Mol Sci. 18(pii): E6652017.
View Article : Google Scholar : PubMed/NCBI
|
|
47
|
Tang MK and Wong AS: Exosomes: Emerging
biomarkers and targets for ovarian cancer. Cancer Lett. 367:26–33.
2015. View Article : Google Scholar : PubMed/NCBI
|
|
48
|
Siegel JM: The neurotransmitters of sleep.
J Clin Psychiatry. 65 (Suppl 16):S4–S7. 2004.
|
|
49
|
Tyson JA and Anderson SA: GABAergic
interneuron transplants to study development and treat disease.
Trends Neurosci. 37:169–177. 2014. View Article : Google Scholar : PubMed/NCBI
|
|
50
|
Southwell DG, Nicholas CR, Basbaum AI,
Stryker MP, Kriegstein AR, Rubenstein JL and Alvarez-Buylla A:
Interneurons from embryonic development to cell-based therapy.
Science. 344:12406222014. View Article : Google Scholar : PubMed/NCBI
|