Introduction
Studies have demonstrated that high and even
clinical concentrations of local anesthetics can induce
neurotoxicity (1,2). In 1,416 non-diabetic patients
receiving a peripheral nerve block in France between Jan 1, 2000
and Dec 31, 2000, the incidence rate of neurological complications
was 0.21%, with symptoms including hyperalgesia, dysesthesia and
motor dysfunction (3). Patients
with diabetes were more likely to develop postoperative
neurological damage due to increased sensitivity to local
anesthetic-induced neurotoxicity (4), which is consistent with a report that
high blood glucose promotes ischemia/hypoxia, resulting in
neurotoxicity (5). Furthermore,
nerve injury may occur even at a clinical dose of local anesthetics
in patients with diabetes (6,7). In
patients with preexisting peripheral sensorimotor neuropathy or
diabetic polyneuropathy in the Mayo Clinic (Rochester, MN, USA)
between 1988 and 2000, the incidence rate of neurological
complications following neuraxial anesthesia or analgesia was 0.4%,
approximately twice that of the non-diabetic patients (8).
High glucose levels induce mitochondrial damage and
apoptosis in nerve cells through reactive oxygen species
(ROS)-mediated activation of caspase-3 (9,10).
Local anesthetics in combination with high glucose have also been
reported to cause endoplasmic reticulum stress (ERS) due to
excessive ROS-induced activation of apoptosis and caspase-12
(11,12). In response to external stimuli,
such as hypoxia, unfolded and misfolded proteins accumulate in the
endoplasmic reticulum (13).
During ERS, the unfolded protein response (UPR) is activated
through protein kinase R-like endoplasmic reticulum kinase (PERK),
inositol-requiring enzyme 1 (IRE1) and activating transcription
factor 6 (ATF6) signaling pathways, and autophagy is initiated to
maintain endoplasmic reticulum homeostasis (14,15).
The UPR is a highly conserved and complex process that can slow
protein synthesis and accelerate degradation of unfolded and
misfolded proteins in order to protect cells. However, persistent
ERS activates apoptotic signaling pathways and outweighs the
protective effects of autophagy, leading to apoptotic cell death
(16,17).
PERK-eukaryotic initiation factor 2α
(eIF2α)-activating transcription factor 4 (ATF4)-C/EBP-homologous
protein (CHOP), IRE1-X box-binding protein-1 (XBP1)-CHOP and
IRE1-tumor necrosis factor (TNF) receptor associated factor 2
(TRAF2)-c-Jun N-terminal kinase (JNK) are the major signaling
pathways that contribute to ERS-induced autophagy (18,19).
When the UPR is activated, glucose-regulated protein 78
(GRP78)/immunoglobulin heavy chain binding protein (Bip)
depolymerizes and phosphorylates the transmembrane protein PERK,
which phosphorylates and inactivates eIF2α, inhibiting protein
expression (20). Both ATF4 and
its downstream target CHOP are transcription factors that regulate
UPR target genes (21). ATF4,
which is activated by phosphorylated (p)-eIF2α, enhances the
synthesis and transport of endoplasmic reticulum proteins to
promote cell survival (21). With
specific endonuclease activity, IRE1 is depolymerized with
GRP78/Bip and activated during the UPR. It then targets 26
nucleotide sequences of XBP1 mRNA to form XBP1s, regulating target
gene transcriptional and endoplasmic reticulum-associated
degradation (22). In addition,
XBP1s enhance degradation of misfolded proteins in the endoplasmic
reticulum, and maintain cell homeostasis by recruiting TRAF2 and
activating the apoptosis signal-regulating kinase 1 (ASK1)-JNK
signaling pathway (23,24).
In contrast, persistent and severe ERS can induce
cell apoptosis though PERK and IRE1 signaling (25–27).
ATF4 is a key proapoptotic factor that dephosphorylates eIF2α via
transcriptional activation of growth arrest and DNA
damage-inducible protein 34 (28).
CHOP downregulates antiapoptotic Bcl-2 expression to promote
apoptosis (29). In addition, IRE1
inhibits expression of the antiapoptotic protein Bcl-1 and
activates proapoptotic proteins, such as Bcl-2-like protein 11,
through the IRE1-TRAF2-ASK1-JNK pathway (30–32).
Another study suggested that cell apoptosis is initiated when PERK
is activated, and IRE1 and ATF6 signaling are downregulated
(33). In the ERS-induced cell
apoptotic cascade, caspase-12 is activated by intracellular calcium
overload, which in turn activates downstream proapoptotic proteins,
including caspases-3 and 9, ultimately leading to apoptosis
(34,35). Of note, caspase-12 is a key factor
in ERS-mediated cell apoptosis (Fig.
1) (36,37).
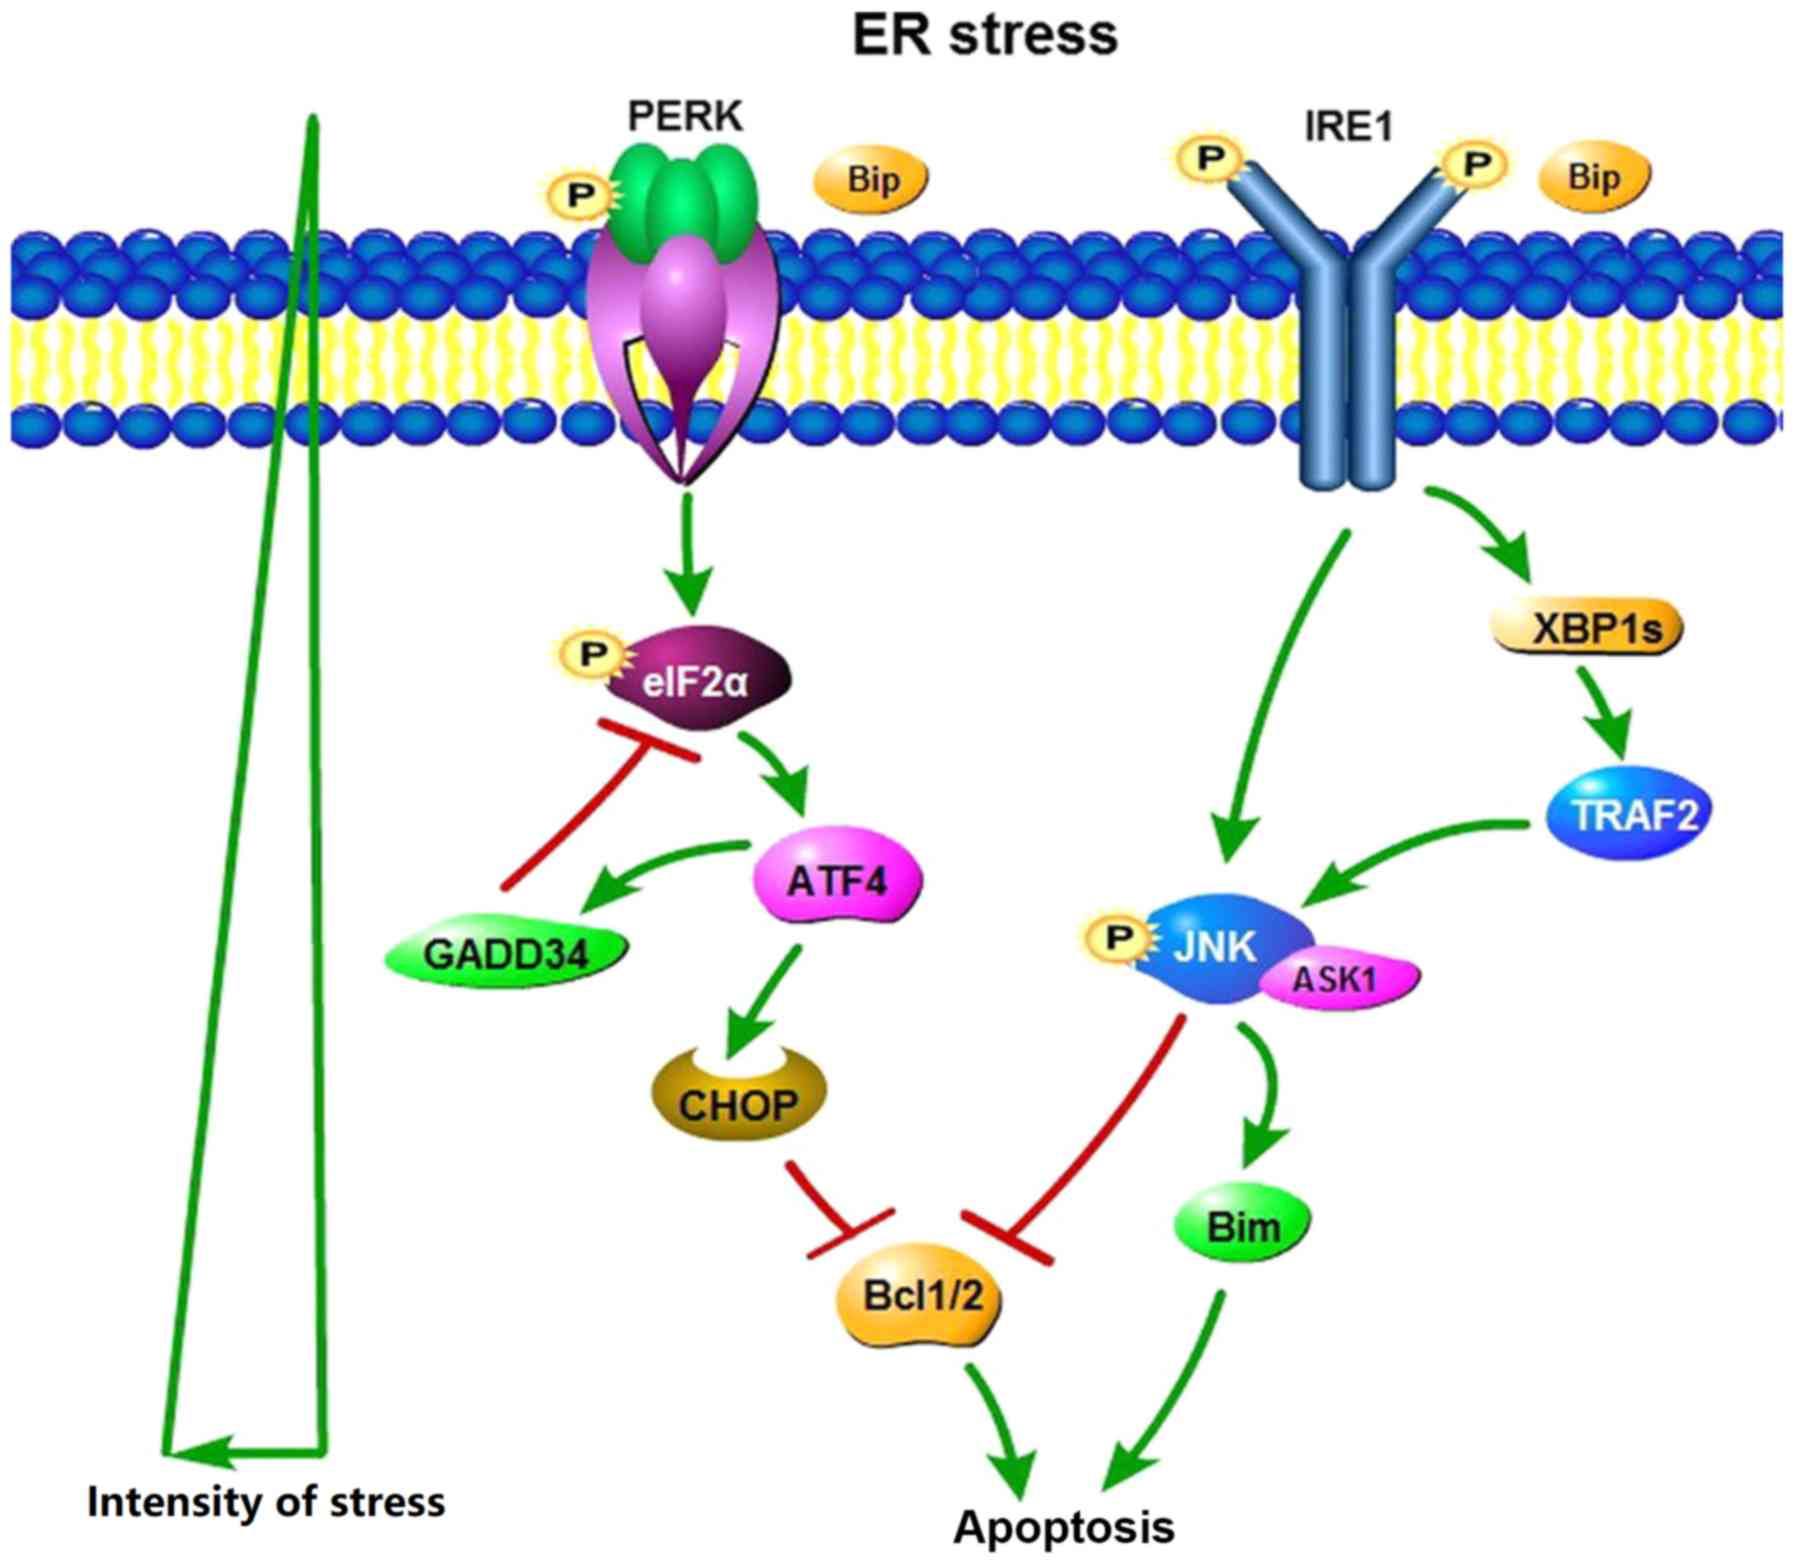 | Figure 1.Cell apoptosis under ER stress.
PERK-eIF2α-ATF4-CHOP, IRE1-XBP1-TRAF2-JNK are the major signaling
pathways that contribute to ERS-induced autophagy. Persistent and
severe ERS can induce cell apoptosis though PERK and IRE1
signaling. ATF4 is a key proapoptotic factor. CHOP downregulates
anti-apoptotic Bcl-2 expression to promote apoptosis. IRE1 inhibits
expression of the antiapoptotic protein Bcl-1 and activates
proapoptotic proteins Bim through the IRE1-TRAF2-ASK1-JNK pathway.
ASK1, apoptosis signal-regulating kinase 1; ATF4, activating
transcription factor 4; Bim, Bcl-2-like protein 11; Bip,
immunoglobulin heavy chain binding protein; CHOP, C/EBP-homologous
protein; eIF2α, eukaryotic initiation factor 2α; ER, endoplasmic
reticulum; GADD34, growth arrest and DNA damage-inducible protein
34; IRE1, inositol-requiring enzyme 1; JNK, c-Jun N-terminal
kinase; P, phosphate; PERK, protein kinase R-like ER kinase; TRAF2,
tumor necrosis factor receptor associated factor 2; XBP1s, X
box-binding protein-1s. |
Therefore, both autophagy and apoptosis are
activated during ERS, and cell survival or death depends on the
time and intensity of the stimuli, as well as cell type. The roles
of PERK and IRE1 signaling pathways in high glucose and
bupivacaine-induced cytotoxicity remain largely unknown. In the
present study, it was hypothesized that bupivacaine induces
cytotoxicity and apoptosis in SH-SY5Y cells cultured in high
glucose conditions by inhibiting autophagy through the
PERK-ATF4-CHOP and IRE1-TRAF2 signaling pathways. It was also
hypothesized that regulating autophagy influences cell apoptosis
and expression of key factors in these signaling pathways.
Materials and methods
Cells and reagents
The SH-SY5Y neuroblastoma cell line (cat. no.
3111C0001CCC000026) was obtained from the Life Science College in
Beijing Normal University (Beijing, China). Prior to the
experiments in the present study, the human SH-SY5Y cell line was
authenticated using short tandem repeat profiling. Cells were
cultured in Dulbecco's Modified Eagle's medium (DMEM)/F12
containing 15% fetal bovine serum (FBS) (cat. no. F2442, Sigma
Aldrich; Merck KGaA), 100 U/ml penicillin, and 100 µg/ml
streptomycin in an incubator at 5% CO2 and 37°C. The
culture media was replaced every 2 days.
The reagents used in the present study included the
autophagy inhibitor 3-methyladenine (3-MA; Sigma Aldrich; Merck
KGaA) and the autophagy inducer rapamycin (RAPA; Sigma Aldrich;
Merck KGaA), and the following antibodies: p-PERK (human,
unconjugated; cat. no. 12814; Signalway Antibody LLC); PERK (human,
unconjugated; cat. no. 12379; Signalway Antibody LLC); ATF4 (human,
unconjugated; cat. no. 11815; Cell Signaling Technology, Inc.);
CHOP (human, unconjugated; cat. no. 2895; Cell Signaling
Technology, Inc.); p-IRE1 (human, unconjugated; cat. no. ab124945;
Abcam); IRE1 (human, unconjugated; cat. no. ab37073; Abcam); TRAF2
(human, unconjugated; cat. no. 4712; Cell Signaling Technology,
Inc.); LC3 (human, unconjugated; cat. no. ab51520; Abcam); Beclin 1
(human, unconjugated; cat. no. ab55878; Abcam); caspase-12 (human,
unconjugated; cat. no. ab62484; Abcam); β-Actin (human,
unconjugated; cat. no. sc4778; Santa Cruz Biotechnology, Inc.) and
second antibody (Goat Anti-Rabbit IgG, rabbit, HRP; cat. no.
ab2761; Abcam).
Study protocol: Part I
Cells were seeded into 96-well plates at a density
of 1×10⁴ cells/well. In order to observe high
glucose-induced cytotoxicity, cells were divided into 11 groups: A
control group (receiving no treatment); 30, 40, 50, 75 and 100 mM
glucose groups; and 30, 40, 50, 75 and 100 mM mannitol groups. Of
note, the glucose concentrations used in the present study were
supraphysiological for the following reasons: i) Compared with
in vivo conditions, a higher level of glucose was required
in order to induce cytotoxicity in SH-SY5Y cells (11); and ii) a concentration of 30 mM
glucose for 2 weeks was used to induce cytotoxicity in vitro
in the SH-SY5Y cells (38).
In order to observe bupivacaine-induced
cytotoxicity, cells were divided into 7 groups: A control group
(receiving no treatment); and 0.5, 0.6, 0.7, 0.8, 0.9 and 1.0 mM
bupivacaine groups. The control groups were cultured in serum-free
DMEM/F12, and the bupivacaine treatment groups were cultured in
serum-free DMEM/F12 containing different concentrations of
bupivacaine, respectively. Cell viability was measured at days 1–3
and apoptosis was measured at day 2.
Study protocol: Part II
Cells were treated with either 3-MA or RAPA in order
to investigate the role of autophagy in response to high
glucose-induced cytotoxicity and bupivacaine. The cells were
divided into 7 groups, as presented in Table I. The protein expression levels of
PERK, p-PERK, ATF4, CHOP, IRE1, p-IRE1, TRAF2, LC3-II/LC3-I,
Beclin1, and caspase-12 were measured using western blotting.
 | Table I.Groupings in the study protocol (part
II). |
Table I.
Groupings in the study protocol (part
II).
| Group C | Culture for 24 h
Serum-free DMEM/F12 | Culture for 2 h
Serum-free DMEM/F12 | Culture for 24 h
Serum-free DMEM/F12 |
|---|
| Group RAPA | Serum-free DMEM/F12
+ 10 nmol/l RAPA | Serum-free DMEM/F12
+ 10 nmol/l RAPA | Serum-free DMEM/F12
+ 10 nmol/l RAPA |
| Group 3-MA | Serum-free DMEM/F12
+ 1 mmol/l 3-MA | Serum-free DMEM/F12
+ 1 mmol/l 3-MA | Serum-free DMEM/F12
+ 1 mmol/l 3-MA |
| Group H | Serum-free DMEM/F12
+ 50 mM glucose | Serum-free DMEM/F12
+ 50 mM glucose | Serum-free DMEM/F12
+ 50 mM glucose |
| Group HB | Serum-free DMEM/F12
+ 50 mM glucose | Serum-free DMEM/F12
+ 50 mM glucose | Serum-free DMEM/F12
+ 50 mM glucose + 0.5 mM bupivacaine |
| Group HRB | Serum-free DMEM/F12
+ 50 mM glucose | Serum-free DMEM/F12
+ 50 mM glucose + 10 nmol/l RAPA | Serum-free DMEM/F12
+ 50 mM glucose + 0.5 mM bupivacaine |
| Group HMB | Serum-free DMEM/F12
+ 50 mM glucose | Serum-free DMEM/F12
+ 50 mM glucose + 1 mmol/l 3-MA | Serum-free DMEM/F12
+ 50 mM glucose + 0.5 mM bupivacaine |
Cell Counting Kit-8 (CCK-8)
Cell viability was determined using a CCK-8 assay
(GK3607-500T, Genview) according to the manufacturer's protocol.
The optical density values at 450 nm were measured using a
microplate reader (Multiskan MK; Thermo Fisher Scientific,
Inc.).
Flow cytometry
Cell apoptosis rates were determined using the
Annexin V- FITC/propidium iodide (PI) apoptosis kit (Dingguo
Changsheng Biotechnology Co., Ltd.) according to the manufacturer's
protocol. Each cell sample of 300 µl with 1×10⁶ cells
was incubated with 5 µl Annexin V-FITC for 15 min at 37°C, followed
by 5 µl PI for 15 min. Cellular fluorescence was measured using a
flow cytometer (ACEA NovoCyte; NovoExpress 1.1.0; ACEA Biosciences,
Inc.). The apoptosis rate was calculated by adding the early
apoptosis (Annexin V+/PI−, Q4) and late
apoptosis (Annexin V+/PI+, Q2). The
preliminary results revealed no difference following RAPA and 3-MA
treatments in normal cells (data not shown), and the apoptosis
rates in groups C, H, HB, HRB and HMB were evaluated.
Western blot analysis
At the end of cell culture, cells were washed twice
with 0.9% NaCl at 4°C. The total protein in each well was extracted
using 100 µl RIPA lysis buffer containing a protease inhibitor
(WB-0071; Dingguo Changsheng Biotechnology Co., Ltd.) for 3 min on
ice. Homogenates were centrifuged at 12,800 × g for 20 min at 4°C.
Protein concentrations were determined using a bicinchoninic acid
protein assay kit (Shanghai Biyuntian Biotechnology Co., Ltd.). The
supernatants were used for western blot analysis. Proteins (50 µg)
were separated via 12% SDS-PAGE, transferred to nitrocellulose
membranes, blocked in 5% skimmed milk at 37°C for 1 h, and
incubated overnight at 4°C with anti-LC3 (1:3,000), anti-caspase-12
(1:1,000), anti-PERK (1:2,000), anti-p-PERK (1:2,000), anti-ATF4
(1:1,000), anti-CHOP (1:1,000), anti-IRE1 (1:3,000), anti-p-IRE1
(1:3,000), anti-TRAF2 (1:1,000), anti-Beclin-1 (1:1,000) and
anti-β-actin (1:5,000) primary antibodies. The membranes were then
incubated for 2 h at room temperature with appropriate secondary
antibody (Goat Anti-Rabbit IgG, 1:5,000). The blots were visualized
using an enhanced chemiluminescence detection system (Cell
Signaling Technology, Inc.). Images were processed using Quantity
One software (version 4.6; Bio-Rad Laboratories).
Statistical analysis
GraphPad Prism (version 6.0; GraphPad Software Inc.)
was used for all the statistical analyses. Data are expressed as
the mean ± standard deviation, and evaluated using one-way analysis
of variance followed by Newman-Keuls post hoc tests. P<0.05 was
considered to indicate a statistically significant difference.
Results
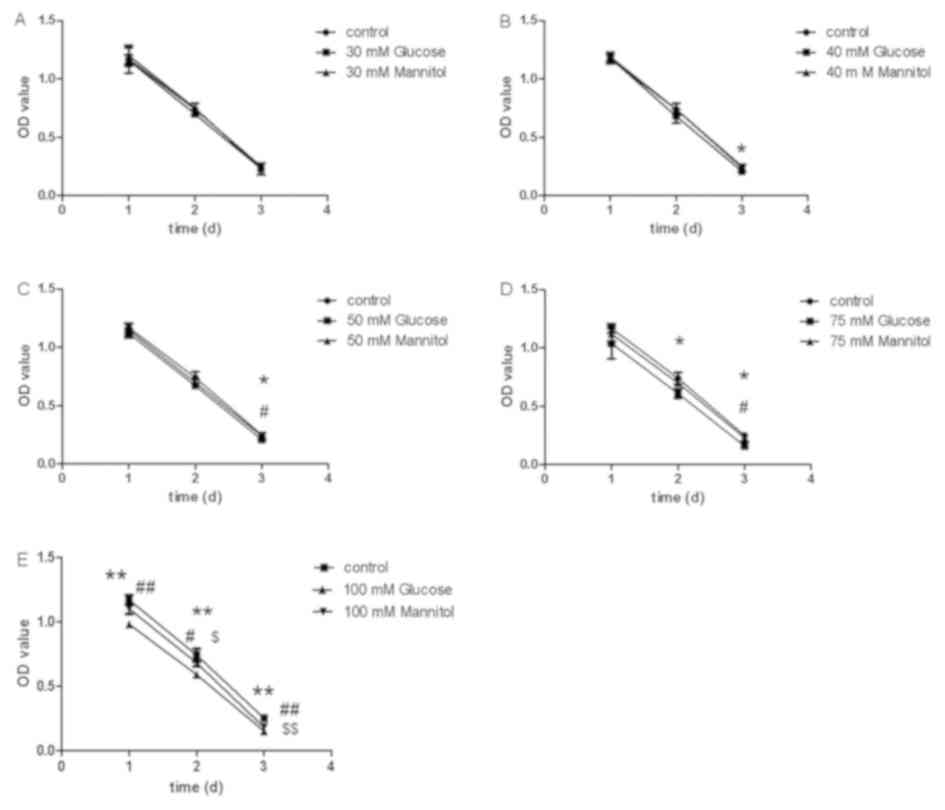
High glucose-induces cytotoxicity and
cell apoptosis in SH-SY5Y cells
Following culture in serum-free DMEM, the CCK-8
assay demonstrated decreased cell viability after 30 mM
glucose/mannitol treatment at days 2 and 3 (Fig. 2A). Compared with the control group,
cell viability significantly decreased in the 40 mM glucose group
at day 3 (P<0.05; Fig. 2B), the
50 mM glucose group at day 3 (P<0.01; Fig. 2C), the 75 mM glucose group at days
2 and 3 (P<0.05; Fig. 2D), and
the 100 mM glucose group at days 1, 2 and 3 (P<0.05; Fig. 2E). Compared with the mannitol
group, the 50 and 75 mM glucose groups had lower cell viability at
day 3 (P<0.05; Fig. 2C and D),
and the 100 mM glucose group had lower cell viability at days 1, 2
and 3 (Fig. 2E).
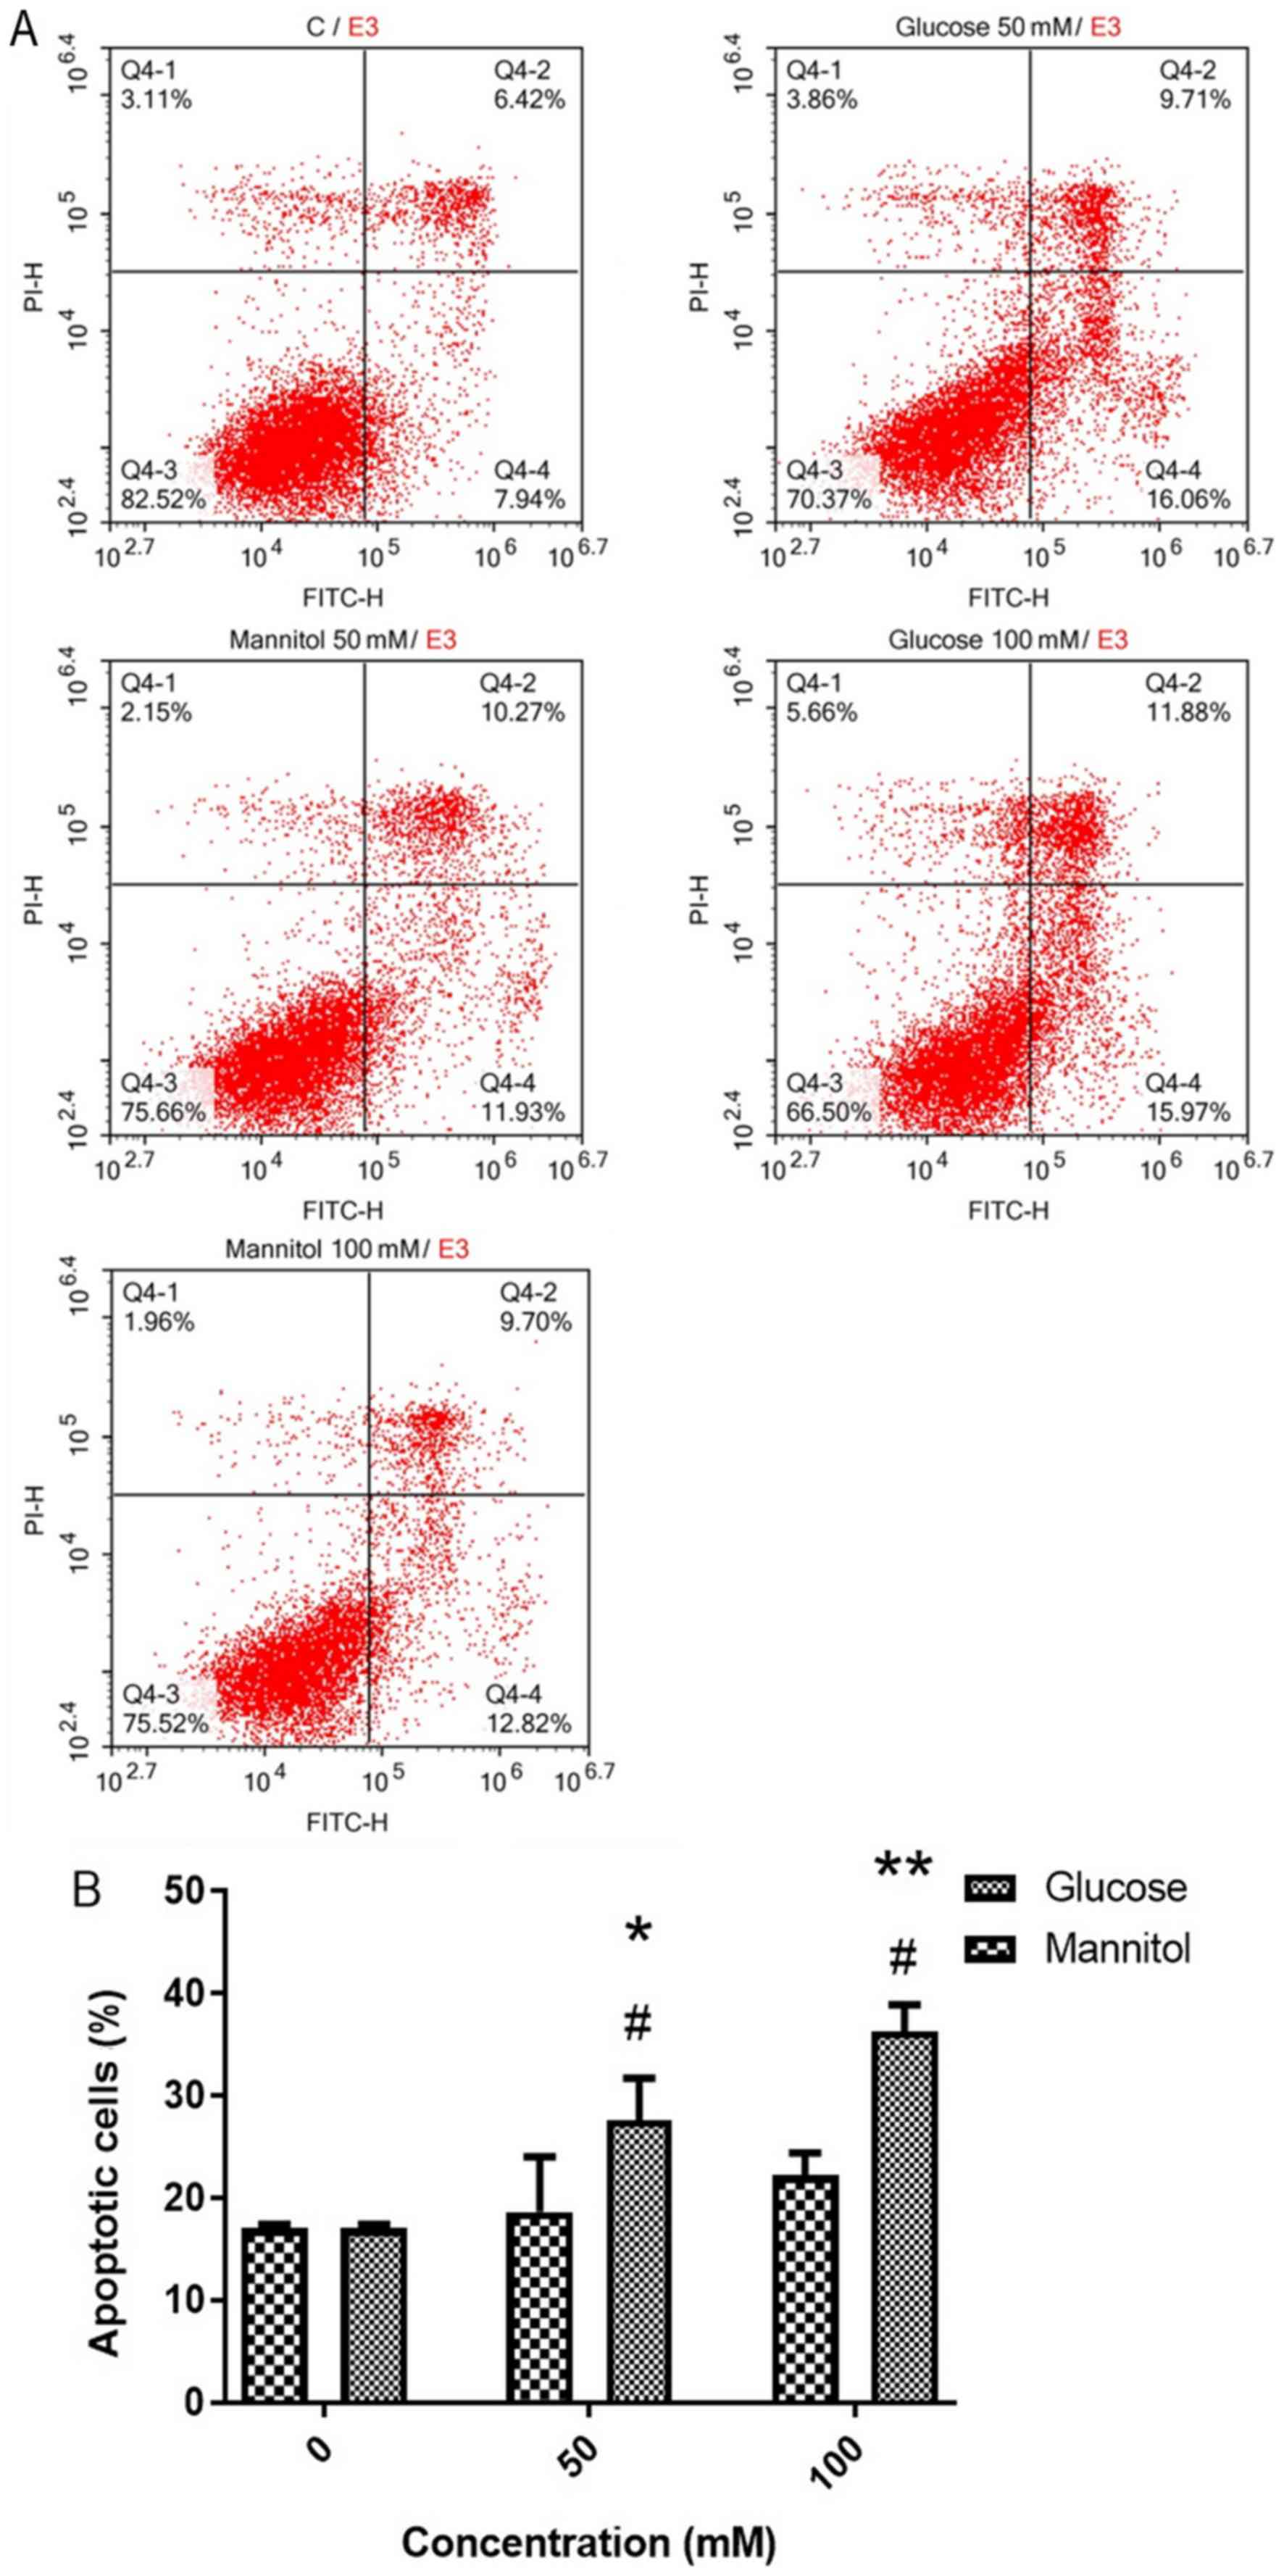
At day 2, cell apoptosis was measured using Annexin
V-FITC/PI staining (Fig. 3A). It
was revealed that 50 and 100 mM glucose resulted in significantly
higher apoptosis rates (27.62±4.09 and 36.30±2.59%, respectively)
compared with the control (17.04±0.39%) or 50 and 100 mM mannitol
groups (18.64±5.36 and 22.20±2.20%, respectively; Fig. 3B).
Collectively, a glucose concentration of 50 mM
significantly altered cell viability and apoptosis at day 2, and
was therefore selected as the experimental concentration in the
following experiments. Despite a supraphysiological concentration,
a 50 mM dose of glucose was required in vitro in SH-SY5Y
cells, as described in the Materials and methods section.
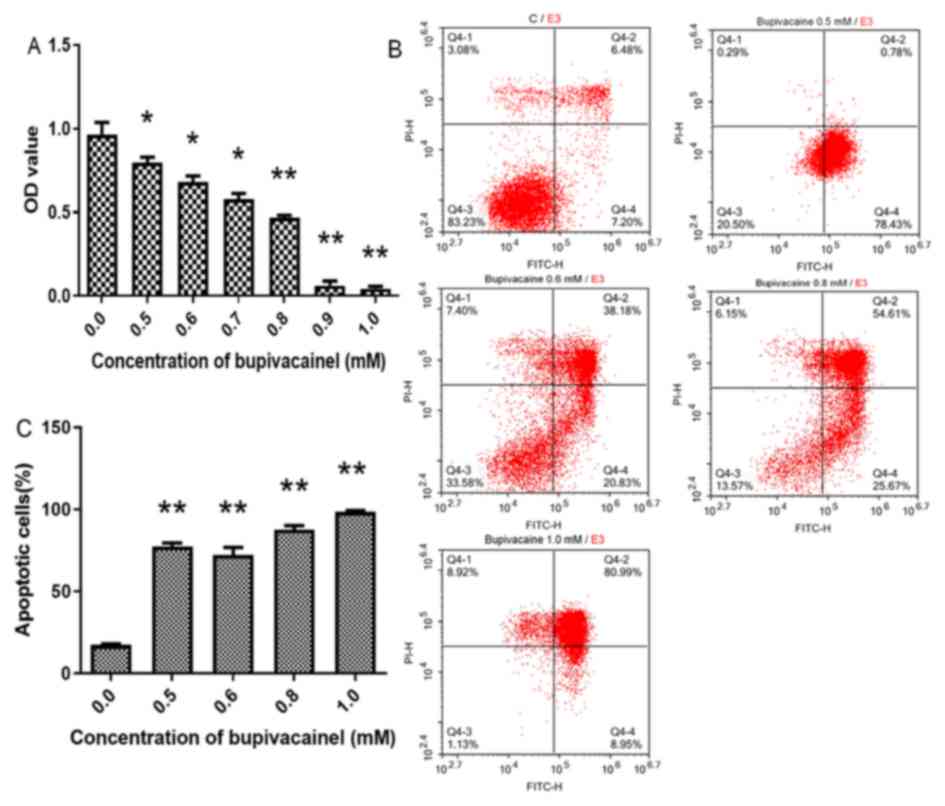
Bupivacaine-induced cytotoxicity and
cell apoptosis in SH-SY5Y cells
Following culture with serum-free DMEM + 0.5–1.0 mM
bupivacaine for 2 days, cell viability was significantly reduced
compared with the control group (P<0.01 or 0.05; Fig. 4A). In addition, the bupivacaine
groups exhibited significantly higher apoptosis rates compared with
the control group (P<0.01; Fig. 4B
and C).
Based on these findings, a bupivacaine concentration
of 0.5 mM, which resulted in a ~17% reduction in cell viability and
3.5 times of increase in cell apoptosis at day 2 (Fig. 4A-C), was selected for the following
experiments.
RAPA and 3-MA modulate the
PERK-ATF4-CHOP and IRE1-TRAF2 signaling pathways in SH-SY5Y cells
treated with high glucose and bupivacaine
The effects of RAPA and 3-MA treatment on the
PERK-ATF4-CHOP and IRE1-TRAF2 signaling pathways under high glucose
and bupivacaine treatment conditions were investigated in the
present study (Fig. 5A). Neither
RAPA nor 3-MA alone significantly affected the expression or
phosphorylation of proteins in the PERK-ATF4-CHOP and IRE1-TRAF2
signaling pathways in SH-SY5Y cells under normal conditions.
Compared with the control group, p-PERK/PERK was significantly
higher in the high glucose (H) + bupivacaine group (HB; P<0.05;
Fig. 5B-D), ATF4 protein
expression was significantly higher in the H, HB, HRB, and HMB
groups (P<0.01; Fig. 5E), CHOP
protein expression was significantly higher in the HB group
(P<0.01; Fig. 5F), p-IRE1/IRE1
was significantly lower in the H and HB groups (P<0.05; Fig. 5I) and TRAF2 protein expression was
significantly lower in the HB group (P<0.05; Fig. 5J).
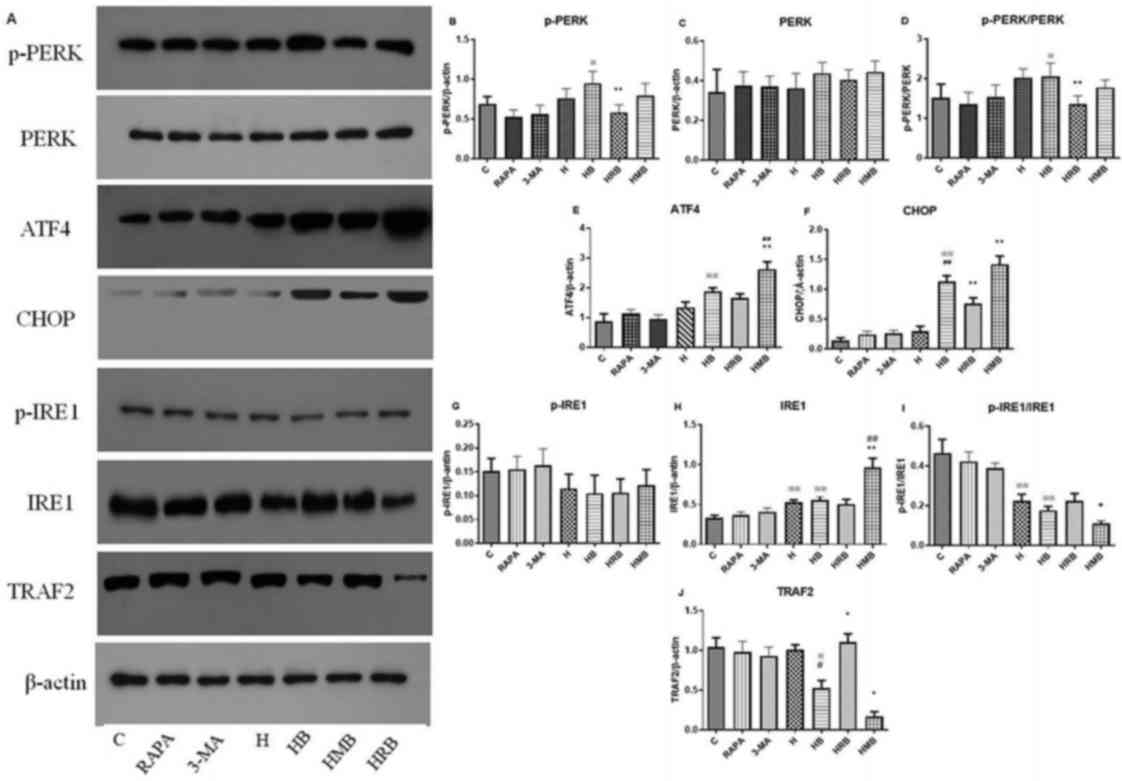 | Figure 5.PERK-ATF4-CHOP and IRE1-TRAF2
signaling pathways during autophagy in SH-SY5Y cells. (A)
Representative western blotting images. (B-J) Protein expression
quantification. Data are expressed as the mean ± standard
deviation. N=4/group. ※P<0.05, ※※P<0.01
vs. C; #P<0.05, ##P<0.01 vs. H;
*P<0.05, **P<0.01 vs. HB. PERK, protein kinase R-like
endoplasmic reticulum kinase; ATF4, activating transcription factor
4; CHOP, C/EBP-homologous protein; IRE1, inositol-requiring enzyme
1; TRAF2, tumor necrosis factor receptor associated factor 2; RAPA,
rapamycin; p, phosphorylated; C, control group; H, high glucose
group; HB, high glucose + bupivacaine group; HRB, high glucose +
RAPA + bupivacaine group; HMB, high glucose + 3-MA + bupivacaine
group. |
Compared with the H group, CHOP protein expression
was significantly higher (P<0.01; Fig. 5F) and TRAF2 protein expression was
significantly lower in the HB group (P<0.05; Fig. 5J).
Compared with the HB group, p-PERK/PERK was
significantly lower in the HRB group (P<0.01; Fig. 5D), ATF4 protein expression was
significantly higher in the HMB group (P<0.01; Fig. 5E), CHOP protein expression was
significantly lower in the HRB group and higher in the H + 3-MA +
bupivacaine (HMB) group (P<0.01; Fig. 5F), p-IRE1/IRE1 was significantly
lower in the HMB group (P<0.05; Fig. 5I), and TRAF2 protein expression was
significantly higher in the HRB group and lower in the HMB group
(P<0.05; Fig. 5J).
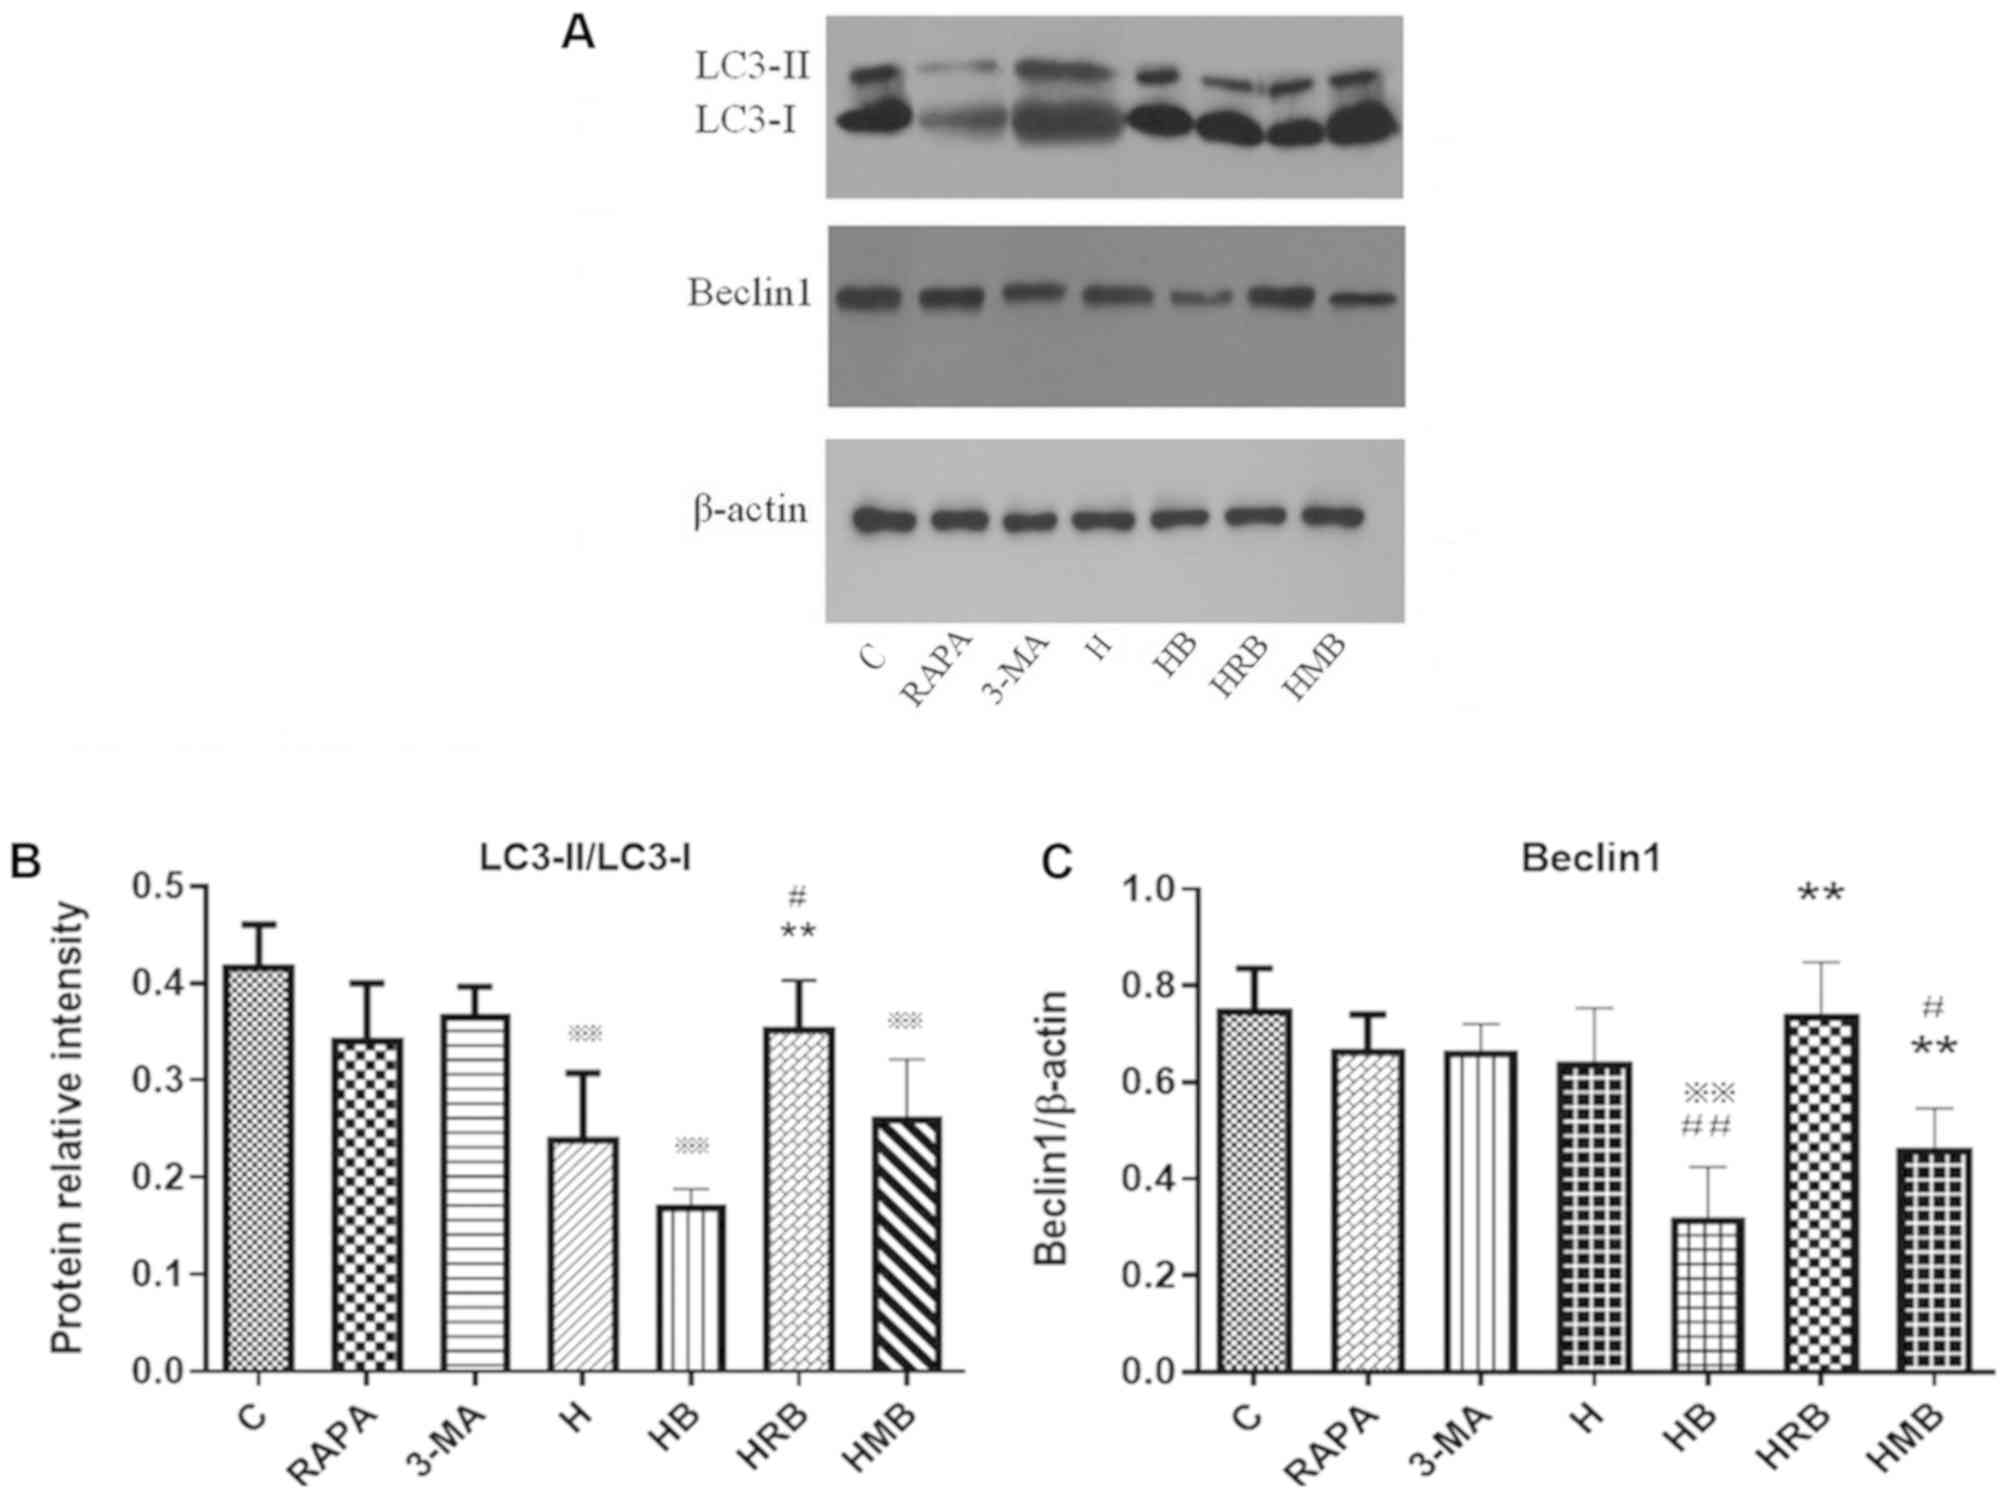
RAPA and 3-MA modulate LC3 and Beclin1
protein expression in SH-SY5Y cells treated with high glucose and
bupivacaine
The effects of RAPA and 3-MA treatment on LC3 and
Beclin1 protein expression were determined using western blot
analysis (Fig. 6A). Neither RAPA
nor 3-MA alone affected LC3 and Beclin1 protein expression under
normal conditions. Compared with the control group, LC3-II/LC3-I
and Beclin1 protein expression were significantly lower in the HB
group (P<0.01; Fig. 6B and C).
Compared with the H group, Beclin1 protein expression was
significantly lower in the HB group (P<0.01; Fig. 6C). Compared with the HB group,
LC3-II/LC3-I and Beclin1 protein expression was significantly
higher in the HRB group (P<0.01; Fig. 6B and C).
RAPA and 3-MA modulate cell apoptosis
in SH-SY5Y cells treated with high glucose and bupivacaine
Following HRB or HMB treatment, cell apoptosis was
measured using Annexin V-FITC/PI staining (Fig. 7A). The cell apoptosis rate was
significantly higher in the H (33.84±2.76%) and HB (42.55±2.84%)
groups compared with the control group (21.48±1.61%; P<0.05 or
0.01), with higher values in the HB group compared with the H group
(P<0.01; Fig. 7B). Compared
with the HB group, the apoptosis rate was significantly lower in
the HRB group (36.18±1.51%) and higher in the HMB group
(49.11±3.18%; P<0.01; Fig.
7B).
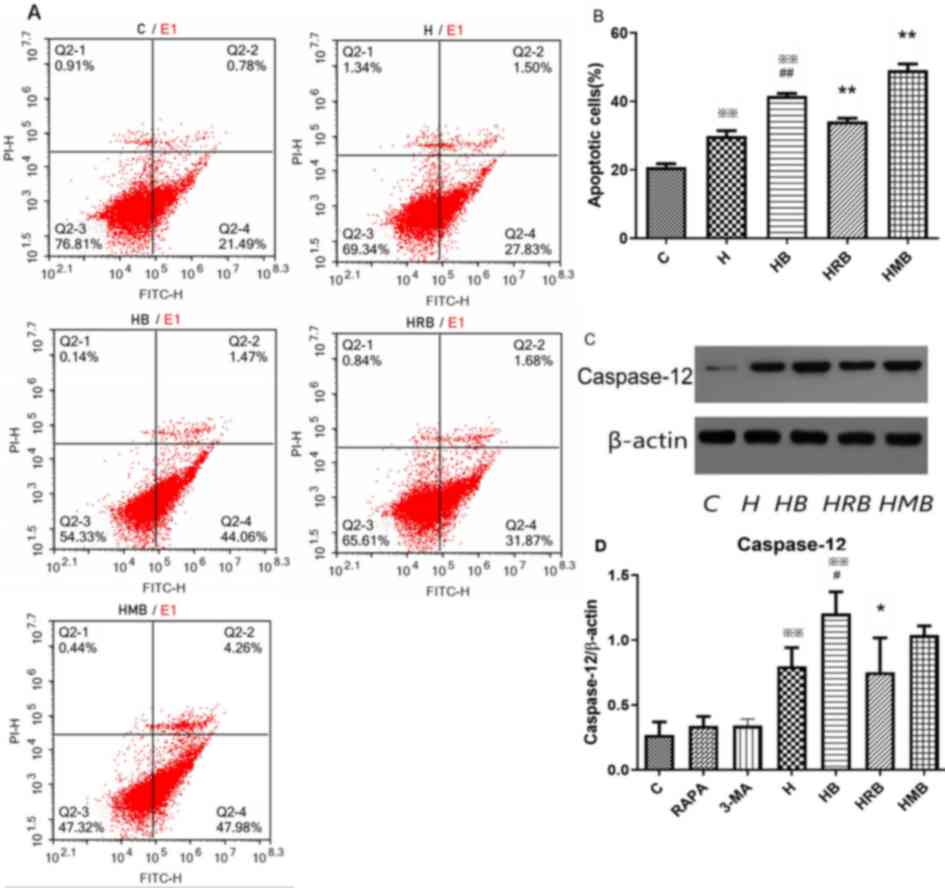 | Figure 7.Cell apoptosis and caspase-12 protein
expression during autophagy in SH-SY5Y cells. (A and B) Annexin
V-FITC/PI staining demonstrating the apoptotic rate at day 2 after
treatment with 0.5, 0.6, 0.8 and 1.0 mM bupivacaine. (C)
Representative western blot analysis images. (D) Protein expression
quantification. Data are expressed as the mean ± standard
deviation. N=4/group. ※※P<0.01 vs. C;
#P<0.05, ##P<0.01 vs. H; *P<0.05,
**P<0.01 vs. HB. C, control group; H, high glucose group; HB,
high glucose + bupivacaine group; HRB, high glucose + RAPA +
bupivacaine group; HMB, high glucose + 3-MA + bupivacaine group;
PI, propidium iodide; RAPA, rapamycin. |
In addition, caspase-12 expression, a key apoptosis
factor, was measured via western blot analyses (Fig. 7C). Neither RAPA nor 3-MA alone
affected protein expression of caspase-12 protein expression under
normal conditions. Caspase-12 protein expression was significantly
higher in the H and HB groups compared with the control group (all
P<0.01), with higher levels in the HB group compared with the H
group (P<0.05). Compared with the HB group, caspase-12 protein
expression was significantly lower in the HRB group (0.75±0.27%),
but not in the HMB group.
Discussion
The present study demonstrated that bupivacaine
significantly inhibited autophagy in response to high glucose,
potentially by activating PERK-ATF4-CHOP signaling and inhibiting
IRE1-TRAF2 signaling, which resulted in cell apoptosis due to an
imbalance in signaling pathways during the ERS. The autophagy
inducer RAPA significantly restored the level of autophagy,
decreased cell apoptosis, and reversed high glucose and
bupivacaine-induced enhancement of PERK-ATF4-CHOP signaling and
impaired IRE1-TRAF2 signaling. The autophagy inhibitor 3-MA led to
a greater imbalance between PERK-ATF4-CHOP and IRE1-TRAF2
signaling, resulting in increased apoptosis.
The present study investigated high glucose and
bupivacaine-induced cytotoxicity and apoptosis in the SH-SY5Y
neuroblastoma cell line, as has been previously reported (11). A previous study demonstrated
typical changes in cell morphology under diabetic conditions, and
altered expression of a variety of proteins in SH-SY5Y cells
subjected to 30 mM glucose for 2 weeks (38). In the present study, cell viability
markedly decreased in the 40 and 50 mM glucose groups compared with
the control group at day 3, but only the 50 mM glucose group had
lower cell viability compared with the mannitol group. Based on
these findings, cytotoxicity was primarily induced by high levels
of glucose and not by hyperosmosis. As a result, 50 mM glucose was
used to induce cytotoxicity in a relatively short period of time.
Furthermore, a previous study demonstrated that a higher level of
glucose is necessary to induce cytotoxicity in SH-SY5Y cells in
vitro when compared with in vivo conditions (11).
During ERS, the UPR is activated to maintain
endoplasmic reticulum hemostasis by decreasing the synthesis of new
proteins and accelerating the degradation of misfolded or unfolded
proteins (39). ERS-induced
autophagy was inhibited by knocking down PERK-eIF2α, IRE1 or TRAF2,
indicating the essential role that the PERK-eIF2α-ATF4-CHOP and
IRE1-TRAF2 signaling pathways play in autophagy (40). Whether cells become apoptotic
depends on the degree of external stimuli and activation of
signaling pathways in the UPR (41). Both PERK and IRE1 signaling
pathways are activated in acute ERS, but the duration of activation
of key factors in these pathways differs (41). Activating the IRE1 signaling
pathway and prolonging its duration promotes cell survival, while
the activation of the PERK signaling pathway induces apoptotic cell
death (41). IRE1 activation has
been demonstrated to rapidly decrease within 8 h, with ATF6
activation slightly delayed and PERK activation persisting for 30 h
in acute ERS (41). During the
UPR, signaling is disrupted, autophagy is inhibited and cell
apoptosis is activated (41).
Caspase-12 is initially activated in the ERS-induced cell apoptotic
cascade, which activates downstream apoptotic proteins, including
caspase-9 and caspase-3, ultimately leading to cell apoptosis
(34,35).
In the present study, cells were treated with high
glucose for 24 h followed by bupivacaine for 24 h, which resulted
in chronic ERS. In response to high glucose, bupivacaine altered
the imbalance of intracellular UPR signals, specifically between
activation of PERK-eIF2α-ATF4-CHOP signaling and inhibition of IRE1
signaling. Caspase-12 expression was increased, indicative of cell
apoptosis. Consistently, the results of the present study
demonstrated that the proapoptotic PERK signaling pathway was
activated, and the protective IRE1 signaling pathway was inhibited
during high glucose and bupivacaine treatment, which eventually led
to apoptosis.
Autophagy is a protective mechanism that maintains
endoplasmic reticulum homeostasis and provides energy to the body
by digesting proteins, organelles and other dysfunctional
components (42). It was revealed
that autophagy was inhibited when cells were treated with
bupivacaine in a high-glucose environment. The autophagy pathway
requires proteins encoded by the autophagy gene (Atg), of which
ubiquitin-like protein binding systems are involved, including the
Atg12-Atg5 binding system and the Atg8/LC3 lipidation system
(43). Atg8/LC3 is cleaved by
Atg4, which binds to the products of phosphatidylethanolamine. LC3
is then converted from its water-soluble form (LC3-I) to its
fat-soluble form (LC3-II). The latter can bind to the autophagosome
membrane until the fusion of the autophagosome with the lysosome
(44). LC3-II is stably expressed
on the autophagosome membrane during the generation and transport
of autophagic vacuoles, which is considered a reliable indicator of
autophagy. In addition to the UPR signaling, Ca2+
signaling is also involved in autophagy, which involves mammalian
target of RAPA (mTOR), and the phosphatidylinositol 3-kinase
(PI3K)/Akt and AMPK signaling pathways (45–47).
The results of the present study indicated that RAPA induced
autophagy, decreased cell apoptosis rates, inhibited PERK-ATF4-CHOP
signaling and enhanced IRE1-TRAF2 signaling. In contrast, 3-MA
inhibited autophagy and increased apoptosis, resulting in a further
imbalance between the two signaling pathways.
There are a number of limitations to the present
study. First, PERK and IRE1 signaling pathways were detected
immediately after 24 h high glucose and 24 h bupivacaine treatment,
without collecting data at other time points or without measuring
ATF6 signaling. Secondly, the role of autophagy in high glucose and
bupivacaine-treated cells was only investigated using one autophagy
inducer and inhibitor, respectively. Finally, the interactions
between key factors in the PERK-ATF4-CHOP and IRE1-TRAF2 signaling
pathways were not assessed in the present study. Further studies to
address these limitations are under way.
In the present study, bupivacaine induced
cytotoxicity in SH-SY5Y cells under high glucose conditions. This
effect was, at least in part, mediated by enhancing cell apoptosis
and inhibiting autophagy via the PERK-ATF4-CHOP and IRE1-TRAF2
signaling pathways. The data from the present study suggest that
interventions targeting the key factors in these signaling pathways
may have important therapeutic potential to decrease
bupivacaine-induced cytotoxicity.
Acknowledgements
Not applicable.
Funding
The present study was supported by funds from the
China Postdoctoral Science Foundation Grant (grant no. 2016M592962)
and Beijing Science and Technology Plan (grant nos.
Z171100000417035 and Z161100000116074).
Availability of data and materials
The datasets used and/or analyzed during the current
study are available from the corresponding author upon reasonable
request.
Authors' contributions
MG, LSh and YL designed the study. LSu, YM and BW
performed the experiments. YL and LSu wrote the manuscript. YM
performed the statistical analyses. All authors have read and
approved the final manuscript.
Ethics approval and consent to
participate
Not applicable.
Patient consent for publication
Not applicable.
Competing interests
The authors declare that they have no competing
interests.
References
|
1
|
Al-Nasser B: Toxic effects of epidural
analgesia with ropivacaine 0.2% in a diabetic patient. J Clin
Anesth. 16:220–223. 2004. View Article : Google Scholar : PubMed/NCBI
|
|
2
|
Moen V, Dahlgren N and Irestedt L: Severe
neurological complications after central neuraxial blockades in
Sweden 1990–1999. Anesthesiology. 101:950–959. 2004. View Article : Google Scholar : PubMed/NCBI
|
|
3
|
Capdevila X, Pirat P, Bringuier S,
Gaertner E, Singelyn F, Bernard N, Choquet O, Bouaziz H and Bonnet
F; French Study Group on Continuous Peripheral NerveBlocks, :
Continuous peripheral nerve blocks in hospital wards after
orthopedic surgery: A multicenter prospective analysis of the
quality of postoperative analgesia and complications in 1,416
patients. Anesthesiology. 103:1035–1045. 2005. View Article : Google Scholar : PubMed/NCBI
|
|
4
|
Lirk P, Birmingham B and Hogan Q: Regional
anesthesia in patients with preexisting neuropathy. Int Anesthesiol
Clin. 49:144–165. 2011. View Article : Google Scholar : PubMed/NCBI
|
|
5
|
Kalichman MW and Calcutt NA: Local
anesthetic-induced conduction block and nerve fiber injury in
streptozotocin-diabetic rats. Anesthesiology. 77:941–947. 1992.
View Article : Google Scholar : PubMed/NCBI
|
|
6
|
Blumenthal S, Borgeat A, Maurer K,
Beck-Schimmer B, Kliesch U, Marquardt M and Urech J: Preexisting
subclinical neuropathy as a risk factor for nerve injury after
continuous ropivacaine administration through a femoral nerve
catheter. Anesthesiology. 105:1053–1056. 2006. View Article : Google Scholar : PubMed/NCBI
|
|
7
|
Angadi DS and Garde A: Subclinical
neuropathy in diabetic patients: A risk factor for bilateral lower
limb neurological deficit following spinal anesthesia? J Anesth.
26:107–110. 2012. View Article : Google Scholar : PubMed/NCBI
|
|
8
|
Hebl JR, Kopp SL, Schroeder DR and
Horlocker TT: Neurologic complications after neuraxial anesthesia
or analgesia in patients with preexisting peripheral sensorimotor
neuropathy or diabetic polyneuropathy. Anesth Analg. 103:1294–1299.
2006. View Article : Google Scholar : PubMed/NCBI
|
|
9
|
Vincent AM, Brownlee M and Russell JW:
Oxidative stress and programmed cell death in diabetic neuropathy.
Ann N Y Acad Sci. 959:368–383. 2002. View Article : Google Scholar : PubMed/NCBI
|
|
10
|
Takahashi S, Izawa Y and Suzuki N:
Astroglial pentose phosphate pathway rates in response to
high-glucose environments. ASN Neuro. 4:e000782012. View Article : Google Scholar : PubMed/NCBI
|
|
11
|
Li L, Ye XP, Lu AZ, Zhou SQ, Liu H, Liu
ZJ, Jiang S and Xu SY: Hyperglycemia Magnifies Bupivacaine-Induced
Cell Apoptosis Triggered by Mitochondria Dysfunction and
Endoplasmic Reticulum Stress. J Neurosci Res. 91:786–798. 2013.
View Article : Google Scholar : PubMed/NCBI
|
|
12
|
Bursch W, Ellinger A, Kienzl H, Török L,
Pandey S, Sikorska M, Walker R and Hermann RS: Active cell death
induced by the anti-estrogens tamoxifen and in human mammary
carcinoma cells (MCF-7) in culture: The role of autophagy.
Carcinogenesis. 17:1595–1607. 1996. View Article : Google Scholar : PubMed/NCBI
|
|
13
|
Pearson GL, Mellett N, Chu KY, Cantley J,
Davenport A, Bourbon P, Cosner CC, Helquist P, Meikle PJ and Biden
TJ: Lysosomal acid lipase and lipophagy are constitutive negative
regulators of glucose-stimulated insulin secretion from pancreatic
beta cells. Diabetologia. 57:129–139. 2014. View Article : Google Scholar : PubMed/NCBI
|
|
14
|
Matsumoto H, Miyazaki S, Matsuyama S,
Takeda M, Kawano M, Nakagawa H, Nishimura K and Matsuo S: Selection
of autophagy or apoptosis in cells exposed to ER-stress depends on
ATF4 expression pattern with or without CHOP expression. Biol Open.
2:1084–1090. 2013. View Article : Google Scholar : PubMed/NCBI
|
|
15
|
Cebollero E, Reggiori F and Kraft C:
Reticulophagy and ribophagy: regulated degradation of protein
production factories. Int J Cell Biol. 2012:1828342012. View Article : Google Scholar : PubMed/NCBI
|
|
16
|
Hetz C: The unfolded protein response:
Controlling cell fate decisions under ER stress and beyond. Nat Rev
Mol Cell Biol. 3:89–102. 2012. View
Article : Google Scholar
|
|
17
|
Jäger R, Bertrand MJ, Gorman AM,
Vandenabeele P and Samali A: The unfolded protein response at the
crossroads of cellular life and death during endoplasmic reticulum
stress. Biol Cell. 104:259–270. 2012. View Article : Google Scholar : PubMed/NCBI
|
|
18
|
Kouroku Y, Fujita E, Tanida I, Ueno T,
Isoai A, Kumagai H, Ogawa S, Kaufman RJ, Kominami E and Momoi T: ER
stress (PERK/eIF2alpha phosphorylation) mediates the
polyglutamine-induced LC3 conversion, an essential step for
autophagy formation. Cell Death Differ. 14:230–239. 2007.
View Article : Google Scholar : PubMed/NCBI
|
|
19
|
Fujita E, Kouroku Y, Isoai A, Ueno T,
Isoai A, Kumagai H, Ogawa S, Kaufman RJ, Kominami E and Momoi T:
Two endoplasmic reticulum-associated degradation systems (ERAD) for
the novel variant of the mutant dysferlin; ubiquitin/proteasome
ERAD (I) and Autophagy/Lysosome ERAD (II). Hum Mol Genet.
16:618–629. 2007. View Article : Google Scholar : PubMed/NCBI
|
|
20
|
Scheuner D, Song B, McEwen E, Liu C,
Laybutt R, Gillespie P, Saunders T, Bonner-Weir S and Kaufman RJ:
Translational control is required for the unfolded protein response
and in vivo glucose homeostasis. Mol Cell. 7:1165–1176. 2001.
View Article : Google Scholar : PubMed/NCBI
|
|
21
|
Harding HP, Novoa I, Zhang Y, Zeng H, Wek
R, Schapira M and Ron D: Regulated translation initiation controls
stress-induced gene expression in mammalian cells. Mol Cell.
6:1099–1108. 2000. View Article : Google Scholar : PubMed/NCBI
|
|
22
|
Yoshida H, Matsui T, Yamamoto A, Okada T
and Mori K: XBP1 mRNA is induced by ATF6 and spliced by IRE1 in
response to ER stress to produce a highly active transcription
factor. Cell. 107:881–891. 2001. View Article : Google Scholar : PubMed/NCBI
|
|
23
|
Ron D and Hubbard SR: How IRE1 reacts to
ER stress. Cell. 132:24–26. 2008. View Article : Google Scholar : PubMed/NCBI
|
|
24
|
Back SH, Schroder M, Lee K, Zhang K and
Kaufman RJ: ER stress signaling by regulated splicing:
IRE1/HAC1/XBP1. Methods. 35:395–416. 2005. View Article : Google Scholar : PubMed/NCBI
|
|
25
|
Wang M and Kaufman RJ: The impact of the
endoplasmic reticulum protein-folding environment on cancer
development. Nat Rev Cancer. 14:581–597. 2014. View Article : Google Scholar : PubMed/NCBI
|
|
26
|
Tameire F, Verginadis II and Koumenis C:
Cell intrinsic and extrinsic activators of the unfolded protein
response in cancer: Mechanisms and targets for therapy. Semin
Cancer Biol. 33:3–15. 2015. View Article : Google Scholar : PubMed/NCBI
|
|
27
|
Oyadomari S and Mori M: Roles of
CHOP/GADD153 in endoplasmic reticulum stress. Cell Death Differ.
11:381–389. 2004. View Article : Google Scholar : PubMed/NCBI
|
|
28
|
Marciniak SJ, Yun CY, Oyadomari S, Novoa
I, Zhang Y, Jungreis R, Nagata K, Harding HP and Ron D: CHOP
induces death by promoting protein synthesis and oxidation in the
stressed endoplasmic reticulum. Genes Dev. 18:3066–3077. 2004.
View Article : Google Scholar : PubMed/NCBI
|
|
29
|
Zinszner H, Kuroda M, Wang XZ, Batchvarova
N, Lightfoot RT, Remotti H, Stevens JL and Ron D: CHOP is
implicated in programmed cell death in response to impaired
function of the endoplasmic reticulum. Genes Dev. 12:982–995. 1998.
View Article : Google Scholar : PubMed/NCBI
|
|
30
|
Davis RJ: Signal transduction by the JNK
group of MAP kinases. Cell. 103:239–252. 2000. View Article : Google Scholar : PubMed/NCBI
|
|
31
|
Dhanasekaran DN and Reddy EP: JNK
signaling in apoptosis. Oncogene. 27:6245–6251. 2008. View Article : Google Scholar : PubMed/NCBI
|
|
32
|
Hollien J, Lin JH, Li H, Stevens N, Walter
P and Weissman JS: Regulated Ire1-dependent decay of messenger RNAs
in mammalian cells. J Cell Biol. 186:323–331. 2009. View Article : Google Scholar : PubMed/NCBI
|
|
33
|
Tay KH, Luan Q, Croft A, Jiang CC, Jin L,
Zhang XD and Tseng HY: Sustained IRE1 and ATF6 signaling is
important for survival of melanoma cells undergoing ER stress. Cell
Signal. 26:287–294. 2014. View Article : Google Scholar : PubMed/NCBI
|
|
34
|
Nakagawa T and Yuan J: Cross-talk between
two cysteine protease families: Activation of Caspase12 by calpain
in apoptosis. J Cell Biol. 150:887–894. 2000. View Article : Google Scholar : PubMed/NCBI
|
|
35
|
Lai E, Teodoro T and Volchuk A:
Endoplasmic Reticulum Stress: Signaling the Unfolded Proteinv
Response. Physiology. 22:193–201. 2007. View Article : Google Scholar : PubMed/NCBI
|
|
36
|
Nakagawa T, Zhu H, Morishima N, Li E, Xu
J, Yankner BA and Yuan J: Caspase12 mediates
endoplasmic-reticulum-specific apoptosis and cytotoxicity by
amyloid-beta. Nature. 403:98–103. 2000. View Article : Google Scholar : PubMed/NCBI
|
|
37
|
Rao RV, Hermel E, Castro-Obregon S, del
Rio G, Ellerby LM, Ellerby HM and Bredesen DG: Coupling endoplasmic
reticulum stress to the cell death program. Mechanism of Caspase
activation. J Biol Chem. 276:33869–33874. 2001. View Article : Google Scholar : PubMed/NCBI
|
|
38
|
Di Giulio AM, Lesma E, Germani E and Gorio
A: Inhibition of high glucose-induced protein mono-ADP-ribosylation
restores neuritogenesis and sodium-pump activity in SY5Y
neuroblastoma cells. J Neurosci Res. 57:663–669. 1999. View Article : Google Scholar : PubMed/NCBI
|
|
39
|
Walter P and Ron D: The unfolded protein
response: From stress pathway to homeostatic regulation. Science.
334:1081–1086. 2011. View Article : Google Scholar : PubMed/NCBI
|
|
40
|
Ogata M, Hino S, Saito A, Morikawa K,
Kondo S, Kanemoto S, Murakami T, Taniguchi M, Tanii I, Yoshinaga K,
et al: Autophagy is activated for cell survival after endoplasmic
reticulum stress. Mol Cell Biol. 26:9220–9231. 2006. View Article : Google Scholar : PubMed/NCBI
|
|
41
|
Lin JH, Li H, Yasumura D, Cohen HR, Zhang
C, Panning B, Shokat KM, Lavail MM and Walter P: IRE1 signaling
affects cell fate during the unfolded protein response. Science.
318:944–949. 2007. View Article : Google Scholar : PubMed/NCBI
|
|
42
|
Duffy A, Le J, Sausville E and Emadi A:
Autophagy modulation: A target for cancer treatment development.
Cancer Chemother Pharmacol. 75:439–447. 2015. View Article : Google Scholar : PubMed/NCBI
|
|
43
|
He C and Klionsky DJ: Regulation
mechanisms and signaling pathways of autophagy. Annu Rev Genet.
43:67–93. 2009. View Article : Google Scholar : PubMed/NCBI
|
|
44
|
Hailey DW, Rambold AS, Satpute-Krishnan P,
Mitra K, Sougrat R, Kim PK and Lippincott-Schwartz J: Mitochondria
supply membranes for autophagosome biogenesis during starvation.
Cell. 141:656–667. 2010. View Article : Google Scholar : PubMed/NCBI
|
|
45
|
Hoyer-Hansen M, Bastholm L, Szyniarowski
P, Mitra K, Sougrat R, Kim PK and Lippincott-Schwartz J: Control of
macro autophagy by calcium, calmodulin-dependent kinase
kinase-beta, and Bcl-2. Mol Cell. 25:193–205. 2007. View Article : Google Scholar : PubMed/NCBI
|
|
46
|
Taylor CW, Taufiq-Ur-Rahma n and Pantazaka
E: Targeting and clustering of IP3 receptors: Key determinants of
spatially organized Ca2+ signals. Chaos. 19:0371022009.
View Article : Google Scholar : PubMed/NCBI
|
|
47
|
Hyrskyluoto A, Reijonen S, Kivinen J,
Lindholm D and Korhonen L: GADD34 mediates cytoprotective autophagy
in mutant huntingtin expressing cells via the mTOR pathway. Exp
Cell Res. 318:33–42. 2012. View Article : Google Scholar : PubMed/NCBI
|