Introduction
Diffusion weighted images (DWIs) have been reported
useful for early diagnosis of tumors and cerebrovascular disorders
such as cerebral infarction in clinical practice for magnetic
resonance imaging (MRI) (1–3). The
apparent diffusion coefficient (ADC) map calculated from DWIs is
also used clinically, reflecting both free and restricted
diffusion. Free diffusion occurs in the absence of a physical
barrier and represents the normal distribution of water molecules
spreading during a certain time. Restricted diffusion occurs with
barriers such as membranes and multiple compartments in living
organisms (4).
Recent techniques such as diffusion kurtosis imaging
(DKI) (5,6), which analyze the movement of water
molecules in restricted diffusion, have been reported. DKI shows
restricted diffusion as an index of kurtosis, indicating the degree
of deviation from the normal distribution. Recent clinical research
indicates that DKI is useful to diagnose acute stage cerebral
infarction, glioma, Alzheimer's disease, Parkinson's disease,
attention deficit hyperactivity disorder, multiple sclerosis,
temporal lobe epilepsy, traumatic brain injury and spinal cord
lesions (7–20). Among restricted diffusion imaging
techniques, DKI has advantages such as high specificity for
restricted diffusion; a small number of b-values, which results in
a relatively short imaging time; and quantitative capability.
However, it has disadvantages such as the difficulty to understand
intuitively the value of the kurtosis, due to the lack of
assumption of the biophysical model; the variation in the kurtosis
depending on the range of the b-value; and the requirement for
specialized software for DKI. For the above reasons, DKI has not
been used in routine clinical practice.
The present study developed a novel method to
visualize restricted diffusion differently from DKI. Two ADC values
with different diffusion times were used, and the difference
between them was calculated. This method was referred to as
‘apparent diffusion coefficient (ADC) subtraction method (ASM)’.
The purpose of the present study was to compare ASM and DKI in
order to examine whether ASM can reveal restricted diffusion using
a cell-containing bio-phantom that was developed by our group.
Materials and methods
Phantom container
A microcuvette (halbmikro 1.5 ml; Greiner
Labortechnik Manufacturing Ltd., Greiner, Germany) was installed in
a phantom container that had an outer diameter of 9.5 cm in length,
14 cm in width and 7 cm in height (21). The interior of the container was
filled with physiological saline (0.9% NaCl).
Bio-phantom
As bio-phantom, Jurkat cells were used, which were
purchased from Bio Resource Center (Tsukuba, Japan). For cell
culture, 10% fetal bovine serum (Filtron Pty Ltd., Victoria,
Australia) and 1% penicillin-streptomycin-neomycin (Gibco; Thermo
Fisher Scientific, Inc., Waltham, MA, USA) were added to RPMI-1640
medium (pH 7.4; Gibco; Thermo Fisher Scientific, Inc.). The
incubation was carried out at 37°C with 5% CO2. The
number of cells with a diameter >8 µm was counted with an
electric cell counter (Coulter Electronics Ltd., Luton, UK) prior
to bio-phantom preparation, since the diameter of the majority of
Jurkat cells is >8 µm, with the mean diameter being 9.6 µm
(22). The Jurkat cells were
encapsulated into bio-phantoms as previously described (22). Briefly, upon measuring the cell
number, the cell solution was concentrated to ~0.89 ml, placed in a
micro-cuvette (halbmikro 1.5 ml; Greiner Labortechnik Manufacturing
Ltd.) and centrifuged at 161 × g for 5 min. Next, the supernatant
was removed and the cell density was adjusted to
~1-8×10⁸ cells/ml. Upon treatment, the cells were
enclosed in gellan gum (P-8169; Sigma-Aldrich; Merck KGaA,
Darmstadt, Germany). Two types of bio-phantom were prepared. One
was a pellet-like high cell density phantom, and the other was a
low cell density phantom fixed with gellan gum. Each bio-phantom
was enclosed in a phantom container.
MRI device, image analysis software
and statistical analysis software
A 3.0T MRI system (MAGNETOM Prisma VE11C; Siemens
AG, Munich, Germany) was used, which had a 20-channel head/neck
coil. The image analysis software used was Image J (National
Institutes of Health, Bethesda, MD, USA) (23). The DKI image analysis software used
was diffusional kurtosis estimator (DKE) version 2.6 (24). Statcel4, which is an add-in of
Excel (Microsoft Corporation, Redmond, WA, USA) was used for
statistical analysis.
Bio-phantom heating device
A phantom container was installed in a
self-constructed bio-phantom heating device, which was formed of
ethylene-vinyl acetate copolymer and was connected to a circulating
thermostatic chamber (Thermo-Mate BF-41; Yamato Scientific Co.,
Ltd., Tokyo, Japan). The temperature of the bio-phantom was
adjusted to ~37°C, similarly to human body temperature.
Temperature measurement during
MRI
For real-time phantom temperature measurements, an
optical fiber thermometer (Fluoroptic™ m3300, Luxtron Co., Santa
Clara, CA, USA) was installed in the micro-cuvette during MRI.
Imaging conditions
Table I shows the
imaging conditions of DKI and ASM. In DKI, single shot-echo planar
imaging (SS-EPI) (25) was used in
three sequences of DKI-1, DKI-2 and DKI-3. In ASM, two types of
readout segmentation of long variable echo-trains (RESOLVE)
(26) sequences were used, namely
RESOLVE-basic and RESOLVE-modify. Two types of DWI were obtained
for ASM by changing the number of b-values. For RESOLVE-basic, the
b-values were set to 3 points: 0, 500 and 1,000 sec/mm2.
For RESOLVE-modify, the b-values were set to 4 points: 0, 500,
1,000 and 10,000 sec/mm2 (Table I). Since the number of b-values was
different, the δ [motion probing gradient (MPG) pulse duration] and
Δ (MPG pulse spacing) of both sequences changed. In the formula
used to calculate b-values (Equation 1), ‘Δ-δ/3’ is called the
effective diffusion time and represents the time during which
diffusion phenomena are observed.
 | Table I.Imaging conditions of diffusion
kurtosis imaging and ASM. |
Table I.
Imaging conditions of diffusion
kurtosis imaging and ASM.
|
| ASM | DKI |
|---|
|
|
|
|
|---|
| Parameters | RESOLVE-basic | RESOLVE-modify | DKI-1 | DKI-2 | DKI-3 |
|---|
| TR (msec) | 8,000 | 8,000 | 6,000 | 6,000 | 6,000 |
| TE (msec) | 86 | 106 | 75 | 75 | 75 |
| ES (msec) | 0.56 | 0.56 | 0.93 | 0.93 | 0.93 |
| FOV (mm) | 120 | 120 | 120 | 120 | 120 |
| Matrix | 224×224 | 224×224 | 82×82 | 82×82 | 82×82 |
| BW (Hz/pixel) | 399 | 399 | 1,220 | 1,220 | 1,220 |
| Averages | 2 | 2 | 1 | 1 | 9 |
| Segments | 7 | 7 | 1 | 1 | 1 |
| Slice thickness
(mm) | 5 | 5 | 5 | 5 | 5 |
| Slice number | 1 | 1 | 5 | 5 | 5 |
| Phase
direction | AP | AP | AP | AP | AP |
| δ (msec) | 5.6 | 15.6 | 13.8 | 13.8 | – |
| Δ (msec) | 41.2 | 51.2 | 33.5 | 33.5 | – |
| Diffusion time
(msec) | 39.3 | 46.0 | 28.9 | 28.9 | – |
| b-value
(sec/mm2) | 0,500,1,000 |
0,500,1,000,10,000 | 0,500,1,000 | 0,500,1,000 | 0 |
| Diffusion
direction | 3 | 3 | 30 | 30 | – |
| Imaging time
(min:sec) | 13:28 | 19:06 | 6:24 | 6:24 | 1:12 |
b=γ2G2δ2(Δ-δ/3)
In the above formula, γ is the gyromagnetic ratio of
protons and G is the gradient magnetic field strength. The
effective diffusion time of RESOLVE-basic and RESOLVE-modify were
39.3 and 46.0 msec, respectively. The extension of the effective
diffusion time has an upper limit. The effective diffusion time of
this modification sequence is elongated until this limit. Imaging
of both DKI and ASM was performed 5 times for the high cell density
phantom and 9 times for the low cell density phantom.
Image processing of DKI
DKI image analysis software DKE version 2.6 is
published on the website of the Medical University of South
Carolina (http://academicdepartments.musc.edu/cbi//dki). The
DWIs obtained by imaging of DKI-1, DKI-2 and DKI-3 were processed
with DKE to prepare a mean kurtosis (MK) image (Equation 2), which
is a mean in the spatial direction. By interpolated processing, the
voxel size of the MK image becomes 1.0×1.0×1.0 mm.
S=S0*exp(-b*ADC+b2*ADC2*MK/6)
In the above formula, S is signal intensity and
S0 is the signal intensity when the b-value is 0
sec/mm2. The b-values used are shown in Table I.
Image processing of ASM
The ADC values (ADCb and ADCm)
were calculated for RESOLVE-basic using the 3 b-values: 0, 500 and
1,000 sec/mm2, and for RESOLVE-modify using the above 3
b-values from 0 to 1,000 without 10,000 sec/mm2. The
formula used to calculate ASM is shown in Equation 3. As the
variation of ADC values increases when ADC values are high, the
absolute difference between ADC values (ADCb and
ADCm) is divided by ADCb value three times in
ASM to adjust the variation of ADC values.
ASM=|ADCb-ADCm|/(ADCb)3
Image evaluation
Regarding the MK image, the MK values were
determined from three regions of interest (ROI) of 1×4 pixels in
the cell part inside the bio-phantom, and from ROIs of the same
size in 6 areas of the physiological saline portion inside the
phantom container. With regard to ASM, the signal intensity was
determined from four ROIs of 3×3 pixels selected in the cell part
of the bio-phantom. For DWI, each b-value was obtained from the
imaging of RESOLVE-basic and RESOLVE-modify. The signal intensity
was also determined from 8 same-sized ROIs located in the
physiological saline portion of the phantom container. Each signal
intensity value was logarithmically transformed. Then, the ADC
value for each ROI was calculated from the inverse of the slope and
the ASM value was calculated using Equation 3.
Regarding the ADCb, MK and ASM values, a
multiple comparison test using the Steel-Dwass method was performed
at a significance level of 5% between saline, low cell density
phantom and the highest cell density phantom.
The total number of ROIs used for the calculation of
the ADC and ASM values were 112 for physiological saline, 36 for
low cell density phantom and 20 for the highest cell density
phantom. The values used for the calculation of MK values were 84
for normal saline, 27 for low cell density phantom and 15 for the
highest cell density phantom.
Results
The mean temperature and SD inside the bio-phantom
during imaging were 37.2±0.7°C. The cell densities of the low cell
density phantom and the highest cell density phantom were
1.21×10⁸ and 7.41×10⁸ cells/ml, respectively.
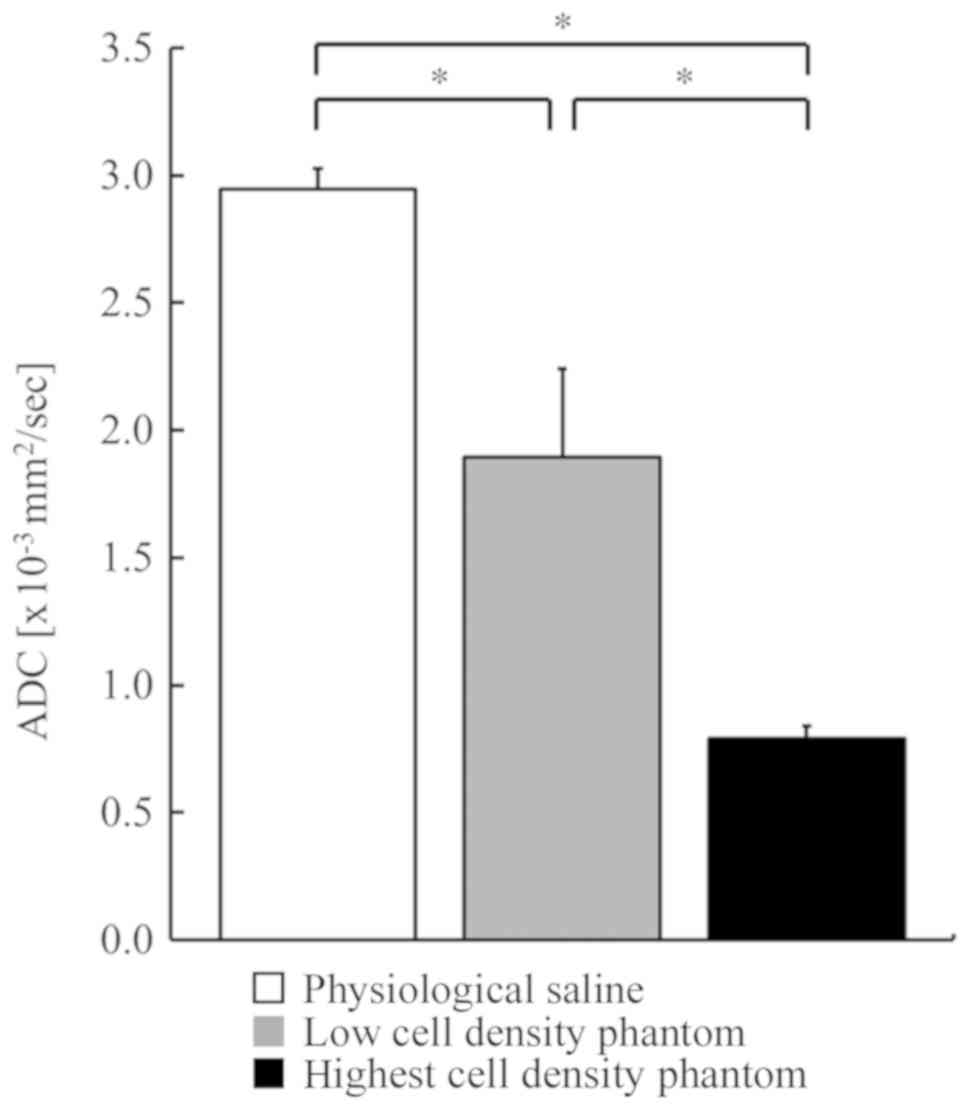
The mean ADCb and SD values of physiological saline, low
cell density phantom and the highest cell density phantom were
2.95±0.08×10⁻³, 1.90±0.35×10⁻³ and
0.79±0.05×10⁻³ mm2/sec, respectively
(Fig. 1). As the cell density
increased, the ADCb decreased. A significant difference
was observed using the Steel-Dwass method among the 3 groups. The
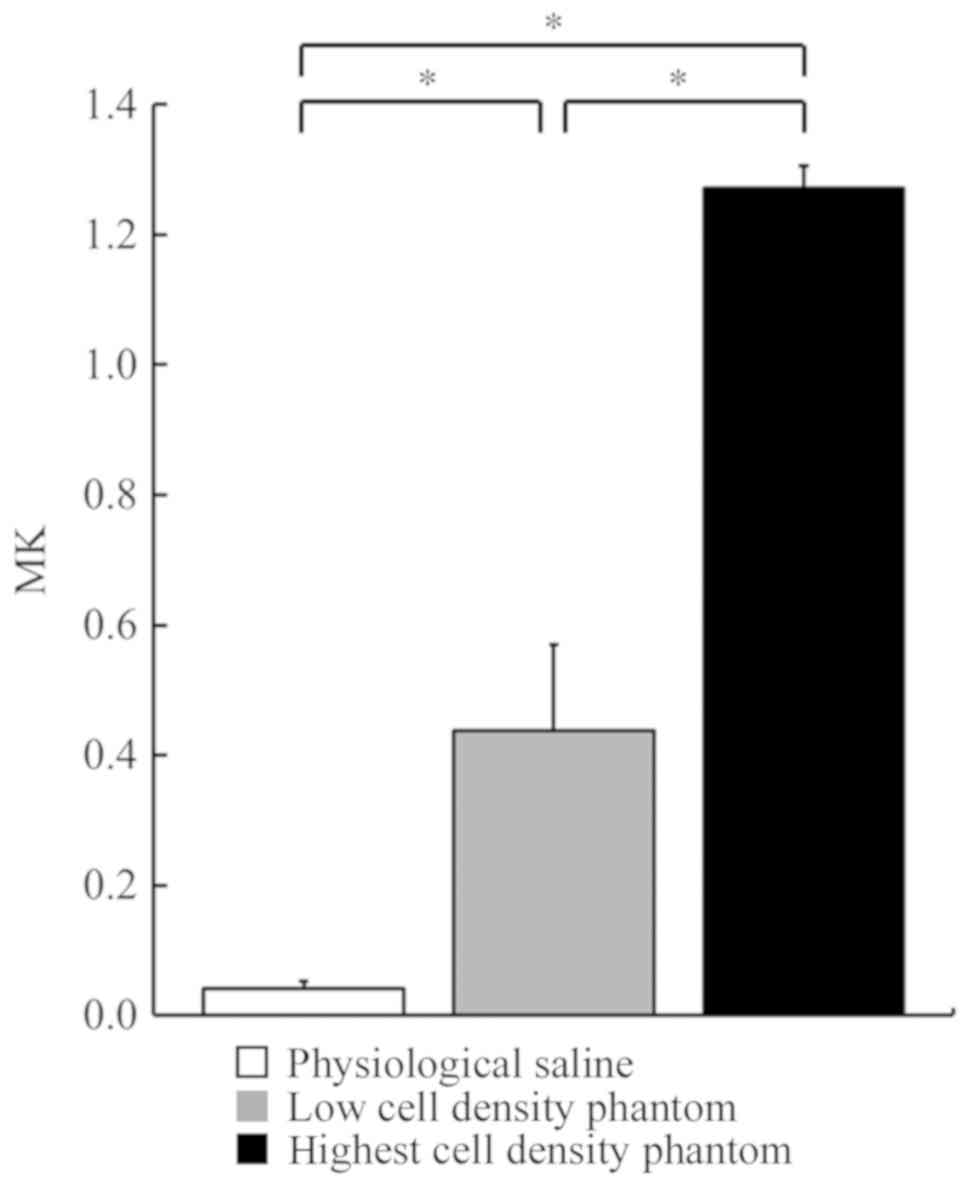
mean MK and SD values of physiological saline, low cell density
phantom and the highest cell density phantom were 0.04±0.01,
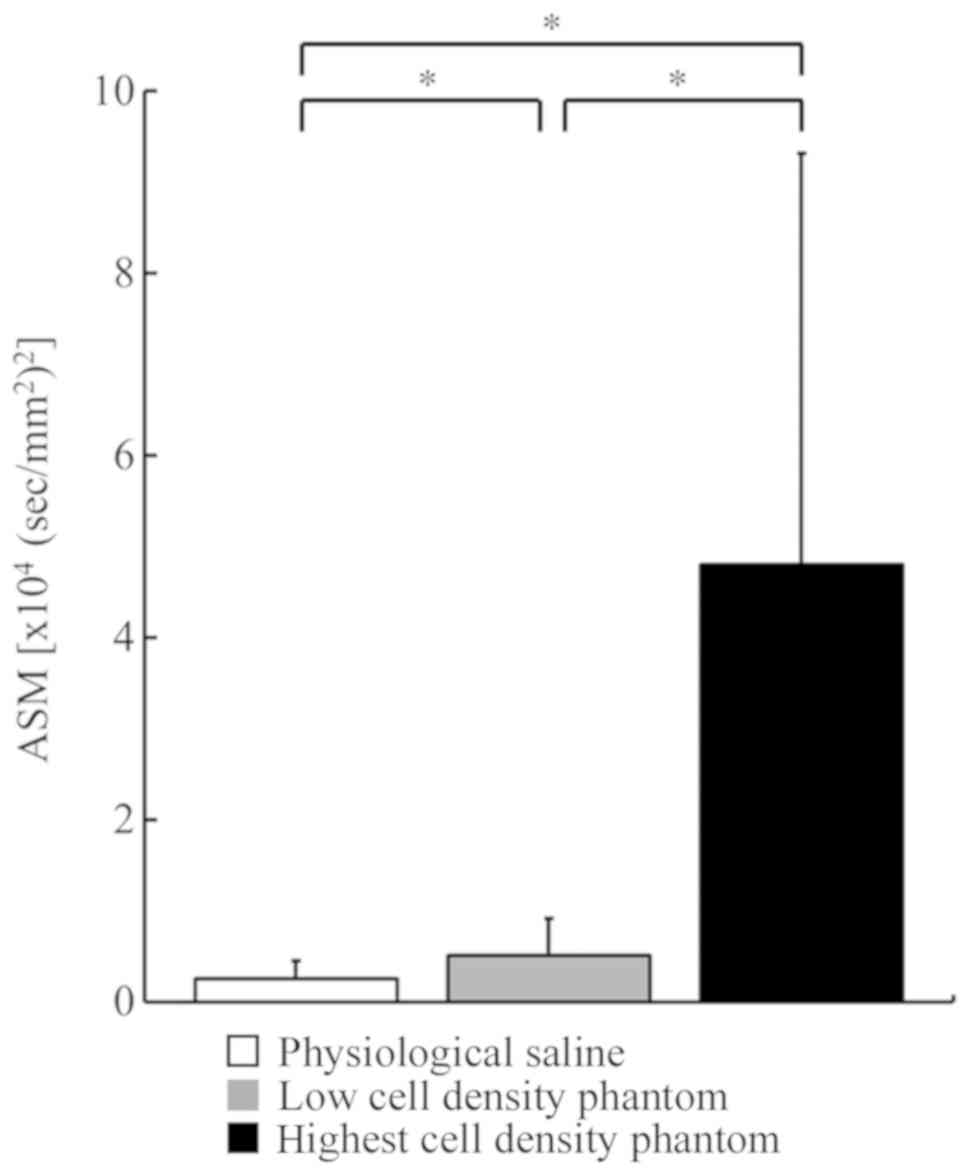
0.44±0.13 and 1.27±0.03, respectively (Fig. 2). The mean ASM and SD values of
physiological saline, low cell density phantom and the highest cell
density phantom were 0.25±0.20×10⁴,
0.51±0.41×10⁴ and 4.80±4.51×10⁴
(sec/mm2)2, respectively (Fig. 3). In contrast to the
ADCb, the MK and ASM values increased as the cell
density increased. Significant differences were observed among the
3 groups for both MK and ASM values.
Discussion
In the present study, a novel method named ASM was
developed and its usefulness was demonstrated experimentally.
DWI is widely used clinically. There are two types
of diffusion: Free and restricted, and both are represented by the
ADC value. In recent years, imaging techniques such as DKI, which
expresses restricted diffusion, have appeared and have been
reported to be useful in the clinic. However, the method of imaging
restricted diffusion is limited. In the present study, a novel
method named ASM was developed and its usefulness was demonstrated
experimentally. DKI is an imaging technique that quantitatively
reveals how water molecules deviate from free diffusion. DKI has
been reported to have more potential to evaluate the actual
microstructure in vivo than an ADC map (5,6).
Among restricted diffusion imaging techniques, DKI has advantages
such as high specificity for restricted diffusion; a small number
of b-values, which results in a relatively short imaging time; and
quantitative capability. Greater the b-values, the stronger the
diffusion weighting, the higher the contrast in pathogenic tissues.
In the present study, DKI, which is a diffusion analysis method of
non-normal distributions, was considered the standard to evaluate
restricted diffusion and was compared with ASM. Numerous clinical
studies using DKI have been reported. Hempel et al (27) observed a strong correlation between
the grade of glioma and the MK value, stating that the higher the
grade, the higher the MK value. Qi et al (28) also reported that the MK value
increases as the grade of glioma and cell density increase. Wu
et al (29) stated that the
ADC value increases, while the MK value decreases, as a result of
chemotherapy in cervical non-Hodgkin lymphoma. Wang et al
(30) reported that the ADC value
is low, while the MK value is high, in bladder tumors compared with
bladder inflammation. Barrett et al (31) also stated that ADC values are low
while MK values high in prostate cancer compared with normal
prostate tissue. These results were similar to those of our study
using bio-phantoms.
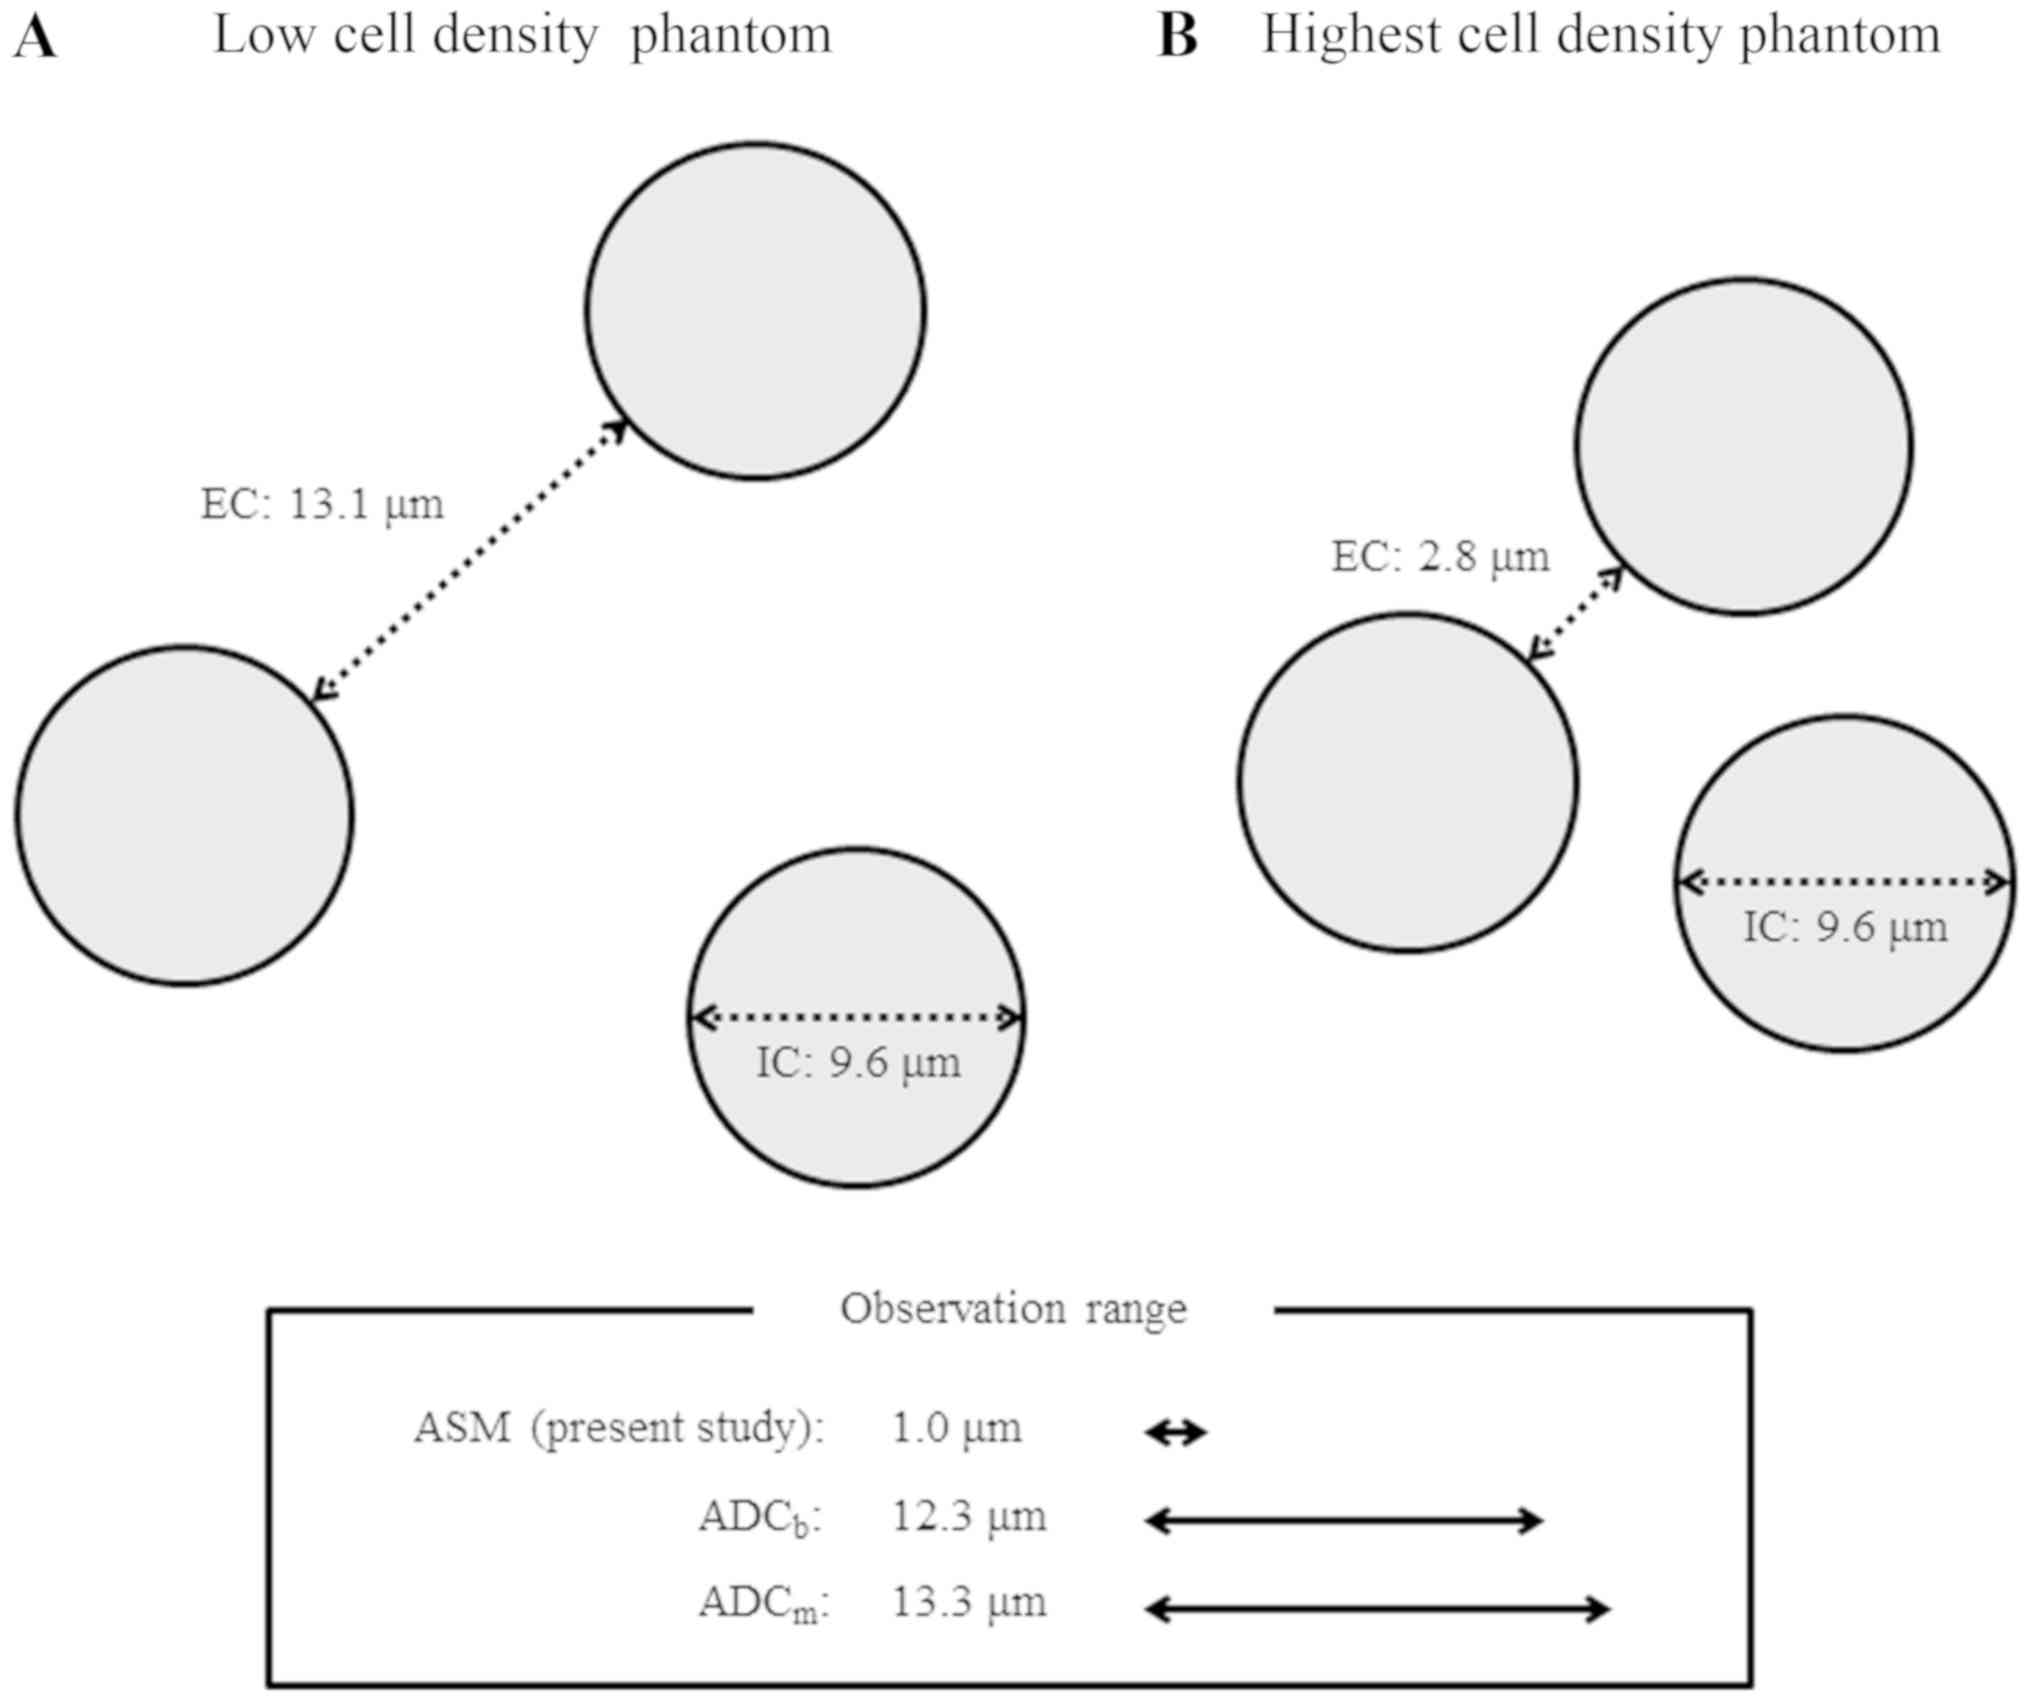
In the present study, the distance of the
extracellular space was calculated by Kepler conjecture (32), with cell densities of the low cell
density phantom and the highest cell density phantom of
1.21×10⁸ and 7.41×10⁸ cells/ml, respectively.
The Kepler conjecture is a mathematical theorem about sphere
packing in three-dimensional Euclidean space, which states that the
maximum volume of closely-packed equally-sized spheres is ~74.05%
of the total volume of the Euclidean space. The total volume of the
spheres in 1 ml is 0.7405 ml, which is 74.05%. Assuming that the
cell is a sphere, the volume of one sphere can be determined by
dividing the total volume of the spheres by the cell density. The
radius of the sphere is calculated from the volume of the sphere.
Since the cells are not closely packed in 1 ml, the calculated
radius of the sphere is larger than the actual cell radius.
Doubling the calculated radius of the sphere indicates the distance
between cell centers. The cell diameter minus this distance between
cell centers is defined as the distance between cell membranes
(extracellular space) to evaluate the volume of the extracellular
space. Since the cell diameter used in the present study is 9.6 µm
(22), the distance of the
extracellular space of the low cell density phantom is 13.1 µm,
while that of the maximum cell density phantom is 2.8 µm (Fig. 4). The size of the intracellular
space is the cell diameter, i.e. 9.6 µm.
The observation range of the diffusion phenomenon
was calculated from the used effective diffusion time. This range
changes according to the effective diffusion time. The subtraction
of two ADC values via ASM, obtained using different diffusion
times, may enable to observe diffusion phenomena in a narrow space.
Although the ADC value itself may reflect both free and restricted
diffusion, ASM may obtain information on restricted diffusion
between cell membranes. The effective diffusion times of
RESOLVE-basic and RESOLVE-modify are 39.3 and 46.0 msec,
respectively. The Stokes-Einstein equation (33) indicates that water diffusion at
37°C is 3.0×10⁻³ mm2/sec. The range of water
diffusion can be obtained by multiplying the ADC value of water,
which is 3.0×10⁻³ mm2/sec at 37°C, by the
effective diffusion time. Then, the diameter of the range of water
diffusion was calculated to be 12.3 and 13.3 µm for ADCb
using RESOLVE-basic and ADCm using RESOLVE-modify,
respectively. ASM may represent the difference between the two
diameters, a range of 1.0 µm (Fig.
4).
In our results, the higher the cell density and the
narrower the extracellular space, the lower was the ADC value, and
conversely, both MK and ASM values increased. Conventionally, DKI
is expected to be able to image restricted diffusion, and our data
also support that DKI reflects restricted diffusion in the
extracellular space. Similarly, ASM may express the extent of
restricted diffusion in the extracellular space.
In the present study, the imaging time of ASM (32.5
min in total) was longer than that of DKI (14 min in total). The
image quality of DKI is lower than that of ASM. RESOLVE, used in
ASM, is reported to improve image quality without distortion and
make ADC values accurate (21).
The reason for the length of the imaging time of current ASM is the
high resolution and the high number of averages and segments to
improve the image quality of ASM. If the image quality of ASM is
set to be the same as that of DKI, the imaging time of ASM
decreases to ~6 min, which is shorter than that of DKI. In the
future, it is necessary to develop an ASM sequence for clinical
research that shortens the imaging time while maintaining the image
quality.
In ASM using RESOLVE-basic and RESOLVE-modify, the
present study did not explore the effect of varying each effective
diffusion time. If each effective diffusion time used in ASM
differs, the degree of restricted diffusion may change. However,
the 3.0T devices commonly used clinically have limitations in
regard to changing the range of diffusion time remarkably.
In conclusion, using bio-phantoms, the present study
clarified that DKI mainly reflects restricted diffusion in the
extracellular space. Similarly, ASM may reflect the extent of
restricted diffusion in the extracellular space. Future clinical
studies are expected to demonstrate the potential of ASM as a
useful tool for clinical imaging such as ADC maps.
Acknowledgements
Not applicable.
Funding
The present study was partially supported by
Grants-in-Aid for Scientific Research (grant nos. C22591335,
15K09924 and 19K0809801) from the Ministry of Health, Labour and
Welfare of Japan.
Availability of data and materials
The datasets used and/or analyzed during the current
study are available from the corresponding author on reasonable
request.
Authors' contributions
YY and MK conceived and designed the study,
processed the data and wrote the article. YY, MK, IS, AK, BOB, KH,
MB, NT, AK, TM, SO, SK and JA performed the experiments. IS, AK,
KH, MB and NT edited the article. All authors read and approved the
final version of the manuscript.
Ethics approval and consent to
participate
Not applicable.
Patient consent for publication
Not applicable.
Competing interests
The authors declare that they have no competing
interests.
References
|
1
|
Bammer R, Keeling SL, Augustin M,
Pruessmann KP, Wolf R, Stollberger R, Hartung HP and Fazekas F:
Improved diffusion-weight single-shot echo-planar imaging (EPI) in
stroke using sensitivity encoding (SENSE). Magn Reson Med.
46:548–554. 2001. View
Article : Google Scholar : PubMed/NCBI
|
|
2
|
Takahara T, Imai Y, Yamashita T, Yasuda S,
Nasu S and Van Cauteren M: Diffusion weighted whole body imaging
with background body signal suppression (DWIBS): Technical
improvement using free breathing, STIR and high resolution 3D
display. Radiat Med. 22:275–282. 2004.PubMed/NCBI
|
|
3
|
Nasu K, Kuroki Y, Nawano S, Kuroki S,
Tsukamoto T, Yamamoto S, Motoori K and Ueda T: Hepatic metastases:
Diffusion-weighted sensitivity-encoding versus SPIO-enhanced MR
imaging. Radiology. 239:122–130. 2006. View Article : Google Scholar : PubMed/NCBI
|
|
4
|
Hori M, Fukunaga I, Masutani Y, Taoka T,
Kamagata K, Suzuki Y and Aoki S: Visualizing non-Gaussian
diffusion: Clinical application of q-space imaging and diffusional
kurtosis imaging of the brain and spine. Magn Reson Med Sci.
11:221–33. 2012. View Article : Google Scholar : PubMed/NCBI
|
|
5
|
Jensen JH, Helpern JA, Ramani A, Lu H and
Kaczynski K: Diffusional kurtosis imaging: The quantification of
non-gaussian water diffusion by means of magnetic resonance
imaging. Magn Reson Med. 53:1432–1440. 2005. View Article : Google Scholar : PubMed/NCBI
|
|
6
|
Jensen JH and Helpern JA: MRI
Quantification of non-Gaussian water diffusion by kurtosis
analysis. NMR Biomed. 23:698–710. 2010. View Article : Google Scholar : PubMed/NCBI
|
|
7
|
Jensen JH, Falangola MF, Hu C, Tabesh A,
Rapalino O, Lo C and Helpern JA: Preliminary observations of
increased diffusional kurtosis in human brain following recent
cerebral infarction. NMR Biomed. 24:452–457. 2011. View Article : Google Scholar : PubMed/NCBI
|
|
8
|
Taoka T, Fujioka M, Sakamoto M, Miyasaka
T, Akashi T, Ochi T, Hori S, Uchikoshi M, Xu J and Kichikawa K:
Time course of axial and radial diffusion kurtosis of white matter
infarctions: Period of pseudonormalization. Am J Neuroradiol.
35:1509–1514. 2014. View Article : Google Scholar : PubMed/NCBI
|
|
9
|
Raab P, Hattingen E, Franz K, Zanella FE
and Lanfermann H: Cerebral gliomas: Diffusional kurtosis imaging
analysis of microstructural differences. Radiology. 254:876–881.
2010. View Article : Google Scholar : PubMed/NCBI
|
|
10
|
Van Cauter S, Veraart J, Sijbers J,
Peeters RR, Himmelreich U, De Keyzer F, Van Gool SW, Van Calenbergh
F, De Vleeschouwer S, Van Hecke W and Sunaert S: Gliomas: Diffusion
kurtosis MR imaging in grading. Radiology. 263:492–501. 2012.
View Article : Google Scholar : PubMed/NCBI
|
|
11
|
Gong NJ, Wong CS, Chan CC, Leung LM and
Chu YC: Correlations between microstructural alterations and
severity of cognitive deficiency in Alzheimer's disease and mild
cognitive impairment: A diffusional kurtosis imaging study. Magn
Reson Imaging. 31:688–694. 2013. View Article : Google Scholar : PubMed/NCBI
|
|
12
|
Wang JJ, Lin WY, Lu CS, Weng YH, Ng SH,
Wang CH, Liu HL, Hsieh RH, Wan YL and Wai YY: Parkinson disease:
Diagnostic utility of diffusion kurtosis imaging. Radiology.
261:210–217. 2011. View Article : Google Scholar : PubMed/NCBI
|
|
13
|
Kamagata K, Tomiyama H, Motoi Y, Kano M,
Abe O, Ito K, Shimoji K, Suzuki M, Hori M, Nakanishi A, et al:
Diffusional kurtosis imaging of cingulate fibers in Parkinson
disease: Comparison with conventional diffusion tensor imaging.
Magn Reson Imaging. 31:1501–1506. 2013. View Article : Google Scholar : PubMed/NCBI
|
|
14
|
Kamagata K, Tomiyama H, Hatano T, Motoi Y,
Abe O, Shimoji K, Kamiya K, Suzuki M, Hori M, Yoshida M, et al: A
preliminary diffusional kurtosis imaging study of Parkinson
disease: Comparison with conventional diffusion tensor imaging.
Neuroradiology. 56:251–258. 2014. View Article : Google Scholar : PubMed/NCBI
|
|
15
|
Adisetiyo V, Tabesh A, Di Martino A,
Falangola MF, Castellanos FX, Jensen JH and Helpern JA:
Attention-deficit/hyperactivity disorder without comorbidity is
associated with distinct atypical patterns of cerebral
microstructural development. Hum Brain Mapp. 35:2148–2162. 2014.
View Article : Google Scholar : PubMed/NCBI
|
|
16
|
Yoshida M, Hori M, Yokoyama K, Fukunaga I,
Suzuki M, Kamagata K, Shimoji K, Nakanishi A, Hattori N, Masutani Y
and Aoki S: Diffusional kurtosis imaging of normal-appearing white
matter in multiple sclerosis: Preliminary clinical experience. Jpn
J Radiol. 31:50–55. 2013. View Article : Google Scholar : PubMed/NCBI
|
|
17
|
Gao Y, Zhang Y, Wong CS, Wu PM, Zhang Z,
Gao J, Qiu D and Huang B: Diffusion abnormalities in temporal lobes
of children with temporal lobe epilepsy: A preliminary diffusional
kurtosis imaging study and comparison with diffusion tensor
imaging. NMR Biomed. 25:1369–1377. 2012. View Article : Google Scholar : PubMed/NCBI
|
|
18
|
Grossman EJ, Jensen JH, Babb JS, Chen Q,
Tabesh A, Fieremans E, Xia D, Inglese M and Grossman RI: Cognitive
impairment in mild traumatic brain injury: A longitudinal
diffusional kurtosis and perfusion imaging study. Am J Neuroradiol.
34:951–957. 2013. View Article : Google Scholar : PubMed/NCBI
|
|
19
|
Raz E, Bester M, Sigmund EE, Tabesh A,
Babb JS, Jaggi H, Helpern J, Mitnick RJ and Inglese M: A better
characterization of spinal cord damage in multiple sclerosis: A
diffusional kurtosis imaging study. AJNR Am J Neuroradiol.
34:1846–1852. 2013. View Article : Google Scholar : PubMed/NCBI
|
|
20
|
Hori M, Tsutsumi S, Yasumoto Y, Ito M,
Suzuki M, Tanaka FS, Kyogoku S, Nakamura M, Tabuchi T, Fukunaga I,
et al: Cervical spondylosis: Evaluation of microstructural changes
in spinal cord white matter and gray matter by diffusional kurtosis
imaging. Magn Reson Imaging. 32:428–432. 2014. View Article : Google Scholar : PubMed/NCBI
|
|
21
|
Yoshimura Y, Kuroda M, Sugianto I,
Bamgbose BO, Miyahara K, Ohmura Y, Kurozumi A, Matsushita T, Ohno
S, Kanazawa S and Asaumi J: The usefulness of Readout-segmented
echo-planar imaging (RESOLVE) for bio-phantom imaging using 3-tesla
clinical MRI. Acta Med Okayama. 72:53–59. 2018.PubMed/NCBI
|
|
22
|
Katashima K, Kuroda M, Ashida M, Sasaki T,
Taguchi T, Matsuzaki H, Murakami J, Yanagi Y, Hisatomi M, Hara M,
et al: In vitro assessment of factors affecting the apparent
diffusion coefficient of Jurkat cells using bio-phantoms. Acta Med
Okayama. 67:359–367. 2013.PubMed/NCBI
|
|
23
|
Schneider CA, Rasband WS and Eliceiri KW:
NIH image to ImageJ: 25 years of image analysis. Nat Methods.
9:671–675. 2012. View Article : Google Scholar : PubMed/NCBI
|
|
24
|
Tabesh A, Jensen JH, Ardekani BA and
Helpern JA: Estimation of tensors and tensor-derived measures in
diffusional kurtosis imaging. Magn Reson Med. 65:823–836. 2011.
View Article : Google Scholar : PubMed/NCBI
|
|
25
|
Stehling MK, Turner R and Mansfield P:
Echo-planar imaging: Magnetic resonance imaging in a fraction of a
second. Science. 254:43–50. 1991. View Article : Google Scholar : PubMed/NCBI
|
|
26
|
Porter DA and Heidemann RM: High
resolution diffusion-weighted imaging using readout-segmented
echo-planar imaging, parallel imaging and a two-dimensional
navigator-based reacquisition. Magn Reson Med. 62:468–475. 2009.
View Article : Google Scholar : PubMed/NCBI
|
|
27
|
Hempel JM, Schittenhelm J, Bisdas S,
Brendle C, Bender B, Bier G, Skardelly M, Tabatabai G, Castaneda
Vega S, Ernemann U and Klose U: In vivo assessment of tumor
heterogeneity in WHO 2016 glioma grades using diffusion kurtosis
imaging: Diagnostic performance and improvement of feasibility in
routine clinical practice. J Neuroradiol. 45:32–40. 2018.
View Article : Google Scholar : PubMed/NCBI
|
|
28
|
Qi C, Yang S, Meng L, Chen H, Li Z, Wang
S, Jiang T and Li S: Evaluation of cerebral glioma using 3T
diffusion kurtosis tensor imaging and the relationship between
diffusion kurtosis metrics and tumor cellularity. J Int Med Res.
45:1347–1358. 2017. View Article : Google Scholar : PubMed/NCBI
|
|
29
|
Wu R, Suo ST, Wu LM, Yao QY, Gong HX and
Xu JR: Assessment of chemotherapy response in non-Hodgkin lymphoma
involving the neck utilizing diffusion kurtosis imaging: A
preliminary study. Diagn Interv Radiol. 23:245–249. 2017.
View Article : Google Scholar : PubMed/NCBI
|
|
30
|
Wang F, Jin D, Hua XL, Zhao ZZ, Wu LM,
Chen WB, Wu GY, Chen XX and Chen HG: Investigation of diffusion
kurtosis imaging for discriminating tumors from inflammatory
lesions after treatment for bladder cancer. J Magn Reson Imaging.
48:259–265. 2018. View Article : Google Scholar : PubMed/NCBI
|
|
31
|
Barrett T, McLean M, Priest AN, Lawrence
EM, Patterson AJ, Koo BC, Patterson I, Warren AY, Doble A,
Gnanapragasam VJ, et al: Diagnostic evaluation of magnetization
transfer and diffusion kurtosis imaging for prostate cancer
detection in a re-biopsy population. Eur Radiol. 28:3141–3150.
2018. View Article : Google Scholar : PubMed/NCBI
|
|
32
|
Hales TC: A proof of the Kepler
conjecture. Ann Math. 162:1065–1185. 2005. View Article : Google Scholar
|
|
33
|
Einstein A: Investigations on the Theory
of the Brownian Movement. Fürth R: Dover Publ. Inc.; New York, NY:
pp. 811956
|