Introduction
Colorectal cancer (CRC) is the third most common
cancer worldwide (1). In CRCs,
30–50% carry KRAS mutations, most commonly in codon 12/13 (2), and 10–15% carry BRAF V600E mutations
(3). KRAS mutation, an independent
predictor of metastatic CRC, is associated with poor prognosis
(4–6). By activating the MAPK/ERK pathway,
KRAS mutation influences cell metabolism, increases proliferation,
and alters cell death. Similarly, BRAF V600E mutation results in
activation of the MAPK/ERK pathway and is highly associated with
poorly differentiated CRCs (5–8) and
poor prognosis in microsatellite stable CRC (9). However, the most essential biological
mechanisms concerning KRAS and BRAF mutation with adverse prognosis
are unknown.
Tumor cells show diverse aberrations in the
regulation of cell maturation and death mechanisms, which enable
uncontrolled growth and metastasis. Anoikis, a programmed cell
death mechanism activated in the absence of attachment of cells to
an appropriate matrix, is often disturbed in cancer. Inhibition of
anoikis during metastasis is an essential mechanism for the
formation of metastases (10–12).
Anoikis resistance, i.e. anchorage-independent survival of tumor
cells, may result from alterations in cell death mechanism, faulty
or absent integrin signaling, or through epithelial mesenchymal
transition (13,14). There is only limited information
available on the role of KRAS and BRAF mutations in anoikis
resistance. Among colorectal carcinoma cell lines, only HCT116
cells with inherent KRAS mutation are known to show anoikis
resistance (15,16). The downstream mechanisms involve
both inhibition of apoptosis by SRC activation (15) or downregulation of PHLPP1 and by
metabolic regulation (16).
Interestingly, codon 12 mutations induce higher level of
anchorage-independent survival compared to codon 13 mutations
(17), and associate most
evidently with adverse prognosis (18). BRAF mutation associates with
anoikis resistance in melanoma cell lines and in HT29 intestinal
cancer cells (15). BRAF induces
anoikis resistance by modulating Bad and Bim signaling in melanoma
cells (19,20), whereas in CRC cell lines, MCL1
upregulation via MEK/ERK signaling was identified as a factor for
anoikis resistance (21).
Despite the importance of anoikis resistance for
metastasis, there have not been many efforts to recognize and
quantitate anoikis-resistant subpopulations in actual human
cancers. We have recently identified tumor cell subpopulations,
such as micropapillary structures (MIPs) in human colorectal
carcinomas, which lack contact with the extracellular matrix (ECM)
but still show a lower apoptosis rate, indicating that these
structures represent an anoikis-resistant subpopulation (22). Interestingly, the low apoptosis
rate in these structures was associated with decreased patient
survival, supporting the concept that anoikis resistance detected
in pathological specimen is prognostically important. Further
supporting the importance of anoikis-resistant subpopulations in
CRC, we recently observed that abundance of anoikis-resistant
subpopulations of carcinoma cells as quantitated by histopathology
is an independent marker of adverse prognosis (unpublished).
Although we can study anoikis resistance in
vitro with several experimental settings (23–25),
these models lack structural relevance in terms of organization of
multicellular structures and interaction of cells as in actual
tumors (26–30). CRC cell line Caco-2 is a
well-characterized tumor cell line forming columnar epithelium-like
sheets in two-dimensional cultures, and has the ability to form
ball-like structures (cysts) with a fluid-filled lumen surrounded
by apical surfaces of epithelial cells in three-dimensional (3D)
cultures. KRAS G12V and BRAF V600E mutations induce additional
features in native Caco-2 cells such as increased proliferation,
alterations in apical-basal polarity, and enhanced migration and
invasion properties (31,32). Interestingly, such Caco-2 cells
with KRAS or BRAF mutations form solid cell clusters in 3D cultures
(31,32). Since the inner cells within such
clusters might be devoid of extracellular matrix, unlike the outer
cells, which rest in the semisolid 3D culture medium with ECM
(31,32), such cells in 3D cultures could
possibly serve as a model for the anoikis-resistant subpopulation
of carcinoma cells seen in actual human cancers. However, it is
unknown whether KRAS or BRAF mutations induce anoikis resistance in
Caco-2 cells.
To study the involvement of KRAS and BRAF mutations
in anoikis resistance in colorectal carcinoma cells in vitro
and to develop an in vitro model for multicellular clusters
occurring in actual carcinomas in vivo that corresponds to
anoikis resistance, we generated modified Caco-2 cell lines with
KRAS G12V or BRAF V600E mutations. We studied the growth patterns
of these cell lines in 3D cultures in vitro and in
suspension cultures for anoikis resistance and found evidence for
the emergence of anoikis resistance and for structural analogies
with anoikis-resistant populations in human CRC. Finally, we
evaluated the role of Bim in the anoikis resistance of Caco-2
cells.
Materials and methods
Transfection of Caco-2 cells with mutated
KRAS and BRAF
Production of retroviral
supernatants
Phoenix cells were cultured in 6-well cell culture
plates in DMEM media with 10% FBS and antibiotics at 37°C in 5%
CO2. At confluency, cells were transfected with Vsvg and
retroviral vectors (pQCXIP GFP, pQCXIP GFP-K-Ras V12 (G12V), pQCLAP
GFP-Braf-V600E) for retroviral production; the plasmids were a kind
gift from Professor Alan Hall, Memorial Sloan-Kettering Cancer
Center, New York, USA. In a 1.5 ml Eppendorf tube, (1 ml) OptiMEM
media per transfection with additional 50 µl Lipofectamine 2000
agent was prepared by gently mixing, followed by 5-min incubation
at room temperature. In another 1.5 ml tube, 24 µg of respective
retroviral vector and 2.5 µg of pVsVg envelope plasmid per
transfection were mixed in a 250 µl optimum tube. We incubated the
Lipofectamine mix combined with DNA for 20 min, added this mixture
dropwise on cells with gentle swirling, and placed the cells back
into 37°C incubator overnight. After harvesting viruses, we
collected the supernatant for two consecutive days in 15 ml tubes
to a total volume of 10 ml. For good viral titer, we concentrated
the supernatant by ultracentrifugation (16,500 rpm, 2 h, +4°C). The
pellet was carefully suspended in PBS and either used for
infections or stored at −80°C.
Infection and selection of cells
1.5×10⁵ Caco-2 cells (from ATCC) were
plated in 6-well cell culture plates (Corning) and infected with
concentrated virus supernatants supplemented with polybrene and
additional 500 yp of complete MEM medium. After infecting the cells
twice, we selected clones with respective antibiotic selection
(Puromycin 4 µg/ml, Sigma-Aldrich; G418-0.8 mg/ml, Merck) from the
third day post-infection. We sorted 20% stronger (Fluorescence mean
intensity) GFP positive clones with BD FACS Aria Illu (BD
Biosciences) with appropriate machine settings, plated them in 6
well plates and expanded. In addition, we assessed the presence of
BRAF and KRAS constructs in Caco2-BRAF and Caco2-KRAS cell lines by
western blot analysis with rabbit polyclonal anti-GFP antibody at
dilution 1:1,000 (A11122, Invitrogen, UK) and BRAFV600E mouse
monoclonal at dilution 1:1,000 (VE1, Roche Diagnostics,
Indianapolis, IN, USA) (Fig.
S1).
3D cell culture
Caco2-GFP cells (Caco2-control), Caco2-GFP cells
expressing KRAS G12V (Caco2-KRAS), and Caco-GFP cells expressing
BRAF V600E (Caco2-BRAF) were cultured in DMEM media supplemented
with sodium pyruvate (Sigma), 15% FBS, 1% antibiotics and 1% NEAA
(Sigma), referred to as DMEM complete medium, and cultured at 37°C
in 5% CO2. Cells were cultured in 3D cultures mainly as
described by Debnath et al (33) with addition of a mixture of
Matrigel and Collagen at a ratio of 4:1 instead of matrigel alone
as described by Magudia et al (32).
For live cell imaging of 3D structures, 35 mm glass
bottom dishes (Greiner Bio-One) were coated with 80% matrigel
(growth factor reduced, Sigma) and 20% Collagen 1 Rat tail (Life
Technologies) on ice. We plated 70,000 cells on pre-coated dishes
with 500 µl DMEM complete medium supplemented with 2% matrigel
(referred to as food). For fixed 10-day-old 3D structures, we
coated 4 well-chambered slides (Thermo Fisher Scientific) with 80%
matrigel and 20% collagen I mix on ice. We plated single cell
suspension of 104 cells on precoated slides with an
additional 200 µl of food. Food was added every second day to all
of the 3-D cultures.
Staining and imaging of 3D cell
cultures for microscopy
For live imaging, 3D structures grown in 35 mm glass
bottom dishes were washed once with media, incubated with complete
DMEM media with 1 mg/ml Hoechst 33342 dye (Thermo Scientific) at
37°C for 30 min, and transferred to illumination chamber of Zeiss
Spinning Disk Confocal microscope set at 37°C. Images were
collected with 0.6 um step size using 40X objective and excitation
wavelengths of 405 nm, EC Plan NeoFluor 40X/0.75 DIC air objective
and BP 450/50 nm (blue) emission filters. After imaging, we washed
the dye away from the cells, added fresh food to the dishes, and
replaced them in the incubators at 37°C. One dish was imaged for 2
consecutive days and then discarded to limit the effects of stress
on the cells during analysis. We collected images for 5–15 cysts
from each sample using a spinning-disk confocal microscope and
performed each experiment three times. We analyzed and exported
images with Huygens Pro, Zen software.
Imaging of fixed 3D structures
The 3D structures were grown for 10 days and fixed
with 2% paraformaldehyde (PFA) in PBS for 15 min blocked with 0.1%
BSA, 0.2% Triton X 100, 0.05% Tween and 10% FBS for 20 min and
incubated with TRITC-phalloidin (1:10, Invitrogen) and dapi
(1:1,000, Thermo Scientific) for 1 h. We mounted the specimens with
Immu-Mount (Thermo Fisher Scientific) after washes with PBS and
distilled water. We assessed the specimens with Olympus Flow view
Confocal Microscope and collected z-stack images with an Olympus
FluoView laser scanning confocal microscope using UPLSAPO 60×/1.35
oil immersion objective, and excitation wavelengths of 405 and 543
nm and appropriate emission filters were used for dapi and TRITC
phalloidin, respectively.
The 3D cell growths were classified as cysts if they
had an outer wall formed by a single layer of cells and a lumen
without cells or cell debris. The structures filled completely or
partially with cells without a clear lumen as in the cysts were
identified as solid growths or filled structures. Quantitation of
the structures was done manually using 20X objective by classifying
and counting 145–212 structures from fixed 3D specimens. The
proportion of 3D structures formed by each cell line was
calculated. We performed a minimum of three independent experiments
and used the average proportion for graphical representation.
Suspension culture for
anchorage-independent survival assay
To make an anchorage-independent surface, 0.5 g
poly-HEMA (Sigma) was added to 25 ml 95% ethanol, and the solution
was prepared by keeping the flask in 58°C water bath for 6 h and
mixing by shaking the flasks every 40–60 min. We plated dissolved
poly-HEMA solution in 10 cm bacterial cell culture dishes, spread
evenly and dried overnight under the laminar hood, followed by an
additional incubation under UV for 30 min. The prepared plates were
used directly for experiments or sealed with parafilm and stored at
4°C for up to one week.
For flow cytometry, we plated 1.0×10⁷
cells from single cell suspension obtained from trypsin treatment
on poly-HEMA coated dishes. After adding 9 ml of serum-free DMEM
medium plates were incubated at 37°C in an incubator. We performed
the apoptosis assay at two time points, 24 and 48 h. On the day of
Annexin V test, cells were washed twice with cold Biolegend's Cell
Staining Buffer (Biolegend, San Diego, CA, USA), and the pellet was
suspended in Annexin V binding buffer (Biolegend, San Diego, CA,
USA). For Annexin FACS assay, 100 ul cell suspension was pipetted
in a test tube with 5 µl BD HorizonTM V500 Annexin V (BD
Biosciences, Franklin Lake, NJ, USA), mixed by vortexing, and
incubated for 20 min in dark at room temperature. An additional 400
µl Annexin binding buffer (Biolegend, San Diego, CA, USA) was added
to the tubes, measured by BD LSR Fortessa (BD Biosciences, Franklin
Lakes, NJ, USA) flow cytometer, and analyzed by FACS Diva version
7.2 (BD Biosciences, Franklin Lakes NJ, USA) and FlowJo X software.
In addition, we estimated the cells at s-phase indicating
proliferative phase (34) using
Propidium iodide FACS assay from Caco-2 control cells and Caco2
cells with KRAS or BRAF mutations grown in suspension for 24 h.
Protein expression analysis
We sorted suspension cultures at 24 and 48 h for
Annexin-V negative cells by Flow cytometry (BD FACS Aria) and lysed
the cells by sonication in 1 ml radio immunoprecipitation assay
(RIPA) buffer consisting of 50 mM Tris-HCL (pH 7.4), 150 mM Nacl, 4
mM EDTA, 1% NP-40 (nonidet) and 0.1% SDS in 200 ml dH2O
with a cocktail of proteinase inhibitors. Lysates were incubated on
ice for 30 min with vortexing every 5 min and cleared by
centrifugation (10,000 g, 2 min, +4°C). We measured protein
concentration by Bradford protein assay (Bio-Rad). For western blot
analysis, equal amounts (20 µg) of protein samples were separated
on 15% SDS-PAGE and electro-blotted to Nitrocellulose membrane for
2 h at +4°C. We blocked the membrane in 5% skim milk in TBS-Tween
buffer (1 h) followed by washes with 1× TBS-T buffer and incubation
with primary antibody 1:1,000 (Bim Rabbit mAb, C34C5, cell
Signaling Technology; Mouse monoclonal Tubulin, 1:5,000) overnight
at +4°C. After washes, we incubated membranes in HRP conjugated
secondary antibody (anti-rabbit, 1:5,000; anti-mouse, 1:10,000) for
1.5 h. We then detected antigen by incubating the membrane for 2
min in detection solution comprising 250 mM Luminol, 90 mM Cumoric,
3 µl H2O2 in 10 ml 0.1 M Tris-HCL (pH 8.3),
exposed using a chemiluminescence Fuji-Las-3000 detection system
(FujiFilm, Minato, Tokyo, Japan). The bands were quantified with
Quantity One Analysis software and further calculations and graphs
were generated with Microsoft office applications. The Bim
expression band intensities were normalized by using those of
Tubulin, and fold changes of Bim expression as compared with the
expression level in native Caco-2 cells at 24 h were
calculated.
Paraffin embedding of 3D cell
cultures
For this experiment, we modified the protocol of
Pinto et al (35). 3D
structures were obtained from Caco 2-control, Caco 2-KRAS and Caco
2-BRAF cell lines cultured in 80% matrigel + 20% collagen gel mix
for 8 days. On the 8th day, we washed the cultures once with media.
The gel including the 3D cell structures within was detached with a
clean razor blade and placed in a cryomold pre-coated with 120 µl
hot agarose gel. We added an additional 120 µl hot agarose gel on
top of the specimen, forming a sandwich. The mold was placed on ice
to solidify, transferred into pathology cassettes, and fixed in 10%
formaldehyde overnight, and then washed with running water,
dehydrated with increasing alcohol concentration (70% ethanol, 96%
ethanol, 100% ethanol), xylene, and finally, embedded in paraffin.
The paraffin blocks were stored at room temperature until further
use.
For imaging and analysis of paraffin-embedded 3D
cultures, 4 µm sections were cut from the paraffin blocks and
stained with hematoxylin and eosin. We analyzed the slides manually
under a light microscope and recorded the observation.
Statistical analysis
We assessed significances of the differences between
the cell lines with ANOVA and used Tukeys correction in post hoc
analyses. We used IBM SPSS 25 (IBM, Armonk, NY, USA).
Results
Transfection with mutated KRAS or BRAF
influences morphology of 3D structures of Caco-2 cells
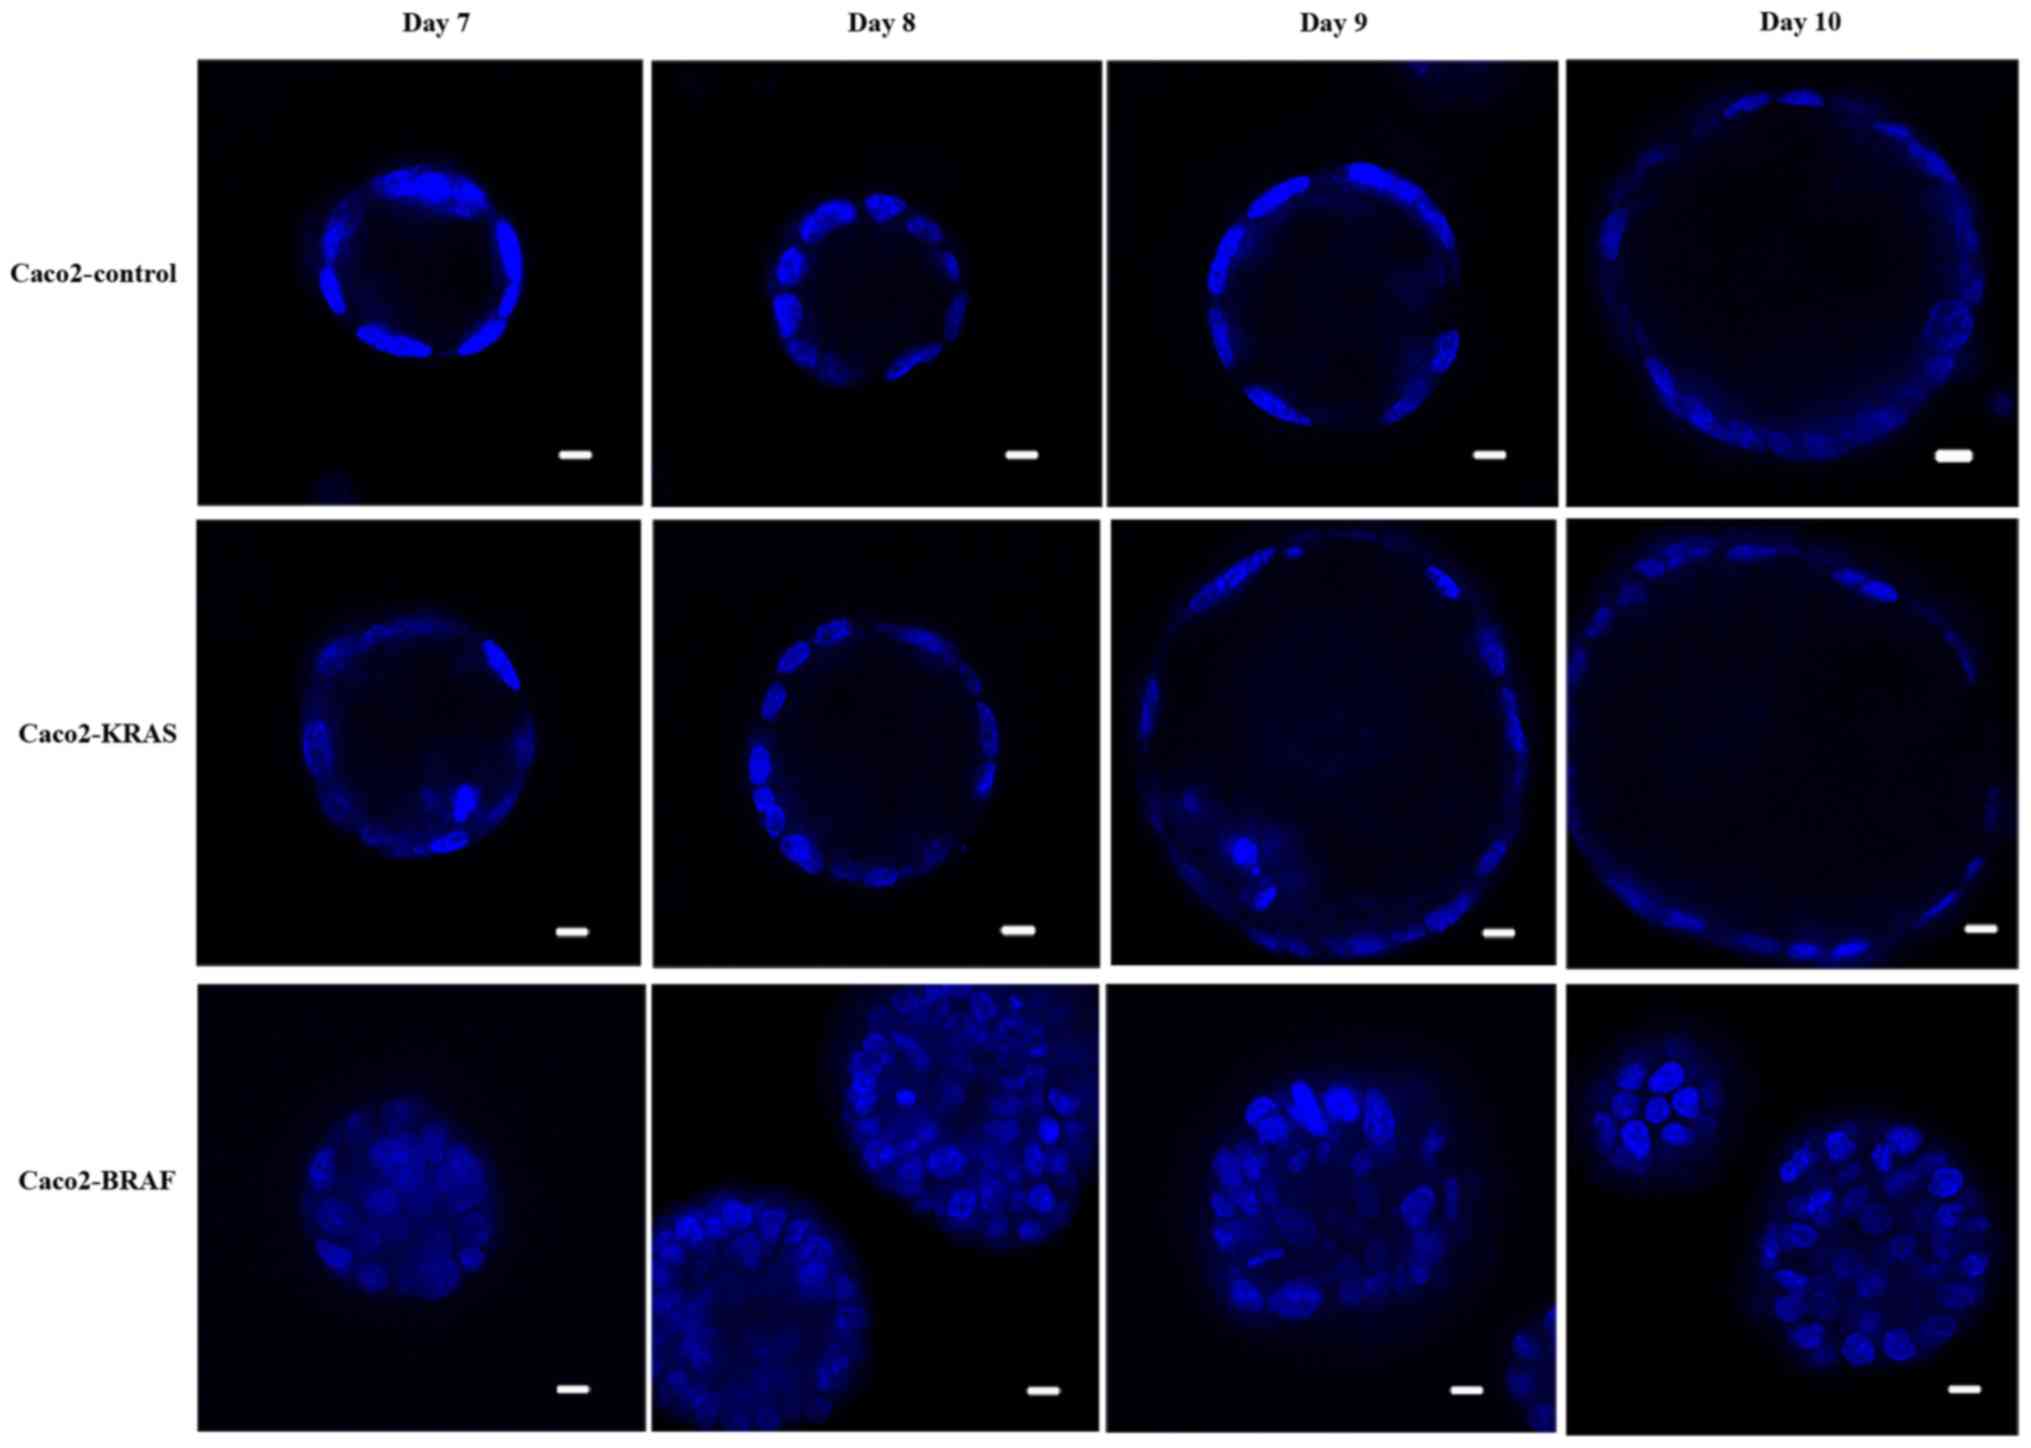
We cultured conventional Caco-2 cell line (controls)
and Caco-2 cells with either KRAS or BRAF mutation in a mixture of
matrigel and collagen for up to 10 days. Live cell imaging
indicated that during the initial days, the cells proliferated and
formed balls of cell clusters growing and expanding within the
matrix. Later on, i.e. post the 8th day, most Caco-2 control cells
formed round cysts with an epithelial cell lining around a
fluid-filled lumen (Fig. 1). The
structures formed by Caco2-KRAS and Caco2-BRAF cell lines were
larger than those formed by the control cells. In addition, some
structures formed by Caco2-KRAS cells were cysts similar to those
seen in Caco-2 controls (Fig. 1)
with a clear lumen while others formed cystic structures partially
filled with cells. Finally, some cysts formed by Caco2-KRAS cells
showed focal piling up of cells (Fig.
1) or apoptotic cells in the luminal space adjacent to cyst
wall (Fig. 1). In contrast,
Caco2-BRAF cells formed predominantly solid structures with cells
filling up the lumen (Fig. 1), an
appearance resembling solid tumor cell clusters in some of the
clinical carcinoma specimens. The growth patterns were consistent
in terms of cyst formation and solid growth from the 7th day
onwards in both control and KRAS or BRAF mutated 3D cultures until
the 10th day (Fig. 1).
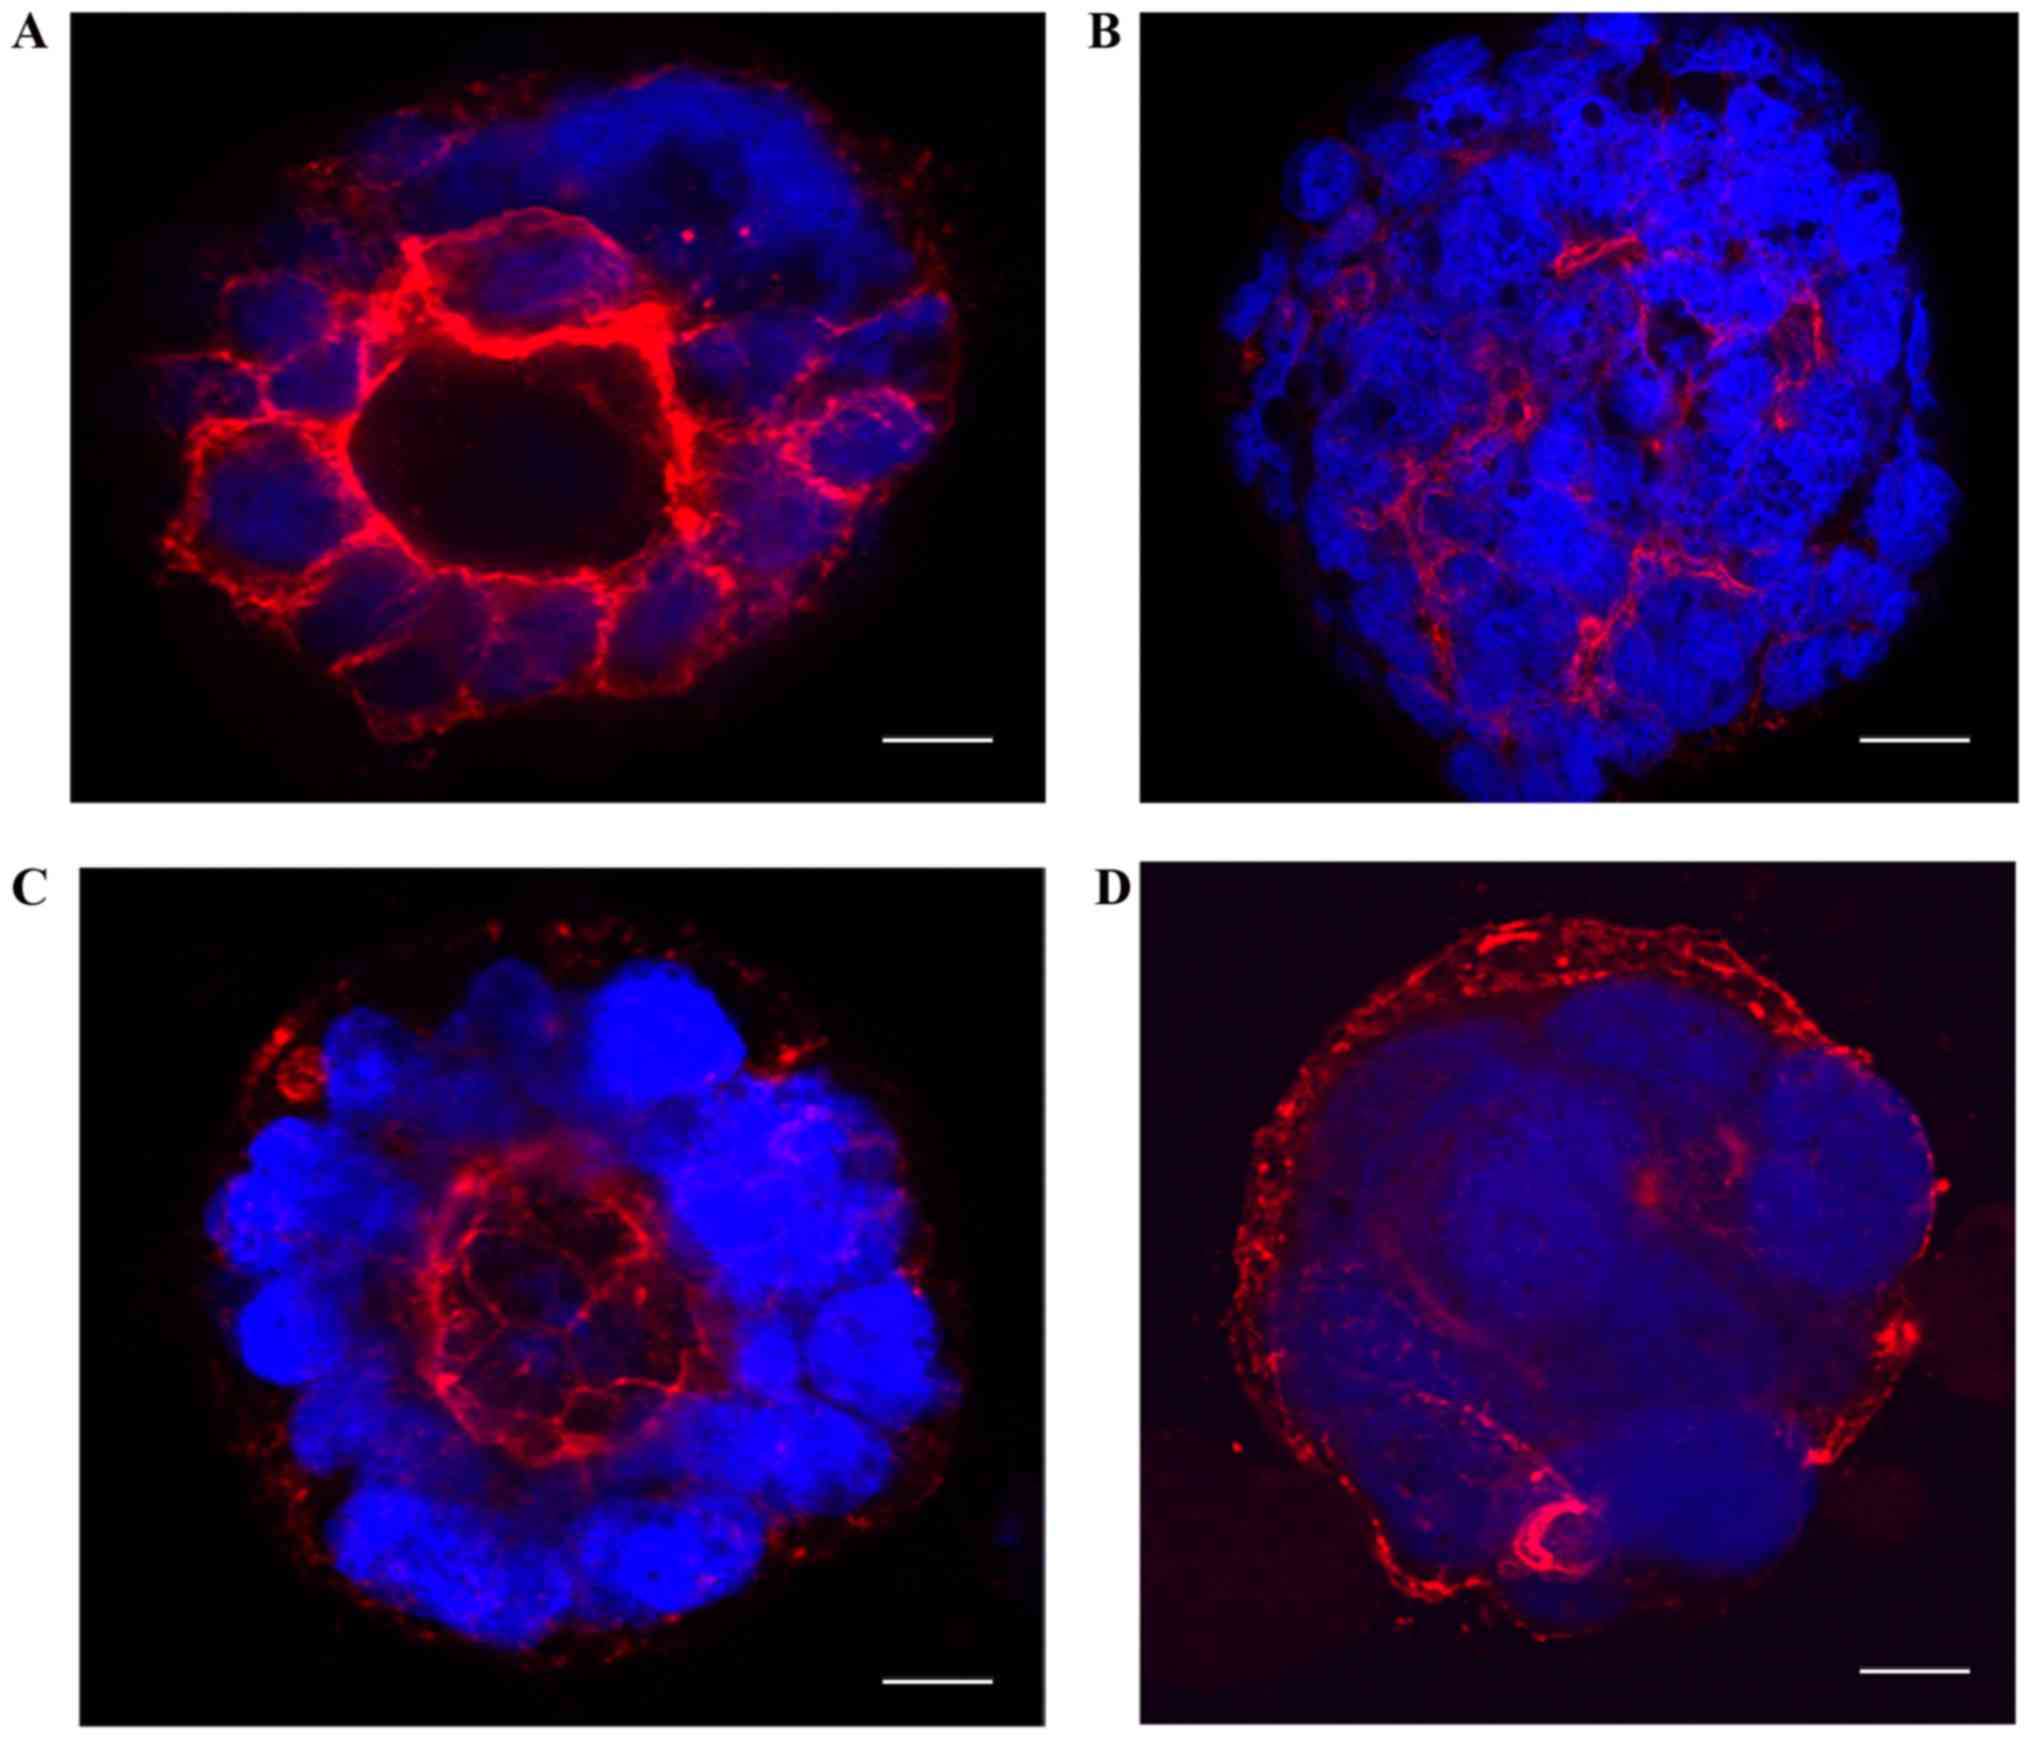
To understand the organization and polarization of
cells in 3D cultures, we imaged 10-day-old cultures after fixation
and staining with TRITC-phalloidin and DAPI. Caco-2 control cells
showed regular apical-basal polarity as indicated by regular
apically polarized localization of TRITC-phalloidin staining
(Fig. 2A). In contrast, Caco2-BRAF
cells showed irregular polarity with irregular strands of
phalloidin present between cells within the clusters (Fig. 2B). Caco2-KRAS cells presented
variable irregularity of cell polarity in the cell clusters. Here,
the clusters with only focal cell piling up displayed regular
apical-basal polarity (Fig. 2C).
In contrast, Caco2-KRAS cells also formed solid clusters with an
inverted polarity pattern, shown by actin staining close to the
outer surface of the clusters (Fig.
2D).
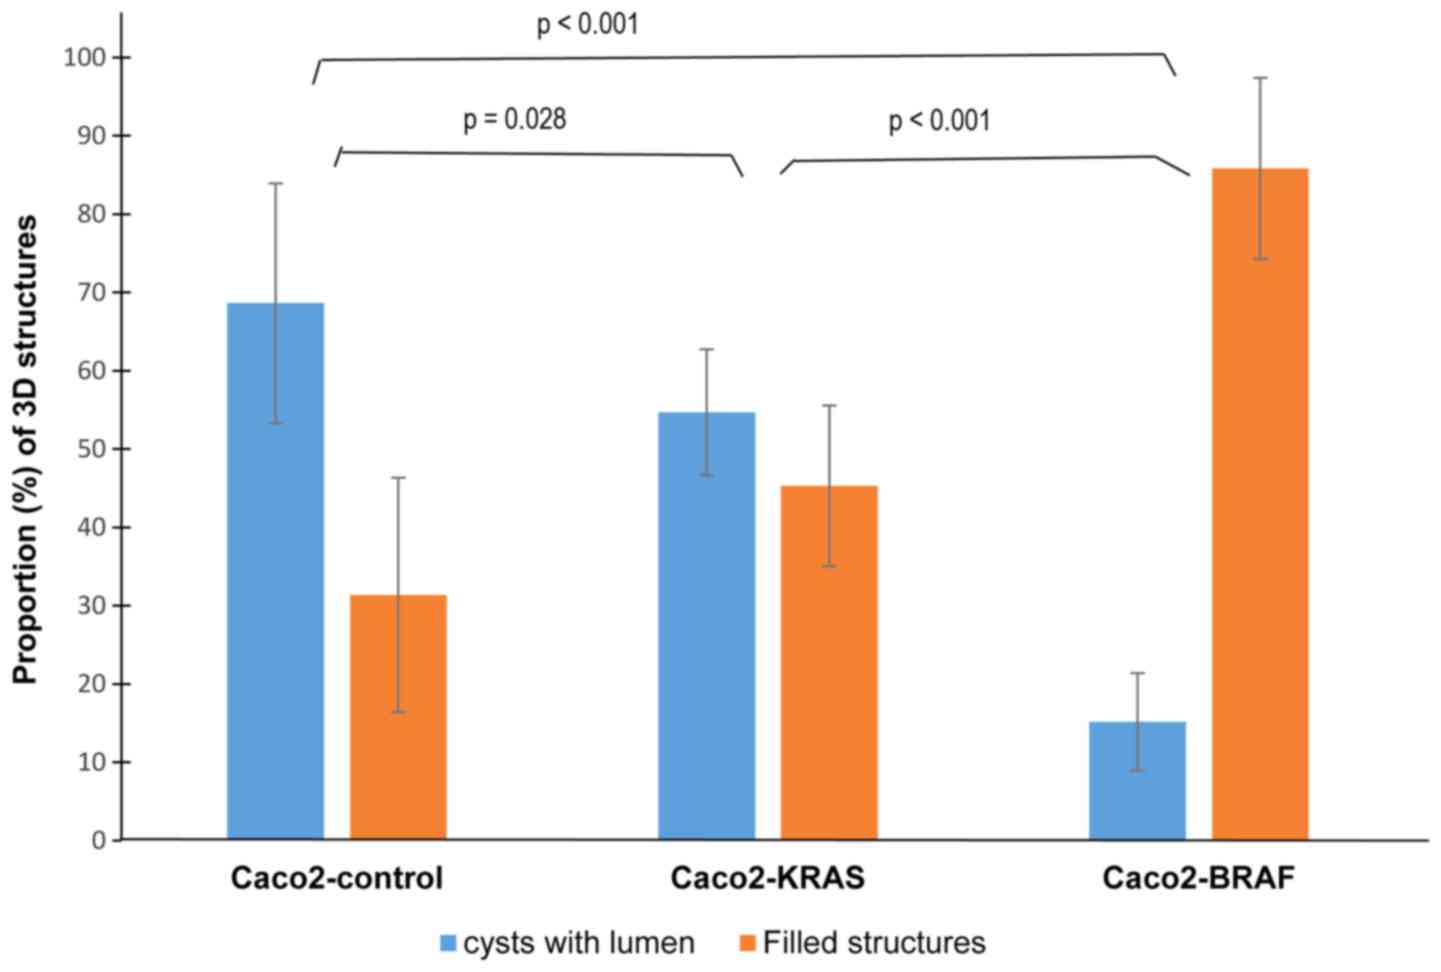
Since the cystic or solid growth patterns did not
completely relate with the cell lineage, we quantitated different
growth patterns in the 10-day-old fixed culture specimens. The
majority (about 70%) of the structures formed by the control Caco-2
cells were cysts, with occasional solid structures (Fig. 3). In Caco2-KRAS 3D cultures, about
half of the structures were solid and the other half were similar
to control Caco-2 cysts, whereas Caco2-BRAF cultures dominantly
consisted of solid structures.
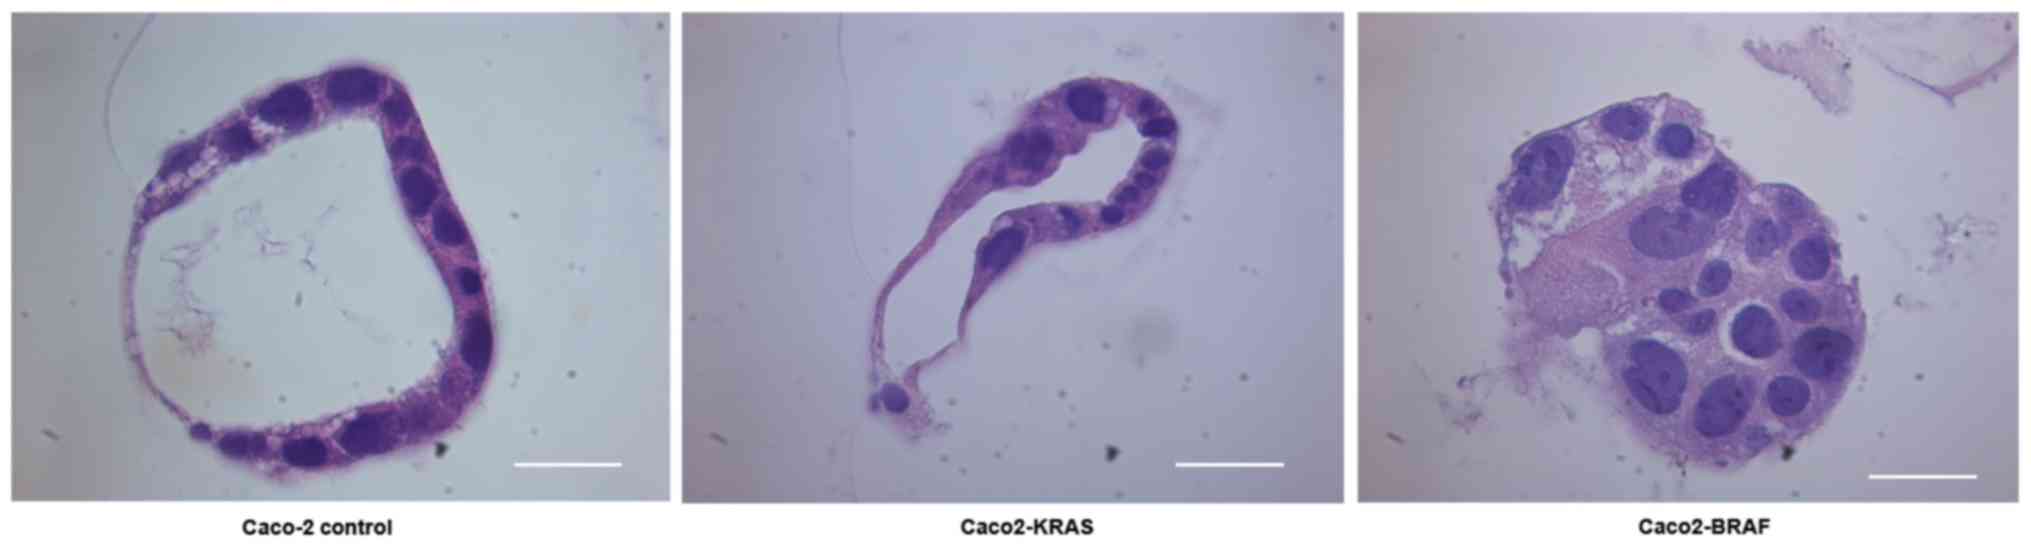
Conventional light microscopy study of
3D cell cultures embedded in paraffin
We cultured a new batch of Caco-2 control cells,
Caco2-KRAS and Caco2-BRAF cells in matrigel-collagen mix for 8
days. Quick embedding of 3D specimens into paraffin allowed
long-term storage of the specimens and comparison with conventional
histopathology of actual tumor specimens. Sections stained with
hematoxylin and eosin presented similar structural differences
between the cell lines as observed by live imaging experiments
(Figs. 1 and 4), with structures resembling MIPs
(22) and solid cell clusters seen
in clinical colorectal carcinoma specimens.
KRAS or BRAF mutations and
anchorage-independent survival of Caco-2 cells
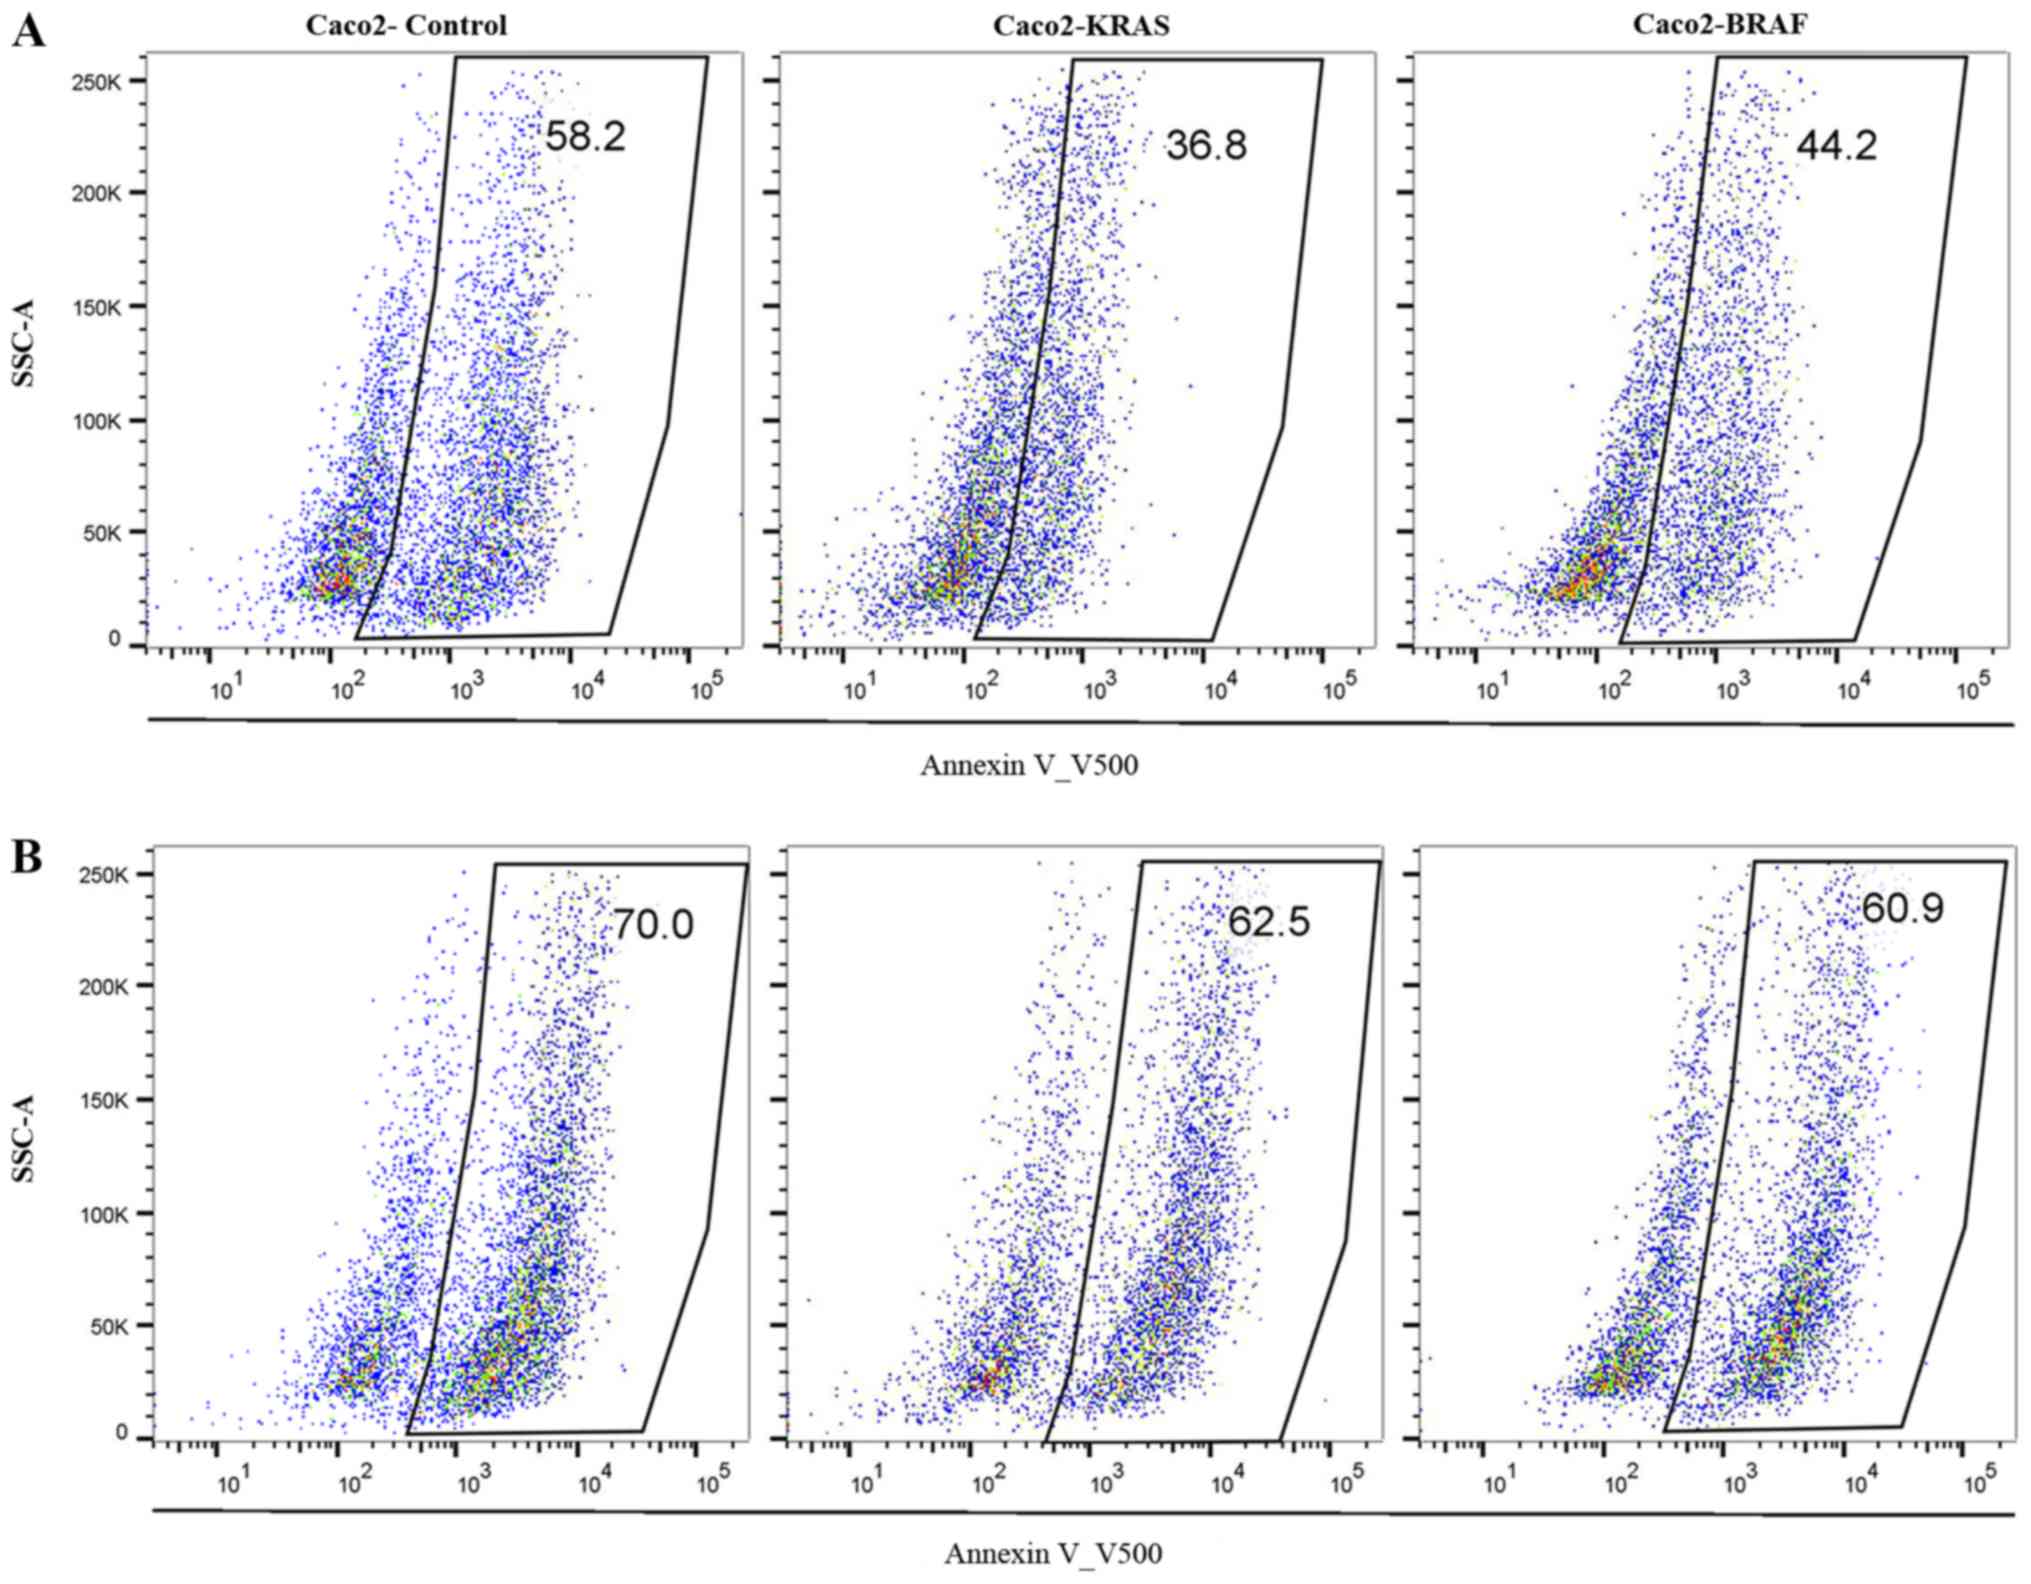
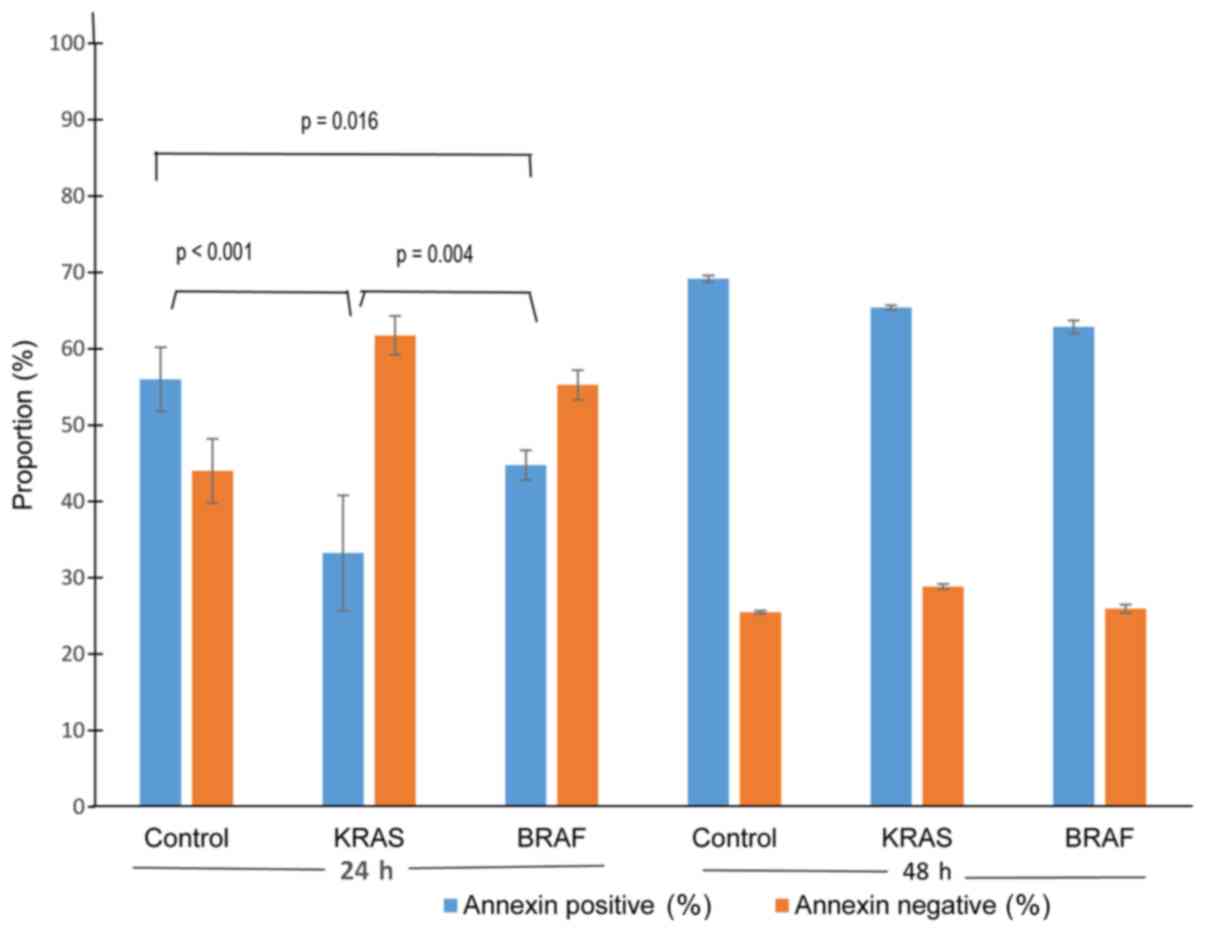
To assess the influence of mutations on the
anchorage-independent survival ability of colon cancer cells, we
cultured Caco2-control cells, Caco2-KRAS and Caco2-BRAF cells on
poor attachment (poly-HEMA coated) surfaces and studied anoikis
resistance. Annexin V500 assay showed significantly lower apoptosis
rate in Caco2-KRAS and Caco-2-BRAF cells than in Caco-2 control
cells at 24 h, whereas cells grown in suspension for 48 h presented
increased apoptosis rate independent of cell type (Figs. 5 and 6). In addition, we determined S-phase
fractions to get impression of proliferation activity of the cells
in anchorage independent conditions. At 24 H, the S-phase fraction
in control Caco-2 cells tended to be higher (n=1; 25.1%), as
compared to cells transfected with KRAS (n=2; mean 14.7%, SD 0.6),
and in cells with BRAF (n=3; 22.0%, SD 1.3), but at 48 h all cell
lineages showed practically similar S-phase fractions (25.4; 24.6;
23.2%, respectively).
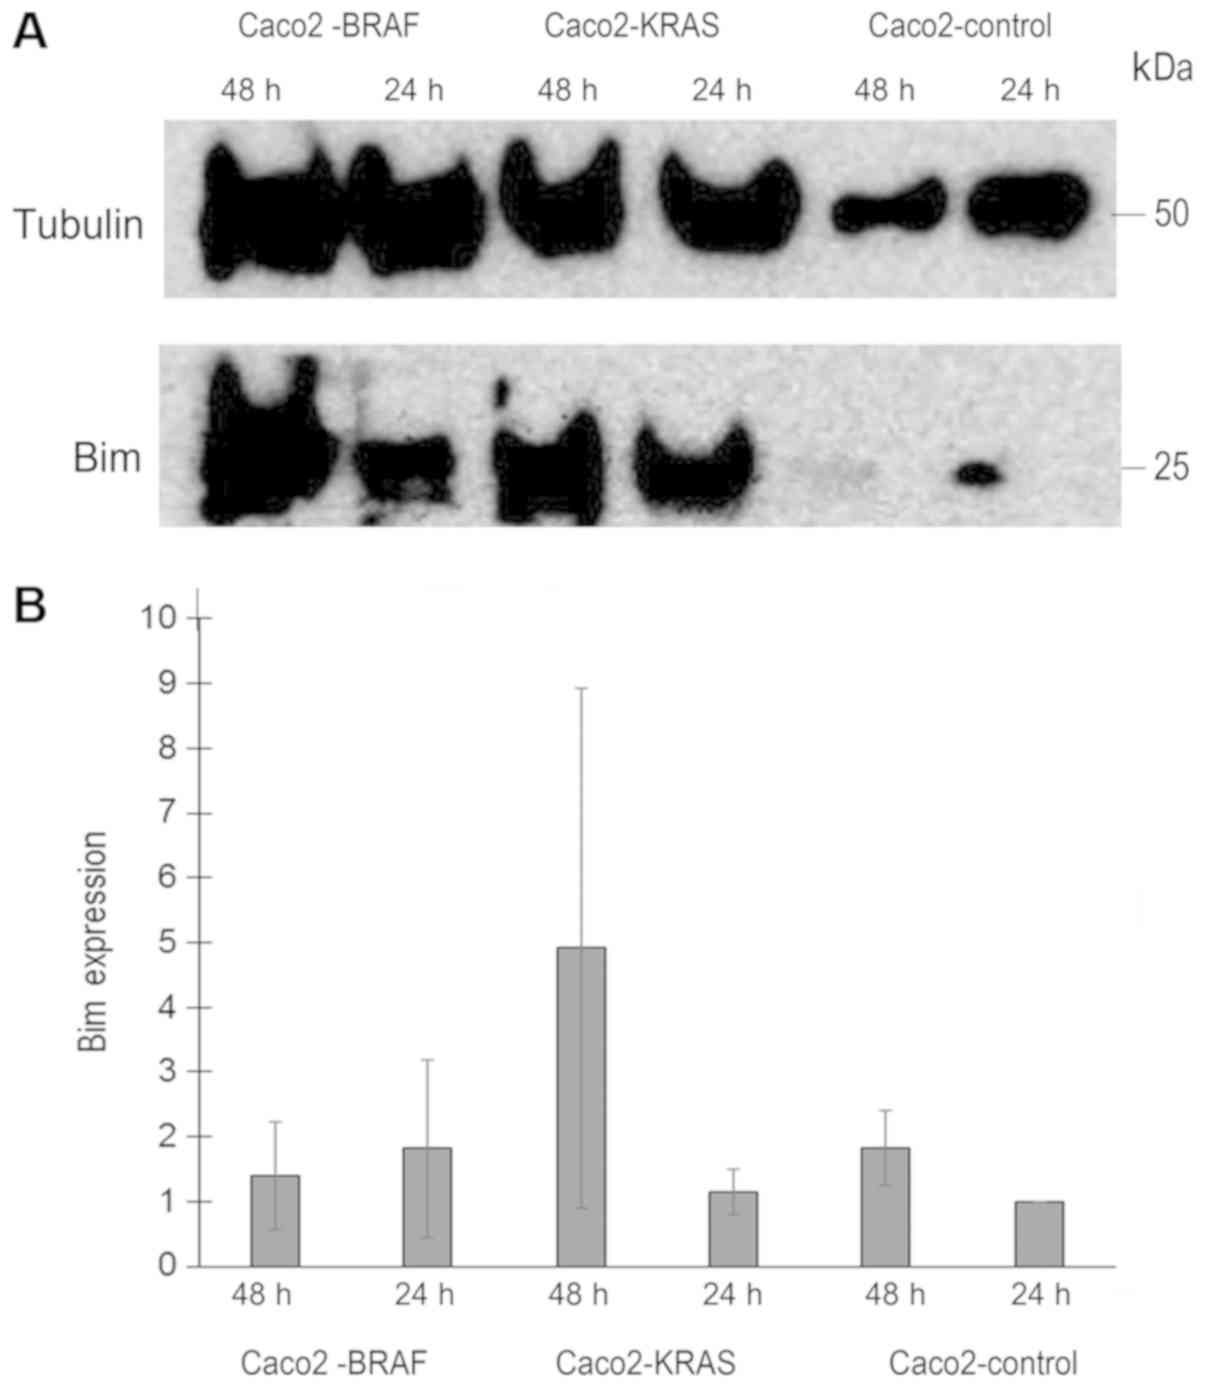
To assess the mechanism behind the anoikis
resistance by KRAS or BRAF mutations in Caco-2 cells, we analyzed
Bim expression level in lysates from annexin negative Caco-2
control, Caco2-KRAS and Caco2-BRAF cells, cultured in suspension
for 24 h or 48 h. Based on three similar experiments, we saw
evidence for Bim upregulation in Caco-2 cells transfected with
mutated KRAS and BRAF, which was not statistically significant. For
KRAS transfected cells, the increase was most evident at 48 h with
more than two fold increase than control Caco-2 cells at the same
time point. For BRAF transfected cells increase was 1.8 fold at 24
h (Fig. 7).
Discussion
Anoikis resistance is an essential feature of
malignant cells. Without it, cancer cells detached from their
primary site would die during their travel through lymphatic or
blood vessels or tissue cavities (11,14).
So far, it has only been possible to analyze anoikis resistance
with in vitro cell culture experiments. However, according
to our recent observations, anoikis resistance correlates to
microscopical features of human carcinomas, such as occurrence of
cell subpopulations without ECM contact (22). However, there have not yet been any
in vitro models for anoikis resistance where combining
actual anoikis resistance of the cells and formation of
multicellular structures would mimic the features comprised in
actual tumors with anoikis-resistant cell subpopulations. We
present here novel evidence that Caco-2 cells transfected with
oncogenic mutants of KRAS or BRAF gene gain anoikis resistance,
which is detectable in both conventional in vitro test for
anoikis resistance and in 3D cultures. Importantly, 3D cultures
showed structural features consistent with anoikis resistance
similar to actual carcinomas. These models serve for analyzing
mechanisms by which KRAS and BRAF oncogenic mutations support
anoikis resistance and for studying the general mechanisms of the
formation and organization of multicellular groups with activated
anoikis resistance mechanisms. In addition, the 3D model mimics
actual tumors consisting of two subpopulations of cells, one in
contact with the ECM and the other without such contact to the
matrix along with activated anoikis resistance mechanisms. The
model allows analyses of whether these populations differ in
responses to factors like hypoxia or to treatment modalities such
as radiation and oncological drugs.
For our model, we used Caco-2 cells, a
well-characterized intestinal cancer cell line forming regular
monolayers and showing sensitivity for anoikis (36). Caco-2 was also an optimal cell line
since without mutations, the growth and functions are very close to
normal colorectal/intestinal epithelium and there is no inherent
anoikis resistance in this cell line (36). To assess acquisition of anoikis
resistance, we selected mutated KRAS (G12V) and BRAF (V600E)
oncogenes owing to their clinical and biological relevance in
colorectal adenocarcinoma. Besides being common in CRC (2,3,37,38),
these mutations have prognostic significance and have importance in
the selection of treatment modalities (4–6,9).
Importantly, these mutations induce solid growth instead of
polarized cysts in 3D cultures (31,32),
such growth possibly indicating induction of anoikis resistance. We
confirmed transfection efficiency by respective antibiotic
selection, by sorting GFP positive cells by flow cytometry, and by
confirming the expression GFP/KRAS and GFP/BRAF constructs by
western blots.
We confirmed emergence of anoikis resistance in
Caco-2 cells transfected with mutated KRAS or BRAF genes by two
complementary sets of experiments. First, both Caco2-KRAS and
Caco2-BRAF cells showed enhanced anoikis resistance as compared
with native Caco-2 cells, cells transfected with mutated KRAS
showing higher anoikis-resistant survival than those transfected
with mutated BRAF (Figs. 5 and
6) in the anti-adhesion tests. In
these tests, the differences between control and KRAS or BRAF
transfected cells were evident after 24 h, but considerably lower
in the 48-h samples, possibly due to stress from culturing on
anti-adhering surfaces and the long incubation period. A limitation
in our apoptosis assay was the lack commonly used Propidium iodine
(PI) staining accompanying Annexin staining. However, the focus of
present work was anoikis resistance and Annexin V staining reveals
cells from early to late apoptosis. Since PI staining is an
indicator of progress of apoptosis and of non-apoptotic cell death,
it would not have provided more information on anoikis resistance.
Theoretically, reaction by hyper proliferative state to loss of
matrix contact is a potential mechanism to overcome anoikis
(11). In our experiments,
however, transfected cells showed lower (KRAS) or similar (BRAF)
proliferation rates as compared with native Caco-2 cells,
suggesting that this mechanism does not explain anoikis resistance
as detected in anti-adhesion test. In contrast, KRAS might even
induce dormancy. As a second complementary evidence for anoikis
resistance, in 3D cultures from Caco-2 cells transfected with
mutated KRAS or BRAF presented formation of cysts with focal piling
up of the cells on the luminal side or formation of solid,
completely non-cystic growth, with inner cells without matrix
contact. We saw occasional apoptotic cells among the latter cells,
but majority of the cells were surviving (Fig. 1). Occurrence of such
matrix-independent survival in 3D cultures indicates anoikis
resistance.
Both KRAS and BRAF mutations seemed to induce
characteristic patterns in 3D structures in Caco-2 cells.
Quantitative analysis of our 3D cultures indicated that native
Caco-2 cells mostly formed cysts with a single layer of epithelial
cells regularly polarized with the apical side facing the cyst
lumen. In contrast, Caco2-KRAS cells often (about half of the
clusters) formed solid round structures without lumen, while
Caco2-BRAF cells mainly formed solid round cell clusters (Figs. 1 and 2). A closer look at the inner cells
within these 3D structures revealed that they were in close contact
with each other and with the outermost cells of the clusters and
showed evidence of irregular cell polarity (Fig. 2). Such clusters may result from
disturbed cell adhesion regulation (39) and disrupted integrin signaling. The
absence of specific integrin's such as α2 and β1 has been shown to
lead to irregular apical-basal polarity in epithelial MDCK cells
and Caco-2 cells (39,40).
While both BRAF and KRAS mutations induced irregular
polarity in the inner cells of Caco-2 clusters, only KRAS induced
dislocation of actin staining close to the outer surface of the
cell clusters, a pattern indicating development of inverted
polarity (32). A recent report
shows the importance of inverted apical-basal polarity in the
peritoneal dissemination and invasion of CRC, characteristically
present in the serrated subtype of CRC (41). This is of interest as KRAS mutation
is the most frequent mutation type and present in 45% of serrated
carcinomas (3). These findings
support the role of KRAS mutation in the development of inversed
polarity. The current 3D model is potentially useful in studying
the developmental mechanisms and biological significance of
inverted polarity.
When compared with structures seen in human CRCs,
the 3D structures formed by Caco-2 cells with KRAS or BRAF
mutations demonstrate strong similarities to cell groups without
contact to the extracellular matrix. These structures included MIPs
(22), solid cell islands, and
cribriform structures (unpublished). Solid structures formed by
Caco2-BRAF cells comply with the association of mutation in the
BRAF oncogene, with poorly differentiated carcinomas containing
such structures and having poor patient survival (42–44).
There are several types of KRAS mutations in CRCs associated with
varying degrees of prognostic value (45), and only limited a number of studies
have addressed the relationship of specific KRAS mutations with the
histopathological structure of CRC. Interestingly, the KRAS codon
12 mutation used in the present study induced stronger anoikis
resistance in fibroblastic NIH3T3 cells than codon 13 mutations
(17). Along the lines of the role
of anoikis resistance in metastasis, KRAS G12V mutations associated
with poor prognosis unlike some other KRAS mutation types (45). Finally, KRAS G12V mutations were
the second most common KRAS mutation type in serrated colorectal
carcinoma (3), a carcinoma type
characterized by MIPs. Our study, along with others, has shown an
association of mutation in the KRAS oncogene with
moderately/well-differentiated CRCs. This was visible in our 3D
model with Caco2-KRAS cells where the cells either formed polarized
cysts or partially filled structures, with some signs of apoptosis
in cells within the luminal space (46,47).
We were interested to review published data of
colorectal cell lines with KRAS or BRAF mutations to see whether
any association of 3D growth patterns and anoikis resistance could
be detected (Table I). It is
clearly evident (Table I) that
both mutations associate with anoikis resistance and 3D growth as
mainly solid clusters in both inherently mutated cell lines (HT-29
and SW-408) and in those transfected with mutations, as shown in
the present study. Besides supporting the role of KRAS and BRAF
mutations in the pathogenesis of anoikis resistance, these findings
support the idea that anoikis resistance contributes to the
formation of multicellular clusters with inner cells surviving
without contact with the ECM. Finally, availability of cell lines
harboring native KRAS G12V or BRAF V600E mutations would allow
knock-out/knock in studies to confirm the importance of these
mutations in anoikis resistance and the associated 3D growth
characteristics.
 | Table I.Review of reported 3D growth patterns
and anoikis resistance in native Caco-2 cells, Caco-2 cells
transfected with KRAS or BRAF mutations (present study), and
intestinal carcinoma cell lines with inherent KRAS or BRAF
mutation. |
Table I.
Review of reported 3D growth patterns
and anoikis resistance in native Caco-2 cells, Caco-2 cells
transfected with KRAS or BRAF mutations (present study), and
intestinal carcinoma cell lines with inherent KRAS or BRAF
mutation.
| Cell line | KRAS or BRAF
mutation | 3D growth
pattern | Anoikis
resistance | (Refs.) |
|---|
| Caco-2 | None | Polarized cyst | NS | (32,52) |
| Caco-2 | None | Polarized cyst | + | Patankar M (Present
study) |
| Caco2-KRAS | KRAS, G12V | Solid | NS | (32) |
| HCT 116 | KRAS, G13D | Solid | NS | (15,53–55) |
|
|
| NS | + |
|
| SW 408 | KRAS, G12V | Solid | NS | (52,54) |
| Caco2-KRAS | KRAS, G12V | Solid | + | Patankar M (present
study) |
| Caco2-BRAF | BRAF, V600E | Solid | NS | (32) |
| HT29 | BRAF, V600E | Solid | NS | (15,53,54) |
|
|
| NS | + |
|
| DLD-1 | BRAF, V600E | Solid | NS | (53,54) |
| Caco2-BRAF | BRAF, V600E | Solid | + | Patankar M (present
study) |
The mechanisms behind the observed differences
between BRAF and KRAS mutations in anoikis resistance and 3D growth
patterns remain largely speculative at present. Both mutations
present their effects on both 3D growth patterns (32) and anoikis resistance (16,17,21)
via activation of the RAS-RAF-ERK pathway. We observed evidence for
upregulation of Bim protein in anoikis resistant cells induced by
both mutations. Bim is mostly considered as a proapoptotic protein.
Accordingly, in melanocytic cells BRAF mutation induces anoikis
resistance by downregulating Bim (19,20),
and in a colorectal carcinoma cell line with BRAF mutation
(COLO205) repression of Bim inhibits apoptosis (48). However, in some cancer cells, Bim
is overexpressed and has a pro-survival role. In this context,
proapoptotic effect of Bim is blocked by formation of complexes
with MCL-1 leaving pro-survival function active (49). MCL-1 has been recognized as an
important factor in BRAF induced anoikis resistance in a CRC cell
line (21), and such mechanism
would be plausible in our transfected Caco-2 cells. The differences
in downstream signaling of mutated KRAS and BRAF molecules
(14,31,32)
might further explain the observed differences in both anoikis
resistance and 3D structure details, such as increased cell
proliferation, altered apical-basal polarity establishment,
disrupted integrin signaling, and disrupted intercellular contacts
(32,50).
Although monitoring of 3D structures by confocal
imaging is efficient, it does not allow structural comparison with
conventional formalin-fixed paraffin-embedded pathological
specimens or the use of visible light immunohistochemical methods.
This led us to use a simple yet robust and cost-efficient procedure
for embedding 3D cell cultures in agar followed by fixing in
formalin and embedding in paraffin blocks. This provided
conventional tissue sections with well-preserved morphology.
Accordingly, it was possible to compare well-preserved morphology
in 3D cultures to that of human carcinoma samples and it is even
possible to perform biomarker studies with immunohistochemical
analyses.
Considering the benefits and importance of the
current model, our 3D in vitro model is better than spheroid
cultures in fluid (51),
complemented with the presentation of maturation and layering of
the cells on extracellular matrix as in tumor tissues. 3D culture
allows live imaging, providing visualization of cell morphology and
details during the formation of different structures with a
well-maintained environment for the cells while imaging.
Importantly, there have been no relevant models for studying
anoikis resistance in CRC. However, relating with the lack of in
vivo experiments in our study, more studies are clearly needed
to gather further evidence whether formation of solid structures as
seen in the present study is a manifestation of anoikis resistance.
Furthermore, it would be essential to show in vivo
importance of anoikis resistance induced by KRAS and BRAF mutations
by xenotransplantation experiments. Such experiments might also
provide information about occurrence of characteristic
histopathological features of anoikis resistance in
vivo.
We have shown that KRAS and BRAF mutations induce
anoikis resistance in Caco-2 cells. In 3D cell culture, these
mutations changed the growth of Caco-2 cells drastically, from cyst
formation to solid growth or focal intraluminal growth of cells.
Both patterns represent morphology corresponding to the
presentation of anoikis resistance in actual colorectal carcinomas,
with inner cells surviving without contact with the extracellular
matrix while outer cells survive based on their extracellular
matrix contact. Accordingly, these mutant cell lines in 3D cultures
serve, for example, in studies analyzing the potential need for
specific therapeutic strategies against anoikis-resistant
subpopulations of tumor cells. Besides anoikis resistance, KRAS
mutation induced inversed polarity in Caco-2 cells, thus providing
an in vitro model for this aberration, which is important in
the dissemination of CRC (42).
Supplementary Material
Supporting Data
Acknowledgements
The authors would like to thank Ms. Riitta Vuento
(Department of Pathology, Oulu University Hospital, Oulu Finland,
and Biobank Borealis, Oulu Univeristy Hospital and University of
Oulu, Finland) for providing expertise in histopathological
techniques and Dr. Virpi Glumoff (Faculty of Medicine, University
of Oulu, Finland) for help in flow cytometric analyses.
Funding
The present study was funded by Finnish State
Medical Research funding, allocated by the Oulu University
Hospital, Finland.
Availability of data and materials
All data generated and analyzed during the present
study are included in this published article.
Authors' contributions
TJK conceptualized and designed the study and
drafted the manuscript. SE contributed to experimental design,
analysis and revised the manuscript. MP designed the study,
performed all the experiments, analyzed and drafted the manuscript.
MJM and AT contributed to conception and design of the study and
revised the manuscript. All authors reviewed and approved the final
manuscript.
Ethics approval and consent to
participate
Not applicable.
Patient consent for publication
Not applicable.
Competing interests
The authors declare that they have no competing
interests.
Glossary
Abbreviations
Abbreviations:
|
CRC
|
Colorectal carcinoma
|
|
MAPK
|
Mitogen-activated protein kinases
|
|
ERK
|
Extracellular signal-regulated
kinases
|
|
MIP
|
Micropapillary structures
|
References
|
1
|
Torre LA, Bray F, Siegel RL, Ferlay J,
Lortet-Tieulent J and Jemal A: Global cancer statistics, 2012. CA
Cancer J Clin. 65:87–108. 2015. View Article : Google Scholar : PubMed/NCBI
|
|
2
|
Arrington AK, Heinrich EL, Lee W, Duldulao
M, Patel S, Sanchez J, Garcia-Aguilar J and Kim J: Prognostic and
predictive roles of KRAS mutation in colorectal cancer. Int J Mol
Sci. 13:12153–12168. 2012. View Article : Google Scholar : PubMed/NCBI
|
|
3
|
Stefanius K, Ylitalo L, Tuomisto A,
Kuivila R, Kantola T, Sirnio P, Karttunen TJ and Mäkinen MJ:
Frequent mutations of KRAS in addition to BRAF in colorectal
serrated adenocarcinoma. Histopathology. 58:679–692. 2011.
View Article : Google Scholar : PubMed/NCBI
|
|
4
|
Neumann J, Zeindl-Eberhart E, Kirchner T
and Jung A: Frequency and type of KRAS mutations in routine
diagnostic analysis of metastatic colorectal cancer. Pathol Res
Pract. 205:858–862. 2009. View Article : Google Scholar : PubMed/NCBI
|
|
5
|
Foltran L, De Maglio G, Pella N, Ermacora
P, Aprile G, Masiero E, Giovannoni M, Iaiza E, Cardellino GG,
Lutrino SE, et al: Prognostic role of KRAS, NRAS, BRAF and PIK3CA
mutations in advanced colorectal cancer. Future Oncol. 11:629–640.
2015. View Article : Google Scholar : PubMed/NCBI
|
|
6
|
Guo F, Gong H, Zhao H, Chen J, Zhang Y,
Zhang L, Shi X, Zhang A, Jin H, Zhang J and He Y: Mutation status
and prognostic values of KRAS, NRAS, BRAF and PIK3CA in 353 chinese
colorectal cancer patients. Sci Rep. 8:60762018. View Article : Google Scholar : PubMed/NCBI
|
|
7
|
Matallanas D, Birtwistle M, Romano D,
Zebisch A, Rauch J, von Kriegsheim A and Kolch W: Raf family
kinases: Old dogs have learned new tricks. Genes Cancer. 2:232–260.
2011. View Article : Google Scholar : PubMed/NCBI
|
|
8
|
Yokota T, Ura T, Shibata N, Takahari D,
Shitara K, Nomura M, Kondo C, Mizota A, Utsunomiya S, Muro K and
Yatabe Y: BRAF mutation is a powerful prognostic factor in advanced
and recurrent colorectal cancer. Br J Cancer. 104:856–862. 2011.
View Article : Google Scholar : PubMed/NCBI
|
|
9
|
Lai E, Pretta A, Impera V, Mariani S,
Giampieri R, Casula L, Pusceddu V, Coni P, Fanni D, Puzzoni M, et
al: BRAF-mutant colorectal cancer, a different breed evolving.
Expert Rev Mol Diagn. 18:499–512. 2018. View Article : Google Scholar : PubMed/NCBI
|
|
10
|
Gilmore AP: Anoikis. Cell Death Differ. 12
(Suppl 2):S1473–S1477. 2005. View Article : Google Scholar
|
|
11
|
Guadamillas MC, Cerezo A and Del Pozo MA:
Overcoming anoikis-pathways to anchorage-independent growth in
cancer. J Cell Sci. 124:3189–3197. 2011. View Article : Google Scholar : PubMed/NCBI
|
|
12
|
Jinka R, Kapoor R, Sistla PG, Raj TA and
Pande G: Alterations in cell-extracellular matrix interactions
during progression of cancers. Int J Cell Biol. 2012:2191962012.
View Article : Google Scholar : PubMed/NCBI
|
|
13
|
Frisch SM and Ruoslahti E: Integrins and
anoikis. Curr Opin Cell Biol. 9:701–706. 1997. View Article : Google Scholar : PubMed/NCBI
|
|
14
|
Paoli P, Giannoni E and Chiarugi P:
Anoikis molecular pathways and its role in cancer progression.
Biochim Biophys Acta. 1833:3481–3498. 2013. View Article : Google Scholar : PubMed/NCBI
|
|
15
|
Demers MJ, Thibodeau S, Noël D, Fujita N,
Tsuruo T, Gauthier R, Arguin M and Vachon PH: Intestinal epithelial
cancer cell anoikis resistance: EGFR-mediated sustained activation
of Src overrides Fak-dependent signaling to MEK/Erk and/or
PI3-K/Akt-1. J Cell Biochem. 107:639–654. 2009. View Article : Google Scholar : PubMed/NCBI
|
|
16
|
Mason JA, Davison-Versagli CA, Leliaert
AK, Pape DJ, McCallister C, Zuo J, Durbin SM, Buchheit CL, Zhang S
and Schafer ZT: Oncogenic Ras differentially regulates metabolism
and anoikis in extracellular matrix-detached cells. Cell Death
Differ. 23:1271–1282. 2016. View Article : Google Scholar : PubMed/NCBI
|
|
17
|
Guerrero S, Casanova I, Farré L, Mazo A,
Capellà G and Mangues R: K-ras codon 12 mutation induces higher
level of resistance to apoptosis and predisposition to
anchorage-independent growth than codon 13 mutation or
proto-oncogene overexpression. Cancer Res. 60:6750–6756.
2000.PubMed/NCBI
|
|
18
|
Jones RP, Sutton PA, Evans JP, Clifford R,
McAvoy A, Lewis J, Rousseau A, Mountford R, McWhirter D and Malik
HZ: Specific mutations in KRAS codon 12 are associated with worse
overall survival in patients with advanced and recurrent colorectal
cancer. Br J Cancer. 116:923–929. 2017. View Article : Google Scholar : PubMed/NCBI
|
|
19
|
Boisvert-Adamo K and Aplin AE: Mutant
B-RAF mediates resistance to anoikis via bad and Bim. Oncogene.
27:3301–3312. 2008. View Article : Google Scholar : PubMed/NCBI
|
|
20
|
Goldstein NB, Johannes WU, Gadeliya AV,
Green MR, Fujita M, Norris DA and Shellman YG: Active N-Ras and
B-Raf inhibit anoikis by downregulating Bim expression in
melanocytic cells. J Invest Dermatol. 129:432–437. 2009. View Article : Google Scholar : PubMed/NCBI
|
|
21
|
Kawakami H, Huang S, Pal K, Dutta SK,
Mukhopadhyay D and Sinicrope FA: Mutant BRAF upregulates MCL-1 to
confer apoptosis resistance that is reversed by MCL-1 antagonism
and cobimetinib in colorectal cancer. Mol Cancer Ther.
15:3015–3027. 2016. View Article : Google Scholar : PubMed/NCBI
|
|
22
|
Patankar M, Vayrynen S, Tuomisto A,
Makinen M, Eskelinen S and Karttunen TJ: Micropapillary structures
in colorectal cancer: An anoikis-resistant subpopulation.
Anticancer Res. 38:2915–2921. 2018.PubMed/NCBI
|
|
23
|
Jia J, Zhang W, Liu JY, Chen G, Liu H,
Zhong HY, Liu B, Cai Y, Zhang JL and Zhao YF: Epithelial
mesenchymal transition is required for acquisition of anoikis
resistance and metastatic potential in adenoid cystic carcinoma.
PLoS One. 7:e515492012. View Article : Google Scholar : PubMed/NCBI
|
|
24
|
Fofaria NM and Srivastava SK: STAT3
induces anoikis resistance, promotes cell invasion and metastatic
potential in pancreatic cancer cells. Carcinogenesis. 36:142–150.
2015. View Article : Google Scholar : PubMed/NCBI
|
|
25
|
Cai Q, Yan L and Xu Y: Anoikis resistance
is a critical feature of highly aggressive ovarian cancer cells.
Oncogene. 34:3315–3324. 2015. View Article : Google Scholar : PubMed/NCBI
|
|
26
|
Herrmann D, Conway JR, Vennin C, Magenau
A, Hughes WE, Morton JP and Timpson P: Three-dimensional cancer
models mimic cell-matrix interactions in the tumour
microenvironment. Carcinogenesis. 35:1671–1679. 2014. View Article : Google Scholar : PubMed/NCBI
|
|
27
|
Edmondson R, Broglie JJ, Adcock AF and
Yang L: Three-dimensional cell culture systems and their
applications in drug discovery and cell-based biosensors. Assay
Drug Dev Technol. 12:207–218. 2014. View Article : Google Scholar : PubMed/NCBI
|
|
28
|
Weiswald LB, Bellet D and Dangles-Marie V:
Spherical cancer models in tumor biology. Neoplasia. 17:1–15. 2015.
View Article : Google Scholar : PubMed/NCBI
|
|
29
|
Fang Y and Eglen RM: Three-dimensional
cell cultures in drug discovery and development. SLAS Discov.
22:456–472. 2017.PubMed/NCBI
|
|
30
|
Langhans SA: Three-dimensional in vitro
cell culture models in drug discovery and drug repositioning. Front
Pharmacol. 9:62018. View Article : Google Scholar : PubMed/NCBI
|
|
31
|
Makrodouli E, Oikonomou E, Koc M, Andera
L, Sasazuki T, Shirasawa S and Pintzas A: BRAF and RAS oncogenes
regulate rho GTPase pathways to mediate migration and invasion
properties in human colon cancer cells: A comparative study. Mol
Cancer. 10:1182011. View Article : Google Scholar : PubMed/NCBI
|
|
32
|
Magudia K, Lahoz A and Hall A: K-Ras and
B-Raf oncogenes inhibit colon epithelial polarity establishment
through up-regulation of c-myc. J Cell Biol. 198:185–194. 2012.
View Article : Google Scholar : PubMed/NCBI
|
|
33
|
Debnath J, Muthuswamy SK and Brugge JS:
Morphogenesis and oncogenesis of MCF-10A mammary epithelial acini
grown in three-dimensional basement membrane cultures. Methods.
30:256–268. 2003. View Article : Google Scholar : PubMed/NCBI
|
|
34
|
Camplejohn RS: Flow cytometric measurement
of cell proliferation. Methods Mol Med. 57:133–143. 2001.PubMed/NCBI
|
|
35
|
Pinto MP, Jacobsen BM and Horwitz KB: An
immunohistochemical method to study breast cancer cell
subpopulations and their growth regulation by hormones in
three-dimensional cultures. Front Endocrinol (Lausanne). 2:152011.
View Article : Google Scholar : PubMed/NCBI
|
|
36
|
Kozlova NI, Morozevich GE, Chubukina AN
and Berman AE: Integrin alphavbeta3 promotes anchorage-dependent
apoptosis in human intestinal carcinoma cells. Oncogene.
20:4710–4717. 2001. View Article : Google Scholar : PubMed/NCBI
|
|
37
|
Cremolini C, Di Maio M, Petrelli F,
Berenato R, Loupakis F and Pietrantonio F: BRAF-mutated metastatic
colorectal cancer between past and future. Br J Cancer.
113:1634–1635. 2015. View Article : Google Scholar : PubMed/NCBI
|
|
38
|
Orlandi A, Calegari A, Inno A, Berenato R,
Caporale M, Niger M, Bossi I, Di Bartolomeo M, de Braud F and
Pietrantonio F: BRAF in metastatic colorectal cancer: The future
starts now. Pharmacogenomics. 16:2069–2081. 2015. View Article : Google Scholar : PubMed/NCBI
|
|
39
|
Pollan SG, Huang F, Sperger JM, Lang JM,
Morrissey C, Cress AE, Chu CY, Bhowmick NA, You S, Freeman MR, et
al: Regulation of inside-out β1-integrin activation by CDCP1.
Oncogene. 37:2817–2836. 2018. View Article : Google Scholar : PubMed/NCBI
|
|
40
|
Zhang X, Cromwell JW, Kunjummen BD, Yee D
and Garcia-Aguilar J: The alpha2 and alpha3 integrins are required
for morphologic differentiation of an intestinal epithelial cell
line. Surgery. 133:429–437. 2003. View Article : Google Scholar : PubMed/NCBI
|
|
41
|
Zajac O, Raingeaud J, Libanje F, Lefebvre
C, Sabino D, Martins I, Roy P, Benatar C, Canet-Jourdan C, Azorin
P, et al: Tumour spheres with inverted polarity drive the formation
of peritoneal metastases in patients with hypermethylated
colorectal carcinomas. Nat Cell Biol. 20:296–306. 2018. View Article : Google Scholar : PubMed/NCBI
|
|
42
|
Clarke CN and Kopetz ES: BRAF mutant
colorectal cancer as a distinct subset of colorectal cancer:
Clinical characteristics, clinical behavior, and response to
targeted therapies. J Gastrointest Oncol. 6:660–617.
2015.PubMed/NCBI
|
|
43
|
Jang MH, Kim S, Hwang DY, Kim WY, Lim SD,
Kim WS, Hwang TS and Han HS: BRAF-mutated colorectal cancer
exhibits distinct clinicopathological features from wild-type
BRAF-expressing cancer independent of the microsatellite
instability status. J Korean Med Sci. 32:38–46. 2017. View Article : Google Scholar : PubMed/NCBI
|
|
44
|
Li Y and Li W: BRAF mutation is associated
with poor clinicopathological outcomes in colorectal cancer: A
meta-analysis. Saudi J Gastroenterol. 23:144–149. 2017.PubMed/NCBI
|
|
45
|
Modest DP, Ricard I, Heinemann V,
Hegewisch-Becker S, Schmiegel W, Porschen R, Stintzing S, Graeven
U, Arnold D, von Weikersthal LF, et al: Outcome according to KRAS-,
NRAS- and BRAF-mutation as well as KRAS mutation variants: Pooled
analysis of five randomized trials in metastatic colorectal cancer
by the AIO colorectal cancer study group. Ann Oncol. 27:1746–1753.
2016. View Article : Google Scholar : PubMed/NCBI
|
|
46
|
Fu T, Guzzetta AA, Jeschke J, Vatapalli R,
Dave P, Hooker CM, Morgan R, Iacobuzio-Donahue CA, Liu B and Ahuja
N: KRAS G>A mutation favors poor tumor differentiation but may
not be associated with prognosis in patients with curatively
resected duodenal adenocarcinoma. Int J Cancer. 132:2502–2509.
2013. View Article : Google Scholar : PubMed/NCBI
|
|
47
|
Margonis GA, Kim Y, Spolverato G, Ejaz A,
Gupta R, Cosgrove D, Anders R, Karagkounis G, Choti MA and Pawlik
TM: Association between specific mutations in KRAS codon 12 and
colorectal liver metastasis. JAMA Surg. 150:722–179. 2015.
View Article : Google Scholar : PubMed/NCBI
|
|
48
|
Wickenden JA, Jin H, Johnson M, Gillings
AS, Newson C, Austin M, Chell SD, Balmanno K, Pritchard CA and Cook
SJ: Colorectal cancer cells with the BRAF(V600E) mutation are
addicted to the ERK1/2 pathway for growth factor-independent
survival and repression of BIM. Oncogene. 27:7150–7161. 2008.
View Article : Google Scholar : PubMed/NCBI
|
|
49
|
Gogada R, Yadav N, Liu J, Tang S, Zhang D,
Schneider A, Seshadri A, Sun L, Aldaz CM, Tang DG and Chandra D:
Bim, a proapoptotic protein, up-regulated via transcription factor
E2F1-dependent mechanism, functions as a prosurvival molecule in
cancer. J Biol Chem. 288:368–381. 2013. View Article : Google Scholar : PubMed/NCBI
|
|
50
|
Teräväinen TP, Myllymäki SM, Friedrichs J,
Strohmeyer N, Moyano JV, Wu C, Matlin KS, Muller DJ and Manninen A:
αV-integrins are required for mechanotransduction in MDCK
epithelial cells. PLoS One. 8:e714852013. View Article : Google Scholar : PubMed/NCBI
|
|
51
|
Ferreira LP, Gaspar VM and Mano JF: Design
of spherically structured 3D in vitro tumor models-advances and
prospects. Acta Biomater. 75:11–34. 2018. View Article : Google Scholar : PubMed/NCBI
|
|
52
|
Stevens PD, Wen YA, Xiong X, Zaytseva YY,
Li AT, Wang C, Stevens AT, Farmer TN, Gan T, Weiss HL, et al: Erbin
suppresses KSR1-mediated RAS/RAF signaling and tumorigenesis in
colorectal cancer. Cancer Res. 78:4839–4852. 2018. View Article : Google Scholar : PubMed/NCBI
|
|
53
|
Riedl A, Schlederer M, Pudelko K, Stadler
M, Walter S, Unterleuthner D, Unger C, Kramer N, Hengstschlager M,
Kenner L, et al: Comparison of cancer cells in 2D vs 3D culture
reveals differences in AKT-mTOR-S6K signaling and drug responses. J
Cell Sci. 130:203–218. 2017. View Article : Google Scholar : PubMed/NCBI
|
|
54
|
Luca AC, Mersch S, Deenen R, Schmidt S,
Messner I, Schäfer KL, Baldus SE, Huckenbeck W, Piekorz RP, Knoefel
WT, et al: Impact of the 3D microenvironment on phenotype, gene
expression, and EGFR inhibition of colorectal cancer cell lines.
PLoS One. 8:e596892013. View Article : Google Scholar : PubMed/NCBI
|
|
55
|
Derouet M, Wu X, May L, Hoon Yoo B,
Sasazuki T, Shirasawa S, Rak J and Rosen KV: Acquisition of anoikis
resistance promotes the emergence of oncogenic K-ras mutations in
colorectal cancer cells and stimulates their tumorigenicity in
vivo. Neoplasia. 9:536–545. 2007. View Article : Google Scholar : PubMed/NCBI
|