Introduction
Large-scale genomic analyses have demonstrated that
breast cancer cells contain genetic mutations with a moderate
frequency per coding megabase and high alterations of PIK3CA,
ERBB2, PTEN and CDH1 (1), compared
to non-small lung cell carcinoma and colorectal carcinoma.
Furthermore, microarray-based gene expression analyses have
indicated that breast cancers cluster into intrinsic subtypes, such
as luminal, HER2, basal-like and normal breast (NB)-like subtypes,
with characteristic genetic alterations being detected in each
subtype (2,3). For instance, the luminal A subtype is
associated with frequent alterations of PIK3CA, GATA3 and FOXA1,
while TP53, PIK3Ca and GATA3 are altered in the luminal B subtype,
HER2 and TP53 in the HER2 subtype, and TP53, RB1, PTEN and CCNE1 in
the basal-like subtype (4).
Although breast cancer patients markedly benefit from personalized
therapy (5–9), unlike patients with non-small lung
cancer whose treatments are based on multiple genetic mutations,
treatment strategies are primarily based on endocrine
responsiveness and/or HER2 amplification rather than multiple gene
mutations. Thus, large-scale genomic analyses of associated
mutations and corresponding expression levels may provide an
overview of the unique characteristics for each carcinoma type.
The pathological classification of breast cancer is
partially associated with intrinsic subtypes (10,11)
and the former has a much smaller role in designing treatment
regimens compared to the latter. However, importantly, pathological
morphology provides information regarding the phenotypic
heterogeneity of tumors, as morphological characteristics represent
the integrated sum of all molecules that are produced in cancer
cells and are interconnected thereby. Hence, accurate
interpretation of differences in pathological morphology is
imperative to understanding carcinogenesis. A single tumor displays
considerable diversity in morphology and characteristics, which is
composed of diverse cell types harboring different mutations and
gene expression profiles (12,13).
The cancer stem cell theory (14)
and stochastic theory (clonal selection and expansion theory)
(15) have been proposed to explain
how tumors acquire such diversity. A comprehensive understanding of
tumor diversity is important for deciphering the clinical symptoms
and biological mechanisms underlying the sensitivity and/or
resistance of primary tumors to therapeutic interventions and for
effectively managing recurrence and/or metastasis.
DNA extracted from formalin-fixed paraffin-embedded
(FFPE) samples has been used to reveal associations between
morphology and mutational diversity in human solid cancers.
Heterogeneous glucose-6-phosphate dehydrogenase (16) on the X chromosome based on the
lyonization theory (17), androgen
receptor polymorphism (18), loss
of heterozygosity (LOH) (19,20),
comparative genomic hybridization (21) and oncogene analysis have been
utilized to analyze the clonality of breast cancer subtypes.
However, these methods are insufficient to determine the lineage of
all tumor cells in a patient. For instance, analysis of
polymorphisms in the gene encoding the androgen receptor is limited
to males, while the LOH method is limited to tumors induced by
genetic abnormalities. Mutations accumulate in intracellular
mitochondrial DNA (mtDNA) during cellular aging and tumorigenesis,
particularly in the D-loop region, due to the absence of
mtDNA-specific DNA repair enzymes. A previous study by our group
indicated that analyzing mutations in the D-loop region is a useful
technique for understanding cancer cell clonality (22). Prior to the advent of
next-generation sequencing, mtDNA D-loop analysis was used to
determine tumor cell clonality independent of gender or genetic
abnormalities.
The objective of the present study was to elucidate
the clonal relationships of cancer cells occurring in tumors
exhibiting both ductal and lobular phenotypes based on
morphological features using next-generation sequencing of a novel
CCP, in addition to the conventional mtDNA D-loop analysis
method.
Materials and methods
FFPE samples from patients with breast
cancer
The samples of 464 patients with breast cancer who
underwent mastectomy between January 2013 and December 2014 at
Itabashi Hospital, Nihon University School of Medicine (Tokyo,
Japan) were obtained. Among these, 433 had not undergone
preoperative chemotherapy and 14 had been diagnosed with combined
lobular and ductal carcinoma (CLDC). All tumor samples underwent
routine FFPE at the pathological diagnosis departments of our
hospital. The pathological diagnoses were made according to the
classification of breast tumors issued by the World Health
Organization (WHO) (23,24). Tumors comprising 10–90% of special
subtypes were defined as ‘mixed invasive breast carcinoma of no
special type (IBC-NST) and special subtypes’ by the WHO in general.
However, no distinct subtype or designation has been proposed for
mixed IBC-NST and invasive lobular carcinoma. Such tumors have been
given several designations, e.g., invasive ductulolobular
carcinoma, invasive ductal carcinoma with lobular features, or
ductal or lobular carcinoma (25).
In the present study, the definition of mixed ductal-lobular
carcinoma (MDL) given by McCart Reed et al (25) was used for carcinomas in which the
ductal component constitutes at least 10% of the tumor and the
lobular component constitutes ≥50%. It is also possible that
multiple ductal and lobular lesions are present in the same breast.
Therefore, the term, CLDC was used, which was defined by Tazaki
et al (26) for breast
carcinoma wherein lobular carcinoma coexists with ductal carcinoma
on the same side of the breast. Of the 14 CLDC cases, two with
tumors comprising lesions that contained sufficient DNA for
analytical purposes (1 µg or more) following laser microdissection
(LMD), were selected for the present study.
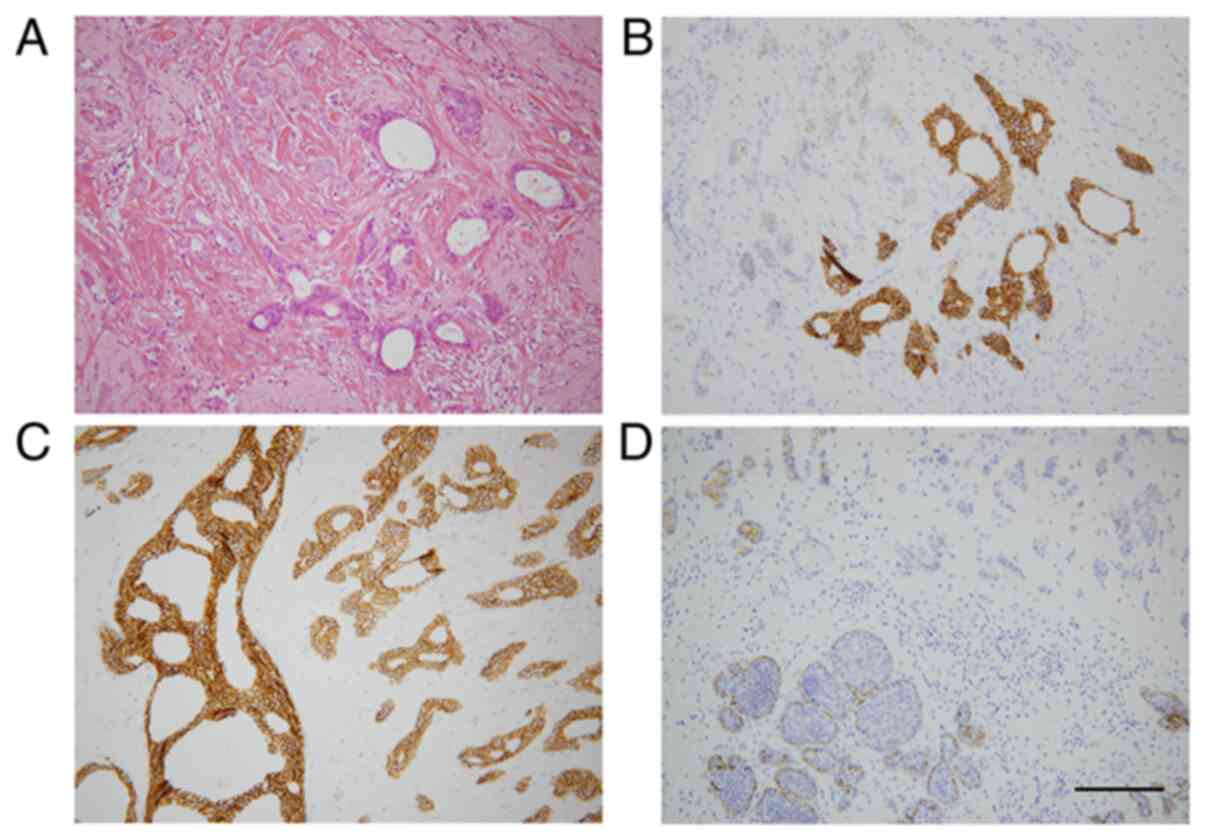
Case 1 comprised a main tumor in the outer cranial
region, an MDL lesion consisting of invasive lobular carcinoma
(ILC), lobular carcinoma in situ (LCIS), invasive ductal
carcinoma (IDC) and ductal carcinoma in situ (DCIS1)
(Fig. 1 and Tables I and II). An additional DCIS2 was also present
in the outer caudal region. DCIS1 and DCIS2 were discontinuous and
separate lesions. Flat epithelial atypia (FEA) was spread
throughout the mammary gland. Skin and lymph nodes, which are
extramammary non-neoplastic tissues (EMNT), were used as the
control.
 | Table I.Basic data in cases of combined
lobular and ductal carcinoma. |
Table I.
Basic data in cases of combined
lobular and ductal carcinoma.
| Variable | Case 1 | Case 2 |
|---|
| Age, years | 46 | 41 |
| Sex | Female | Female |
| Breast side | Right | Left |
| Operation | Bp+Bt | Bp |
| Number of
samples | 10 | 5 |
| Table II.Analysis of data in cases of combined
lobular and ductal carcinoma. |
Table II.
Analysis of data in cases of combined
lobular and ductal carcinoma.
|
| Case 1 | Case 2 |
|---|
|
|
|
|
|---|
| Histological
type | mthNA | dPCR | CCP | MDA | mthNA | dPCR | CCP | MDA |
|---|
| Extramammary
non-neoplastic tissue | + | + | + | + | + | + | + | + |
| Normal breast | + | + | / | + | + | / | + | + |
| Flat epithelial
atypia | + | + | / | + | + | + | + | + |
| Ductal carcinoma
in situ 1 | + | + | / | + | − | − | − | − |
| Ductal carcinoma
in situ 2 | + | + | + | + | − | − | − | − |
| Invasive ductal
carcinoma | + | + | + | + | + | + | + | + |
| Lobular carcinoma
in situ | + | + | / | + | + | + | + | + |
| Invasive lobular
carcinoma | + | / | + | + | − | − | − | − |
The samples from case 2 included IDC, ILC, LCIS and
FEA. These lesions were located in close proximity to each other
(Tables I and II). EMNT was obtained from lymph
nodes.
A total of 8 samples were obtained for case 1 and
five samples for case 2. Case 1 was a 46-year-old female, and case
2 was a 41-year-old female. Features of the patients, the samples
and experiments are listed in Tables
I and II.
The present study was performed in accordance with
the stipulations of the Declaration of Helsinki and was approved by
the institutional review board of the Nihon University School of
Medicine Ethics Committee (approval nos. 147, 115 and 250-1).
Written informed consent was obtained from all patients. The study
was performed according to the Japanese national guidelines
‘Ethical Guidelines for Medical and Health Research Involving Human
Subjects’ (the Ministry of Health, Labor and Welfare; Ministry of
Education, Culture, Sports, Science and Technology; and Ministry of
Economy, Trade and Industry).
LMD, DNA extraction and quality
assessment of DNA
FFPE tissue sections (10 µm) were prepared using a
DIRECTOR slide (cat. no. 11505158; Leica Microsystems GmbH).
Following deparaffinization, the sections were subjected to LMD
using an LMD 6000 (Leica Microsystems) according to the protocol
provided by the manufacturer. DNA was extracted from FFPE samples
using a RecoverAll Total Nucleic Acid Isolation kit (Thermo Fisher
Scientific, Inc.) with certain modifications, as described
previously (27). DNA quality was
determined by performing quantitative PCR (qPCR) for GAPDH using a
TaqMan® Gene Expression Assay kit (cat. no.
Hs02758991_g1; Thermo Fisher Scientific, Inc.). As a quality check
control, the ratio of sample DNA to frozen tissue DNA was
calculated using the delta quantification cycle (ΔCq) method and
the results are expressed as 2−ΔΔCq, as described
previously (27–29).
mtDNA D-loop analysis
mtDNA polymorphisms are frequently observed in
mutational hot spots, designated as hypervariable regions (HV)
(30). A total of two HVs were
located between bases 16,024-16,383 and 57–372 (30). For PCR, six sets of primers were
designed, including forward (F1-F6) and reverse sequences (R1-R6)
(Table III). PCR was performed on
each sample with eight different primer combinations as follows:
F1-R1, F2-R2, F3-R3, F1-R4, F4-R1, F3-R5, F5-R6 and F6-R3. The
reaction was performed in 20 µl reaction buffer of Takara Ex Taq
Hot Start Version (Takara Bio, Inc.), containing 1 ng of sample
DNA, under the following conditions: Preheating at 94°C for 60 sec;
35 cycles of 98°C for 10 sec and 60°C for 30 sec for
annealing/elongation, and a final extension at 72°C for 5 min.
Subsequently, 10 µl of the reaction products were subjected to 2%
agarose gel electrophoresis with GelRed (Biotium, Inc.). Sanger
sequencing was performed as described below using the reaction
products eluted from electrophoretic bands.
| Table III.Primers for direct sequencing of
mtDNA D-loop region. |
Table III.
Primers for direct sequencing of
mtDNA D-loop region.
| Primer name | NCBI no. | Primer
sequence |
|---|
| F1 | Mt16065-16084 |
5′-TGACTCACCCATCAACAACC-3′ |
| F2 | Mt16422-16441 |
5′-AATATCCCGCACAAGAGTGC-3′ |
| F3 | Mt111-130 |
5′-ACCCTATGTCGCAGTATCTG-3′ |
| F4 | Mt16196-16205 |
5′-ATGCTTACAAGCAAGTACAG-3′ |
| F5 | Mt311-330 |
5′-TCCCCCCGCTTCTGGCCACA-3′ |
| F6 | Mt528-547 |
5′-GCTGCTAACCCCATACCCCG-3′ |
| R1 | Mt16491-16510 |
5′-GGAACCAGATGTCGGATACA-3′ |
| R2 | Mt244-263 |
5′-CGGCTGTGCAGACATTCAAT-3′ |
| R3 | Mt585-604 |
5′-GCTTTGAGGAGGTAAGCTAC-3′ |
| R4 | Mt16153-16172 |
5′-TTGGGTTTTTATGTACTACA-3′ |
| R5 | Mt283-302 |
5′-TTTGGTGGAAATTTTTTGTT-3′ |
| R6 | Mt495-514 |
5′-ACCCCCGCCCATCCTACCCA-3′ |
In the absence of a consensus regarding the
designation of genetic alterations in mtDNA, definitions in the
present study were as follows: A single nucleotide polymorphism
(SNP) was defined as a single base difference between individuals,
as reported in the National Center for Biotechnology Information
(NCBI) reference sequence (https://www.ncbi.nlm.nih.gov/nuccore/NC_012920), where
all tissues in each case were identical. A single nucleotide
variation (SNV) was defined as a single nucleotide sequence
mismatch in a specific harvested tissue, differentiated from SNP. A
simple sequence repeat number variation (SSRNV) was defined as a
variation of the number of one or several simple base repeat
sequences, in a manner that is inconsistent with repetition in
EMNT. It was confirmed that the number of SSRNV repeats was not a
technical artifact caused by PCR previously (31).
SSRNVs were detected in HV (Mt57-372) and in non-HV
(Mt516-525). Regarding SSRNVs of mtDNA HV (Mt303-310), altered
repeat numbers were observed, with the coexistence of repeat
numbers C8 and C7 in NB and C8 homologically observed in neoplastic
lesions. This was designated as loss of variation (LOV). Regarding
SSRNVs in non-HV (–525), the homological repeat of CA7 in normal
tissue with acquired coexistence of CA6/7 in neoplastic lesions was
observed, for which it was designated as a gain of variation
(GOV).
Amplicon sequencing
DNA from 9 samples (case 1: EMNT, DCIS2, IDC and
ILC; case 2: EMNT, NB, FEA, IDC and LCIS) (Tables I and II), were used for amplicon sequencing by
an Ion AmpliSeq Comprehensive Cancer Panel (CCP) on an Ion Torrent
platform (Thermo Fisher Scientific, Inc.) according to the
manufacturers’ protocols with specific modifications as below.
Although the manufacturer's protocol recommended to check the
amount of DNA using Qbit, the current study checked it according to
the method reported by Nakayama et al (27). The panel consists of ~16,000 primer
pairs covering all exons of 409 cancer-associated genes (1.6
megabases of target sequences). DNA (120 ng) was used to prepare
the libraries with IonXpress barcoded adapters. An Ion Proton
Sequencer (Thermo Fisher Scientific, Inc.) was used for sequencing
with the ion chip.
Sequencing results were analyzed using the Torrent
Suite Software (Thermo Fisher Scientific, Inc.). Candidates for
cancer-specific SNVs were selected by Tumor-Normal pair analysis
version 4.2 of Ion Reporter (Thermo Fisher Scientific, Inc.) using
the following filters: >100 total reads; >10% of mutation
rate; and 0 reads of variant in a control non-mammary and non-tumor
sample. Interpretation of the clinical significances of detected
gene mutations was conducted by referring the oncology database of
Precision Oncology Knowledge Base (OncoKB, http://www.oncokb.org/) and Catalog of Somatic
Mutations In Cancer (COSMIC, http://cancer.sanger.ac.uk/cosmic).
SYBR green allele-specific qPCR
SNVs detected by amplicon sequencing were validated
using SYBR-Green allele-specific qPCR. A number of genetic
mutations were detected in case 2; therefore, the highest and
second-highest mutation rates were selected for validation
analysis, resulting in four genes in case 2 being selected. The
target genes of interest, which were validated with SYBR-Green
allele-specific qPCR, are presented in Table SI. The small sample size in case 2
was accounted for by pre-amplifying the region targeted for
verification using specific primer sets (Table SII). A total of 10 ng of sample DNA
were allowed to react with 20 µl of Takara Ex Taq Hot Start Version
(Takara Bio, Inc.) in the presence of two sets of case 2 primers
(KMT2C and CDH1) as follows: Preheating at 94°C for 60 sec; 45
cycles of 98°C for 10 sec and 60°C for 30 sec as the annealing
temperature; and a final extension at 72°C for 5 min. PCR was
performed with two sets of case 2 primers (PIK3CA and TIMP3) as
follows: Preheating at 94°C for 60 sec; 45 cycles of 98°C for 10
sec and 55°C for 30 sec as the annealing temperature; 72°C for 60
sec; and a final extension at 72°C for 5 min.
Allele-specific qPCR was performed using the
Thunderbird SYBR qPCR Mix (Toyobo Life Science) with StepOnePlus
(Thermo Fisher Scientific, Inc.) and two primer sets.
Allele-specific primers for wild-type and mutant sequences, as well
as single reversely-directed primers, were designed by rectifying
melting temperatures to a similar temperature, based on the Nearest
Neighbor's method for melting temperature calculation (32). PCR was performed in a 10-µl reaction
by preheating at 95°C for 60 sec, followed by 40 cycles of 95°C for
15 sec and 60 to 65°C for 60 sec. Annealing temperatures for each
primer set are presented in Table
SI. The ratio of mutant allele to wild-type allele was
calculated as 2−ΔΔCq, in which ΔCq is calculated by
subtracting the Cq value of wild-type PCR from that of mutant PCR.
The mutant allele frequency was calculated as
2−ΔCq/(1+2−ΔCq).
The primer sets for the wild-type region of genes
with mutations were prepared and compared based on a quantitative
curve using SYBR green as the fluorescent probe. Mutation analysis
was performed based on the differences in amplification efficiency.
The primer sequences are presented in Table SI. The results were verified via
SYBR Premix Ex Taq (Takara Bio, Inc.) according to the
manufacturer's protocol. The mutant allele frequency was calculated
as described in the previous paragraph.
Sanger sequencing for mtDNA
D-loop
PCR products of the amplified mtDNA D-loop region
were purified using an Illustra ExoProStar 1-Step kit (Cytiva) and
sequenced using the BigDye Terminator version 1.1 cycle sequencing
kit (Thermo Fisher Scientific, Inc.). Following purification using
the BigDye Xterminator kit (Thermo Fisher Scientific, Inc.),
nucleotide sequences were determined using an ABI310 Genetic
Analyzer (Thermo Fisher Scientific, Inc.).
Sanger sequencing for
insertion/deletion mutation detected by amplicon sequencing
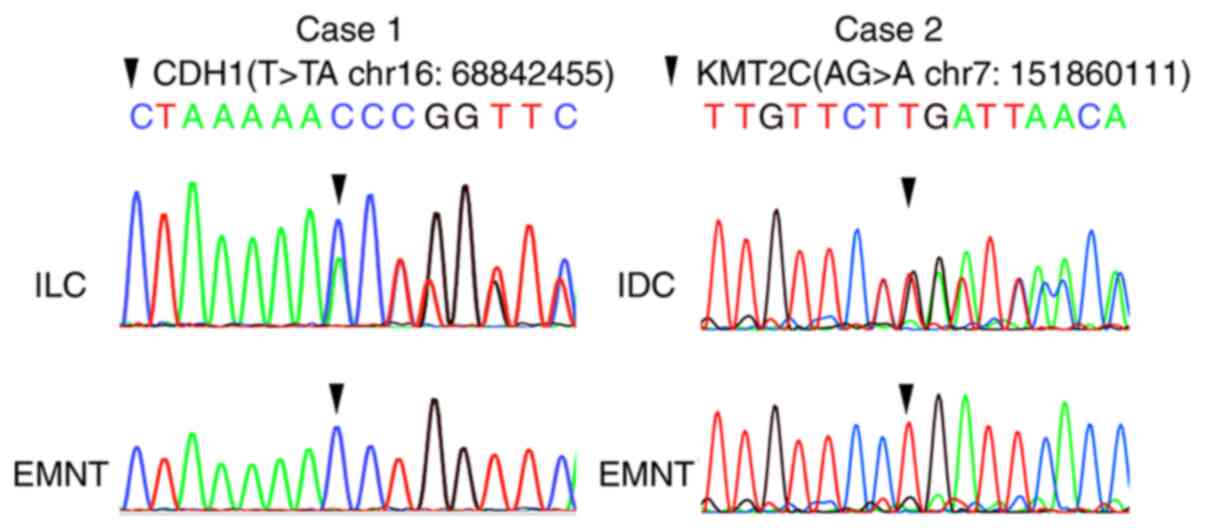
A total of two insertion/deletion mutations, namely
CDH1 (T>TA at chr16:68842455) of case 1 and KMT2C (AG>A at
chr7:151860111) of case 2, detected by amplicon sequencing, were
examined via Sanger sequencing. PCR and Sanger sequencing of CDH1
and KMT2C were performed using the same method that was described
for mtDNA D-loop using the primer pairs presented in Table SII.
Digital PCR
CDH1 and VPS45A were selected for verification of
the loss of chromosome 16q and gain of chromosome 1q, respectively.
RNase P, a reference assay probe, was used as an endogenous
control. The Quant Studio™ 3D Digital PCR System (Thermo Fisher
Scientific, Inc.) was used for qPCR. DNA samples (60 ng) were used
for the copy number variation (CNV) assay along with the
TaqMan® Copy Number Assay probe reagent for CDH1 (assay
ID, Hs05461677_cn; assay location, chr16:68800293; amplicon length,
88 bp) or VPS45A (assay ID, Hs02288810_cn; Thermo Fisher
Scientific, Inc.; assay location, chr1:150117372; amplicon length,
86 bp), TaqMan® Copy Number Reference Assay probe for
RNaseP [positon, chr14q11.2(20811565) on NCBI build 37; Thermo
Fisher Scientific, Inc.] and QuantStudio™ 3D Digital PCR Master Mix
v.2 (Thermo Fisher Scientific, Inc.) according to the
manufacturer's instructions. Distilled water was added to adjust
the total volume to 15 µl. The negative control reaction, which was
performed in a total volume of 16 µl, contained no DNA. This
negative control sample was used for each round of
thermocycling.
For each sample, 15 µl of each prepared reaction
mixture was loaded onto a QuantStudio 3D™ Digital PCR 20K Chip Kit
v.2 (Thermo Fisher Scientific, Inc.) using an automatic chip loader
and the signal was amplified using the following thermocycling
conditions: 95°C for 8 min; 45 cycles at 95°C for 15 sec and 56°C
for 1 min; and a final extension step at 60°C for 2 min.
Amplification followed by chip imaging and secondary analysis was
performed using the QuantStudio 3D Analysis Suit Software (version
3.0.2.2; Thermo Fisher Scientific, Inc.).
The results of the analysis yielded the copy numbers
of target genes (CDH1 and VPS45A) and a reference gene (RNAseP) per
microliter of each sample, which were used to calculate the ratio
of target genes to a reference gene. These calculations were based
on the theory that loss of chromosome 16q and gain of 1q resulted
in haploid and triploid copy numbers per cell, respectively. The
copy number of the target genes (copies/µl) was divided by that of
the reference gene (copies/µl) and the obtained ratios of CDH1 or
VPS45A to RNAseP in each sample were corrected, so that the ratios
of CDH1 or VPS45A to RNAseP of EMNT were 1. Usually, a normal cell
has two copies of CDH1 and RNAseP. A single 16q-loss cell has only
one copy of CDH1 and two copies of RNAseP. When the total sum of
16q-loss cells and normal cells is 100%, the proportion of 16q-loss
cells may be calculated by solving the two sets of simultaneous
equations. The same calculations were performed as for 1q gain
cells with normal cells having two copies of VPS45A and two copies
of RNAseP, while the 1q triploid cells had three copies of VPS45A
and two copies of RNAseP.
Results
Cancer-specific alterations in the
mtDNA D-loop
The results indicated that mtDNA SNPs were present
at 13 and 11 sites in the D-loops of cases 1 and 2, respectively
(Fig. 2A). SNPs were detected by
referring to the NCBI reference database. Only one SNV was detected
at the 16,160 locus in ILC samples (case 1; Table IV, Fig.
2B).
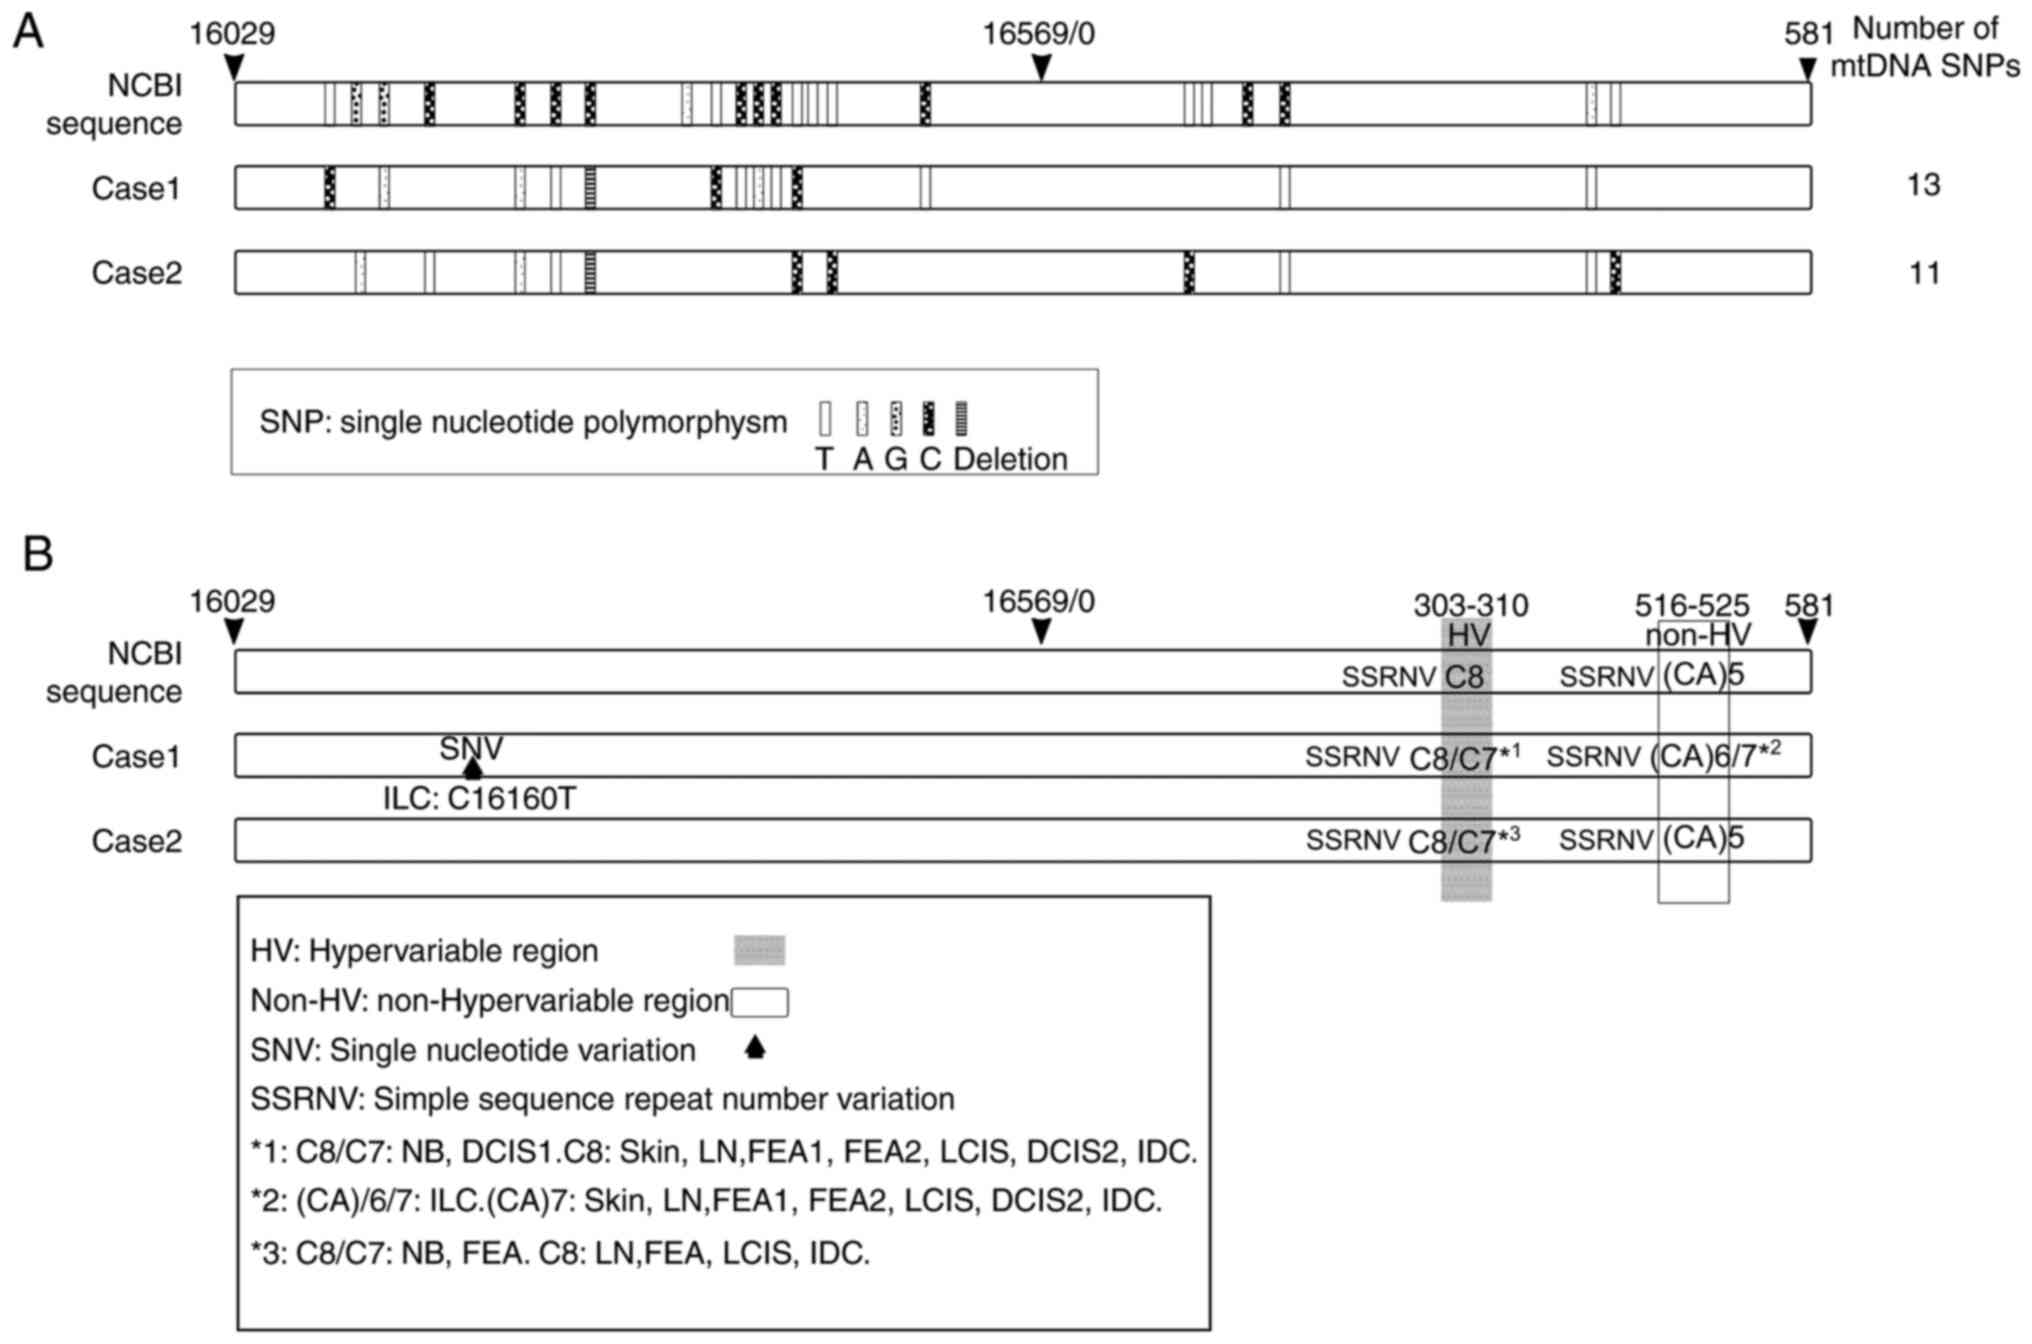 | Figure 2.SNPs, SNVs and SSRNVs detected in the
mtDNA D-loop region. White rectangles indicate the entire region of
the mtDNA D-loop. Sequence data from NCBI are provided as a
reference. (A) SNPs detected in non-tumor tissue of cases 1 and 2
are presented. (A) Small rectangular blocks indicate mitochondrial
SNPs and the density of dots in each block corresponds to each base
(T, A, G and C). (B) SNVs and SSRNVs detected in non-tumor tissue
of cases 1 and 2. Shaded areas indicate HV regions and white square
areas indicate non-HV regions; upward solid black arrows indicate
SNVs. *1, C8/C7 detected in NB and DCIS1; C8 detected in skin, LN,
FEA1, FEA2, LCIS, DCIS2 and IDC. *2, (CA)6/7 detected in ILC; (CA)7
detected in skin, LN, NB, FEA1, FEA2, LCIS, DCIS1, DCIS2 and IDC.
*3, C8/C7 detected in NB and FEA; C8 detected in LN, FEA, LCIS and
IDC. FEA, flat epithelial atypia; NB, normal breast; DCIS, ductal
carcinoma in situ; IDC, invasive ductal carcinoma; ILC,
invasive lobular carcinoma; LCIS, lobular carcinoma in situ;
LN, lymph node; NCBI, National Center for Biotechnology
Information; SNV, single nucleotide variant; SSRNV, simple sequence
repeat number variation; SNP, single nucleotide polymorphism; HV,
hypervariable region; mtDNA, mitochondrial DNA; CA, Cytosine and
adenine. |
| Table IV.Results of the mitochondrial DNA
D-loop region analysis. |
Table IV.
Results of the mitochondrial DNA
D-loop region analysis.
| Item | Case 1 |
|
| Case 2 |
|---|
| Type of
variation | SNV | SSRNV | SSRNV | SSRNV |
| NCBI no. | 16160 | 303-310 | 516-525 | 303-310 |
| Variation
sequence | C | C8 | (CA)7 | C8 |
|
EMNT | C | C8 | (CA)7 | C8 |
| NB | C | C8/C7 | (CA)7 | C8/C7 |
|
FEA | C | C8 | (CA)7 | C8/C7 |
|
DCIS1 | C | C8/C7 | (CA)7 | − |
|
DCIS2 | C | C8 | (CA)7 | − |
|
IDC | C | C8 | (CA)7 | C8 |
|
LCIS | C | C8 | (CA)7 | C8 |
|
ILC | C/T | C8 | (CA)7/(CA)6 | − |
SSRNVs were detected in two regions, one of which
was in HV (base numbers 303–310), while the other one was in non-HV
(base numbers 516–525; Fig. 2B).
For SSRNVs in HV, the coexistence of C8 and C7 was detected in NB
and DCIS1 (case 1) and NB and FEA (case 2) (Table IV, Fig.
2B). For SSRNVs in non-HV, the coexistence of CA7 and CA6 was
detected in ILC (case 1) (Table
IV, Fig. 2B).
Loss of chromosome 16q and gain of
1q
In case 1, the estimated proportions of cells with a
loss of chromosome 16q were as follows: FEA, 37.2%; DCIS1, 0%;
DCIS2, 65.0%; IDC, 36.8%; LCIS, 46.2%; and ILC, 47.8% (Tables V and VI). The estimated proportion of cells
with a 1q gain was as follows: FEA, 35.0%; DCIS1, 31.0%; DCIS2,
131.4%; IDC, 82.6%; LCIS, 97.8%; and ILC, 75.0% (Tables V and VI).
| Table V.Results of digital PCR with regard to
16q loss |
Table V.
Results of digital PCR with regard to
16q loss
| Case/tissue
type | CDH1
(copies/µl) | RNaseP
(copies/µl) | CDH1/RNaseP | Corrected
valuea | Loss
cellsb (%) |
|---|
| Case 1 |
|
|
|
|
|
|
EMNT | 572.84 | 564.29 | 1.02 | 1.00 | 0.0 |
|
FEA | 286.06 | 342.03 | 0.84 | 0.82 | 37.2 |
|
DCIS1 | 533.63 | 502.71 | 1.06 | 1.05 | 0.0 |
|
DCIS2 | 266.08 | 388.53 | 0.69 | 0.68 | 65.0 |
|
IDC | 281.67 | 340.02 | 0.83 | 0.82 | 36.8 |
|
LCIS | 278.52 | 356.85 | 0.78 | 0.77 | 46.2 |
|
ILC | 256.61 | 331.98 | 0.77 | 0.76 | 47.8 |
| Case 2 |
|
|
|
|
|
|
EMNT | 507.97 | 466.36 | 1.09 | 1.00 | 0.0 |
|
FEA | 403.69 | 355.53 | 1.14 | 1.05 | 0.0 |
|
LCIS | 444.78 | 484.36 | 0.92 | 0.84 | 31.2 |
|
IDC | 535.35 | 523.79 | 1.02 | 0.94 | 12.8 |
| Table VI.Results of digital PCR with regard to
1q gain |
Table VI.
Results of digital PCR with regard to
1q gain
| Case/tissue
type | VPS45
(copies/µl) | RNaseP
(copies/µl) | VPS45A/RNaseP | Corrected
valuea | Gain
cellsb (%) |
|---|
| Case 1 |
|
|
|
|
|
|
EMNT | 500.36 | 526.09 | 0.95 | 1.00 | 0.0 |
|
FEA | 412.35 | 368.84 | 1.12 | 1.18 | 35.0 |
|
DCIS1 | 512.35 | 466.55 | 1.10 | 1.16 | 31.0 |
|
DCIS2 | 621.01 | 394.09 | 1.58 | 1.66 | 131.4 |
|
IDC | 400.64 | 298.08 | 1.34 | 1.41 | 82.6 |
|
LCIS | 494.98 | 349.57 | 1.42 | 1.49 | 97.8 |
|
ILC | 459.51 | 351.33 | 1.31 | 1.38 | 75.0 |
| Case 2 |
|
|
|
|
|
|
EMNT | 421.31 | 380.38 | 1.11 | 1.00 | 0.0 |
|
FEA | 523.07 | 363.02 | 1.44 | 1.30 | 59.4 |
|
LCIS | 560.53 | 421.00 | 1.33 | 1.20 | 39.6 |
|
IDC | 843.61 | 521.68 | 1.62 | 1.46 | 91.8 |
In case 2, the estimated proportions of cells with a
loss of chromosome 16q were as follows: FEA, 0%; LCIS, 31.2%; and
IDC, 12.8% (Tables V and VI). The estimated proportions of cells
with a gain of 1q were: FEA, 59.4%; LCIS, 39.6%; and IDC, 91.8%
(Tables V and VI).
Cancer-specific variations in 409
cancer-associated genes
The number of mutations that satisfied adopted
filters (described in the Materials and methods) was 5 and 15 in
cases 1 and 2, respectively (Table
SIII). Data for CCP, gene locus, altered genotype and variant
frequency calculated by dividing variant allele coverage by total
coverage, are presented in Table
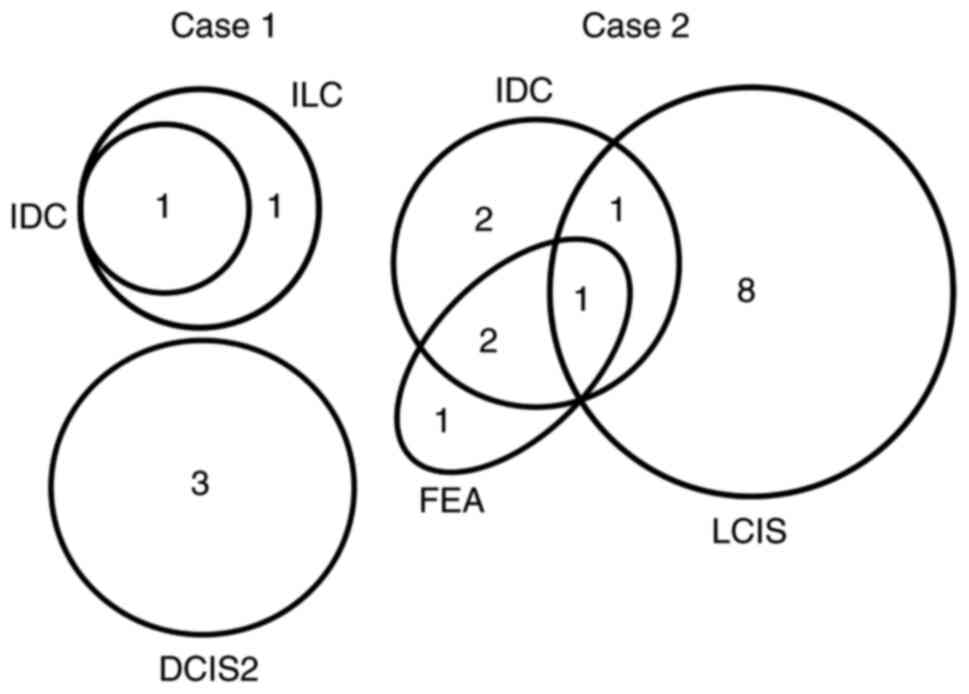
SIII. The mutation distribution among different lesions in each
case is represented by a Venn diagram (Fig. 3). In case 1, DCIS2, IDC and ILC
carried three, one and two mutations, respectively. IDC and ILC
shared one mutation, while DCIS2 carried 3 independent mutations.
DCIS1 did not share any common mutations with other lesions,
including DCIS2. In case 2, FEA, IDC and LCIS carried four, six and
10 mutations, respectively. FEA and IDC shared three, IDC and LCIS
shared two, and FEA and LCIS shared one mutation. Furthermore, one
common mutation was shared by FEA, IDC and LCIS, and FEA (Fig. 3).
Variant frequencies of gene mutations detected by
the CCP are provided in Table SIII
and the genes submitted for verification by allele-specific PCR are
presented in Table VII. For each
sample, the results of allele-specific PCR are presented in
Table VIII. In case 1, the
calculated mutation rate of CDH1 was 15% in IDC, 30% in LCIS and
34% in ILC. CDH1 mutation (p.Asn174fs; likely oncogenic according
to OncoKB, no entry in COSMIC) was detected in IDC and ILC samples.
However, it was not observed in any of the other samples,
indicating that the same mutation was shared by IDC and ILC.
Mutations in RRM1 existed only in ILC, while mutations of AKT1,
RALGDS and PIK3CA existed only in DCIS2, confirming the results
obtained with the CCP. In addition, CDH1 mutations (T>TA at
chr16:68842455) were detected using Sanger sequencing (Fig. 4).
| Table VII.Mutation of interest detected by
comprehensive cancer panel. |
Table VII.
Mutation of interest detected by
comprehensive cancer panel.
| A, Case 1 |
|---|
|
|---|
| Gene | Locus | Type | Genotype | RefSeq | Location | Function | Protein |
|---|
| PIK3CA | chr3:178952085 | SNV | A/T | NM_006218.4 | Exonic | Missense | p.His1047Leu |
| RALGDS | chr9:135977481 | SNV | G/A | NM_001271775.1 | Exonic | Synonymous | p.(=) |
| RRM1 | chr11:4123150 | SNV | G/T | NM_001033.3 | Intronic | n.d. | n.d. |
| AKT1 |
chr14:105246550 | INDEL | TC/TT | NM_001014431.1 | Exonic | Missense | p.Glu17Lys |
| CDH1 | chr16:68842455 | SNV | T/TA | NM_004360.3 | Exonic | Frameshift
insertion | p.Asn174fs |
|
| B, Case
2 |
|
| Gene | Locus | Type |
Genotype | RefSeq |
Location |
Function | Protein |
|
| PIK3CA | chr3:178936091 | SNV | G/A | NM_006218.2 | Exonic | Missense | p.Glu545Lys |
| KMT2C | chr7:151860111 | INDEL | AG/A | NM_170606.2 | Exonic | Frameshift
deletion | p.Pro3517fs |
| CDH1 | chr16:68772218 | SNV | C/T | NM_004360.3 | Exonic | Nonsense | p.Gln23Ter |
| TIMP3 | chr22:33245493 | SNV | C/G |
NM_003490.3/NM_000362.4 |
Intronic/exonic | Missense | /p.Thr59Arg |
| Table VIII.Results of mutation detection assay
and/or direct sequencing. |
Table VIII.
Results of mutation detection assay
and/or direct sequencing.
|
| Case 1 (%) | Case 2 (%) |
|---|
|
|
|
|
|---|
| Histology sample
type | CDH1 | RRM1 | AKT1 | RALGDS | PIK3CA | PIK3CA | KMT2C | CDH1 | TIMP3 |
|---|
| EMNT | 0 | 0 | 0 | 0 | 0 | 5 | 4 | 0 | 0 |
| NB | 0 | 0 | 0 | 0 | 0 | 17 | 1 | 1 | 5 |
| FEA | 0 | 0 | 0 | 0 | 0 | 31 | 0 | 0 | 40 |
| DCIS1 | 0 | 0 | 0 | 0 | 0 | / | / | / | / |
| DCIS2 | 0 | 1 | 31 | 21 | 9 | / | / | / | / |
| IDC | 15 | 0 | 0 | 0 | 0 | 99 | 1 | 0 | 52 |
| LCIS | 30 | 0 | 0 | 0 | 0 | 6 | 3 | 38 | 0 |
| ILC | 34 | 19 | 0 | 0 | 0 | / | / | / | / |
In case 2, a nonsense mutation of CDH1 (p.Gln23Ter,
likely oncogenic according to OncoKB, frequent 70 mutations
reported in COSMIC) (Fig. 4)
existed only in LCIS. Mutation of TIMP3 was shared by FEA and IDC.
Mutation of PIK3CA was shared in NB, FEA and IDC; these results
were consistent with those from the CCP. Mutations in KMT2C were
not detected by SYBR green allele-specific qPCR, supporting the
result of the CCP, which indicated a deletion in KMT2C in IDC
samples of case 2 (Fig. 4).
Summary of mtDNA mutation analysis and
verification of results of CNV and CCP by qPCR
A schematic of the progression of mutations in the
carcinoma cells of different histological types in each lesion is
provided in Fig. 5. In case 1,
DCIS1 cancer cells harbored a 1q gain and FEA exhibited additional
alterations of 16q loss and mtDNA LOV; this indicated that the two
pathways diverged from FEA, wherein an MDL lesion was characterized
by an increase in the ratio of 16q loss and acquired CDH1
mutations, as detected in IDC, LCIS and ILC. ILC samples further
gained an RRM1 mutation, an SNV at 16,160 and mtDNA GOV. The second
pathway was associated with distinct genetic alterations (AKT1,
RALGDS and PIK3CA) in DCIS2 that were topologically located in a
different area from that of IDC, LCIS and ILC. These genetic
alterations were not shared by DCIS1, IDC, LCIS or ILC in an MDL
lesion, suggesting that the cancer cells in DCIS2 were of a
different clonal origin (Fig. 5).
Since FEA had a higher ratio of cells exhibiting 16q loss and 1q
gain, as well as a higher homogenization of mtDNA LOV compared to
those of DCIS1, FEA diagnosed under the present criteria appeared
to be a neoplastic lesion similar to DCIS1.
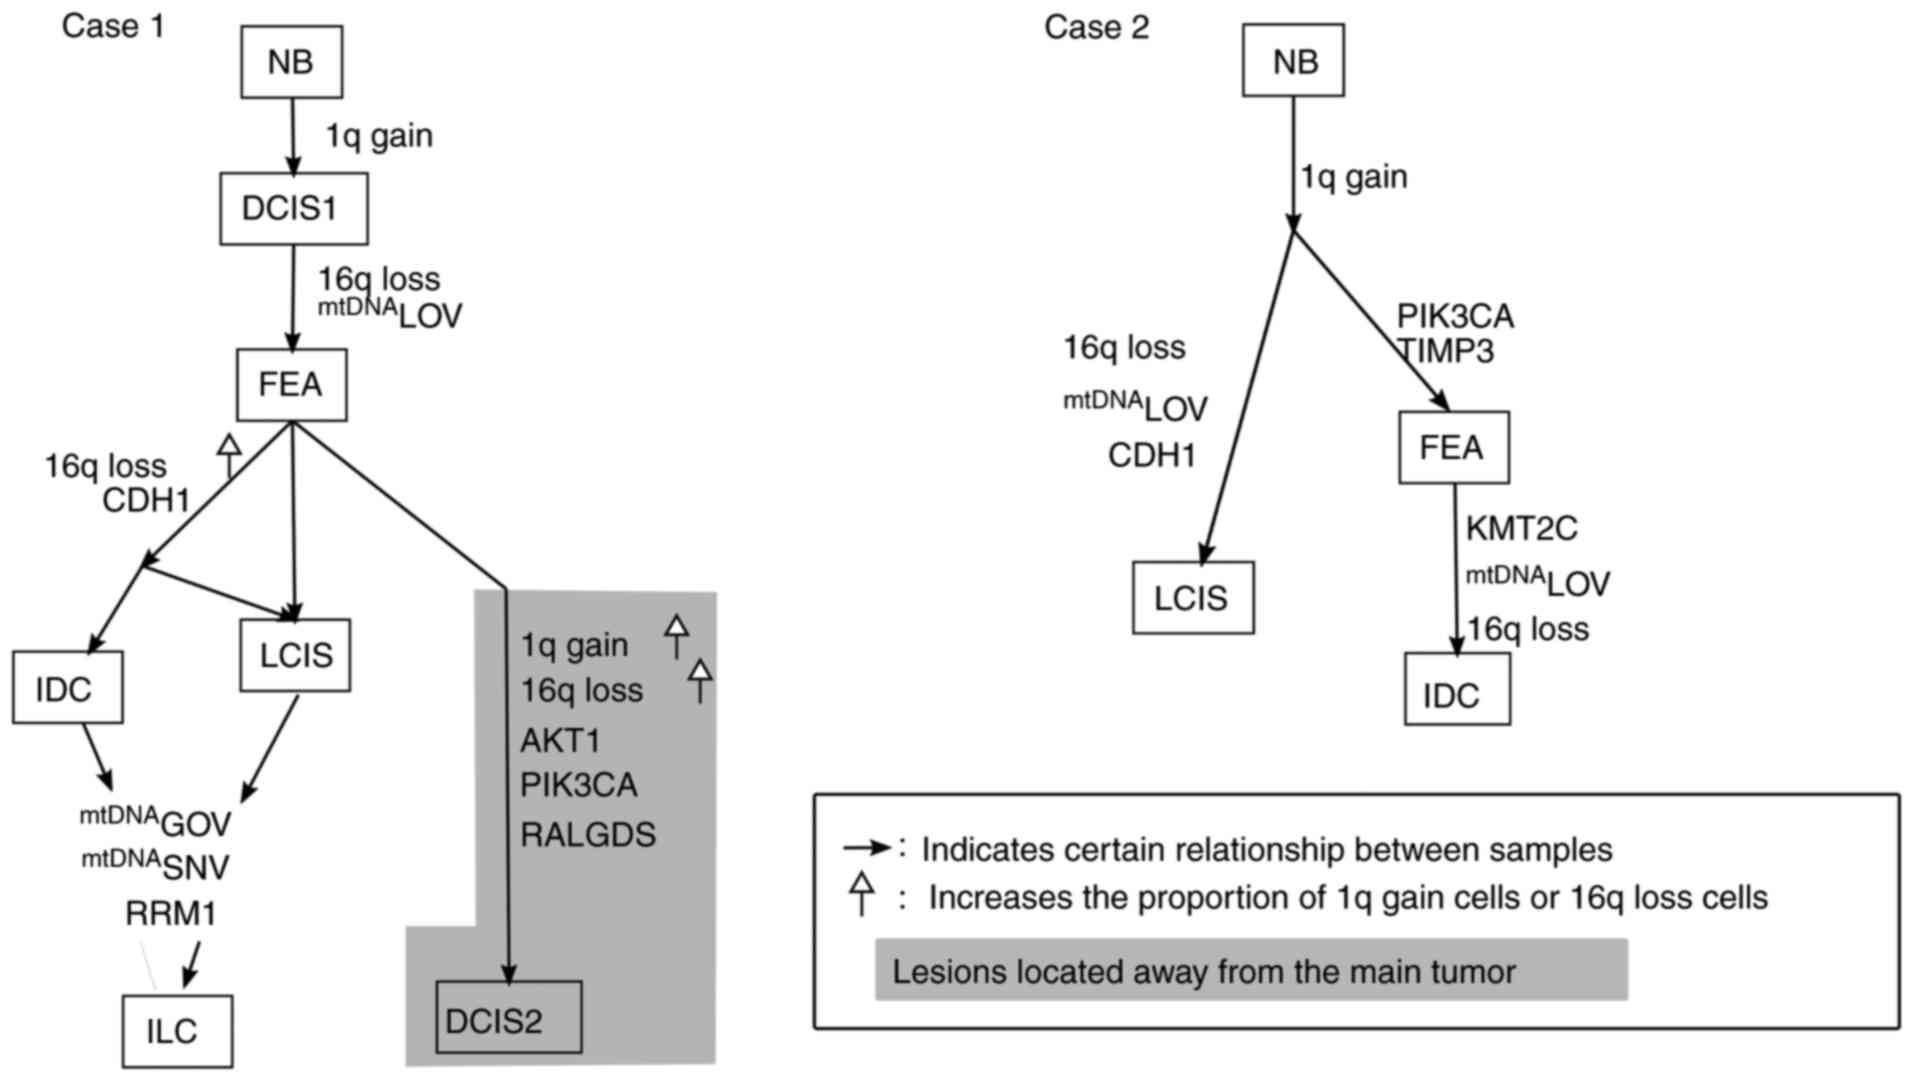 | Figure 5.Phylogenetic diagram based on the
results of the present study. Solid arrows indicate correlations
between lesions. Upward white arrows represent an increase in the
proportion of cells with 16q loss or 1q gain. Lesions located away
from the main tumor, topologically, are presented in the gray area.
mtDNA, mitochondrial DNA; SNV, single nucleotide variant; FEA, flat
epithelial atypia; NB, normal breast; DCIS, ductal carcinoma in
situ; IDC, invasive ductal carcinoma; ILC, invasive lobular
carcinoma; LCIS, lobular carcinoma in situ; LOV, loss of
variation; GOV, gain of variation. |
In case 2, cancer cells in which 1q gain was
detected in all lesions diverged into two paths. One branched out
to LCIS with mtDNA LOV [homogenization to C8 of SSRNV in HV
(303–310)], 16q loss and TIMP3 mutation. The other pathway involved
FEA acquiring PIK3CA and TIMP3 mutations. IDC samples acquired
additional KMT2C mutations, mtDNA LOV and 16q loss. In this case,
LCIS, IDC and FEA were topologically similar and these lesions
shared closely related mutations (Fig.
5).
Discussion
The present study demonstrated a phylogenetic
association between genetic alterations in two CLDC tumors.
Although only a limited number of cases were examined, it should be
emphasized that analyses performed by different methods provided
consistent results for each lesion in each case. CLDC exhibited the
basic gene alterations, 1q gain and/or 16q loss, and progressed to
IDC or ILC as mutations accumulated. This was demonstrated using
the conventional method of mtDNA mutation analysis, CNV was
examined via digital PCR and the novel method of the CCP verified
by SYBR green allele-specific qPCR.
A series of studies have indicated that LOH at
chromosome 16q is detected in 65% of low-grade ductal carcinomas
(33), 66–78% of tubular carcinomas
(34,35) and 63–100% of lobular carcinomas
(33–36), compared with 12% of high-grade
ductal carcinomas (33). Microarray
analysis indicated that the difference between low-grade (grade I
and II) ductal and lobular carcinoma was 5.8%, which was greater
than that observed in intrinsic subtypes and histological grades.
Genes exhibiting increased expression in lobular carcinomas
compared with those in low-grade ductal carcinomas were associated
with lipids, migration and transcription. By contrast, genes with
decreased expression were related to cell adhesion (CDH1), TGFβ,
cytoskeleton remodeling and DNA repair ubiquitin (37). Therefore, lobular carcinomas and
ductal carcinomas have been considered as distinct phenotypes with
unique gene expression profiles.
However, accumulating evidence pertaining to genetic
alterations indicates a close relationship between lobular
neoplasia and low-grade ductal carcinoma. As loss of 16q is
repeatedly reported in columnar cell lesion/FEA, lobular neoplasia,
atypical ductal hyperplasia (ADH) and low-grade DCIS, and 1q gain
is detected in lobular neoplasia, ADH and low-grade DCIS (38), the concept of ‘low nuclear grade
breast neoplasia family’ was postulated (39). By contrast, high-grade DCIS lacks 1q
gain or 16q loss and frequently displays 8q gain (38). Based on this evidence, the
hypothesis that low-grade and high-grade cancers develop via
different processes during the carcinogenesis of breast cancers
with exceptional progression from low-grade to high-grade cancer,
has been proposed (23). The
results of the present study supported that 16q loss and/or 1q gain
were extensively detected in such low-grade lesions.
The present study demonstrated that CLDC (excluding
an MDL lesion) may undergo different genetic alterations and
originate from distinct cells, even if the histological type is the
same as ductal carcinoma in situ (e.g., DCIS1 and DCIS2 in
case 1). With regard to MDL, the present study suggested that a
CDH1 mutation was detected in IDC at a low frequency (15%), as well
as LCIS (30%) and ILC (34%) in the MDL lesion of case 1.
Furthermore, ILC harbored the most frequent number of genetic
alterations, not only in nuclear DNA but also in the mtDNA D-loop.
The present results indicated that both ductal and lobular cancer
cells shared a common genetic ancestor, instead of incidentally
colliding. Following a study performed using comparative genomic
hybridization and whole-exome sequencing in four cases and
immunohistochemical analysis of 82 MDLs, McCart Reed et al
(25) reported that cancer cells
with a lobular phenotype progressed from ductal components. They
concluded that ‘these data support a model in which separate
morphological components of MDLs arise from a common ancestor and
lobular morphology can arise via a ductal pathway of tumour
progression’. The results of the present study support the proposed
model wherein an invasive lobular carcinomatous component in mixed
ductal-lobular carcinoma may arise from ductal carcinoma as well as
from LCIS, but not vice versa.
Of note, a CDH1 mutation detected in an MDL lesion
of case 1 (p.Agn174fs), which corresponded to the outermost domain
of E-cadherin that binds to neighboring cells, was not reported in
COSMIC, but detected in a mixed ductal-lobular carcinoma in a study
performed at the Memorial Sloan Kettering Cancer Center (40). By contrast, CDH1 mutation in case 2
(p.Gln23Ter) is most frequently detected in lobular lesions, which
is a nonsense mutation located near the N terminus that stops the
synthesis of E-cadherin protein. Genetic alterations and subsequent
transcription and/or translation result in altered protein
expression, such as completely negative or incompletely positive
membranous expression according to immunohistochemistry. Da Silva
et al (41) reported that
such aberrant E-cadherin expression may be detected in lobular
carcinoma due to transcriptional repression via TGF-β/SMAD2
activation, in addition to CDH1 mutation.
In the present study, tumors from cases 1 and 2
carried CDH1 mutations, in addition to deletions of 16q. The
locations of assay probes used for digital PCR (location,
chr16:68800293; amplicon length, 88 bp) and SYBR green
allele-specific qPCR (mutation location, chr16:68842455; amplicon
length, 122 bp) did not overlap, making it difficult to determine
the exact proportion of cancer cells harboring these mutations and
deletions. However, it is speculated that the following events
occurred: For instance for LCIS in case 1, the mutation was
detected in 30% of CDH1 genes on the remnant undeleted allele,
which was estimated at 77% as CDH1/RNaseP corrected by EMNT
(presented as corrected value). Therefore, the percentage of CDH1
without mutation or deletion was 53.9% {[(0.77 × (1-0.3)] ×100} in
LCIS of case 1. In the same manner, the percentage of CDH1 without
mutation was calculated as 50.2% in ILC of case 1 and 52.1% in LCIS
of case 2, compared with that in non-tumor tissues. There are no
data indicating the exact relationship between the percentage of
genes without mutation or deletion, the amount of protein
production and expression of CDH1 on immunohistochemistry. However,
it is possible that the decrease in CDH1 without any mutation or
deletion by about half (50.2–53.9%) caused a marked decrease of
E-cadherin protein synthesis, resulting in a negative reaction on
immunohistochemistry. At present, it is unclear whether mutations
occur on the remnant allele in the same cancer cells with deletion,
or on alleles in different cells with deletion. However, it is
certain that the levels of CDH1 without mutation or deletion were
decreased to approximately half in total.
There were a few limitations to the present study.
First, MDL and CLDL had small sample sizes. The cancer cells in an
MDL lesion examined in the present study were suggested to be of
the same origin, despite having different ‘lobular’ or ‘ductal’
morphological features. It has not been clarified whether the
cellular origin is constant for MDL. Furthermore, limited
methodologies were used for examination. mtDNA mutation analysis
and CNV and CCP for nuclear DNA (verified by qPCR) were examined,
while it was not clarified how the expression and methylation
status altered genes. As for the examination of CNV, analysis of
the 1q gain and 16q loss were limited to the narrow region of
VPS45A on 1q and CDH1 on 16q. Finally, aberrant results were
obtained for E-cadherin in lobular neoplasia; the relationship
between genetic alterations and these aberrant immunohistochemical
findings were not clarified. These limitations will be addressed in
future studies and the carcinogenesis of MDL and CLDL will be
clarified.
In conclusion, the present study demonstrated that
an MDL lesion is composed of cancer cells with closely related
genetic characteristics. Thus, it is likely that adjacent lobular
and ductal carcinomas arose from the same origin. MDL should be
defined as a distinct category that is separate from CLDC, which
includes multiple incidentally coexisting lesions in its
definition. Although breast cancers occasionally exhibit
morphological diversity, understanding the relationship between
genetic alterations and morphology will help elucidate mechanisms
underlying the development of cancer and aid in the development of
therapeutic interventions for recurrent metastasized cancers.
Supplementary Material
Supporting Data
Acknowledgements
The authors would like to thank Dr Hiromi Yamaguchi
and Ms. Yukari Hirotani (Department of Pathology and Microbiology,
Nihon University School of Medicine) for their helpful technical
guidance and assistance. The authors would also like to thank
Professor Keiichiro Tada (Department of Surgery, Nihon University
School of Medicine), for their collaboration, clinical guidance and
assistance.
Funding
This work was supported by JSPS KAKENHI (grant nos.
24590433 and 15K08357), a grant from the MEXT-Supported Program for
the Strategic Research Foundation at Private Universities (grant
no. S1091023) and a Nihon University Multidisciplinary Research
Grant (grant no. M14-012).
Availability of data and materials
The datasets used and/or analyzed during the current
study are available from the Japanese Genotype-phenotype Archive
(accession no. JGAS000300). Any further clinical data, they are
available from the corresponding author upon reasonable
request.
Authors' contributions
The present study plan was proposed by SM and all of
the experiments were performed by HK. ME and TN significantly
contributed to acquisition, analysis and interpretation of the data
obtained. ME provided advice on molecular technologies, and TN
confirmed that SSRNV of mtDNA was not a technical artifact caused
by PCR. HK, SM and YN interpreted the data, and were involved in
critically drafting and revising the results of this study. HK and
SM wrote the manuscript, and all of the authors read and approved
the final manuscript. HK, SM, YN and ME confirmed the authenticity
of the raw data.
Ethics approval and consent to
participate
The study was approved by the institutional review
board of the Nihon University School of Medicine Ethics Committee
(Tokyo, Japan; approval nos. 147, 115 and 250-1). Written informed
consent was obtained from all patients.
Patient consent for publication
Written informed consent was obtained from all
patients for publication of analysis results and registration of
research data in the database
Competing interests
The authors declare that they have no competing
interests.
Glossary
Abbreviations
Abbreviations:
|
EMNT
|
extramammary non-neoplastic tissue
|
|
CCP
|
comprehensive cancer panel
|
|
CLDC
|
combined lobular and ductal
carcinoma
|
|
CNV
|
copy number variation
|
|
DCIS
|
ductal carcinoma in situ
|
|
FEA
|
flat epithelial atypia
|
|
FFPE
|
formalin-fixed paraffin-embedded
|
|
GOV
|
gain of variation
|
|
HV
|
hypervariable region
|
|
IDC
|
invasive ductal carcinoma
|
|
ILC
|
invasive lobular carcinoma
|
|
LCIS
|
lobular carcinoma in situ
|
|
LMD
|
laser microdissection
|
|
LN
|
lymph node
|
|
LOH
|
loss of heterozygosity
|
|
LOV
|
loss of variation
|
|
MDL
|
mixed ductal-lobular carcinoma
|
|
mtDNA
|
mitochondrial DNA
|
|
NB
|
normal breast
|
|
qPCR
|
quantitative PCR
|
|
SNP
|
single nucleotide polymorphism
|
|
SNV
|
single nucleotide variant
|
|
SSRNV
|
simple sequence repeat number
variation
|
References
|
1
|
AACR Project GENIE Consortium, . AACR
Project GENIE: Powering precision medicine through an international
consortium. Cancer Discov. 7:818–831. 2017. View Article : Google Scholar : PubMed/NCBI
|
|
2
|
Perou CM, Sørlie T, Eisen MB, van de Rijn
M, Jeffrey SS, Rees CA, Pollack JR, Ross DT, Johnsen H, Akslen LA,
et al: Molecular portraits of human breast tumours. Nature.
406:747–752. 2000. View
Article : Google Scholar : PubMed/NCBI
|
|
3
|
Sørlie T, Perou CM, Tibshirani R, Aas T,
Geisler S, Johnsen H, Hastie T, Eisen MB, van de Rijn M, Jeffrey
SS, et al: Gene expression patterns of breast carcinomas
distinguish tumor subclasses with clinical implications. Proc Natl
Acad Sci USA. 98:10869–10874. 2001. View Article : Google Scholar
|
|
4
|
Cancer Genome Atlas Network, .
Comprehensive molecular portraits of human breast tumours. Nature.
490:61–70. 2012. View Article : Google Scholar : PubMed/NCBI
|
|
5
|
Waks AG and Winer EP: Breast cancer
treatment: A Review. JAMA. 321:288–300. 2019. View Article : Google Scholar : PubMed/NCBI
|
|
6
|
Early Breast Cancer Trialists'
Collaborative Group (EBCTCG), ; Davies C, Godwin J, Gray R, Clarke
M, Cutter D, Darby S, McGale P, Pan HC, Taylor C, et al: Relevance
of breast cancer hormone receptors and other factors to the
efficacy of adjuvant tamoxifen: Patient-level meta-analysis of
randomised trials. Lancet. 378:771–784. 2011. View Article : Google Scholar : PubMed/NCBI
|
|
7
|
Slamon DJ, Clark GM, Wong SG, Levin WJ,
Ullrich A and McGuire WL: Human breast cancer: Correlation of
relapse and survival with amplification of the HER-2/neu oncogene.
Science. 235:177–182. 1987. View Article : Google Scholar : PubMed/NCBI
|
|
8
|
Cobleigh MA, Vogel CL, Tripathy D, Robert
NJ, Scholl S, Fehrenbacher L, Wolter JM, Paton V, Shak S, Lieberman
G and Slamon DJ: Multinational study of the efficacy and safety of
humanized anti-HER2 monoclonal antibody in women who have
HER2-overexpressing metastatic breast cancer that has progressed
after chemotherapy for metastatic disease. J Clin Oncol.
17:2639–2648. 1999. View Article : Google Scholar : PubMed/NCBI
|
|
9
|
Burstein HJ, Curigliano G, Loibl S, Dubsky
P, Gnant M, Poortmans P, Colleoni M, Denkert C, Piccart-Gebhart M,
Regan M, et al: Estimating the benefits of therapy for early-stage
breast cancer: The St. Gallen international consensus guidelines
for the primary therapy of early breast cancer 2019. Ann Oncol.
30:1541–1557. 2019. View Article : Google Scholar : PubMed/NCBI
|
|
10
|
Weigelt B, Geyer FC and Reis-Filho JS:
Histological types of breast cancer: How special are they? Mol
Oncol. 4:192–208. 2010. View Article : Google Scholar : PubMed/NCBI
|
|
11
|
Weigelt B, Horlings H, Kreike B, Hayes M,
Hauptmann M, Wessels L, De Jong D, Van de Vijver M, Van't Veer LJ
and Peterse J: Refinement of breast cancer classification by
molecular characterization of histological special types. J Pathol.
216:141–150. 2008. View Article : Google Scholar : PubMed/NCBI
|
|
12
|
Yates LR, Gerstung M, Knappskog S, Desmedt
C, Gundem G, Van Loo P, Aas T, Alexandrov LB, Larsimont D, Davies
H, et al: Subclonal diversification of primary breast cancer
revealed by multiregion sequencing. Nat Med. 21:751–759. 2015.
View Article : Google Scholar : PubMed/NCBI
|
|
13
|
Nik-Zainal S, Van Loo P, Wedge DC,
Alexandrov LB, Greenman CD, Lau KW, Raine K, Jones D, Marshall J,
Ramakrishna M, et al: The life history of 21 breast cancers. Cell.
149:994–1007. 2012. View Article : Google Scholar : PubMed/NCBI
|
|
14
|
Meacham CE and Morrison SJ: Tumour
heterogeneity and cancer cell plasticity. Nature. 501:328–337.
2013. View Article : Google Scholar : PubMed/NCBI
|
|
15
|
Greaves M and Maley CC: Clonal evolution
in cancer. Nature. 481:306–313. 2012. View Article : Google Scholar : PubMed/NCBI
|
|
16
|
Linder D and Gartler SM:
Glucose-6-phosphate dehydrogenase mosaicism: Utilization as a cell
marker in the study of leiomyomas. Science. 150:67–69. 1965.
View Article : Google Scholar : PubMed/NCBI
|
|
17
|
Lyon MF: Gene Action in the X-chromosome
of the Mouse (Mus musculus L.). Nature. 190:372–373. 1961.
View Article : Google Scholar : PubMed/NCBI
|
|
18
|
Wu Y, Basir Z, Kajdacsy-Balla A, Strawn E,
Macias V, Montgomery K and Guo SW: Resolution of clonal origins for
endometriotic lesions using laser capture microdissection and the
human androgen receptor (HUMARA) assay. Fertil Steril. 79 (Suppl
1):S710–S717. 2003. View Article : Google Scholar : PubMed/NCBI
|
|
19
|
Goldstein NS, Vicini FA, Hunter S, Odish
E, Forbes S and Kestin LL: Molecular clonality relationships in
initial carcinomas, ipsilateral breast failures, and distant
metastases in patients treated with breast-conserving therapy:
Evidence suggesting that some distant metastases are derived from
ipsilateral breast failures and that metastases can metastasize. Am
J Clin Pathol. 124:49–57. 2005. View Article : Google Scholar : PubMed/NCBI
|
|
20
|
Goldstein NS, Vicini FA, Hunter S, Odish
E, Forbes S, Kraus D and Kestin LL: Molecular clonality
determination of ipsilateral recurrence of invasive breast
carcinomas after breast-conserving therapy: Comparison with
clinical and biologic factors. Am J Clin Pathol. 123:679–689. 2005.
View Article : Google Scholar : PubMed/NCBI
|
|
21
|
Teixeira MR, Ribeiro FR, Torres L, Pandis
N, Andersen JA, Lothe RA and Heim S: Assessment of clonal
relationships in ipsilateral and bilateral multiple breast
carcinomas by comparative genomic hybridisation and hierarchical
clustering analysis. Br J Cancer. 91:775–782. 2004. View Article : Google Scholar : PubMed/NCBI
|
|
22
|
Masuda S, Kadowaki T, Kumaki N, Tang X,
Tokuda Y, Yoshimura S, Takekoshi S and Osamura RY: Analysis of gene
alterations of mitochondrial DNA D-loop regions to determine breast
cancer clonality. Br J Cancer. 107:2016–2023. 2012. View Article : Google Scholar : PubMed/NCBI
|
|
23
|
Lakhani SR, Rakha E and Simpson PT:
Invasive lobular carcinoma. WHO classification of tumours of the
breast. Lakhani SR, Ellis IO, Schnitt SJ, Tan PH and van de Vijver
MJ: International Agency for Research on Cancer; Lyon: 2012
|
|
24
|
Shin SJ, Desmedt C, Kristiansen G,
Reis-Filho JS and Sasano H: Invasive lobular carcinoma. Breast
Tumours. WHO Classification of Tumours Editorial Board (ed.), .
International Agency for Research on Cancer; Lyon: 2019
|
|
25
|
McCart Reed AE, Kutasovic JR, Nones K,
Saunus JM, Da Silva L, Newell F, Kazakoff S, Melville L, Jayanthan
J, Vargas AC, et al: Mixed ductal-lobular carcinomas: Evidence for
progression from ductal to lobular morphology. J Pathol.
244:460–468. 2018. View Article : Google Scholar : PubMed/NCBI
|
|
26
|
Tazaki E, Shishido-Hara Y, Mizutani N,
Nomura S, Isaka H, Ito H, Imi K, Imoto S and Kamma H:
Histopathologcial and clonal study of combined lobular and ductal
carcinoma of the breast. Pathol Int. 63:297–304. 2013. View Article : Google Scholar : PubMed/NCBI
|
|
27
|
Nakayama Y, Yamaguchi H, Einaga N and
Esumi M: Pitfalls of DNA quantification using DNA-binding
fluorescent dyes and suggested solutions. PLoS One.
11:e01505282016. View Article : Google Scholar : PubMed/NCBI
|
|
28
|
Einaga N, Yoshida A, Noda H, Suemitsu M,
Nakayama Y, Sakurada A, Kawaji Y, Yamaguchi H, Sasaki Y, Tokino T
and Esumi M: Assessment of the quality of DNA from various
formalin-fixed paraffin-embedded (FFPE) tissues and the use of this
DNA for next-generation sequencing (NGS) with no artifactual
mutation. PLoS One. 12:e01762802017. View Article : Google Scholar : PubMed/NCBI
|
|
29
|
Schmittgen TD and Livak KJ: Analyzing
real-time PCR data by the comparative C(T) method. Nature Protoc.
3:1101–1108. 2008. View Article : Google Scholar : PubMed/NCBI
|
|
30
|
Stoneking M: Hypervariable sites in the
mtDNA control region are mutational hotspots. Am J Hum Genet.
67:1029–1032. 2000. View
Article : Google Scholar : PubMed/NCBI
|
|
31
|
Nakai T, Sakurada A, Endo T, Kobayashi H,
Masuda S, Makishima M and Esumi M: Caution for simple sequence
repeat number variation in the mitochondrial DNA D-loop to
determine cancer-specific variants. Oncol Lett. 17:1883–1888.
2019.PubMed/NCBI
|
|
32
|
Rychlik W, Spencer WJ and Rhoads RE:
Optimization of the annealing temperature for DNA amplification in
vitro. Nucleic Acids Res. 18:6409–6412. 1990. View Article : Google Scholar : PubMed/NCBI
|
|
33
|
Hwang ES, DeVries S, Chew KL, Moore DH II,
Kerlikowske K, Thor A, Ljung BM and Waldman FM: Patterns of
chromosomal alterations in breast ductal carcinoma in situ. Clin
Cancer Res. 10:5160–5167. 2004. View Article : Google Scholar : PubMed/NCBI
|
|
34
|
Huiping C, Sigurgeirsdottir JR, Jonasson
JG, Eiriksdottir G, Johannsdottir JT, Egilsson V and Ingvarsson S:
Chromosome alterations and E-cadherin gene mutations in human
lobular breast cancer. Br J Cancer. 81:1103–1110. 1999. View Article : Google Scholar : PubMed/NCBI
|
|
35
|
Buerger H, Otterbach F, Simon R, Schäfer
KL, Poremba C, Diallo R, Brinkschmidt C, Dockhorn-Dworniczak B and
Boecker W: Different genetic pathways in the evolution of invasive
breast cancer are associated with distinct morphological subtypes.
J Pathol. 189:521–526. 1999. View Article : Google Scholar : PubMed/NCBI
|
|
36
|
Mohsin SK, O'Connell P, Allred DC and
Libby AL: Biomarker profile and genetic abnormalities in lobular
carcinoma in situ. Bresast Cancere Res Treat. 90:249–256. 2005.
View Article : Google Scholar : PubMed/NCBI
|
|
37
|
Weigelt B, Geyer FC, Natrajan R,
Lopez-Garcia MA, Ahmad AS, Savage K, Kreike B and Reis-Filho JS:
The molecular underpinning of lobular histological growth pattern:
A genome-wide transcriptomic analysis of invasive lobular
carcinomas and grade- and molecular subtype-matched invasive ductal
carcinomas of no special type. J Pathol. 220:45–57. 2010.
View Article : Google Scholar : PubMed/NCBI
|
|
38
|
Lopez-Garcia MA, Geyer FC, Lacroix-Triki
M, Marchio C and Reis-Filho JS: Breast cancer precursors revisited:
Molecular features and progression pathways. Histopathology.
57:171–192. 2010. View Article : Google Scholar : PubMed/NCBI
|
|
39
|
Abdel-Fatah TMA, Powe DG, Hodi Z,
Reis-Filho JS, Lee AHS and Ellis IO: Morphologic and molecular
evolutionary pathways of low nuclear grade invasive breast cancers
and their putative precursor lesions: Further evidence to support
the concept of low nuclear grade breast neoplasia family. Am J Surg
Pathol. 32:513–523. 2008. View Article : Google Scholar : PubMed/NCBI
|
|
40
|
Razavi P, Chang MT, Xu G, Bandlamudi C,
Ross DS, Vasan N, Cai Y, Bielski CM, Donoghue MT, Jonsson P, et al:
The genomic landscape of endocrine-resistant advanced breast
cancers. Cancer Cell. 34:427–438. e426. 2018. View Article : Google Scholar : PubMed/NCBI
|
|
41
|
Da Silva L, Parry S, Reid L, Keith P,
Waddell N, Kossai M, Clarke C, Lakhani SR and Simpson PT: Aberrant
expression of E-cadherin in lobular carcinomas of the breast. Am J
Surg Pathol. 32:773–783. 2008. View Article : Google Scholar : PubMed/NCBI
|