Introduction
High mobility group box-1 (HMGB1) protein,
discovered in the 1970s, is a non-histone nucleoprotein, rich in
eukaryotes. It has a highly conserved structure; the homology of
the amino acid sequence between humans and rodents is >99%
(1). HMGB1 is widely distributed
across different organs, including the lymph, heart, liver, kidney,
lung and brain tissues of various species, and has evolved to be a
substance necessary for life. Studies have demonstrated that
HMGB1 knock-out mice die several hours following their birth
(2). The localization of HMGB1 in
the nucleus is determined by two lysine-rich nuclear localization
sequences (NLS). The N-terminus of HMGB1 contains two repeats of
positively charged domains (A box and B box), and a negatively
charged C-terminus; these domains allow HMGB1 to bind to chromatin
DNA, thus participating in DNA repair, replication, transcription
and translation and the regulation of various cellular activities
(3–5). The function of HMGB1 is related to
its localization. HMGB1 in the nucleus participates in gene
expression and regulation (6),
whereas dynamically moving HMGB1 in the cytoplasm and nucleus is
involved in regulating axon growth, the taxis of smooth muscle
cells and the transfer of tumor cells (7,8).
Recent studies have demonstrated that when nuclear HMGB1 is
released into the extracellular space, it serves as an inflammatory
mediator that participates in numerous pathological and
physiological processes, maintaining and augmenting inflammatory
responses (9). Thus it has a key
role in the complex cytokine secretion and regulatory network
(10).
It is necessary for HMGB1 to be released into the
extracellular space in order to exert an inflammatory effect. In
the extracellular space, HMGB1 is a key ‘late’ pro-inflammatory
cytokine. In 1999, Wang et al reported the important role of
HMGB1 in sepsis (9). In recent
years, there have been an increasing number of studies
demonstrating that HMGB1 is involved in various diseases. As a
pro-inflammatory cytokine, the pathogenic action of HMGB1 has two
prominent characteristics. Firstly, the time at which HMGB1 takes
effect is relatively late. Unlike early pro-inflammatory cytokines,
such as the commonly seen tumor necrosis factor-α (TNF-α), HMGB1 is
not released into the extracellular space to exert its inflammatory
effect until at least 20 h following stimulation (2,9).
However, this is not the case in ischemia-reperfusion injuries
(11); it has been demostrated
that in ischemia-reperfusion models, HMGB1 release occurs within 4
h of stimulation, although the mechanism of this process remains
unclear. Secondly, HMGB1 is capable of sustaining and augmenting
the inflammatory response. It serves as an inflammatory cytokine
that participates in signal transduction and also interacts with
multiple pro-inflammatory cytokines to mutually induce expression
(12); it may also lead to the
nuclear translocation of the inflammatory signal molecule nuclear
factor (NF)-κB (13,14). HMGB1 contributes to a complex
cytokine secretion and regulatory network that initiates, sustains
and augments the inflammatory response. HMGB1 is a key component of
the inflammatory cytokine network (10), not only due to the cascade effect
of its own secretions, but also due to its role in regulating the
secretions of other inflammatory factors. HMGB1 has two methods of
release; active ‘secretion’ (15)
by activated immune cells and passive ‘leaking’ from apoptotic
cells (16). HMGB1 secretion by
activated immune cells has been widely studied, however there have
been relatively few studies with regard to HMGB1 secretion by
non-apoptotic cell entities. Previous studies by our group have
found that under TNF-α and LPS stimulation, a large amount of HMGB1
may be detected in the supernatants of liver cell cultures
(17,18), consistent with the results of Tsung
et al(19). This was a
novel finding for the physiological function of the liver. However,
the process of HMGB1 release by liver cells remains unclear. In
this study, HMGB1 release by the human mononuclear macrophage cell
line U937 was used as a reference, and the release of the late
pro-inflammatory cytokine HMGB1 by apoptotic liver cells was
investigated.
Materials and methods
Cell lines
Human mononuclear macrophage cell line U937 and
human liver cell lines L02 and HepG2 were purchased from the cell
bank of Shanghai Institute of Biochemistry and Cell Biology,
Chinese Academy of Science (Shanghai, China).
Study design
Cell lines L02, HepG2 and U937 were regularly
cultured. The number of cells was adjusted to 2.0×10⁶,
and the cells were transferred to opti-MEM1 low-serum medium
(Gibco, Carlsbad, CA, USA) for 4 h. Subsequently, LPS at a specific
final concentration was added and cellular supernatants were
collected at various time-points (0, 4, 8, 12, 16, 20 and 24 h).
Western blotting was performed to measure the HMGB1 protein level
and a methyl thiazolyl tetrazolium (MTT) assay was performed in
order to detect the survival rate of the cells. HMGB1 mRNA levels
were measured by reverse transcription polymerase chain reaction
(RT-PCR), apoptosis was detected using a fluorescent TUNEL assay
(Roche, USA) and HMGB1 translocation was examined by
immunofluorescence. Three independent measurements were performed
and results were averaged.
MTT assay
L02, HepG2 and U937 cells were cultured in 96-well
plates and treated with varying concentrations of LPS for different
durations. MTT (20 μl; Sigma, St. Louis, MO, USA) was added to each
well and cultured in an incubator at 37°C for 4 h. The supernatant
was then discarded and 150 μl DMSO was added to each well and
agitated for 10 min. An automated ELISA analyzer (Chondrex, USA)
was used for chromatometry. For the corresponding control group,
normal saline (NS) of the same volume as LPS was added; DMSO and a
low-serum medium were used for the baseline group. The cell
survival rate was calculated according to the following formula:
survival rate = (OD experimental group - OD baseline group)/(OD
control group - OD baseline group).
Measurement of lactic dehydrogenase (LDH)
content
Cellular supernatants of the HepG2, L02 and U937
cells were collected at various time-points (0, 4, 8, 12, 16, 20
and 24 h) and centrifuged to remove cell fragments. An Amicon
Ultra-4 ml 10 KD ultrafiltration centrifugal tube (Millipore Inc.,
Billerica, MA, USA) was used to concentrate the solution 20–50
times. LDH contents of the groups were subjected to routine
detection at the biochemistry laboratory of Xiangya Hospital,
Central South University (Changsha, China).
Detection of apoptosis by fluorescent
TUNEL assay
After each of the groups were treated, the cells
were fixed with 4% pre-cooled paraformaldehyde, placed on a
horizontal shaker at 25°C and subjected to gentle agitation for 60
min. Next, 0.1 ml permeating liquid was added and allowed to settle
at 4°C for 10 min; 50 μl TUNEL reaction mixture (Boehringer
Mannheim, Germany) was added to the wells of each experimental
group and reacted in the dark for 60 min at 37°C. Freshly prepared
DAPI working solution (1–2 drops of 2 mg/l) was added to stain the
nuclei and cells were observed under a fluorescent microscope.
Negative and positive control wells were also prepared. In the
negative control well, the reaction mixture was replaced by Vial 2
solution (Roche) and the well was placed in the dark for 1 h. In
the positive control well, following permeation, 3 U/ml DNase I
(Sigma) was added and allowed to react for 10 min at 25°C.
Subsequently, the reaction mixture was added for the TUNEL
reaction.
Detection of HMGB1 mRNA level by
RT-PCR
After treating each group, total RNA extraction and
RT were performed according to the manufacturer’s instructions
(Qiagen RNeasy Mini Extraction kit, Qiagen, Inc., Hilden, Germany).
The PCR primer was designed using Primer premier 5.0 software based
on human HMGB1 and β-actin cDNA sequences in the Genbank. The
primers were synthesized by Shanghai Sangon Biotech Co., Ltd.
(Shanghai, China) and their sequences were as follows: HMGB1, GAG
CAT AAG AAG AAG CAC CCA GAT GGG CGA TAC TCA GAG CAG AAG (target
fragment, 257 bp); and β-actin, GAC AGG ATG CAG AAG GAG ATT ACT TGA
TCC ACA TCT GCT GGA AGG T (target fragment, 142 bp). The PCR
reaction conditions for HMGB1 were as follows: 94°C for 4 min, 94°C
for 30 sec, 58°C for 30 sec, 72°C for 30 sec, and 32 cycles of 72°C
for 7 min. The PCR reaction conditions for β-actin were as follows:
94°C for 5 min, 94°C for 30 sec, 55°C for 30 sec, 72°C for 30 sec
and 30 cycles of 72°C for 7 min. Subsequently, PCR products (5 μl)
were subjected to 2% agarose gel electrophoresis and images were
captured under UV light. A bandscan imaging analysis system (Eagle
Eye II, Stralagene, USA) was used to scan the bands and the
photodensity of each band was acquired. The relative band density
of HMGB1 was calculated.
Measurement of HMGB1 protein by western
blotting
The cell culture supernatants from each group were
collected and the cell fragments were filtered out. An Amicon
Ultra-4ml 10 KD ultrafiltration centrifugal tube (Millipore Inc.)
was used to concentrate the solution and the Coomassie brilliant
blue method (Sigma) was used to measure the protein content. To a
40 μl sample, a loading buffer of the same volume was added and
mixed, and the mixture was subjected to denaturation by boiling.
Separating gel (10% SDS-PAGE) and 5% spacer gel were prepared, and
the samples were loaded for electrophoresis in an electrophoresis
buffer. The gels were electrotransferred to polyvinylidine
difluoride (PVDF) membranes. After blocking with a buffer
containing 5% skim milk powder for 30 min, rabbit anti-human
polyclonal antibody (Abcam, USA; 1:1,000 dilution)was added for an
overnight reaction at 4°C. Following washing with Tris-buffered
saline with Tween-20 (TBST), the PVDF membranes were incubated with
a secondary antibody (Merck, Germany; 1:500 dilution) for 1 h at
37°C. Following a further TBST wash, exposure, development,
fixation and positive image production were performed using the ECL
Western Blotting Detection kit (Amersham Pharmacia Biotech,
Amersham, UK), according to the manufacturer’s instructions . The
film was scanned and photodensity was analyzed using Quantity One
software (Bio-Rad, Hercules, CA, USA). The relative protein content
of different samples was calculated based on the known
concentration of recombinant human HMGB1.
HMGB1 translocation detection
Following each treatment period, the cell
supernatant from each group was discarded. After three washes with
PBS, cells were fixed with 4% paraformaldehyde for 15 min. The
cells were dried at room temperature, subsequently treated with
0.1% Triton x-100 at 4°C for 10 min and then blocking at room
temperature was performed for 30 min using a blocking buffer. The
cells were spun dry and rabbit anti-human polyclonal antibody
(1:1000 dilution) was added for an overnight incubation at 4°C.
Subsequently, following three washes with PBS, a fluorescein
isothiocyanate (FITC)-labeled fluorescent secondary antibody (1:750
dilution) was added for incubation at 37°C for 120 min. Following a
further three washes with PBS, DAPI (final concentration, 5 μmol/l)
was used for double staining at room temperature for 10 min, and
glycerol jelly was used to mount the slides. The slides were
examined under a fluorescent microscope, and Image-Pro Plus
software (Media Cybernetics, Rockville, MD, USA) was used for
semi-quantitative analysis of the relative fluorescence intensity
in the nuclei and cytoplasm.
Statistical analysis
The SPSS 13.0 software package was used to analyze
and process the data. A t-test was performed for comparison between
the groups and analysis of variance (ANOVA) was performed for
comparison within a group. P<0.05 was considered to indicate a
statistically significant difference.
Results
Effects of stimulation with various
concentrations of LPS
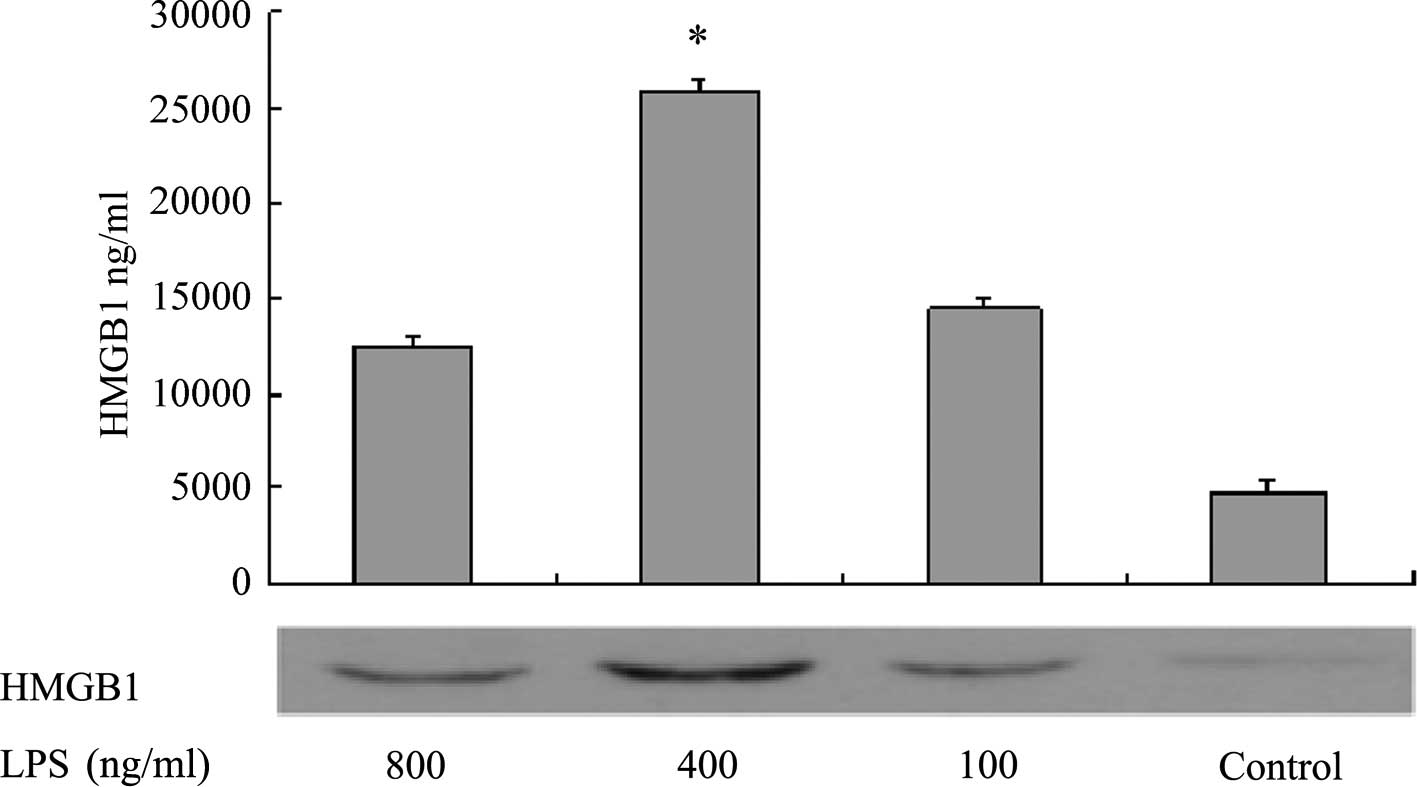
Western blotting was performed to measure HMGB1
levels in the supernatants of L02 cells 20 h after the addition of
various concentrations of LPS. The results demonstrated that when
the LPS concentration was in the range of 0–400 ng/ml, the
concentration of HMGB1 in the cell culture supernatant increased as
the LPS concentration increased. However, when the LPS
concentration was >400 ng/ml, the concentration of HMGB1 in the
supernatant no longer increased. At the final LPS concentration of
800 ng/ml, the HMGBI content was significantly lower than that when
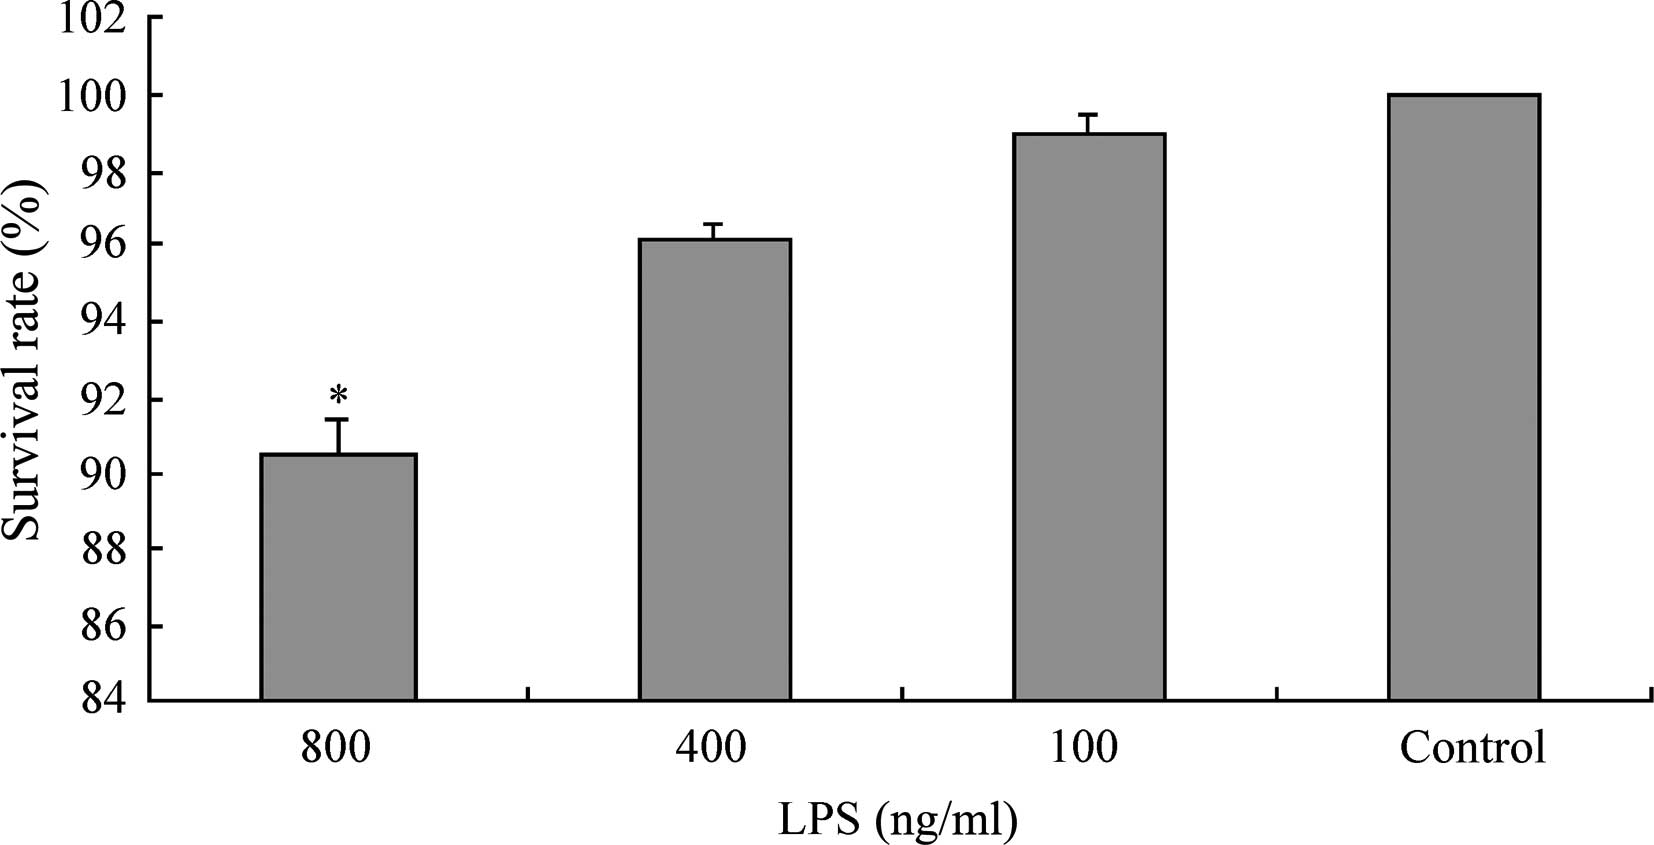
the LPS concentration was 400 ng/ml (P<0.05, Fig. 1). The MTT assay measured the
survival rates of L02 cells following 20 h of continuous exposure
to LPS at various concentrations (100, 400, 800 ng/ml). The results
demonstrated that when the LPS concentration was in the range 0–400
ng/ml, the survival rate of L02 cells was >95% (99.99±0.01,
98.97±0.52 and 96.18±0.34% for the control, LPS 100 ng/ml and 400
ng/ml groups, respectively). However, when the concentration of LPS
was increased to 800 ng/ml, the survival rate of the L02 cells
significantly decreased to 90.59±0.76% (Fig. 2).
Survival rates of HepG2, L02 and U937
cells at various time-points following the addition of LPS
As shown in Table
I, at 0–24 h following the addition of LPS, the survival rates
of HepG2, L02 and U937 cells were all >90%. However, at 48 h,
the survival rates significantly decreased (P<0.05), and the
level of HMGBl released passively by apoptotic cells also
increased. Therefore, we selected 0–24 h following treatment with
LPS to be the range for the measurement of damage-related factor
LDH, apoptosis detection, measurement of HMGB1 mRNA levels using
RT-PCR and the measurement of HMGB1 protein levels using western
blotting.
 | Table ISurvival rates of HepG2, L02 and U937
cells at various time-points following the addition of LPS,
measured by an MTT assay (mean ± SD, n=3). |
Table I
Survival rates of HepG2, L02 and U937
cells at various time-points following the addition of LPS,
measured by an MTT assay (mean ± SD, n=3).
| Survival rate
(%) |
|---|
|
|
|---|
| Group | 4 h | 8 h | 12 h | 16 h | 20 h | 24 h | 48 h |
|---|
| HepG2 | 99.30±0.18 | 98.63±0.22 | 96.98±0.79 | 95.47±2.14 | 94.24±0.99 | 91.01±1.17 | 83.54±1.26a |
| LO2 | 99.52±0.29 | 98.37±0.89 | 95.94±4.13 | 95.46±1.73 | 92.87±1.79 | 90.76±0.91 | 82.77±1.06a |
| U937 | 99.41±0.35 | 97.73±0.86 | 96.65±0.31 | 94.42±1.86 | 91.75±3.11 | 91.21±2.033 | 81.88±0.96a |
LDH contents in the supernatants of
HepG2, L02 and U937 cells at various time-points following the
addition of LPS
The LDH content in the supernatants of HepG2, L02
and U937 cells were measured at different time-points (0–24 h)
following the addition of 400 ng/ml LPS. The results demonstrated
that the LDH content in the cell supernatants of different groups
gradually increased with time; for each group, the LDH content in
the supernatant at 24 h was significantly higher than that at 0–20
h (P<0.05). However, at each time-point, there was no
significant difference in the LDH content in the cell supernatants
between the LPS-treated and corresponding control groups
(P>0.05; Table II).
| Table IILDH content in the supernatant of
cells from different groups at various time-points following the
addition of LPS (mean ± SD, n=3). |
Table II
LDH content in the supernatant of
cells from different groups at various time-points following the
addition of LPS (mean ± SD, n=3).
| LDH content
(U/l) |
|---|
|
|
|---|
| Group | 4 h | 8 h | 12 h | 16 h | 20 h | 24 h |
|---|
| HepG2 + NS | 0.0257±0.0021 | 0.1428±0.0024 | 0.1868±0.0068 | 0.2607±0.0175 | 0.4234±0.0563 | 1.1049±0.0831 |
| HepG2 + LPS | 0.0274±0.0018 | 0.1382±0.0046 | 0.1948±0.0057 | 0.2768±0.0368 | 0.4580±0.0242 | 1.1830±0.0732 |
| L02 + NS | 0.0247±0.0007 | 0.1091±0.0094 | 0.1162±0.0054 | 0.1191±0.0049 | 0.4173±0.0200 | 1.3330±0.2947 |
| L02 + LPS | 0.0252±0.0049 | 0.1181±0.0118 | 0.1212±0.0022 | 0.1374±0.0050 | 0.4221±0.0342 | 1.2616±0.1579 |
| U937 + NS | 0.0265±0.0022 | 0.1369±0.0021 | 0.1350±0.0092 | 0.1354±0.0142 | 0.4365±0.0096 | 1.7306±0.0373 |
| U937 + LPS | 0.0294±0.0024 | 0.1398±0.0086 | 0.1454±0.0232 | 0.1477±0.0199 | 0.4487±0.0288 | 1.5532±0.2679 |
Effect of LPS stimulation on the
apoptosis of HepG2, L02 and U937 cells
A TUNEL assay was used to detect the effect of LPS
(400 ng/ml) stimulation on the apoptosis of HepG2, L02 and U937
cells at various time-points following the addition of LPS (4, 8,
12, 16, 20 and 24 h); NS of the same volume was added to the
corresponding control groups. In the positive control, green
fluorescence was observed in complete or broken nuclei and blue
fluorescence in the same field of view marked cell nuclei
double-stained by DAPI. As shown in Figs. 3–5, it was observed that there was little
non-specific fluorescence in the HepG2, L02 and U937 cells at
various time-points (high magnification). The relative fluorescence
intensities of various cells are shown in Table III; there were no significant
differences between the different time-points. Furthermore, at the
same time-points, there were no significant differences between the
LPS-treated and corresponding control groups (P>0.05).
| Table IIIRelative fluorescence intensity
indicating apoptosis in cells from different groups at various
time-points following the addition of LPS (mean ± SD, n=3),
measured by fluorescence TUNEL assay. |
Table III
Relative fluorescence intensity
indicating apoptosis in cells from different groups at various
time-points following the addition of LPS (mean ± SD, n=3),
measured by fluorescence TUNEL assay.
| Fluorescence
intensity (U/l) |
|---|
|
|
|---|
| Group | Positive
control | Negative
control | 0 h | 4 h | 8 h | 12 h | 16 h | 20 h | 24 h |
|---|
| L02 + LPS | 6.3640±0.6084 | 0.0660±0.0261 | 0.0753±0.0246 | 0.0647±0.0260 | 0.0615±0.0112 | 0.0790±0.0197 | 0.0937±0.0091 | 0.0960±0.0313 | 0.1393±0.0325 |
| L02 + NS | 6.3640±0.6084 | 0.0660±0.0261 | 0.0607±0.0117 | 0.0780±0.0197 | 0.0740±0.0236 | 0.0743±0.0431 | 0.0877±0.0423 | 0.0947±0.0320 | 0.1270±0.0201 |
| HepG2 + LPS | 7.4211±0.7480 | 0.0377±0.0172 | 0.1047±0.0187 | 0.1257±0.0493 | 0.1190±0.0468 | 0.1213±0.0199 | 0.1320±0.0295 | 0.1047±0.0240 | 0.2143±0.0991 |
| HepG2 + NS | 7.4211±0.7480 | 0.0377±0.0172 | 0.0920±0.0166 | 0.1287±0.0252 | 0.1370±0.0275 | 0.1380±0.0556 | 0.1300±0.0393 | 0.1307±0.0335 | 0.2347±0.0735 |
| U937 + LPS | 4.9257±1.1101 | 0.0400±0.0190 | 0.1303±0.0345 | 0.1433±0.0545 | 0.1470±0.0578 | 0.1433±0.0539 | 0.1673±0.0524 | 0.1820±0.0174 | 0.2133±0.0467 |
| U937 + NS | 4.9257±1.1101 | 0.0400±0.0190 | 0.1127±0.0327 | 0.1400±0.0423 | 0.1443±0.0485 | 0.1420±0.0651 | 0.1707±0.0748 | 0.1920±0.0217 | 0.2077±0.0142 |
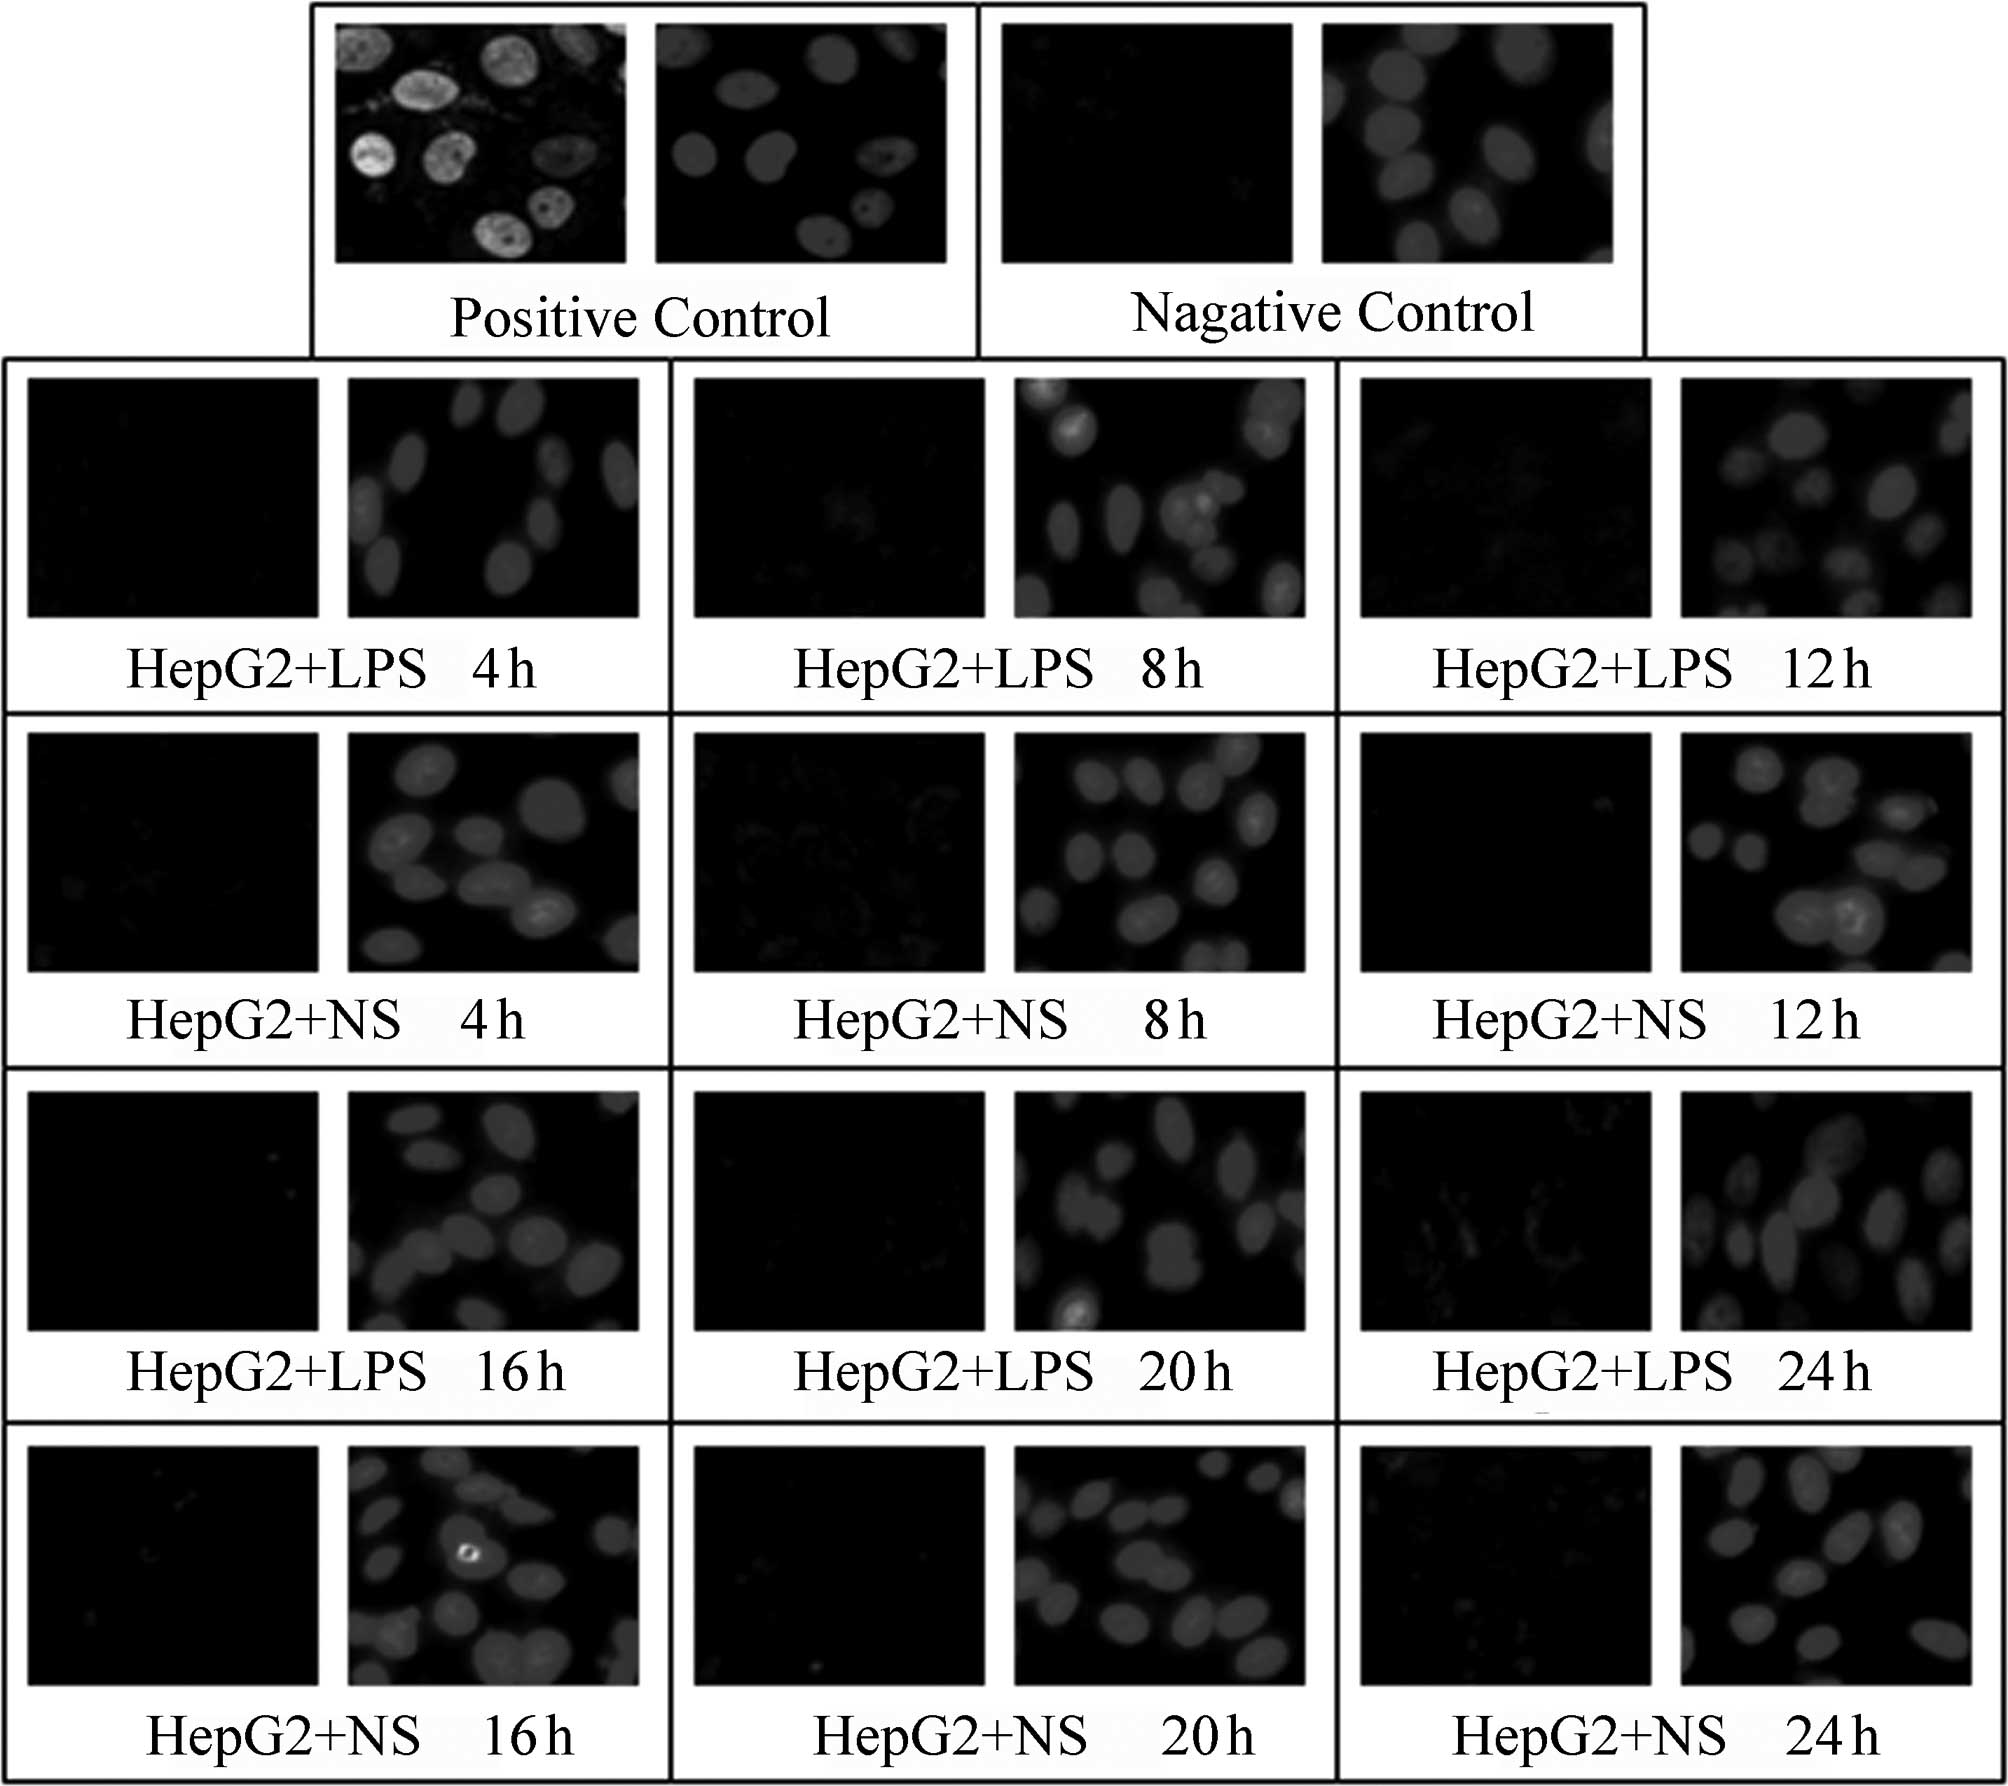
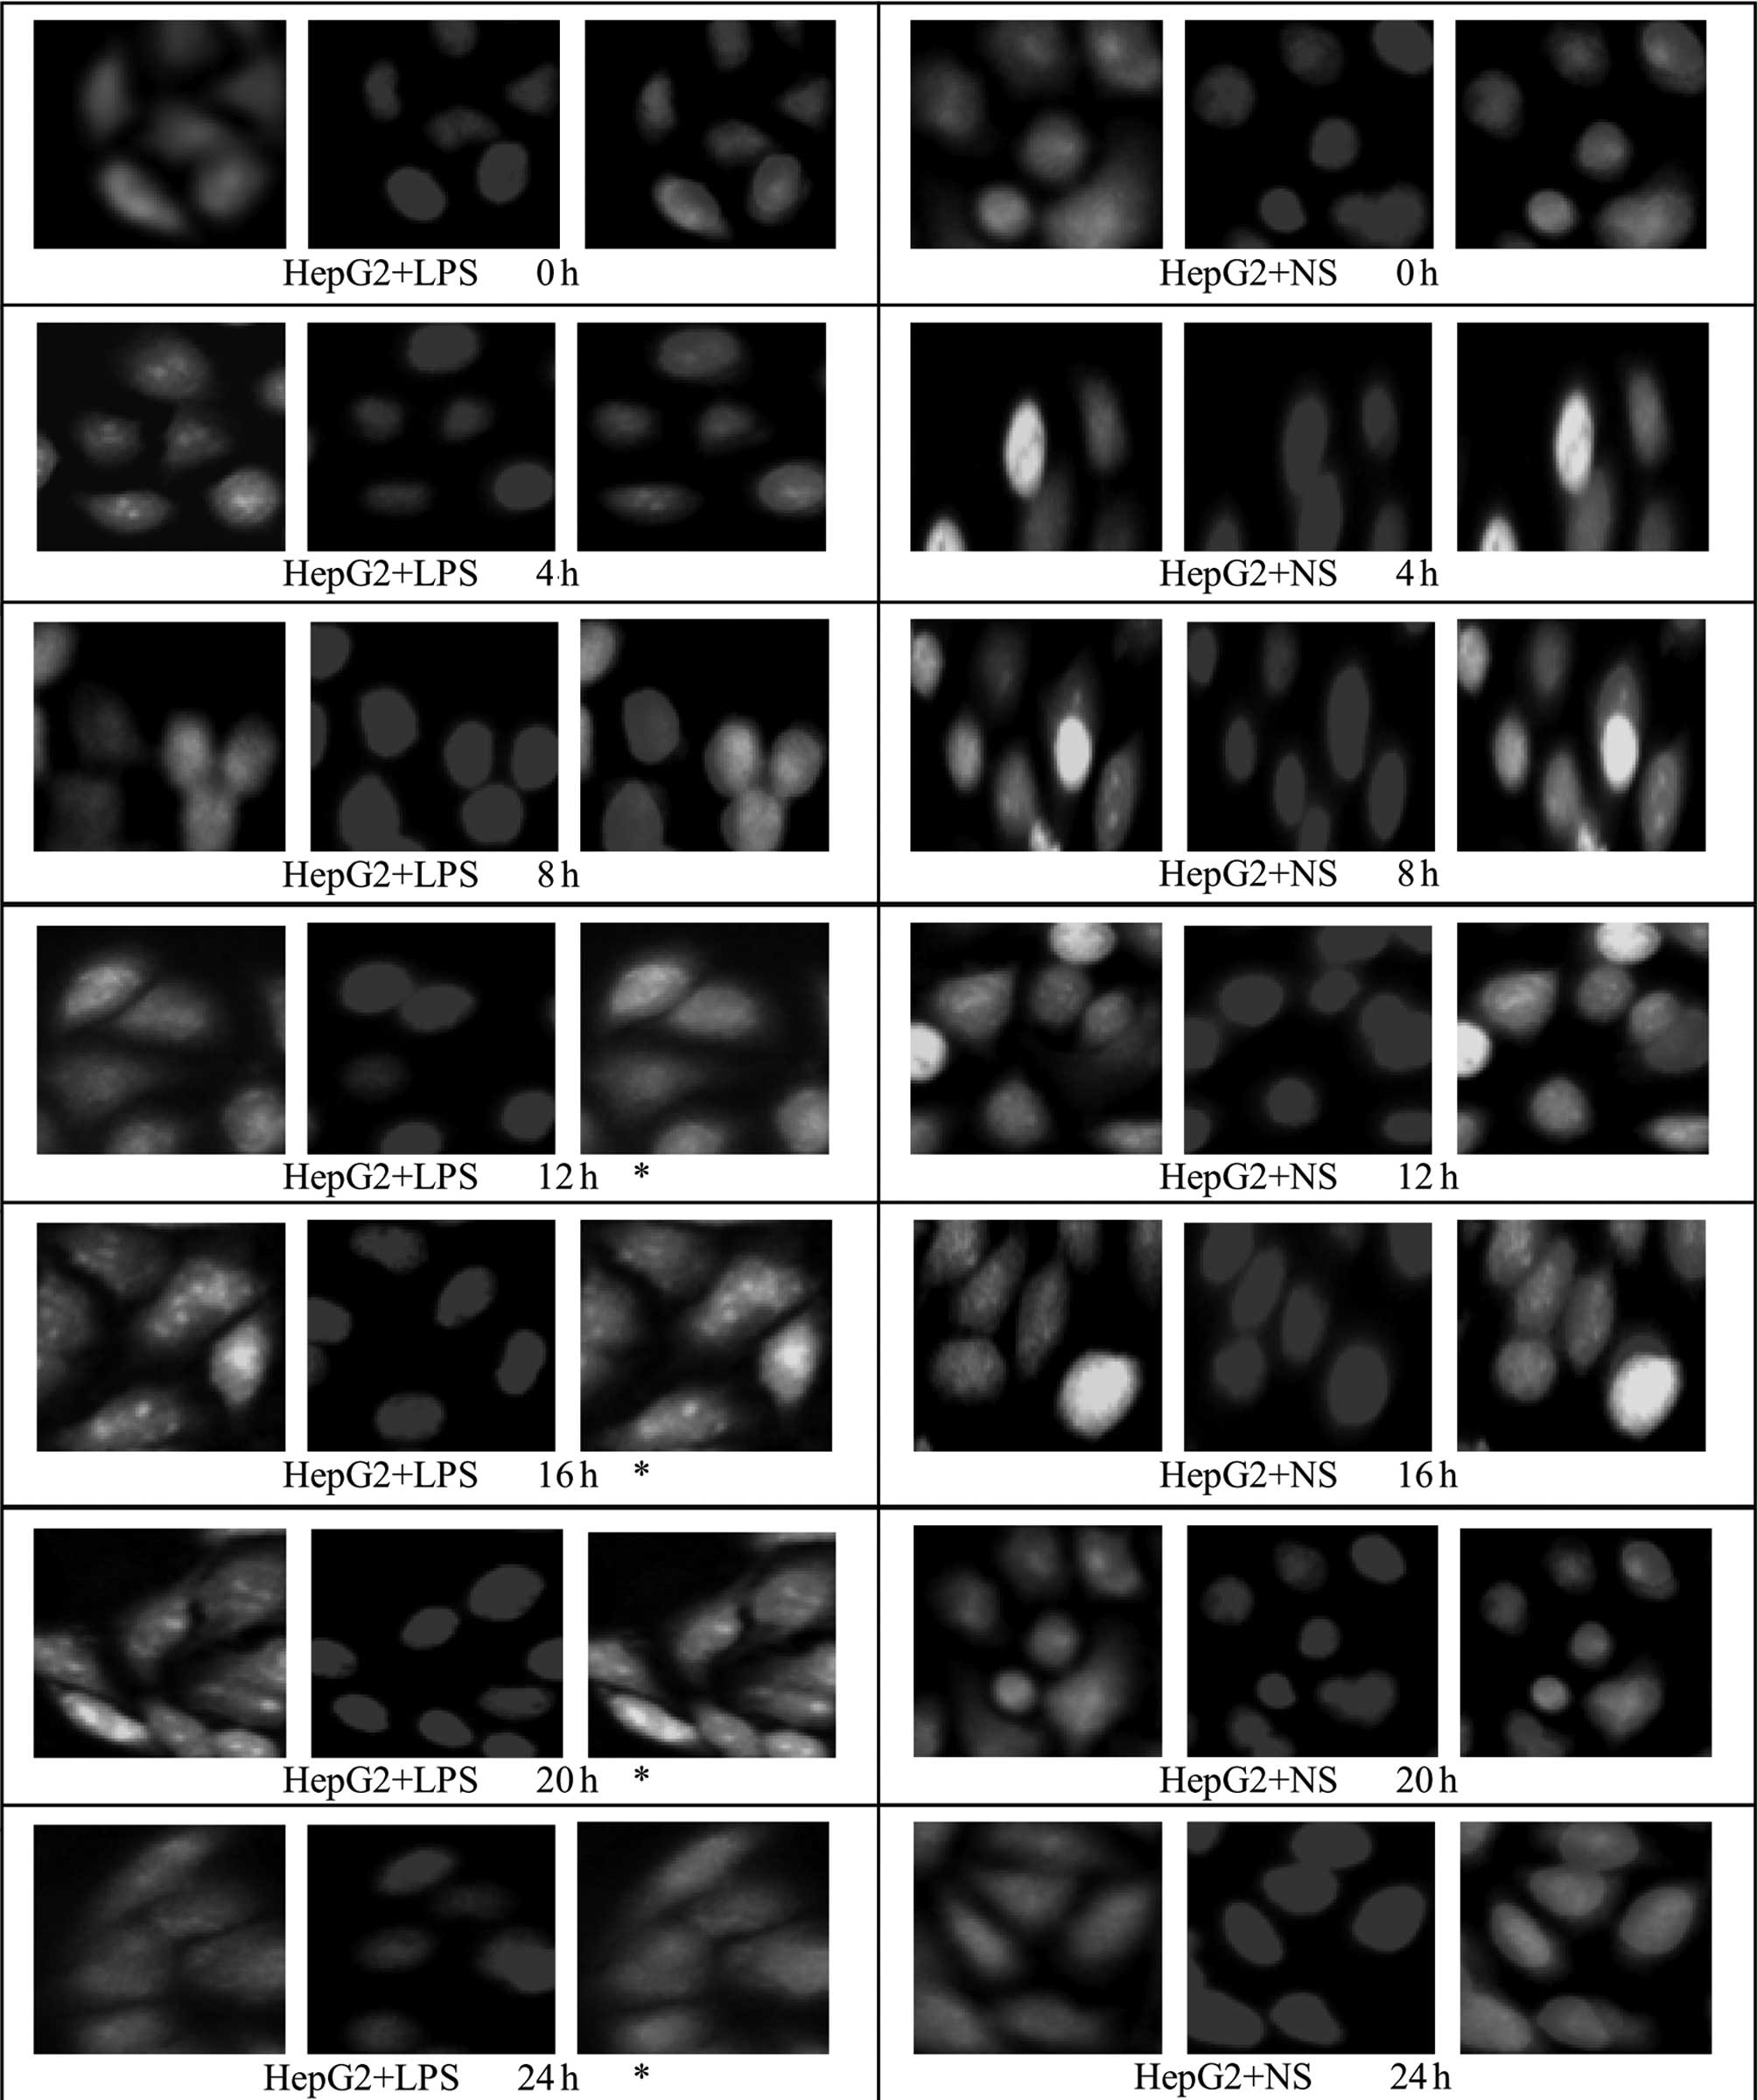
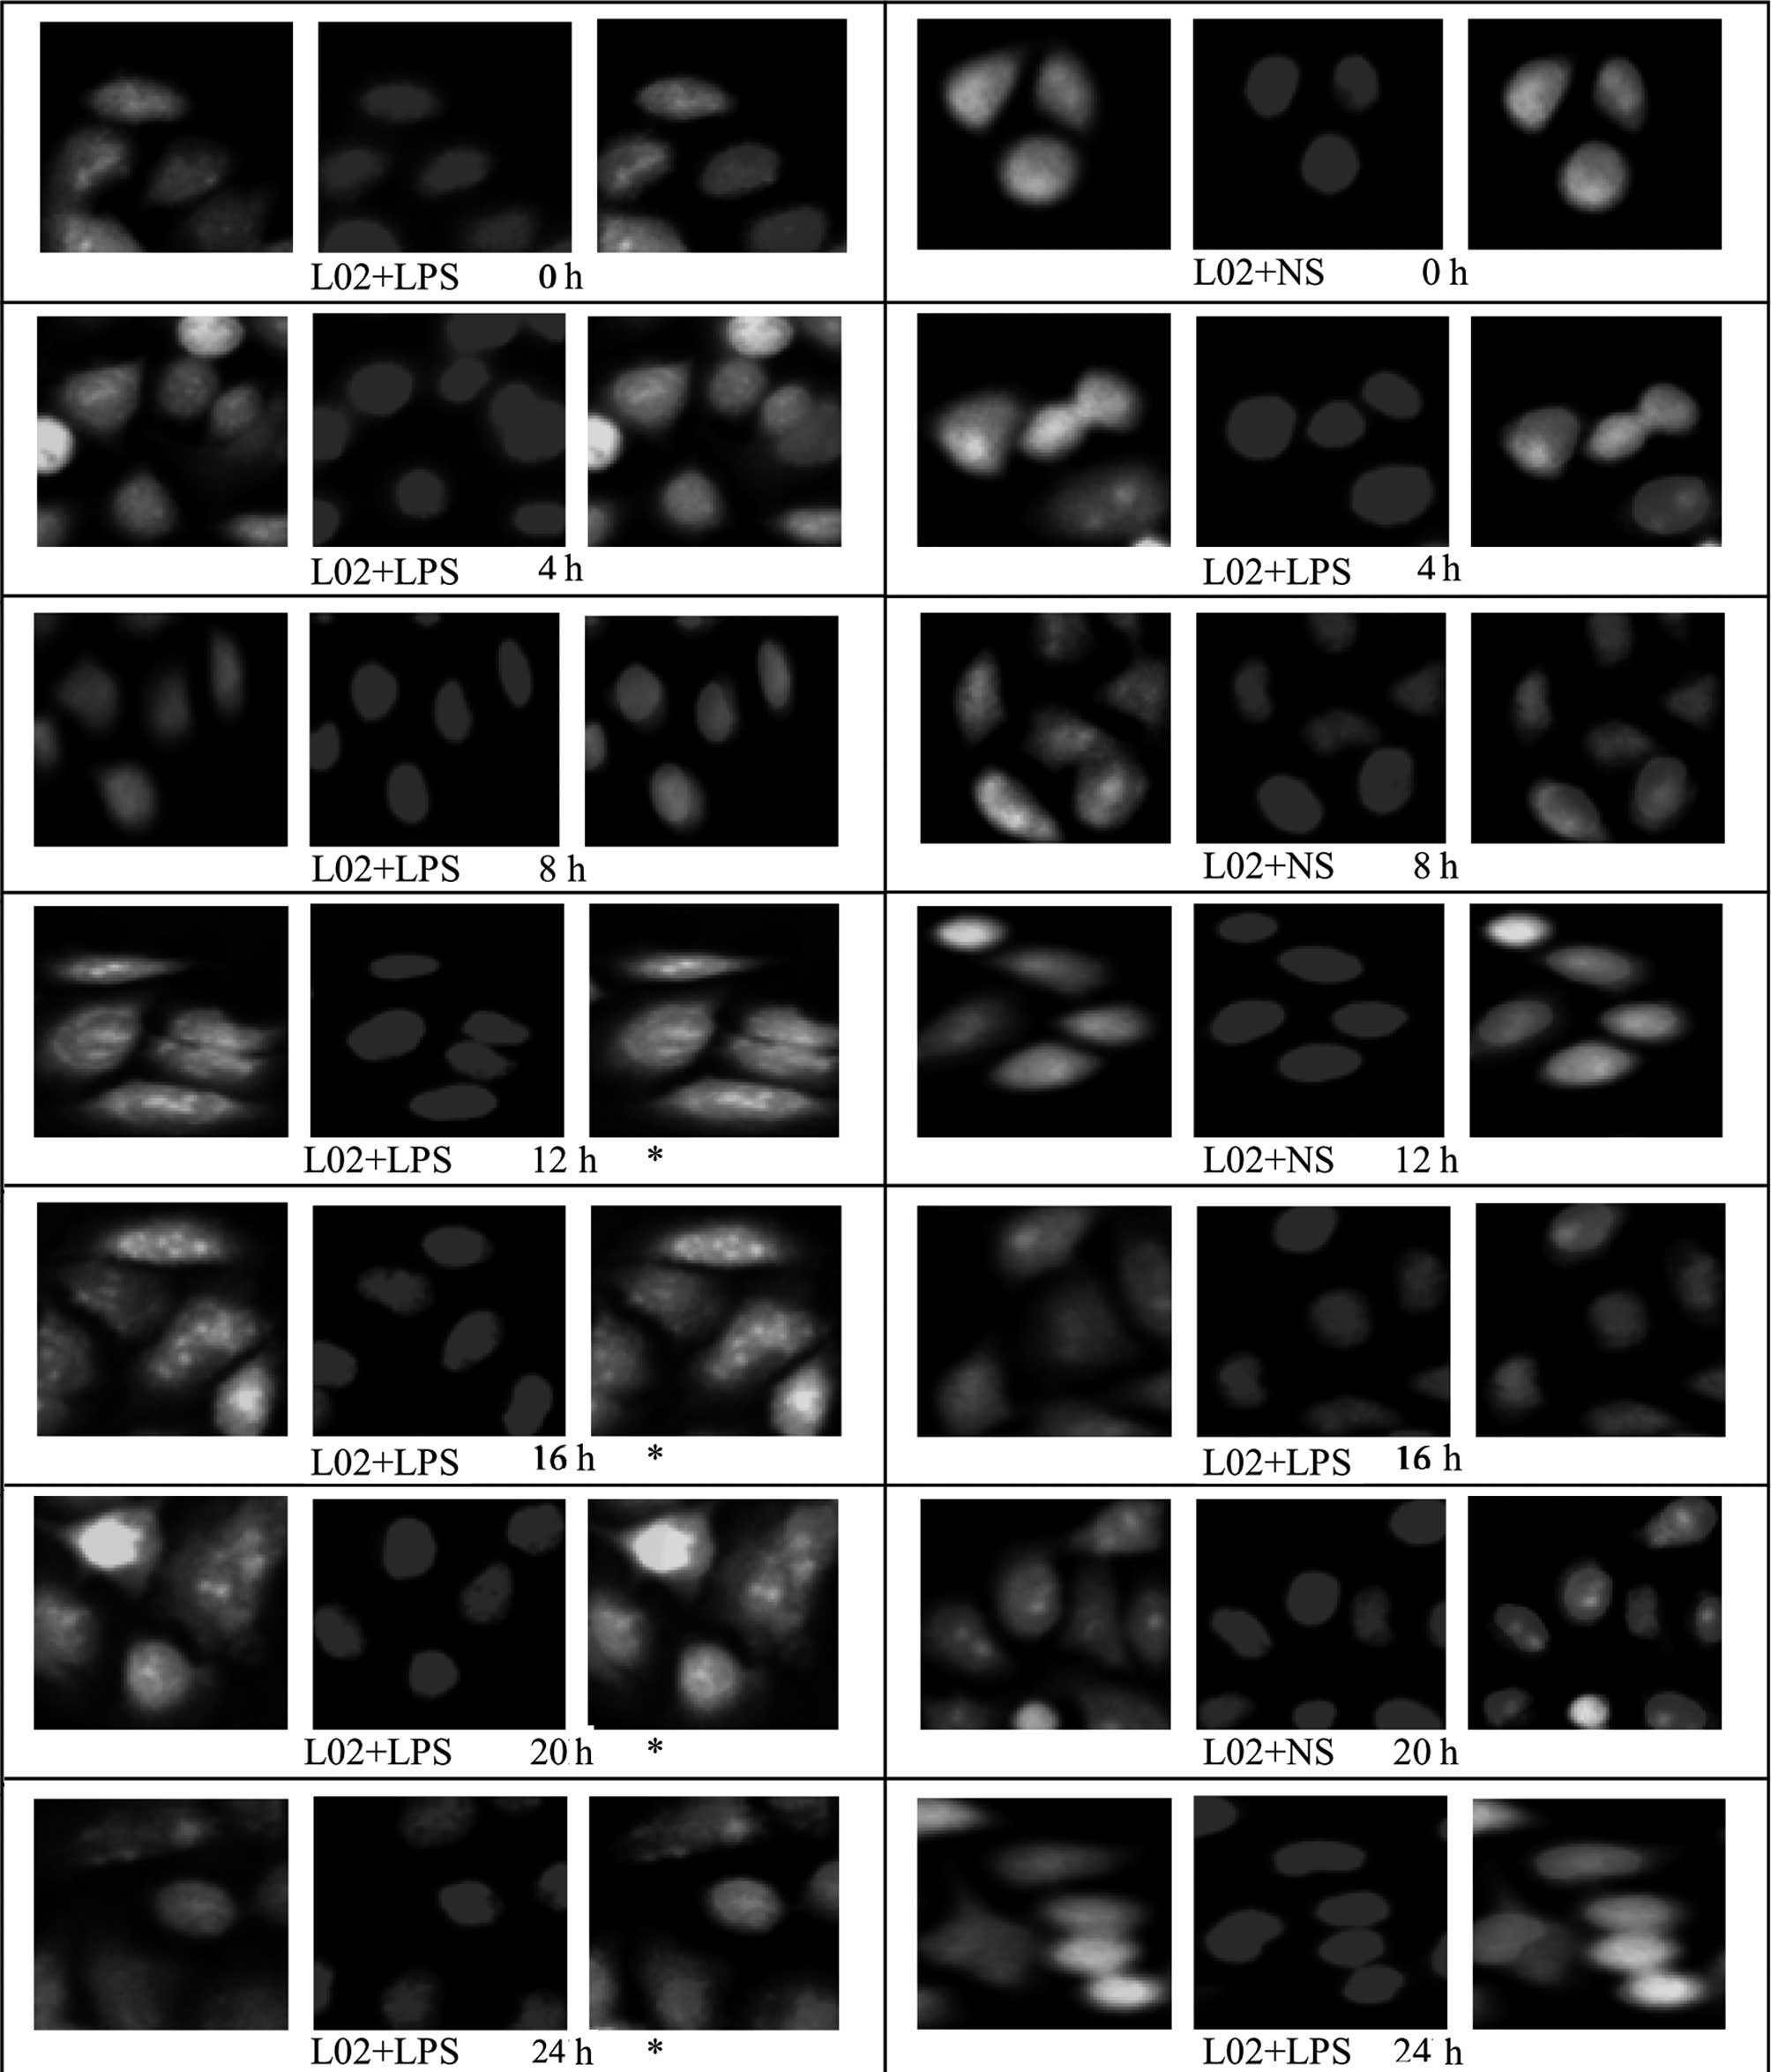
Effect of LPS stimulation on HMGB1
translocation in HepG2, L02 and U937 cells
An immunofluorescence assay was used to examine
HMGBl translocation in HepG2, L02 and U937 cells at different
time-points following the addition of LPS (400 ng/ml; 0, 4, 8, 12,
16, 20 and 24 h). Under normal conditions, HMGB1 in HepG2, L02 and
U937 cells was concentrated in the nuclei. Following treatment with
400 ng/ml LPS, green fluorescence from specifically labeled HMGBl
was observed at 12 h in the cytosol of HepG2 and L02 cells; the
fluorescence in the cytoplasm increased, whereas that in the nuclei
decreased with time, suggestive of the translocation of HMGBl from
the nuclei to the cytoplasm. In the corresponding control group, a
small amount of fluorescence was observed in the cytoplasm, but the
majority remained in the nuclei (Figs.
6 and 7). Relative
fluorescence intensities of the groups were analyzed further by
Image-Pro Plus software and are shown in Table IV. The results revealed that
compared with 16 and 20 h following the addition of LPS, the total
fluorescence at 24 h in the cytoplasm and nuclei of HepG2 and L02
cells was significantly reduced (P<0.05). Furthermore, at 0, 4
and 8 h following the addition of LPS, there was no difference in
fluorescence intensity in the cytoplasm or nuclei of cells between
the LPS-treated HepG2 or L02 group and the corresponding control
group (P>0.05). However, at 12–24 h, the fluorescence
intensities in the cytoplasm of cells from the LPS-treated HepG2
and L02 groups were significantly higher than those of the
corresponding control groups (P<0.05).
| Table IVRelative fluorescence intensity of
cells from different groups at various time-points following the
addition of LPS (mean ± SD, n=3). |
Table IV
Relative fluorescence intensity of
cells from different groups at various time-points following the
addition of LPS (mean ± SD, n=3).
| Fluorescence
intenstity (%) |
|---|
|
|
|---|
| Group | 0 h | 4 h | 8 h | 12 h | 16 h | 20 h | 24 h |
|---|
| L02 + LPS |
| N | 64.58±3.11.. | 63.95±4.66.. | 64.16±1.52.. | 49.75±3.03 | 39.24±3.20 | 28.48±5.15 | 22.36±3.38 |
| C | 5.16±1.43 | 4.65±0.59 | 3.90±1.28 |
19.04±1.42a |
28.83±3.61a |
42.04±9.54a |
34.07±5.12a |
| L02 + NS |
| N | 63.09±3.83.. | 62.21±5.44.. | 64.05±4.03.. | 60.93±8.93 | 61.37±7.68 | 56.85±6.98 | 49.85±6.47 |
| C | 4.52±0.56 | 4.37±1.54 | 4.32±0.99 | 5.68±1.17 | 7.05±1.47 | 9.74±2.87 | 14.40±4.07 |
| HepG2 + LPS |
| N | 69.13±1.69.. | 68.38±3.21.. | 68.20±2.93.. | 59.48±3.81 | 44.32±4.46 | 34.21±3.40 | 26.70±7.32 |
| C | 3.65±0.67 | 3.86±1.39 | 4.55±1.81 |
14.74±1.34a |
27.06±3.59a |
45.51±5.16a |
33.67±3.86a |
| HepG2 + NS |
| N | 69.87±4.72.. | 71.17±4.28.. | 71.05±1.81.. | 70.77±8.18 | 67.52±7.74 | 63.77±5.07 | 51.95±5.93 |
| C | 3.14±1.50 | 3.62±1.67 | 4.77±2.42 | 4.73±1.66 | 5.89±2.54 | 7.72±2.70 | 16.29±3.01 |
| U937 + LPS |
| N | 52.47±3.61.. | 50.30±4.36.. | 42.50±1.80.. | 35.41±2.47 | 30.07±2.55 | 25.65±3.51 | 23.96±4.64 |
| C | 1.90±0.65 | 3.94±1.15 |
10.91±1.17b. |
19.35±1.50b |
25.44±1.06b |
34.31±2.97b |
26.67±3.87b |
| U937 + NS |
| N | 53.45±4.31.. | 52.77±6.76.. | 52.45±5.17.. | 53.51±3.10 | 51.40±6.34 | 48.38±7.22 | 42.26±7.17 |
| C | 1.95±1.69 | 1.87±0.99 | 2.30±1.21 | 2.16±0.57 | 2.8±0.67 | 6.98±1.51 | 12.77±1.24 |
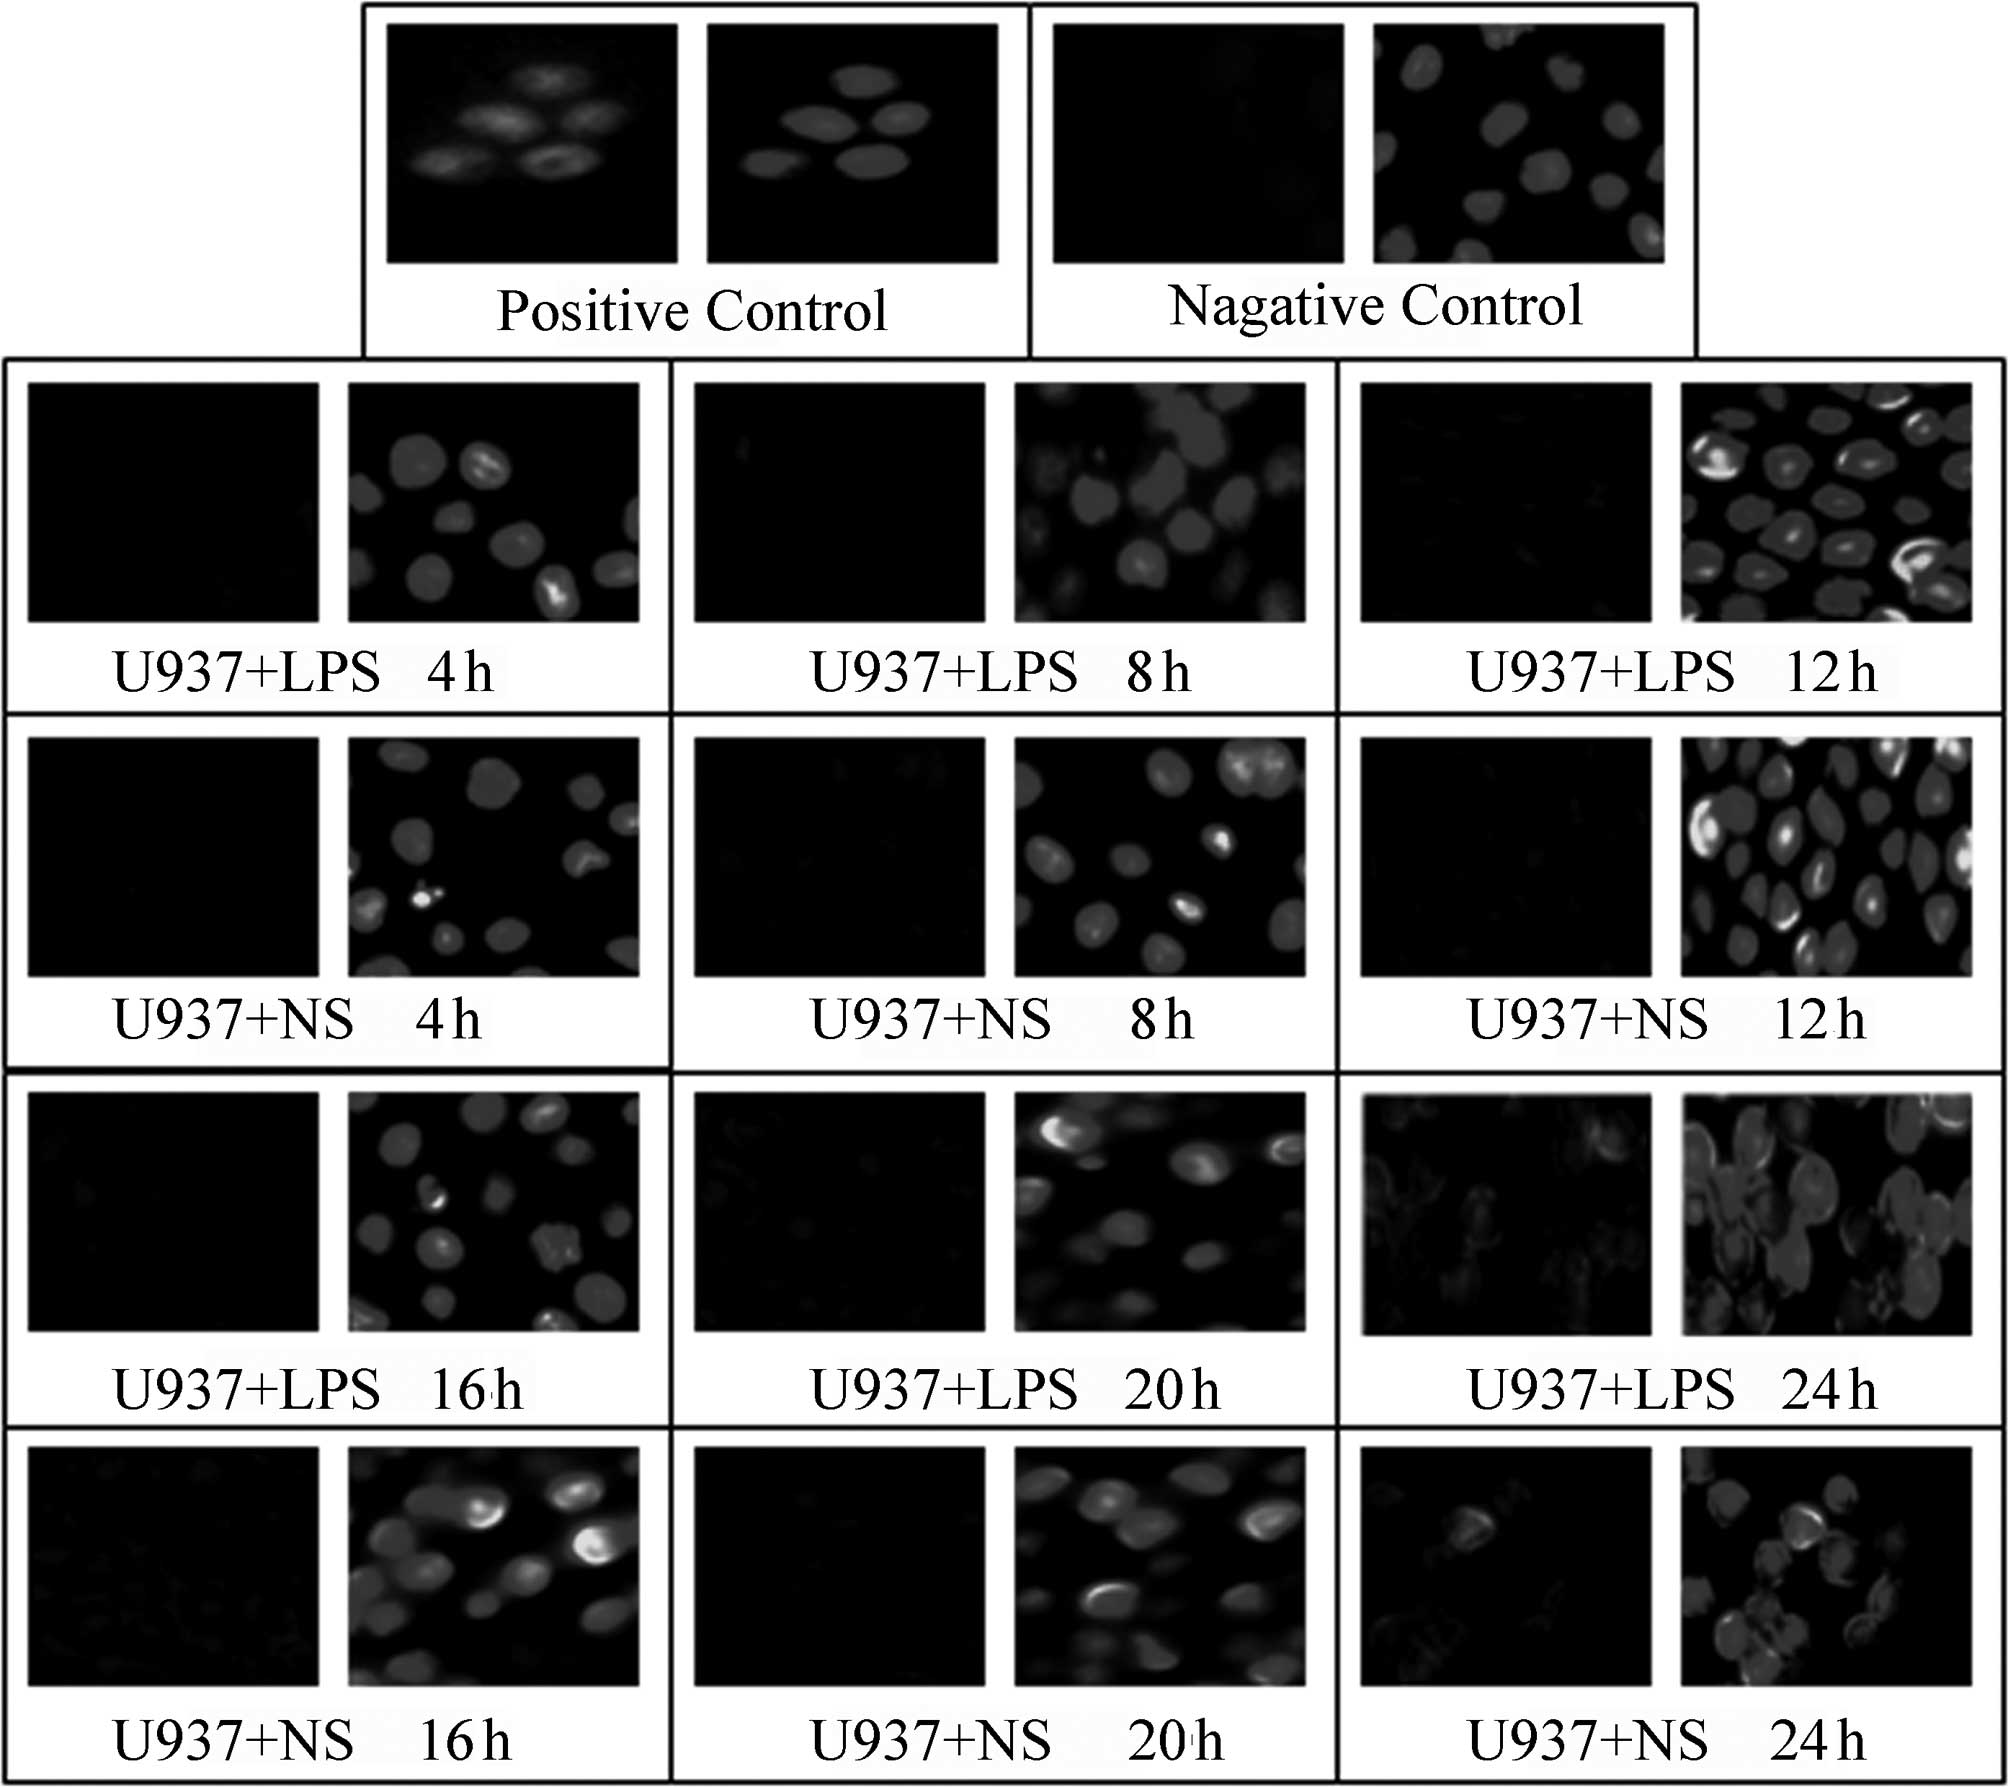
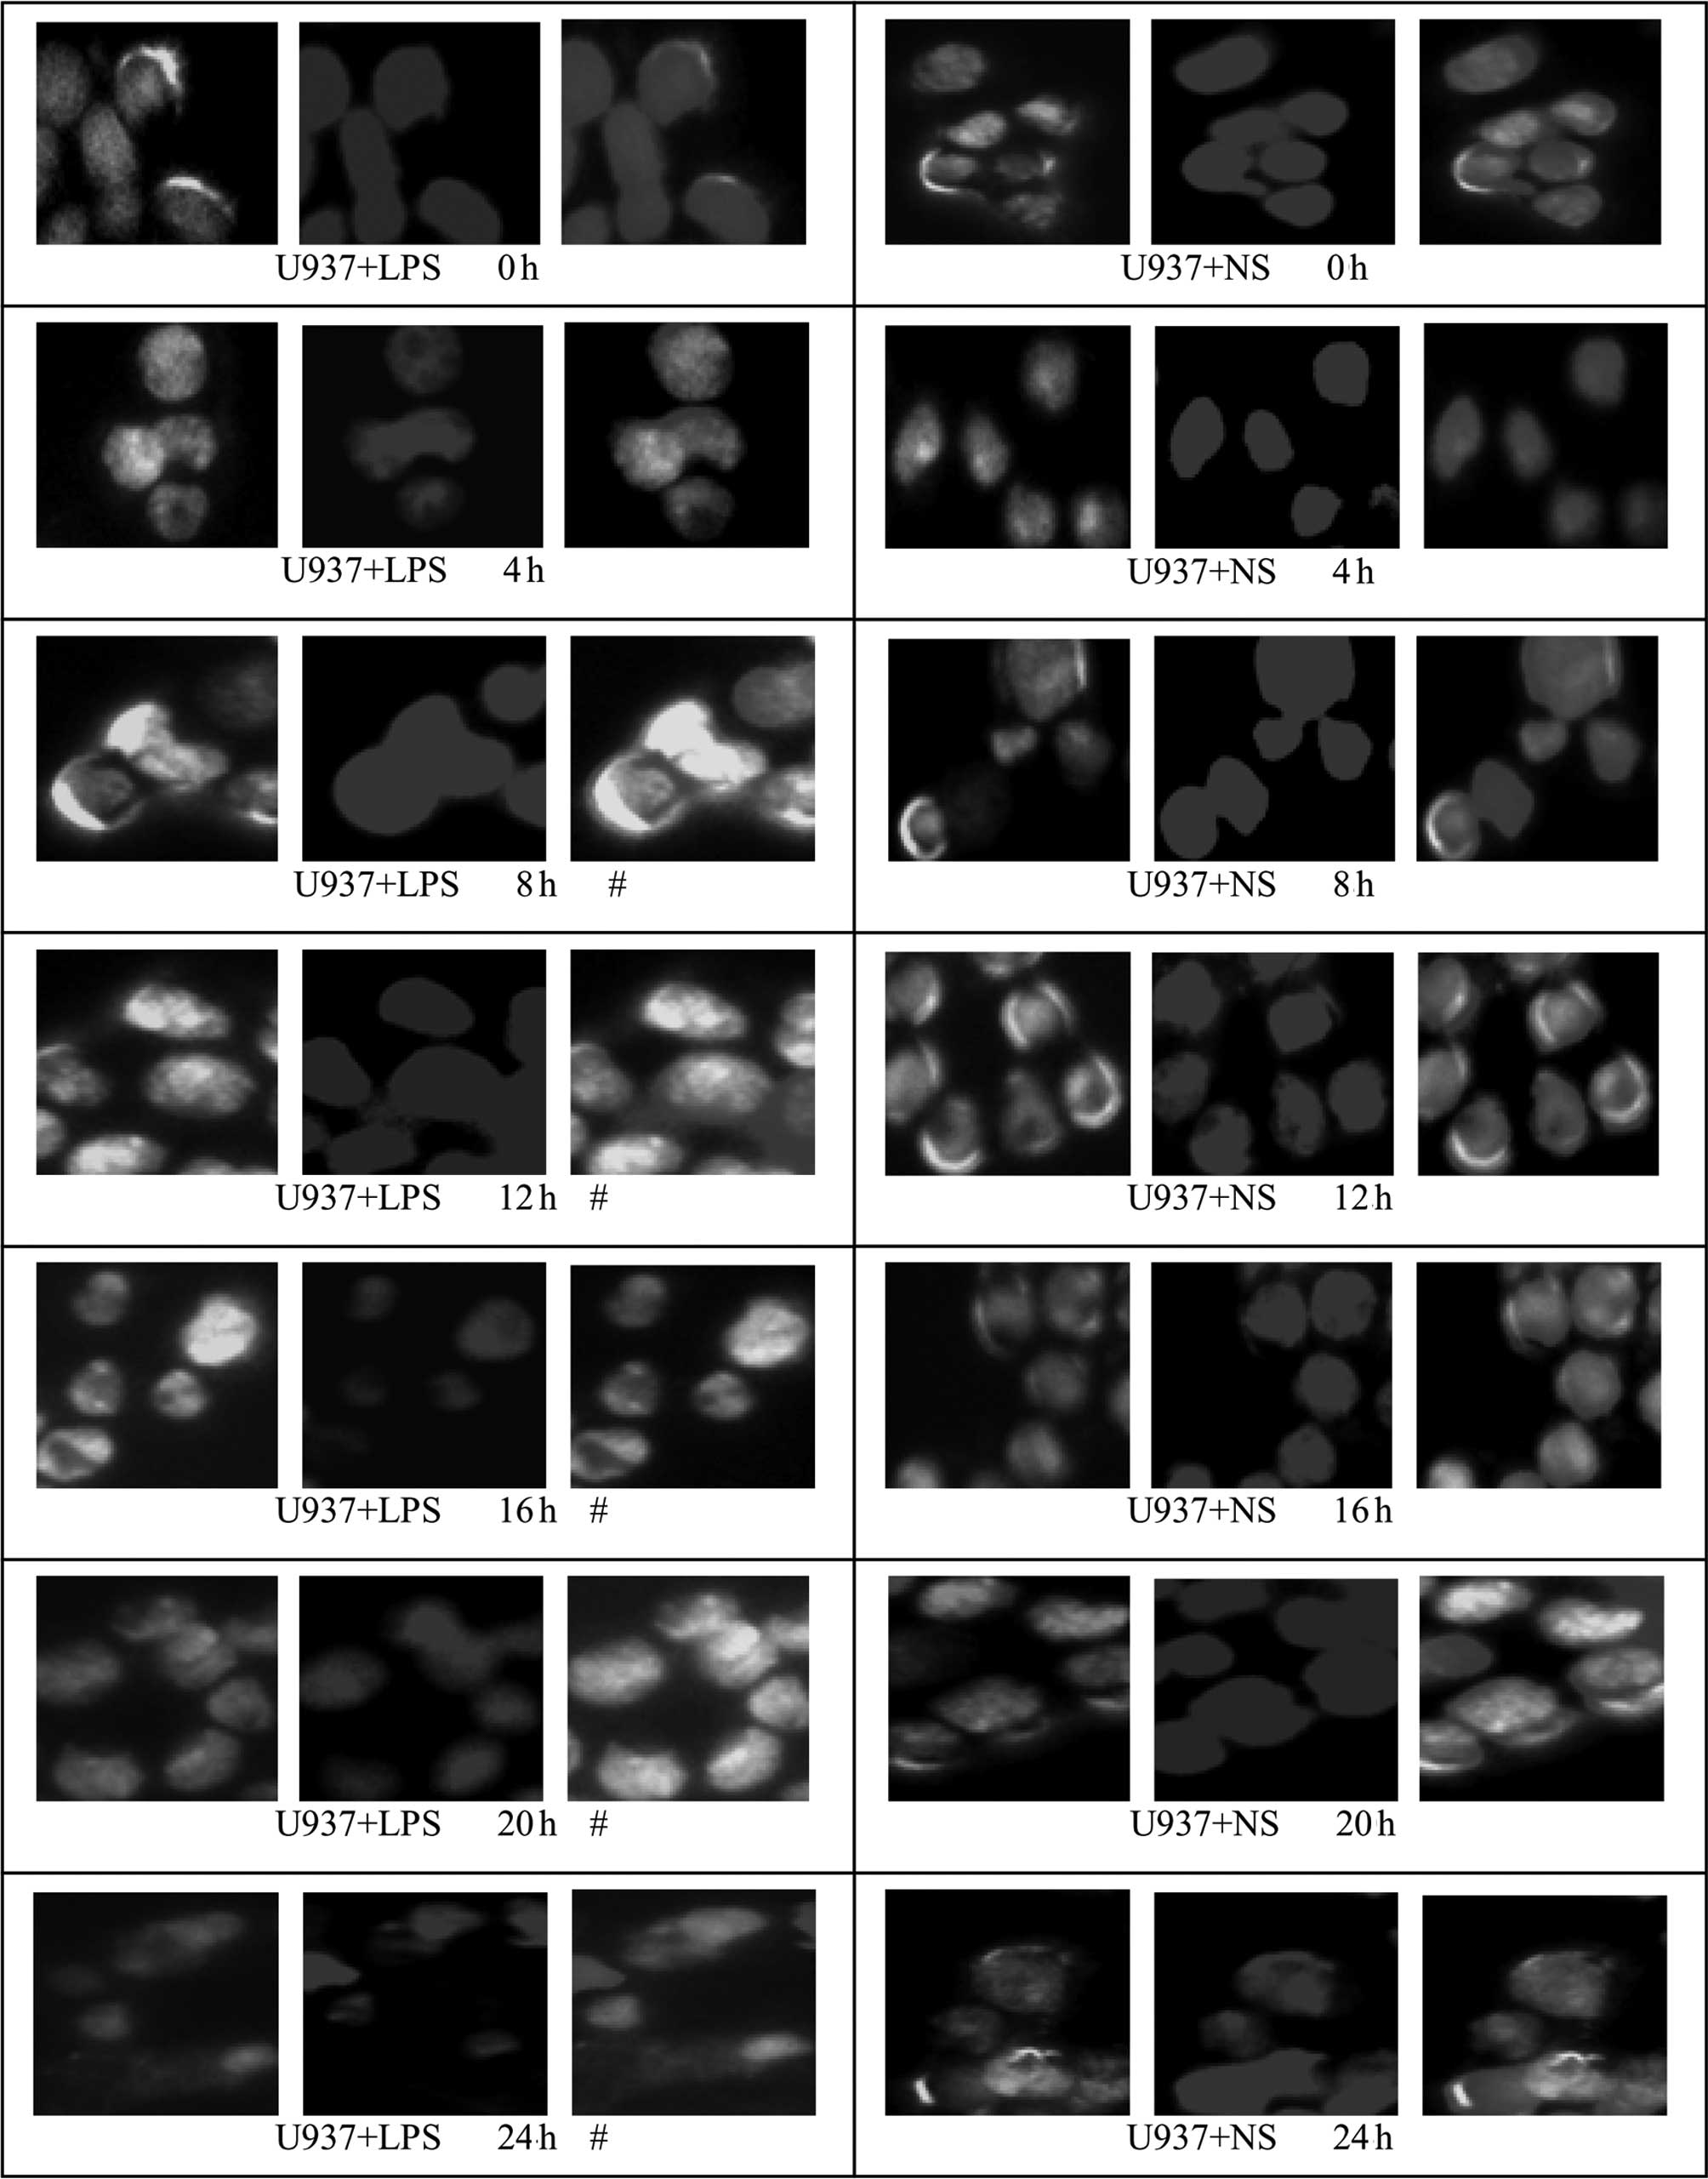
The translocation of HMGBl from the nuclei to the
cytoplasm in U937 cells occurred earlier than in HepG2 and L02
cells; at ~4 h, green fluorescence was observed in the cytoplasm
and at 8 h, a substantial degree of green fluorescence was observed
in the cytoplasm of U937 cells. At 20 and 24 h, the green
fluorescence in the cytoplasm was markedly decreased. For cells of
the control group (NS-treated), the green fluorescence,
representing specifically labeled HMGBl, was localized within the
nucleus and no marked translocation was observed. Since the
cytoplasm of U937 cells is relatively small, the cytoplasmic
staining of U937 cells was less conspicuous than that of the HepG2
and L02 cells (Fig. 8). Relative
fluorescence intensities of the different groups were further
analyzed by Image-Pro Plus software and are shown in Table IV; from 8 h, the fluorescence
intensity in the cytoplasm of cells from the LPS-treated U937 group
was significantly higher than that of the corresponding control
group (P<0.05).
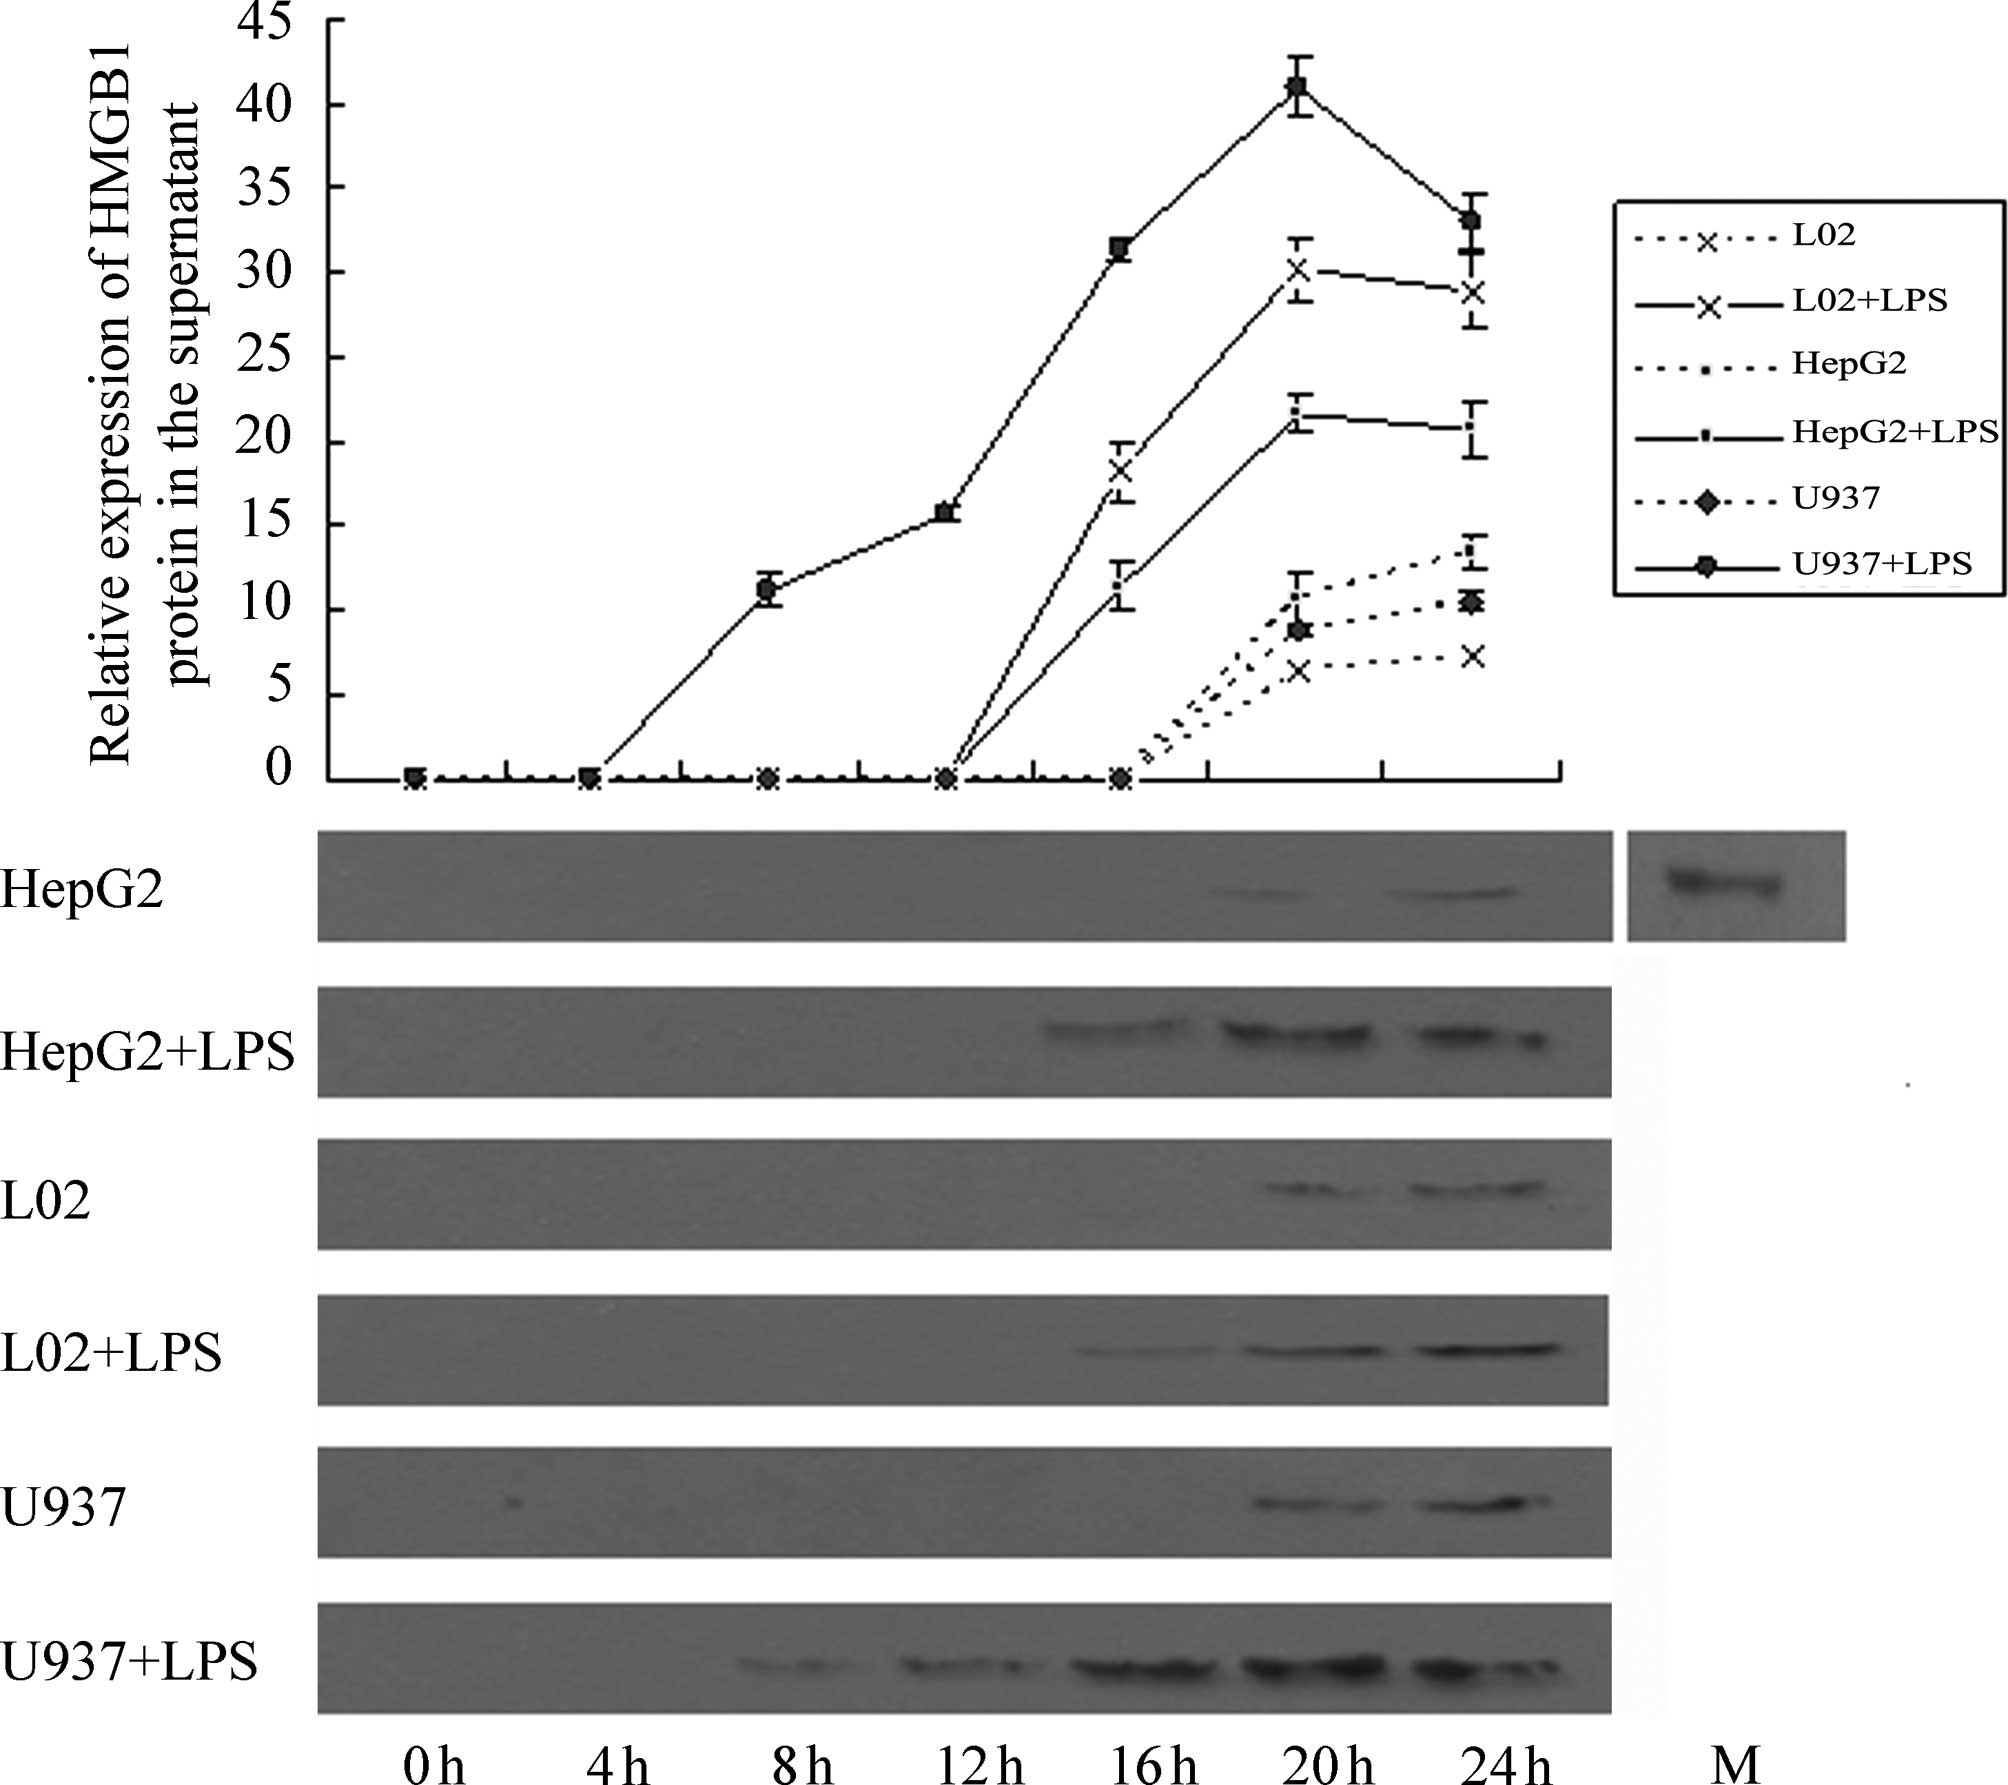
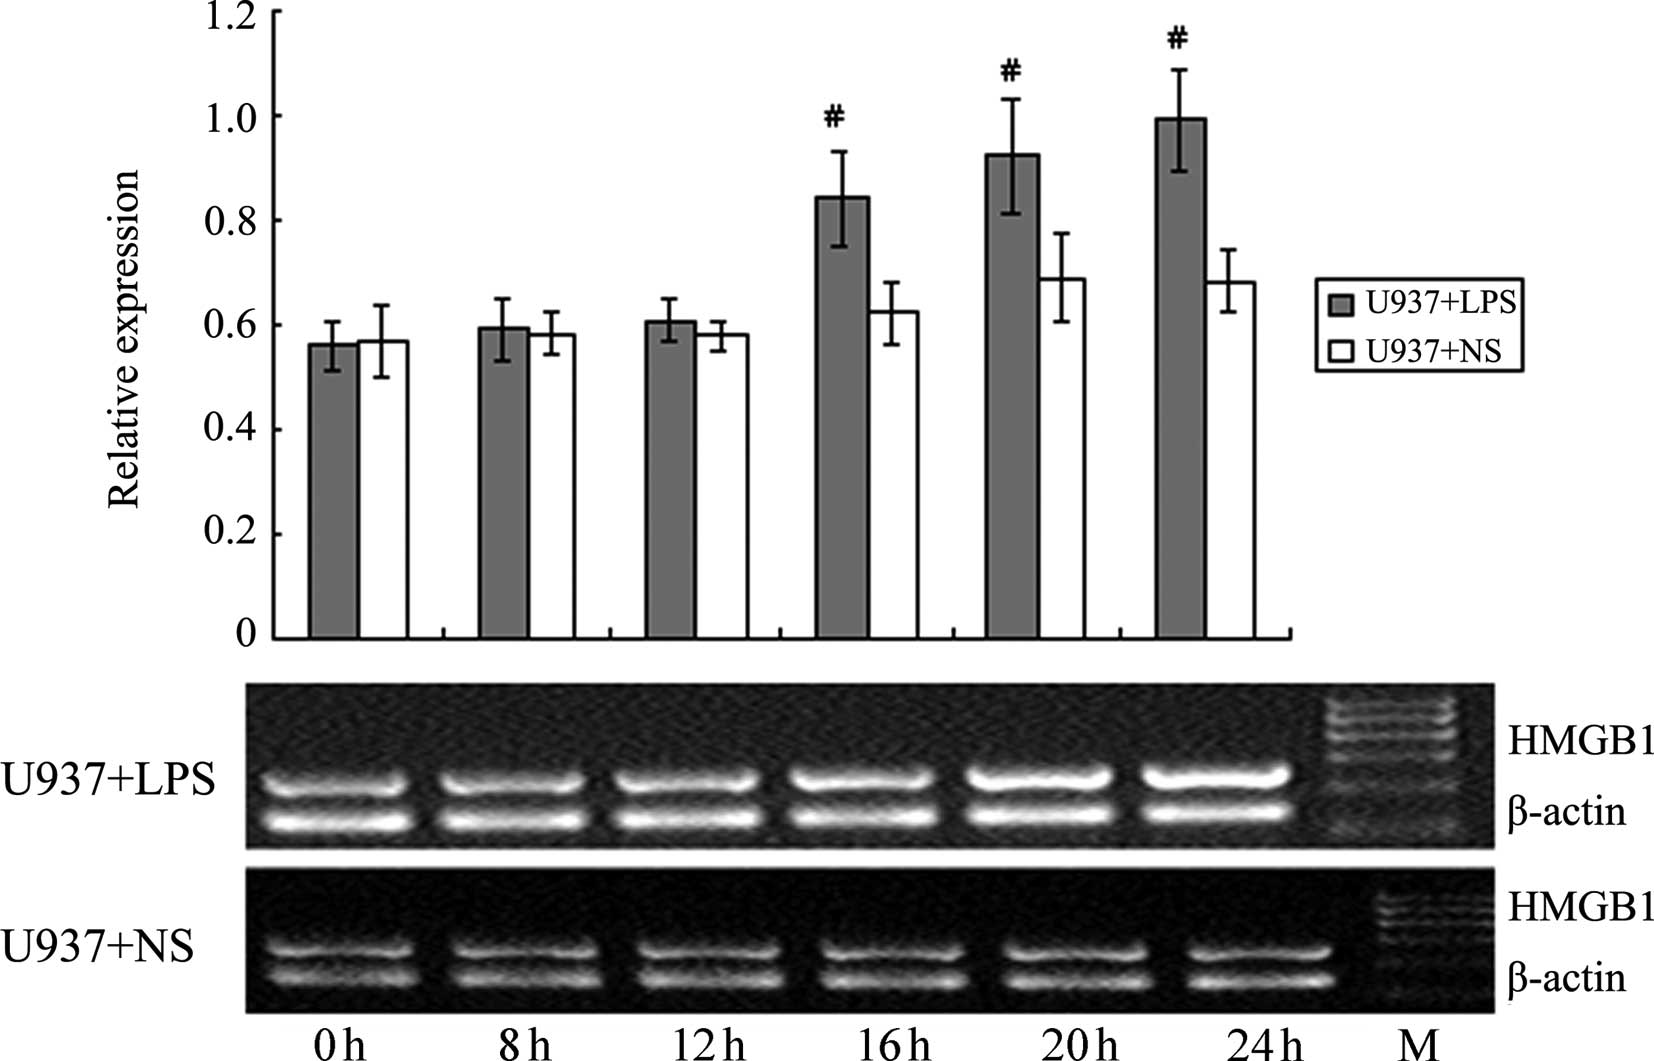
Effect of LPS stimulation on HMGB1
release by HepG2, L02 and U937 cells
Western blotting results (Fig. 9) revealed that at 4 h following the
addition of LPS (400 ng/ml), no HMGBl band was detected in the
supernatants of HepG2, L02 and U937 cells. At 8 h, a weak HMGBl
band was observed in the supernatant of U937 cells and at 16 h, a
weak HMGBl band was detected in the supernatants of HepG2 and L02
cells. The photodensities of the HMGB1 bands from the three types
of cells gradually increased with time. Semi-quantitative analysis
revealed that at 20 h, HMGBl content in the cell culture
supernatants of the three cell types peaked. At 20 and 24 h, a
small quantity of HMGBl was detected in the cell culture
supernatant from the control groups (NS-treated), and this quantity
differed significantly from the amount of HMGBl in the cell
supernatant of the corresponding experimental group for the three
types of cells (P<0.05). Comparison of the quantity of HMGBl
secreted by the three cell types following LPS treatment
demonstrated that HMGBl secretion by U937 cells was by far the
highest, and the differences were significant (P<0.05). Further
comparisons revealed that the amount of HMGB1 secreted by L02 cells
at 16 h was comparable to that by U937 cells at 13 h, and the
amount of HMGB1 secreted by L02 cells at 20 h was comparable to
that by U937 cells at 16 h. With increasing time, the amount of
HMGB1 secreted by L02 cells at 24 h was significantly lower than
that by U937 cells at 20 h (P<0.05). The amount of HMGB1
secreted by HepG2 cells at 20 h was comparable to that by U937
cells at 14 h. With an increase in time, the amount of HMGB1
secreted by HepG2 cells at 24 h was significantly lower than that
by U937 cells at 20 h (P<0.05).
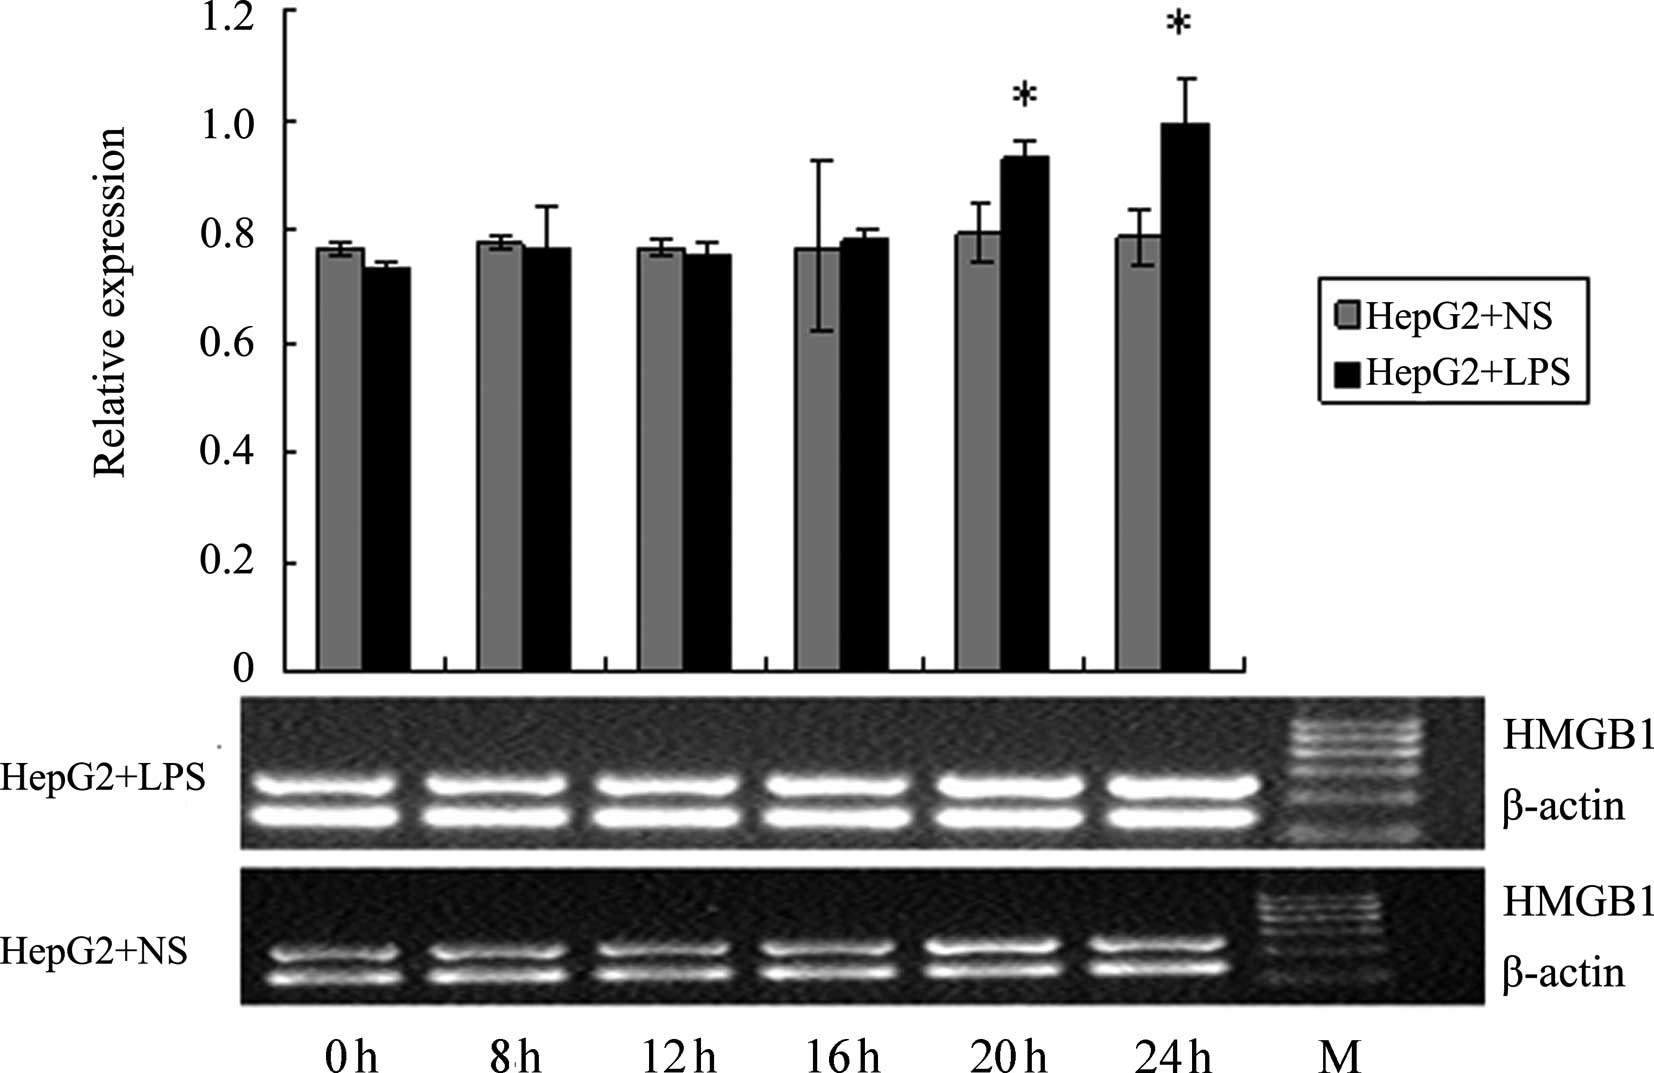
Effect of LPS stimulation on HMGB1 mRNA
levels in HepG2, L02 and U937 cells
RT-PCR was used to detect the HMGB1 mRNA levels in
HepG2, L02 and U937 cells at different time-points following the
addition of 400 ng/ml LPS (0, 4, 8, 12, 20 and 24 h). NS of the
same volume was added to the corresponding control groups. As shown
in Figs. 10–12, at 20 and 24 h following the addition
of LPS, HMGB1 mRNA levels in HepG2 and L02 cells were significantly
higher than those in the corresponding controls. For U937 cells,
the HMGB1 mRNA level at 16 h was already significantly higher than
the corresponding control. The increase in HMGB1 mRNA level induced
by LPS in U937 cells occurred earlier than in HepG2 and L02 cells,
and the magnitude of the increase was also higher; these
differences were all deemed to be significant (P<0.05).
Discussion
Under normal conditions, HMGB1 is localized in the
nucleus. Thus, the release of HMGB1 from the intracellular to
extracellular space is a prerequisite for its extracellular
functions. There are two ways by which HMGB1 may be released;
active ‘secretion’ by activated immune cells and passive ‘leaking’
from apoptotic cells. Previous studies have demonstrated that
non-apoptotic HepG2 cells are capable of releasing HMGB1 (17,18).
In this study, we characterized the secretion of late
pro-inflammatory cytokine HMGB1 by liver L02 and HepG2 cells.
LPS-induced HMGB1 release in liver cells was not
caused by cell damage. LDH is a damage-related factor; when
cultured cells are damaged, a large quantity of LDH may be detected
in the culture fluid. Our results revealed that at all time-points,
the LDH content in the cell supernatants of every LPS-treated group
was not significantly different from that of the corresponding
controls, suggesting that at 0–24 h following the addition of 400
ng/ml LPS, none of the cells had incurred substantial damage.
Liver cells (L02, HepG2) and U937 cells release
HMGB1 when treated with LPS; however, their release characteristics
vary. The first difference is reflected in the timing of the
release. For U937 cells, at 8 h following the introduction of LPS,
the HMGBl band was detected from the cell culture supernatant,
whereas for liver cells (L02, HepG2), a weak HMGBl band was
detected from the supernatant at only 16 h following stimulation,
suggesting that HMGB1 release from the liver cells occurs
substantially later than from the immune cell line U937. The second
difference is that the amount of HMGB1 released from the control
and liver cells differed. Although the amount of HMGB1 detected in
the supernatant of LPS-treated U937 cells was relatively small, it
remained larger compared with that in the liver cells (L02, HepG2).
RT-PCR results revealed that at 20 and 24 h following the addition
of LPS, HMGB1 mRNA levels in the liver cells (L02, HepG2) were
significantly higher than those in the corresponding controls. In
U937 cells, starting from 16 h, the HMGB1 mRNA levels were already
significantly higher than those in the corresponding controls,
suggesting that the elevation in HMGB1 mRNA levels occurred earlier
in U937 cells vs. liver cells (L02, HepG2). When considering the
combined RT-PCR and western blotting results, we noted that for
U937 and liver cells (L02, HepG2) at the same effective LPS
concentration, the time at which the HMGB1 mRNA level became
elevated was later than the time at which the HMGB1 level in the
supernatant became elevated, suggesting that increased levels of
HMGB1 in the supernatant were not solely from
transcription-translation of the increased HMGB1 mRNAs in response
to LPS stimulation. The immunofluorescence assay results
demonstrated that HMGBl translocation from the nucleus to the
cytoplasm was observed at 12 h in liver cells (L02, HepG2);
however, in U937 cells, such translocation occurred at 4–8 h, which
was substantially earlier than in the liver cells (L02, HepG2). We
speculate that at 0–24 h, the main source of HMGB1 in the
supernatant was released from the HMGB1 pool in the nuclei, and was
not the result of the regulation of the internal signaling pathway
(transcription-translation) in response to stimulation. However, as
time progressed, the latter may gradually play a dominant role.
Our study demonstrates that living, non-apoptotic
liver cells are capable of secreting and releasing the late
inflammatory cytokine HMGB1, and the mechanism of this secretion
may be closely associated with the translocation of HMGB1 in the
nuclei. Compared with HMGB1 secretion from immune cells, HMGB1
secretion from liver cells occurs later and in a smaller quantity.
These results provide an experimental basis for a more complete
understanding of the physiological function of the liver. During
the development of severe hepatitis, immune cells of the liver,
including mononuclear macrophage cells and NK cells, are activated
and release inflammatory cytokines, leading to a second attack on
the liver that aggravates the damage (20). The results from this study reveal
that non-apoptotic liver cells are capable of releasing HMGB1,
which further exacerbates the aforementioned inflammatory response
cascade. However, HMGB1 release to the extracellular space may also
serve as a warning signal to nearby liver cells and affect the
taxis of endothelial cells in order to promote the aggregation of
endothelial cells and tissue repair. Hence, HMGB1 release by liver
cells in response to external stimuli may also be an important step
in the self-protection mechanism of the body. This study provides a
new approach to investigating the pathogenic mechanism of severe
hepatitis. Furthermore, due to the characteristic functions of
HMGB1 in the inflammatory network, it may be a new target for the
clinical treatment of severe hepatitis.
In conclusion, LPS-stimulated liver cells are
capable of secreting the late inflammatory cytokine HMGB1. Compared
with HMGB1 release by immune cells, HMGB1 release by liver cells
occurs later and in a smaller quantity. Furthermore, this release
is associated with HMGB1 translocation and is not dependent on cell
death or apoptosis.
Acknowledgements
This study was supported by grants from the National
Natural Science Foundation of China (30972621 and 81101829), the
Funding for Doctoral Program of The University of China
(20110162110004), the Special Funding for Hunan Innovation of
Scientific Research Technics of China (2011TT2060), the Hunan
Natural Science Foundation of China (11JJ4074), the Freedom Explore
Program of Central South University of China (2011QNZT14) and the
Hunan Innovative Experimental Program for Undergraduates of China
(BW11479).
References
|
1
|
Yotov WV and St-Arnaud R: Nucleotide
sequence of a mouse cDNA encoding the nonhistone chromosomal high
mobility group protein-1 (HMG1). Nucleic Acids Res. 20:35161992.
View Article : Google Scholar : PubMed/NCBI
|
|
2
|
Calogero S, Grassi F, Aguzzi A, et al: The
lack of chromosomal protein Hmg1 does not disrupt cell growth but
causes lethal hypoglycaemia in newborn mice. Nat Genet. 22:276–280.
1999. View Article : Google Scholar : PubMed/NCBI
|
|
3
|
Landsman D and Bustin M: A signature for
the HMG-1 box DNA-binding proteins. Bioessays. 15:539–546. 1993.
View Article : Google Scholar : PubMed/NCBI
|
|
4
|
Landsman D: No HMG-1 box signature.
Nature. 363:5901993. View
Article : Google Scholar : PubMed/NCBI
|
|
5
|
Melvin VS and Edwards DP: Coregulatory
proteins in steroid hormone receptor action: the role of chromatin
high mobility group proteins HMG-1 and -2. Steroids. 64:576–586.
1999. View Article : Google Scholar : PubMed/NCBI
|
|
6
|
Furuita K, Murata S, Jee JG, et al:
Structural feature of bent DNA recognized by HMGB1. J Am Chem Soc.
133:5788–5790. 2011. View Article : Google Scholar : PubMed/NCBI
|
|
7
|
Huttunen HJ and Rauvala H: Amphoterin as
an extracellular regulator of cell motility: from discovery to
disease. J Intern Med. 255:351–366. 2004. View Article : Google Scholar : PubMed/NCBI
|
|
8
|
Degryse B, Bonaldi T, Scaffidi P, et al:
The high mobility group (HMG) boxes of the nuclear protein HMG1
induce chemotaxis and cytoskeleton reorganization in rat smooth
muscle cells. J Cell Biol. 152:1197–1206. 2001. View Article : Google Scholar : PubMed/NCBI
|
|
9
|
Wang H, Bloom O, Zhang M, et al: HMG-1 as
a late mediator of endotoxin lethality in mice. Science.
285:248–251. 1999. View Article : Google Scholar : PubMed/NCBI
|
|
10
|
Erlandsson Harris H and Andersson U:
Mini-review: the nuclear protein HMGB1 as a proinflammatory
mediator. Eur J Immunol. 34:1503–1512. 2004.PubMed/NCBI
|
|
11
|
Xu H, Yao Y, Su Z, et al: Endogenous HMGB1
contributes to ischemia-reperfusion-induced myocardial apoptosis by
potentiating the effect of TNF-alpha/JNK. Am J Physiol Heart Circ
Physiol. 300:H913–H921. 2011. View Article : Google Scholar : PubMed/NCBI
|
|
12
|
Luan ZG, Zhang H, Yang PT, et al: HMGB1
activates nuclear factor-κB signaling by RAGE and increases the
production of TNF-α in human umbilical vein endothelial cells.
Immunobiology. 215:956–962. 2010.
|
|
13
|
Fiuza C, Bustin M, Talwar S, et al:
Inflammation-promoting activity of HMGB1 on human microvascular
endothelial cells. Blood. 101:2652–2660. 2003. View Article : Google Scholar : PubMed/NCBI
|
|
14
|
Park JS, Svetkauskaite D, He Q, et al:
Involvement of toll-like receptors 2 and 4 in cellular activation
by high mobility group box 1 protein. J Biol Chem. 279:7370–7377.
2004. View Article : Google Scholar : PubMed/NCBI
|
|
15
|
Gardella S, Andrei C, Ferrera D, et al:
The nuclear protein HMGB1 is secreted by monocytes via a
non-classical, vesiclemediated secretory pathway. EMBO Rep.
3:995–1001. 2002. View Article : Google Scholar : PubMed/NCBI
|
|
16
|
Scaffidi P, Misteli T and Bianchi ME:
Release of chromatin protein HMGB1 by necrotic cells triggers
inflammation. Nature. 418:191–195. 2002. View Article : Google Scholar : PubMed/NCBI
|
|
17
|
Zhou RG, Fan XG, Liu HB, et al: Study of
the extracellular release of HMGB1 in human liver cell line HepG2
cells induced by lipopolysaccharide. Life Science Research.
4:359–364. 2008.(In Chinese).
|
|
18
|
Zhou RG, Fan XG, Liu HB, et al: Study of
the extracellular release of HMGB1 in human liver cell line HepG2
cells induced by TNF-α. Chin J Immunol. 25:126–131. 2009.(In
Chinese).
|
|
19
|
Tsung A, Klune JR, Zhang X, et al: HMGB1
release induced by liver ischemia involves Toll-like receptor 4
dependent reactive oxygen species production and calcium-mediated
signaling. J Exp Med. 204:2913–2923. 2007. View Article : Google Scholar : PubMed/NCBI
|
|
20
|
Jha AK, Nijhawan S and Suchismita A:
Sepsis in acute on chronic liver failure. Dig Dis Sci.
56:1245–1246. 2011. View Article : Google Scholar : PubMed/NCBI
|