Introduction
As the most common cancer originating from the
nasopharynx (1), nasopharyngeal
carcinoma (NPC) can be caused by viral influence, heredity and
environmental factors (2). The viral
influence is correlated with infection by Epstein-Barr virus (EBV),
which is a B-lymphotropic herpes virus possessing
growth-transforming properties (3).
It has been reported that 95% of Americans are exposed to this
virus in their thirties (4). In 2010,
NPC led to 65,000 mortalities globally (5). Thus, there is an urgent requirement to
study the mechanisms of EBV-associated NPC.
Recently, a number of studies have been performed to
investigate the mechanisms of EBV-associated NPC. For example, as
an early EBV antigen (6), BamH1-A
Reading Frame-1 may be associated with the pathogenesis of NPC,
such as the malignant transformation of human NPC epithelial cells
(7,8).
Aberrant hypermethylation of Ras association domain family 1
isoform A and the high viral load of EBV DNA may play an important
role in NPC pathogenesis, thus, they may function as promising
diagnostic markers for NPC (9,10).
Serological results have shown that specifically expressed
BRLF1 may be used in the diagnosis of NPC (11). Via the activation of Ets-1,
c-Met can be induced by latent membrane protein-1
(LMP-1) and enhance the highly metastatic potential of NPC
(12). By providing epitopes
recognized by cytotoxic T-cells, EVB-encoded LMP2A may be a
potential target and may be used in the immunotherapy of NPC
(13).
In 2006, Sengupta et al (14) analyzed the expression of all latent
EBV genes between NPC samples and normal healthy nasopharyngeal
epithelium samples, and obtained a panel of
differentially-expressed genes (DEGs). Using the same data by
Sengupta et al (14), the
present study aimed to further screen the DEGs and predict their
underlying function by functional and pathway enrichment analyses.
Furthermore, protein-protein interaction network (PPI) networks
were constructed and modules of PPI network were searched to
investigate the interaction associations between these DEGs.
Materials and methods
Microarray data
The expression profile of the GSE12452 dataset
deposited by Sengupta et al (14) was downloaded from Gene Expression
Omnibus (http://www.ncbi.nlm.nih.gov/geo/), which was based on
the platform of the GPL570 [HG-U133_Plus_2] Affymetrix Human Genome
U133 Plus 2.0 Array. GSE12452 consisted of a collection of 31 NPC
samples and 10 normal healthy nasopharyngeal tissue samples. These
samples were collected from Taiwanese patients who provided
informed consent. After the tissues were resected and immediately
flash frozen, samples were finally stored in liquid nitrogen.
DEG screening
Once GSE12452 had been downloaded, the microarray
data was read using Affy package (www.bioconductor.org) (15) and Refseq annotation files, and then it
was normalized by the Robust MultiArray Averaging method (16). The linear models for microarray data
package (http://www.bioconductor.org)
(17) in R was used to identify the
DEGs between NPC samples and normal healthy nasopharyngeal tissue
samples. The adjusted P-value of <0.01 and |logfold-change
(FC)|>1 were used as the cut-off criteria.
Functional and pathway enrichment
analysis
Gene Ontology (GO) terms can describe three
wild-type gene products, including molecular function, biological
process and subcellular location (18). The Kyoto Encyclopedia of Genes and
Genomes (KEGG) pathway database is used for the systematic analysis
of gene functions, which can connect genomic information with
functional information (19). The
Database for Annotation, Visualization, and Integrated Discovery
(DAVID) is a program that can integrate functional genomic
annotations with intuitive summaries (20). Using DAVID software, GO and KEGG
pathway enrichment analyses were performed for DEGs between NPC
samples and normal healthy nasopharyngeal tissue samples. A P-value
of <0.05 was used as the cut-off criterion.
PPI network and module
construction
Interaction associations of the proteins encoded by
the DEGs were searched by Search Tool for the Retrieval of
Interacting Genes/Proteins online software (http://string-db.org/) (21), and then PPI networks were visualized
by Cytoscape software (http://www.cytoscape.org) (22). The proteins in the PPI network were
termed nodes and the degree of a node correlated with the number of
its interactions. Using network statistics, a connectivity degree
analysis was conducted for each node in the PPI network. ClusterONE
(http://www.paccanarolab.org/clusterone/) (23) in Cytoscape was used to screen modules
of the PPI network. A P-value of <0.01 was used as the cut-off
criterion.
Results
DEG analysis
Compared with normal healthy nasopharyngeal tissue
samples, a total of 951 DEGs were screened from the NPC samples,
including 376 upregulated and 575 downregulated genes. There were
more downregulated genes than upregulated genes.
Functional and pathway enrichment
analysis
The enriched GO functions for upregulated genes were
divided into 28 clusters. Functions in cluster 1 were associated
with the cell cycle, such as the M phase (P=5.27×10⁻³⁰)
and the cell cycle process (P=3.34×10⁻²⁹). Functions in
cluster 2 were associated with cytoskeleton organization, such as
the microtubule-based process (P=1.09×10⁻¹¹) and
microtubule cytoskeleton organization (P=7.27×10⁻¹¹).
Functions in cluster 3 were implicated in the regulation of the
cell cycle, such as the regulation of the mitotic cell cycle
(P=6.43×10⁻⁹) and the regulation of cell cycle process
(P=7.79×10⁻⁶). Functions in cluster 4 were involved in
DNA metabolism, such as the DNA metabolic process
(P=1.80×10⁻¹²) and the response to a DNA damage stimulus
(P=5.83×10⁻⁸) (Table
I).
 | Table I.Enriched GO functions and KEGG
pathways for the upregulated and downregulated genesa. |
Table I.
Enriched GO functions and KEGG
pathways for the upregulated and downregulated genesa.
| A, Enriched GO
functions for the upregulated genes |
|---|
|
|---|
| Category | Term |
| Description | Gene no. | Gene
symbolb | P-value |
|---|
| BP | GO:0000279 |
| M phase | 53 | DBF4, KNTC1,
TTK |
5.27×10⁻³⁰ |
| BP | GO:0022402 |
| Cell cycle
process | 66 | DBF4, KNTC1,
TTK |
3.34×10⁻²⁹ |
| BP | GO:0007017 |
| Microtubule-based
process | 28 | KIF23, CAV1,
KIF4A |
1.09×10⁻¹¹ |
| BP | GO:0000226 |
| Microtubule
cytoskeleton organization | 21 | KIF23, CAV1,
KIF11 |
7.27×10⁻¹¹ |
| BP | GO:0007346 |
| Regulation of
mitotic cell cycle | 19 | CDC7, DLGAP5,
TIPIN |
6.43×10⁻⁹ |
| BP | GO:0010564 |
| Regulation of cell
cycle process | 13 | CDC7, DLGAP5,
TIPIN |
7.79×10⁻⁶ |
| BP | GO:0006259 |
| DNA metabolic
process | 41 | UNG, DBF4,
TIPIN |
1.80×10⁻¹² |
| BP | GO:0006974 |
| Response to DNA
damage stimulus | 28 | UNG, TIPIN,
PRKDC |
5.83×10⁻⁸ |
|
| B, Enriched GO
functions for the downregulated genes |
|
| Category | Term |
| Description | Gene no. | Gene
symbolb | P-value |
|
| BP | GO:0030855 |
| Epithelial cell
differentiation | 16 | ELF3, FOXA1,
ANXA1 |
4.04×10⁻⁷ |
| BP | GO:0030216 |
| Keratinocyte
differentiation | 7 | SPRR1A, PPL,
CNFN |
3.48×10⁻³ |
| BP | GO:0010817 |
| Regulation of
hormone levels | 12 | FAM3B, FOXA1,
DUOX2 |
5.75×10⁻⁴ |
| BP | GO:0034754 |
| Cellular hormone
metabolic process | 5 | DHRS9, UGT1A6,
UGT1A10 |
4.25×10⁻² |
| BP | GO:0002526 |
| Acute inflammatory
response | 9 | F3, CLU,
SAA4 |
1.55×10⁻³ |
| BP | GO:0009611 |
| Response to
wounding | 23 | S100A9, ANXA1,
PRDX5 |
3.86×10⁻³ |
| BP | GO:0006959 |
| Humoral immune
response | 8 | CFB, FOXJ1,
CLU |
1.89×10⁻³ |
| BP | GO:0002455 |
| Humoral immune
response mediated by circulating immunoglobulin | 4 | C7, CD55,
CR2 |
3.12×10⁻² |
|
| C, Enriched KEGG
pathways for the upregulated and downregulated genes |
|
| Regulation | Category | Term | Description | Gene no. | Gene
symbolb | P-value |
|
| Up | KEGG | 04110 | Cell cycle | 21 | COL4A2, COL4A1,
COL3A1 |
3.32×10⁻¹¹ |
|
| KEGG | 04512 | ECM-receptor
interaction | 14 | COL4A2, COL4A1,
COL3A1 |
1.75×10⁻⁷ |
|
| KEGG | 03030 | DNA
replication | 9 | RFC5, DNA2,
RFC3 |
2.74×10⁻⁶ |
|
| KEGG | 03430 | Mismatch
repair | 7 | RFC5, EXO1,
MSH6 |
1.92×10⁻⁵ |
|
| KEGG | 04115 | p53 signaling
pathway | 9 | CCNE2, CCNB1,
CDK1 |
3.32×10⁻⁴ |
| Down | KEGG | 00980 | Metabolism of
xenobiotics by cytochrome P450 | 8 | GSTA1, GSTA3,
ADH1C |
1.82×10⁻⁴ |
|
| KEGG | 00982 | Drug
metabolism | 8 | GSTA3, ADH1C,
ADH7 |
2.25×10⁻⁴ |
|
| KEGG | 00830 | Retinol
metabolism | 6 | UGT1A1, UGT1A7,
ALDH1A1 |
4.45×10⁻³ |
|
| KEGG | 00590 | Arachidonic acid
metabolism | 5 | AKR1C3, GGT6,
ALOX15 |
2.61×10⁻² |
|
| KEGG | 04640 | Hematopoietic cell
lineage | 6 | MS4A1, CD1C,
CD1D |
2.96×10⁻² |
The enriched GO functions for downregulated genes
were divided into 9 clusters. For instance, functions in cluster 1
were associated with cell differentiation, such as epithelial cell
differentiation (P=4.04×10⁻⁷) and keratinocyte
differentiation (P=3.48×10⁻³). Functions in cluster 2
were involved in hormone metabolism, such as the regulation of
hormone levels (P=5.75×10⁻⁴) and the cellular hormone
metabolic process (P=4.25×10⁻²). Functions in cluster 3
were associated with the inflammatory response, such as the acute
inflammatory response (P=1.55×10⁻³) and the response to
wounding (P=3.86×10⁻³). Functions in cluster 4 were
implicated in the immune response, such as the humoral immune
response (P=1.89×10⁻³) and the humoral immune response
mediated by circulating immunoglobulin (P=3.12×10⁻²)
(Table I).
The enriched KEGG pathways for upregulated genes are
also listed in Table I, including the
cell cycle (P=3.32×10⁻¹¹), extracellular matrix-receptor
interaction (P=1.75×10⁻⁷) and DNA replication
(P=2.74×10⁻⁶). Additionally, pathway enrichment analysis
was conducted for downregulated genes. As shown in Table I, pathways such as those for the
metabolism of xenobiotics by cytochrome P450
(P=1.82×10⁻⁴), drug metabolism (P=2.25×10⁻⁴)
and retinol metabolism (P=4.45×10⁻³) were enriched
(Table I).
PPI network and module analysis
The PPI network for upregulated genes had 279 nodes
and 5,690 interactions. In particular, upregulated mitotic arrest
deficient 2-like 1 (MA D2L1; degree=133), replication factor
C4 (degree=130), proliferating cell nuclear antigen (PCNA;
degree=125), cyclin-dependent kinase 1 (degree=124) and cyclin B1
(CCNB1; degree=115) exhibited higher degrees in the PPI
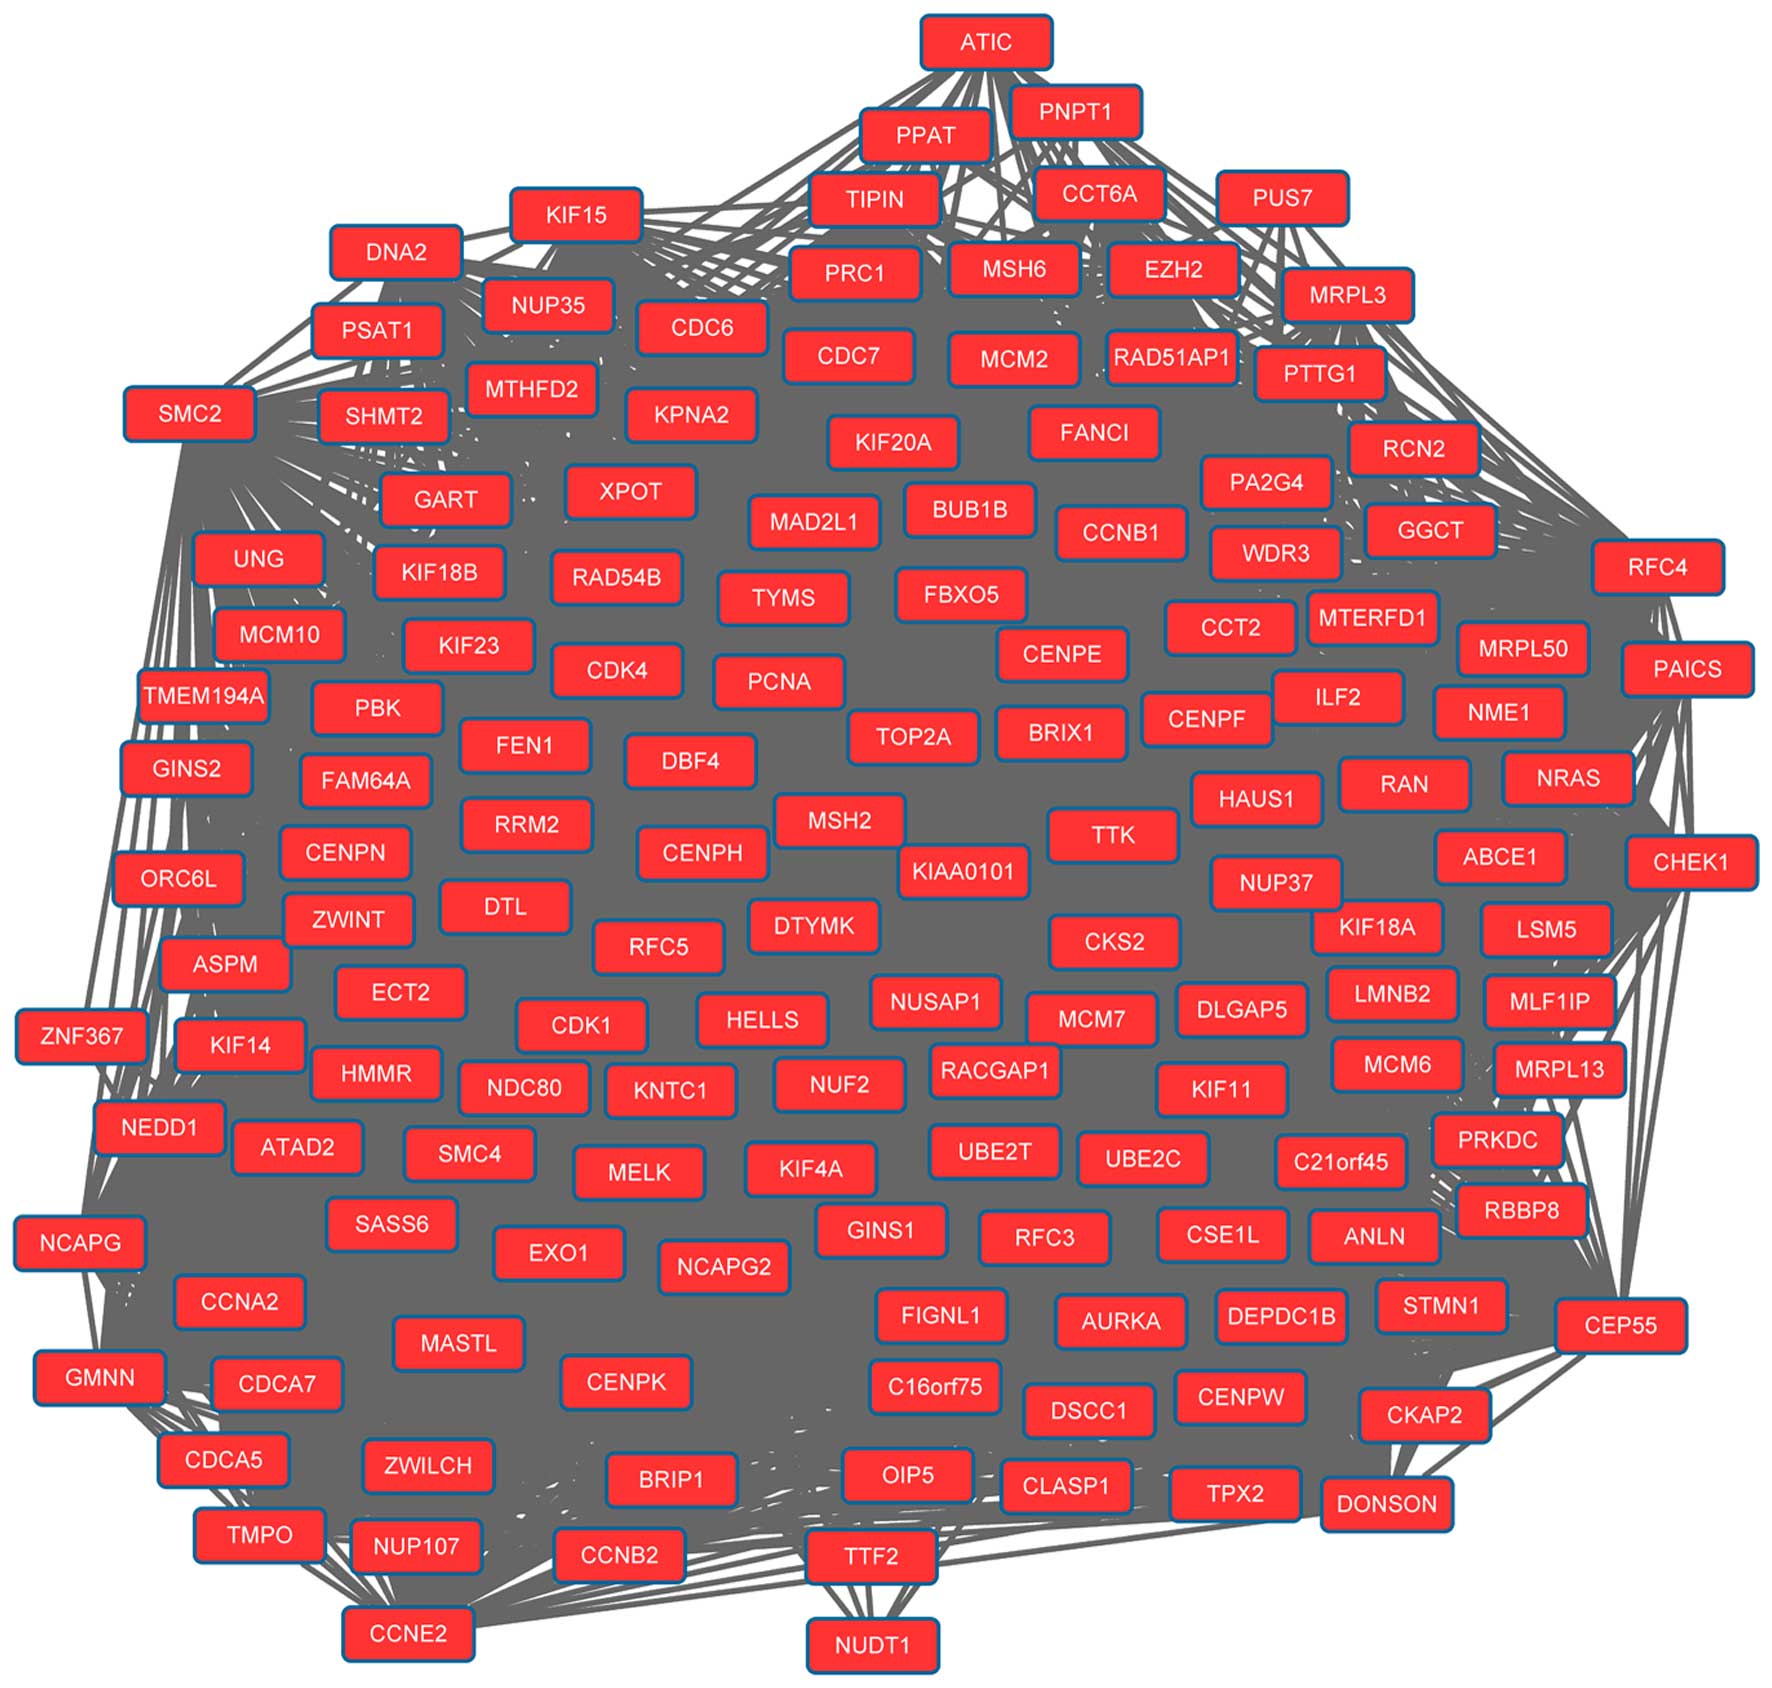
network. Modules 1 (Fig. 1) and 2
(Fig. 2) were obtained from the PPI
network of upregulated genes. Module 1 had 144 nodes and 5,091
interactions. Module 2 had 23 nodes and 133 interactions. The cell
cycle was an enriched pathway for the DEGs in modules 1 and 2.
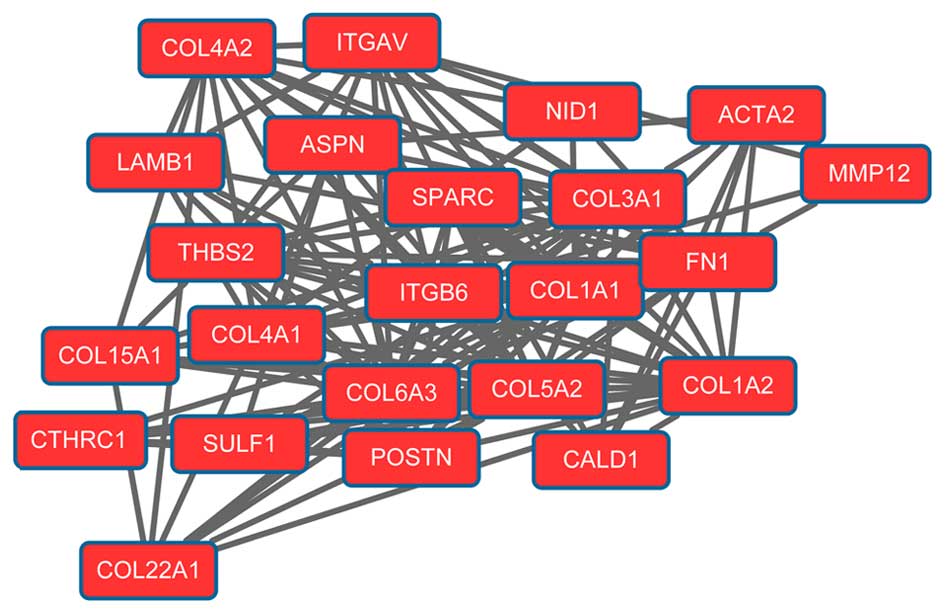
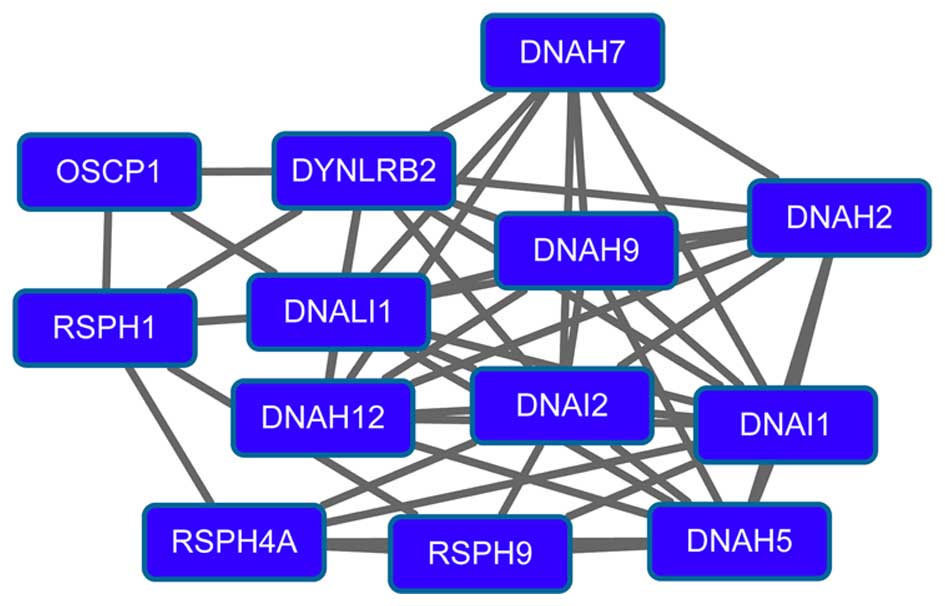
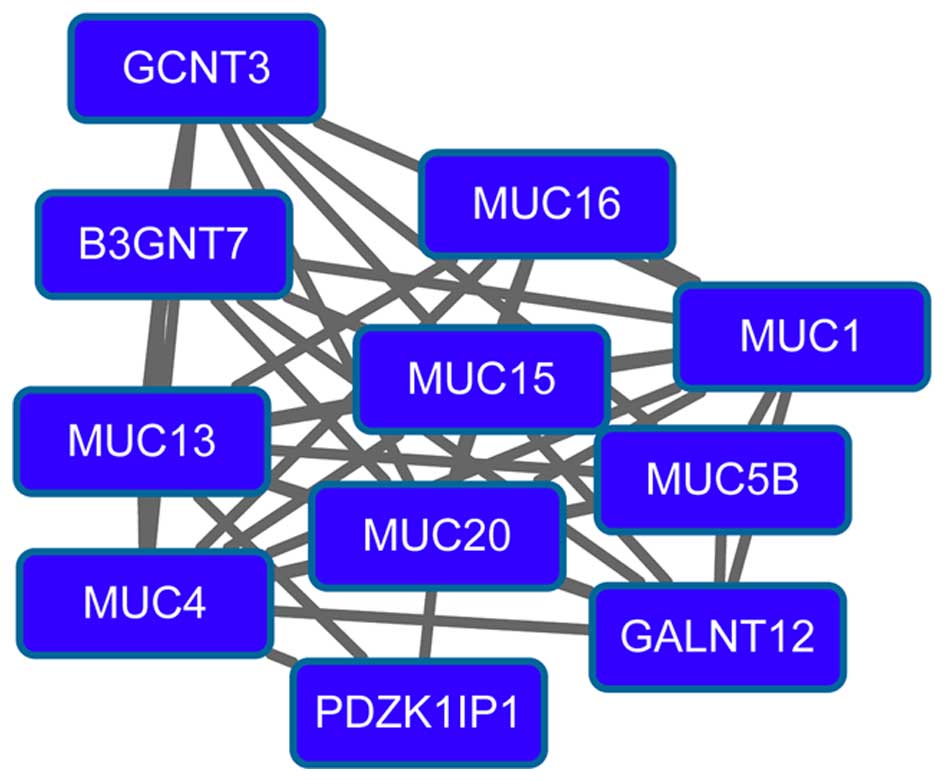
The PPI network for downregulated genes had 260
nodes and 517 interactions. Importantly, downregulated glutathione
S-transferase α1 (GSTA1; degree=19), GSTA3
(degree=19), dynein, light chain, roadblock-type 2 (degree=17),
calmodulin 1 (degree=16), member A1 of aldehyde dehydrogenase 1
(ALDH1A1; degree=15) and sperm-associated antigen 6
(degree=15) had higher degrees in the PPI network. Modules 3
(Fig. 3) and 4 (Fig. 4) were obtained from the PPI network of
downregulated genes. Module 3 had 13 nodes and 48 interactions. The
enriched pathway for DEGs in module 3 included the
mitogen-activated protein kinase signaling pathway. Module 4 had 11
nodes, such as mucin 1 (MUC1), and 43 interactions. O-glycan
biosynthesis was an enriched pathway for DEGs in module 4.
Discussion
In the present study, 951 DEGs were screened in the
NPC samples compared with normal healthy nasopharyngeal tissue
samples. Function enrichment indicated that the upregulated genes
were mainly associated with the cell cycle, cytoskeleton
organization and DNA metabolism. The downregulated genes were
associated with cell differentiation, hormone metabolism, the
inflammatory response and the immune response. Meanwhile,
upregulated MAD2L1 (degree=133), PCNA (degree=125)
and CCNB1 (degree=115), and downregulated ALDH1A1
(degree=15) exhibited higher degrees of interaction in the PPI
network.
Via the induction of mitotic arrest, MAD2 can
cause chemosensitization to cisplatin in NPC cells and activate the
apoptosis pathway (24). The
aberrantly reduced expression of MAD2 can lead to a
defective mitotic checkpoint and promote chromosomal instability in
the disease (25). Sensitization to
vincristine induced by MAD2 is associated with
Raf/Bcl-2 phosphorylation and mitotic arrest in NPC
cells (26). The M-phase events of
MAD2 and CCNB1/CDC2 activation are essential to the
paclitaxel-induced apoptosis of human NPC cells (27). Thus, the expression levels of
MAD2L1 and CCNB1 may be associated with NPC. It has
been reported that upregulated BCL-2 and a high PCNA
labeling index may be implicated in local recurrence in NPC
patients receiving the primary treatment of radiation therapy
(28). Through inhibiting the
expression of PCNA, a PCNA-small interfering RNA compound
can effectively interfere with NPC cells and may be used in the
gene therapy of NPC (29). These data
indicate that PCNA may also play a role in NPC.
The expression of ALDH1 in the invasive front
links, which is associated with tumor aggressiveness and
epithelial-mesenchymal transition characteristics, may serve as a
promising predictive factor in NPC (30,31).
Budding cells characterized by a high level of ALDH1 may
have invasive and metastatic properties, therefore, the degree of
expression can be a useful prognostic marker in NPC patients
(32). It has been reported that the
overexpression of ALDH1A1 in NPC is associated with enhanced
invasiveness (33). These data
indicate that ALDH1A1 may have a close correlation with NPC.
MUC1, a mucinous glycoprotein required for the detachment
and release of tumor cells, combined with other invasiveness and
angiogenic factors may function in a complex sequential process
that ends in the metastasis of EBV-infected NPC cells (34). This may indicate that the expression
level of MUC1 is associated with EBV-associated NPC.
In conclusion, in the present study, an integrated
bioinformatics analysis of genes that may be involved in
EBV-associated NPC was performed. A total of 951 DEGs were screened
in the NPC samples compared with the normal healthy nasopharyngeal
tissue samples. Certain DEGs, such as MAD2L1, CCNB1,
PCNA, ALDH1A1 and MUC1, may have a correlation
with NPC. However, future studies are required to advance the
understanding of their mechanisms of action in NPC.
Acknowledgements
This study was supported by the Fundamental Research
Funds for the Central Universities (grant no. 20620140692), the
Jiangsu Government Scholarship for Overseas Studies 2014, the
Medical Youth Priming Project of Nanjing (grant no. QYK11162), the
National Natural Science Foundation of China (grant no. 30973302),
the Medical Important People Project of Jiangsu Province (grant no.
RC2007010) and the Medical Important Developing Project of Nanjing
(grant no. ZKX06019).
References
|
1
|
Xia H, Ng SS, Jiang S, Cheung WK, Sze J,
Bian XW, Kung HF and Lin MC: miR-200a-mediated downregulation of
ZEB2 and CTNNB1 differentially inhibits nasopharyngeal carcinoma
cell growth, migration and invasion. Biochem Biophys Res Commun.
391:535–541. 2010. View Article : Google Scholar : PubMed/NCBI
|
|
2
|
Zhang F and Zhang J: Clinical hereditary
characteristics in nasopharyngeal carcinoma through Ye-Liang's
family cluster. Chin Med J (Engl). 112:185–187. 1999.PubMed/NCBI
|
|
3
|
Lo KW, Chung GT and To KF: Deciphering the
molecular genetic basis of NPC through molecular, cytogenetic, and
epigenetic approaches. Semin Cancer Biol. 22:79–86. 2012.
View Article : Google Scholar : PubMed/NCBI
|
|
4
|
Yu MC, Ho JH, Lai SH and Henderson BE:
Cantonese-style salted fish as a cause of nasopharyngeal carcinoma:
Report of a case-control study in Hong Kong. Cancer Res.
46:956–961. 1986.PubMed/NCBI
|
|
5
|
Lozano R, Naghavi M, Foreman K, Lim S,
Shibuya K, Aboyans V, Abraham J, Adair T, Aggarwal R, Ahn SY, et
al: Global and regional mortality from 235 causes of death for 20
age groups in 1990 and 2010: A systematic analysis for the global
burden of disease study 2010. Lancet. 380:2095–2128. 2012.
View Article : Google Scholar : PubMed/NCBI
|
|
6
|
Wei MX, Moulin JC, Decaussin G, Berger F
and Ooka T: Expression and tumorigenicity of the Epstein-Barr virus
BARF1 gene in human Louckes B-lymphocyte cell line. Cancer Res.
54:1843–1848. 1994.PubMed/NCBI
|
|
7
|
Decaussin G, SbihLammali F, de
Turenne-Tessier M, Bouguermouh A and Ooka T: Expression of BARF1
gene encoded by Epstein-Barr virus in nasopharyngeal carcinoma
biopsies. Cancer Res. 60:5584–5588. 2000.PubMed/NCBI
|
|
8
|
Seto E, Yang L, Middeldorp J, Sheen TS,
Chen JY, Fukayama M, Eizuru Y, Ooka T and Takada K: Epstein-Barr
virus (EBV)-encoded BARF1 gene is expressed in nasopharyngeal
carcinoma and EBV-associated gastric carcinoma tissues in the
absence of lytic gene expression. J Med Virol. 76:82–88. 2005.
View Article : Google Scholar : PubMed/NCBI
|
|
9
|
Zhou L, Jiang W, Ren C, Yin Z, Feng X, Liu
W, Tao Q and Yao K: Frequent hypermethylation of RASSF1A and TSLC1,
and high viral load of Epstein-Barr Virus DNA in nasopharyngeal
carcinoma and matched tumor-adjacent tissues. Neoplasia. 7:809–815.
2005. View Article : Google Scholar : PubMed/NCBI
|
|
10
|
Lo KW, Kwong J, Hui AB, Chan SY, To KF,
Chan AS, Chow LS, Teo PM, Johnson PJ and Huang DP: High frequency
of promoter hypermethylation of RASSF1A in nasopharyngeal
carcinoma. Cancer Res. 61:3877–3881. 2001.PubMed/NCBI
|
|
11
|
Feng P, Ren EC, Liu D, Chan SH and Hu H:
Expression of Epstein-Barr virus lytic gene BRLF1 in nasopharyngeal
carcinoma: Potential use in diagnosis. J Gen Virol. 81:2417–2423.
2000. View Article : Google Scholar : PubMed/NCBI
|
|
12
|
Horikawa T, Sheen TS, Takeshita H, Sato H,
Furukawa M and Yoshizaki T: Induction of c-Met proto-oncogene by
Epstein-Barr virus latent membrane protein-1 and the correlation
with cervical lymph node metastasis of nasopharyngeal carcinoma. Am
J Pathol. 159:27–33. 2001. View Article : Google Scholar : PubMed/NCBI
|
|
13
|
Heussinger N, Büttner M, Ott G, Brachtel
E, Pilch BZ, Kremmer E and Niedobitek G: Expression of the
Epstein-Barr virus (EBV)-encoded latent membrane protein 2A (LMP2A)
in EBV-associated nasopharyngeal carcinoma. J Pathol. 203:696–699.
2004. View Article : Google Scholar : PubMed/NCBI
|
|
14
|
Sengupta S, den Boon JA, Chen IH, Newton
MA, Dahl DB, Chen M, Cheng YJ, Westra WH, Chen CJ, Hildesheim A, et
al: Genome-wide expression profiling reveals EBV-associated
inhibition of MHC class I expression in nasopharyngeal carcinoma.
Cancer Res. 66:7999–8006. 2006. View Article : Google Scholar : PubMed/NCBI
|
|
15
|
Gautier L, Cope L, Bolstad BM and Irizarry
RA: Affy-analysis of Affymetrix GeneChip data at the probe level.
Bioinformatics. 20:307–315. 2004. View Article : Google Scholar : PubMed/NCBI
|
|
16
|
Bolstad BM, Irizarry RA, Åstrand M and
Speed TP: A comparison of normalization methods for high density
oligonucleotide array data based on variance and bias.
Bioinformatics. 19:185–193. 2003. View Article : Google Scholar : PubMed/NCBI
|
|
17
|
Smyth GK: Limma: Linear models for
microarray dataBioinformatics and Computational Biology Solutions
using R and Bioconductor. Gentleman R, Carey V, Dudoit S, Irizarry
R and Huber W: Springer; New York: pp. 397–420. 2005, View Article : Google Scholar
|
|
18
|
Tweedie S, Ashburner M, Falls K, Leyland
P, McQuilton P, Marygold S, Millburn G, OsumiSutherland D,
Schroeder A, Seal R, et al: FlyBase: Enhancing Drosophila gene
ontology annotations. Nucleic Acids Res. 37:D555–D559. 2009.
View Article : Google Scholar : PubMed/NCBI
|
|
19
|
Kanehisa M and Goto S: KEGG: kyoto
encyclopedia of genes and genomes. Nucleic Acids Res. 28:27–30.
2000. View Article : Google Scholar : PubMed/NCBI
|
|
20
|
Dennis G Jr, Sherman BT, Hosack DA, Yang
J, Gao W, Lane HC and Lempicki RA: DAVID: Database for annotation,
visualization, and integrated discovery. Genome Biol. 4:P32003.
View Article : Google Scholar : PubMed/NCBI
|
|
21
|
Franceschini A, Szklarczyk D, Frankild S,
Kuhn M, Simonovic M, Roth A, Lin J, Minguez P, Bork P, von Mering C
and Jensen LJ: STRING v9. 1: Protein-protein interaction networks,
with increased coverage and integration. Nucleic Acids Res.
41:D808–D815. 2013. View Article : Google Scholar : PubMed/NCBI
|
|
22
|
Smoot ME, Ono K, Ruscheinski J, Wang PL
and Ideker T: Cytoscape 2.8: New features for data integration and
network visualization. Bioinformatics. 27:431–432. 2011. View Article : Google Scholar : PubMed/NCBI
|
|
23
|
Nepusz T, Yu H and Paccanaro A: Detecting
overlapping protein complexes in protein-protein interaction
networks. Nat Methods. 9:471–472. 2012. View Article : Google Scholar : PubMed/NCBI
|
|
24
|
Cheung HW, Jin DY, Ling MT, Wong YC, Wang
Q, Tsao SW and Wang X: Mitotic arrest deficient 2 expression
induces chemosensitization to a DNA-damaging agent, cisplatin, in
nasopharyngeal carcinoma cells. Cancer Res. 65:1450–1458. 2005.
View Article : Google Scholar : PubMed/NCBI
|
|
25
|
Wang X, Jin DY, Wong YC, Cheung AL, Chun
AC, Lo AK, Liu Y and Tsao SW: Correlation of defective mitotic
checkpoint with aberrantly reduced expression of MAD2 protein in
nasopharyngeal carcinoma cells. Carcinogenesis. 21:2293–2297. 2000.
View Article : Google Scholar : PubMed/NCBI
|
|
26
|
Wang X, Jin DY, Wong HL, Feng H, Wong YC
and Tsao SW: MAD2-induced sensitization to vincristine is
associated with mitotic arrest and Raf/Bcl-2 phosphorylation in
nasopharyngeal carcinoma cells. Oncogene. 22:109–116. 2003.
View Article : Google Scholar : PubMed/NCBI
|
|
27
|
Huang TS, Shu CH, Chao Y, Chen SN and Chen
LL: Activation of MAD 2 checkprotein and persistence of cyclin
B1/CDC 2 activity associate with paclitaxel-induced apoptosis in
human nasopharyngeal carcinoma cells. Apoptosis. 5:235–241. 2000.
View Article : Google Scholar : PubMed/NCBI
|
|
28
|
Tsai ST, Jin YT, Leung HW, Wang ST, Tsao
CJ and Su IJ: Bcl-2 and proliferating cell nuclear antigen (PCNA)
expression correlates with subsequent local recurrence in
nasopharyngeal carcinomas. Anticancer Res. 18:2849–2854.
1998.PubMed/NCBI
|
|
29
|
Lian B, Wang JQ and Jin L: Effects of
siRNA targeting PCNA gene on nasopharyngeal carcinoma CNE2 cell
cycle. Chin J Pathophysiol. 25:1533–1537. 2009.(In Chinese).
|
|
30
|
Luo WR and Yao KT: Cancer stem cell
characteristics, ALDH1 expression in the invasive front of
nasopharyngeal carcinoma. Virchows Arch. 464:35–43. 2014.
View Article : Google Scholar : PubMed/NCBI
|
|
31
|
Wu A, Luo W, Zhang Q, Yang Z, Zhang G, Li
S and Yao K: Aldehyde dehydrogenase 1, a functional marker for
identifying cancer stem cells in human nasopharyngeal carcinoma.
Cancer Lett. 330:181–189. 2013. View Article : Google Scholar : PubMed/NCBI
|
|
32
|
Luo WR, Gao F, Li SY and Yao KT: Tumour
budding and the expression of cancer stem cell marker aldehyde
dehydrogenase 1 in nasopharyngeal carcinoma. Histopathology.
61:1072–1081. 2012. View Article : Google Scholar : PubMed/NCBI
|
|
33
|
Hou W, He W, Li Y, Ma R, Wang Z, Zhu X, Fu
Q, Wen Y, Li H and Wen W: Increased expression of aldehyde
dehydrogenase 1 A1 in nasopharyngeal carcinoma is associated with
enhanced invasiveness. Eur Arch Otorhinolaryngol. 271:171–179.
2014. View Article : Google Scholar : PubMed/NCBI
|
|
34
|
Kondo S, Yoshizaki T, Wakisaka N, Horikawa
T, Murono S, Jang KL, Joab I, Furukawa M and Pagano JS: MUC1
induced by Epstein-Barr virus latent membrane protein 1 causes
dissociation of the cell-matrix interaction and cellular
invasiveness via STAT signaling. J Virol. 81:1554–1562. 2007.
View Article : Google Scholar : PubMed/NCBI
|