Introduction
Gestational trophoblastic disease (GTD) is a group
of conditions that originate from the abnormal proliferation of
trophoblastic cells, which derive from the trophectoderm, the outer
layer of the blastocyst that would normally develop into the
placenta during pregnancy (1,2). GTDs encompass hydatidiform moles (HMs;
complete and partial), invasive moles (IMs), choriocarcinoma (CCA),
placental-site trophoblastic tumors and epithelioid trophoblastic
tumors. HMs are a type of aberrant human pregnancy with abnormal
embryonic development. HMs occur in ~1:600 pregnancies in the
United Kingdom (1), with even higher
rates in the Middle East, Latin America, Africa and the Far East
(2–5).
The majority of HMs will spontaneously regress following suction
evacuation; however, 8–30% of HMs persist after evacuation and
develop into gestational trophoblastic neoplasia (GTN), requiring
chemotherapy (6).
Although GTN typically responds well to
chemotherapy, chemoresistant cases still exist, even despite
advances in chemotherapy. Since the introduction of chemotherapy,
reliable measurement of serum β human chorionic gonadotropin
(β-hCG) levels and individualized risk-based therapy into the
management of GTN, the majority of low-risk and 80% of high-risk
GTN cases are curable (6). However,
15–25% of high-risk GTNs develop resistance to chemotherapy, or
relapse following the completion of initial therapy, necessitating
salvage combination chemotherapy (7).
At the opposite end of the spectrum, a proportion of patients with
GTD have persistently low levels of β-hCG without clinical or
radiological evidence of disease, a condition called quiescent GTD.
While there is a growing understanding of the molecular biology of
GTD, the precise molecular signaling pathways underlying the
development of GTD require further exploration (6,8,9). More tumor markers to predict the
development of GTN from GTD are required. Thus, the current study
evaluated maspin and tumor protein p53 (p53) expression in GTD.
Maspin was identified in 1994 by subtractive
hybridization analysis of normal mammary tissue and breast cancer
cell lines (10). A previous study
demonstrated that maspin is a multifaceted protein, interacting
with a diverse group of intercellular and extracellular proteins
responsible for regulating cell adhesion, motility, apoptosis and
angiogenesis, and is critically involved in mammary gland
development (11). The expression of
maspin has been observed to inhibit tumor cell invasion and
metastasis in breast, prostate, ovarian, colorectal and several
other types of cancer (11,12). p53 has been identified as a regulator
of maspin expression in breast, lung and colorectal cancer cell
lines (13–15). In mammary epithelial cells, the
wild-type p53 (wt-p53) binds to the promoter of maspin and
activates its expression, leading to inhibition of cellular
invasion and migration (16). These
findings suggest that the association between maspin and p53 may
have some clinical significance in the development of malignant
disease.
Using placental tissue from gestational age-matched,
normal first or early-second trimester pregnancies as a control,
the present study examined the expression of maspin and mutant p53
(m-p53) in GTD and evaluated its potential prognostic value.
Materials and methods
Clinical samples
A total of 99 formalin-fixed, paraffin-embedded
(FFPE) placental tissue blocks were used in the present study,
including 49 HMs that regressed (rHMs), 39 malignant HMs (mHMs)
that subsequently progressed to GTN after 2 years (determined in
follow-up), 4 IMs and 7 CCAs. Tissue specimens were collected from
the Fujian Maternity and Children Health Hospital (FWCH) at the
First Affiliated Hospital of Fujian Medical University (Fuzhou,
China). Study approval was obtained from the Institutional Research
Board of FWCH. As a control, fresh placental tissue samples were
collected from 48 normal first or early-second trimester
pregnancies, matched by gestational ages to the molar specimens.
GTN was diagnosed based on a plateau in β-hCG levels for 4
measurements over 3 weeks, or by a rise in β-hCG levels for 3
consecutive measurements over 2 weeks when pregnancy was excluded.
Further information on the study population is listed in Table I. The International Federation of
Gynecology and Obstetrics (FIGO) stage (2000) and FIGO risk
prognostic factor scores (2002) were collected for all patients
(17).
 | Table I.Clinicopathological characteristics of
the patients (n=147). |
Table I.
Clinicopathological characteristics of
the patients (n=147).
|
|
| Regressive HMs | Malignant HMs |
|
|
|---|
|
|
|
|
|
|
|
|---|
| Variable | Normal (n=48) | C (n=35) | P (n=14) | C (n=23) | P (n=16) | GTN (n=11) | P-valuea |
|---|
| Age, years | 26.05±4.61 | 27.06±9.39 | 26.43±8.18 | 29.13±7.81 | 33.06±11.60 | 31.55±4.87 | 0.055 |
| β-hCG level
(1×10⁵) mIU/ml | – | 2.63±3.16 | 3.20±4.02 | 4.68±4.80 | 4.61±5.73 | 4.12±5.02 | 0.064 |
| Gestation | 1.92±0.88 | 2.46±1.07 | 2.29±0.73 | 2.57±0.90 | 2.38±0.89 | 2.45±0.52 | 0.294 |
| Production | 0.50±0.66 | 0.46±0.66 | 0.43±0.51 | 0.57±0.51 | 0.625±0.719 | 0.72±0.47 | 0.055 |
Serum β-hCG assay
Architect™ total β-hCG reagent kit (Abbott
Laboratories, Lake Bluff, IL, USA) was used to perform serum β-hCG
quantitative measurement in an ARCHITECT I 2000SR
immunoassay analyser system (Abbott Laboratories) for 45 min.
Immunohistochemical staining
Immunohistochemical staining was performed as
previously described (18). Briefly,
serial 5-µm FFPE tissue sections were cut and de-waxed in xylene
and rehydrated through graded ethanol, followed by Tris-buffered
saline (TBS). Endogenous peroxidase activity was blocked using 3%
hydrogen peroxide for 5 min. For antigen retrieval, the tissue
sections were boiled at 96–98°C in 0.01 M sodium citrate buffer in
a microwave oven for 5 min and cooled to room temperature.
Non-specific binding was blocked by incubating the tissue sections
with Protein Block Serum-Free (Dako North America, Inc.,
Carpinteria, CA, USA) for 5 min. Immunohistochemistry was performed
using a rabbit anti-human maspin antibody (1:200 dilution; cat.
bs-0792R; Bioss, Beijing, China) and a mouse anti-human m-p53
antibody (1:250 dilution; cat. sc-126; Santa Cruz Biotechnology,
Dallas, USA). A PV-9000 2-Step Plus® Poly-horseradish
peroxidase (HRP) Anti-Mouse/Rabbit IgG Detection System (Golden
Bridge International, Mukilteo, WA, USA) was used to detect the
target proteins. Briefly, the tissue sections were incubated with
the rabbit anti-human maspin antibody or the mouse anti-human m-p53
antibody at room temperature for 1 h, followed by washing with
phosphate-buffered saline for 2 min a total of 3 times.
Subsequently, the sections were incubated with polymer helper
(provide by the PV-9000 2-Step Plus® system) at room
temperature for 20 min, and HRP labeled poly
peroxidase-anti-mouse/rabbit IgG (provided by the PV-9000 2-Step
Plus® system) at room temperature for 30 min. The color
was developed and visualized by using an EnVision DAB Detection
System (Dako, Glostrup, Denmark). Negative controls were prepared
by replacing the primary antibody with TBS. Positive controls were
prepared using a known maspin-positive first-trimester
trophoblastic tissue sample, and breast cancer tissue with a known
m-p53 gene, which were set up by the Laboratory of Pathology
Department, Fujian Maternity and Children Health Hospital (Fuzhou,
China).
Assessment of immunohistochemical
staining
Two independent pathologists assessed the
immunostaining. A total of 4 fields/section were selected and 10
images/field were captured at random using a light microscope
(BX-51; Olympus Corporation, Tokyo, Japan) with a digital camera
(DP70; Olympus Corporation). Staining intensity was scored on an
arbitrary scale: 0, no immunoreactivity; 1, weak; 2, moderate; and
3, intense. In each image, 100 cells were counted and recorded. The
percentage of positive cells was graded as follows: 0, negative; 1,
<33; 2, 33–67%; and 3, >67%. The overall immunoreactivity was
determined through the multiplication of the above two parameters
to give a composite ‘histoscore’ with a maximum score of 9
(18,19). A histoscore >3 was defined as
representative of positive expression for maspin or P-53.
Statistical analysis
Statistical analysis was performed using SPSS
version 13.0 (SPSS, Inc., Chicago, IL, USA). All parametric
results, for age, β-hCG level, gestation time, production time and
immunohistochemical scores are expressed as the mean ± standard
deviation and were compared by analysis of variance. The rate of
positive expression was expressed as % and compared by
χ2 and Fisher's exact test. Spearman's rank correlation
analysis, logistic regression and multivariable linear regression
analysis were also used. P<0.05 was considered to indicate a
statistically significant result.
Results
Expression of maspin and m-p53
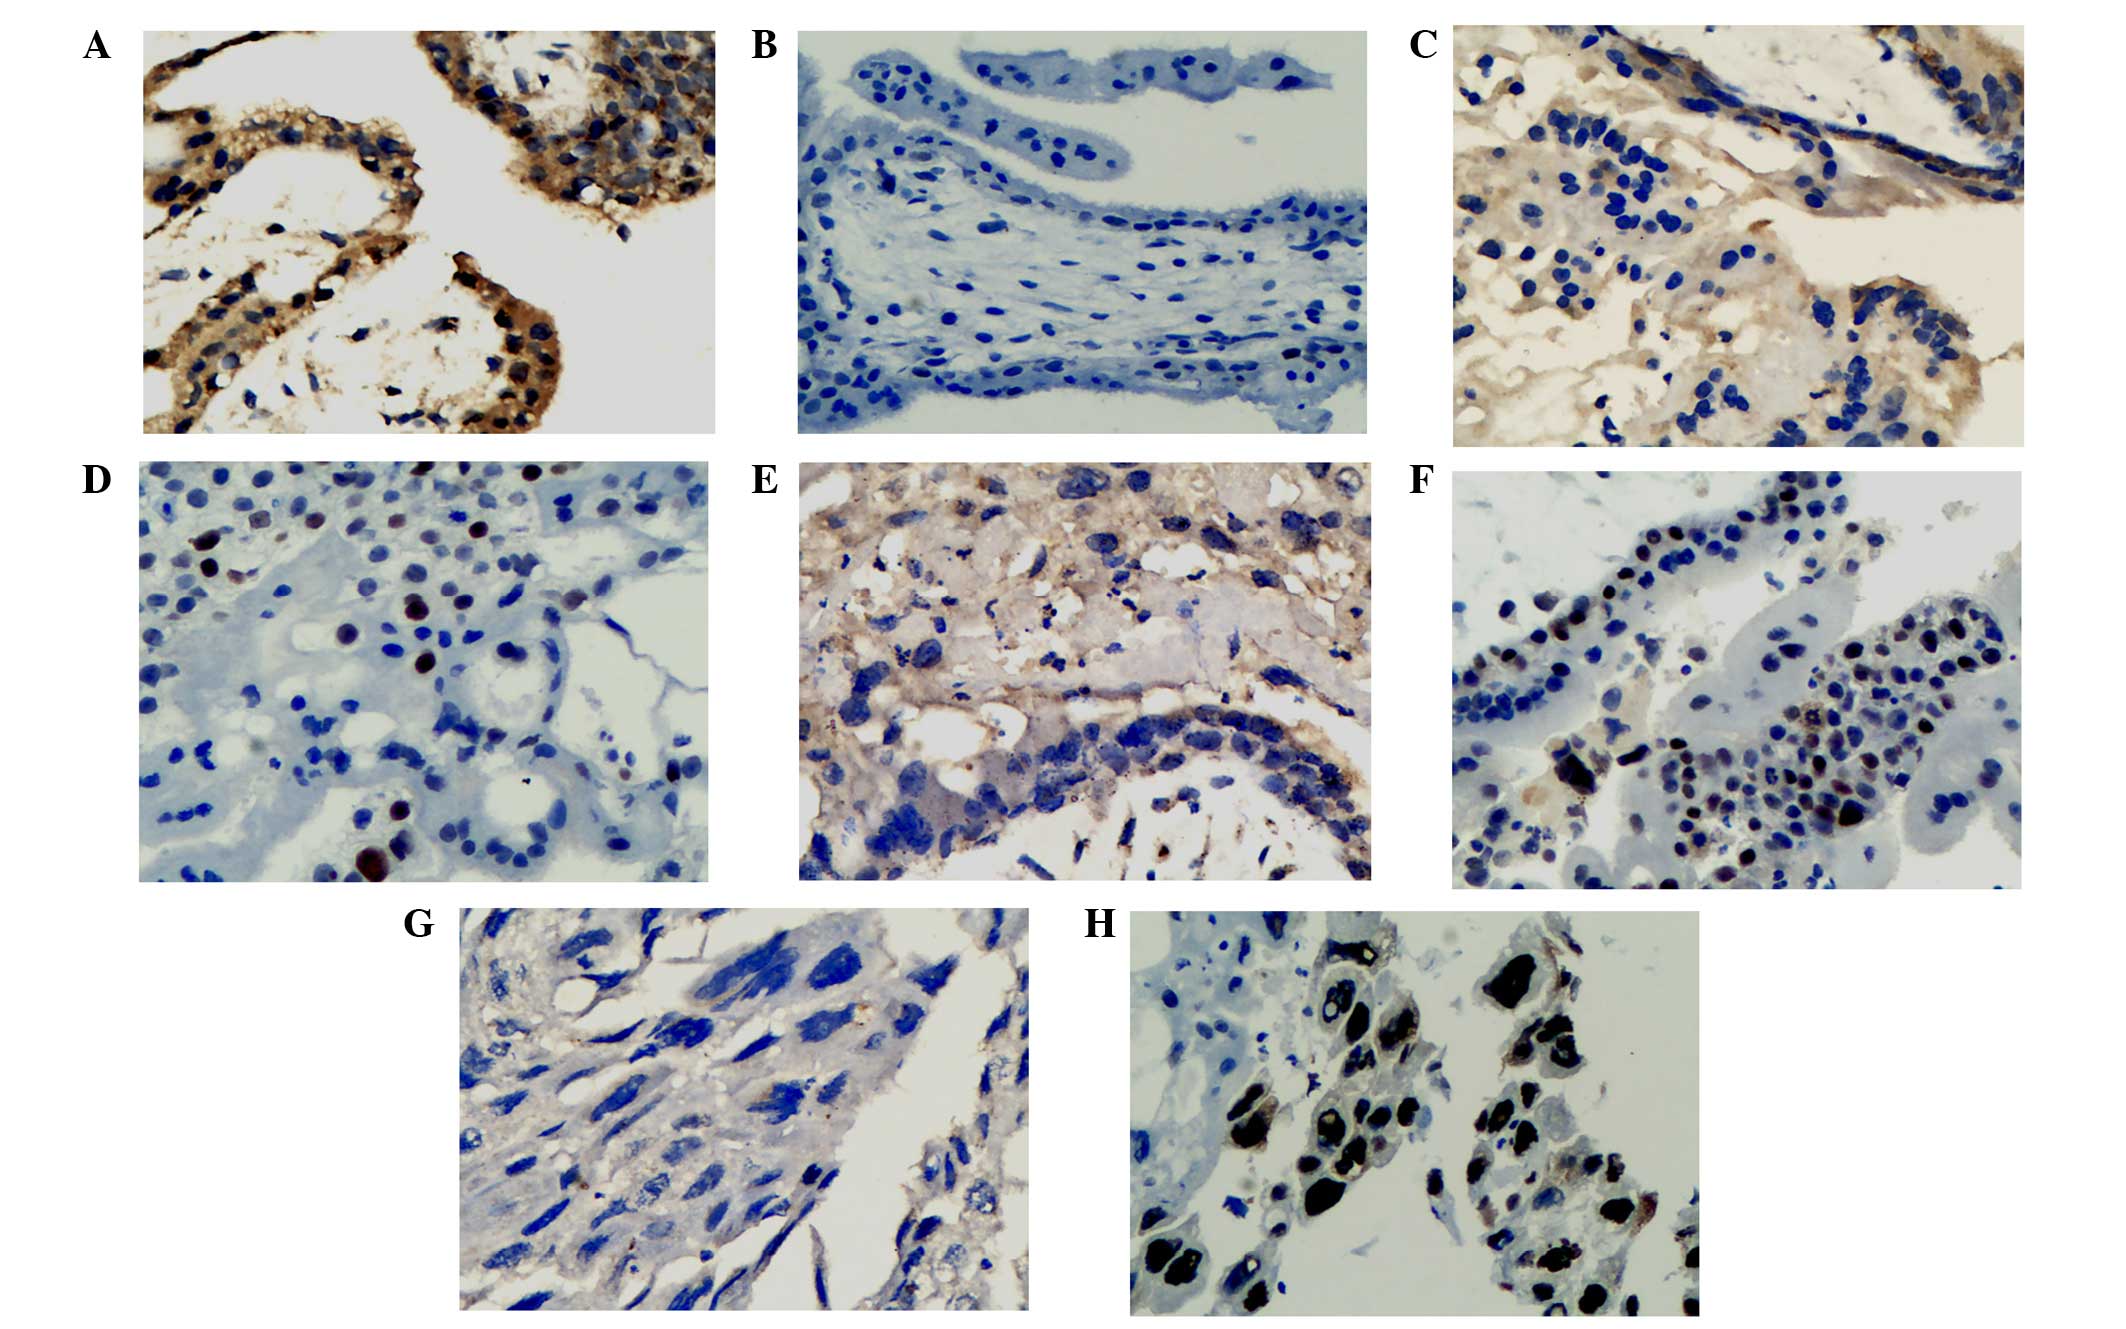
The expression of maspin in normal first-trimester
placental tissue, HMs and IMs was localized to the cytoplasm of the
trophoblastic cells, with markedly higher expression in
cytotrophoblasts compared with syncytiotrophoblasts (Fig. 1). From normal first-trimester
placentas to rHMs, mHMs and IM/CCAs, positive maspin expression
decreased significantly (χ2=30.34; P<0.001; Fig. 2A). Compared with the normal
first-trimester placenta, positive expression of maspin was
significantly less frequent among rHMs (χ2=5.81;
P=0.016), mHMs (χ2=18.86; P<0.001) and IM/CCAs
(χ2=22.82; P<0.001). Compared with rHMs, positive
maspin expression was significantly lower in mHMs
(χ2=7.52; P=0.006) and IM/CCAs (χ2=11.47;
P=0.001). No significant differences were identified in maspin
expression between mHMs and IM/CCAs (χ2=2.93, P=0.087).
Immunostaining performed on 7 cases of CCA revealed that the tumor
cells did not stain for maspin. Conversely, the expression of m-p53
was observed in the nucleus of cytotrophoblastic cells and in
intermediate trophoblast populations within the placental tissue. A
step-wise increase in positive m-p53 expression was observed from
the normal first-trimester placenta to the rHMs, mHMs and IM/CCAs
(χ2=24.18; P<0.001; Fig.
2B). Compared with the normal placenta, the positive expression
of m-p53 was significantly higher in the rHMs (χ2=4.64;
P=0.031), mHMs (χ2=17.13; P<0.001) and IM/CCAs
(χ2=15.12; P<0.001). Compared with rHMs,
significantly higher rates of positive m-p53 expression were
observed in mHMs (χ2=6.75; P=0.009) and IM/CCAs
(χ2=7.01; P=0.016). There was no significant difference
in m-p53 expression between the mHMs and IM/CCAs
(χ2=2.02; P=0.242).
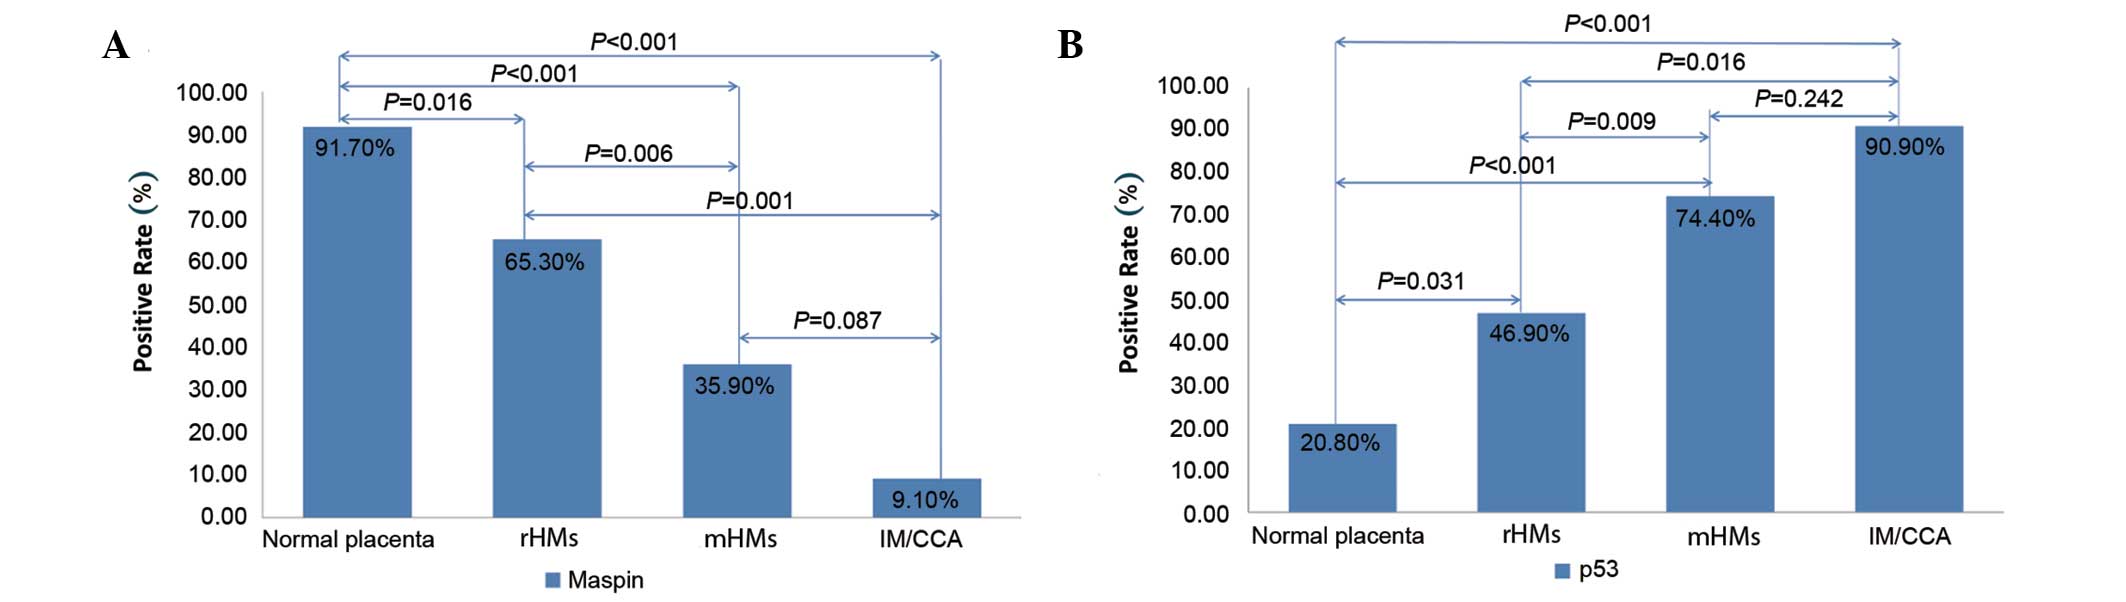 | Figure 2.Expression of (A) maspin and (B) m-p53
in various types of tissue. (A) Compared with the normal
first-trimester placenta, the rate of positive expression of maspin
was significantly lower in rHMs, mHMs and IM/CCA. Compared with
rHMs, the positive expression of maspin was significantly lower in
mHMs and IM/CCAs. There was no significant difference between the
frequency of positive maspin expression in mHMs and IM/CCAs. (B)
Compared with the normal placenta, the positive expression of m-p53
was significantly higher in rHMs, mHMs and IM/CCAs. Compared with
rHMs, the positive expression of m-p53 was significantly higher in
mHMs and IM/CCAs. The expression of m-p53 in mHMs and IM/CCAs was
not significantly different. m-p53, mutant tumor protein p53; rHMs,
regressive hydatidiform mole; mHMs, malignant hydatidiform moles;
IM/CCA, invasive mole/choriocarcinoma. |
Expression of maspin and m-p53 in
complete moles and partial moles
Of the 49 rHMs, 35 were complete HMs and 14 were
partial HMs. Of the 39 mHMs, 23 were complete HMs and 16 were
partial HMs. The frequencies of positive expression of maspin and
m-p53 among the complete HMs [55.17% (32/58 cases) and 60.34%
(35/58 cases), respectively] and partial HMs [46.67% (14/30 cases)
and 56.67% (17/30 cases), respectively] were similar. Additionally,
no significant differences were identified in the expression of
maspin and m-p53 between complete and partial moles in rHMs or mHMs
(all P>0.05; Fig. 3).
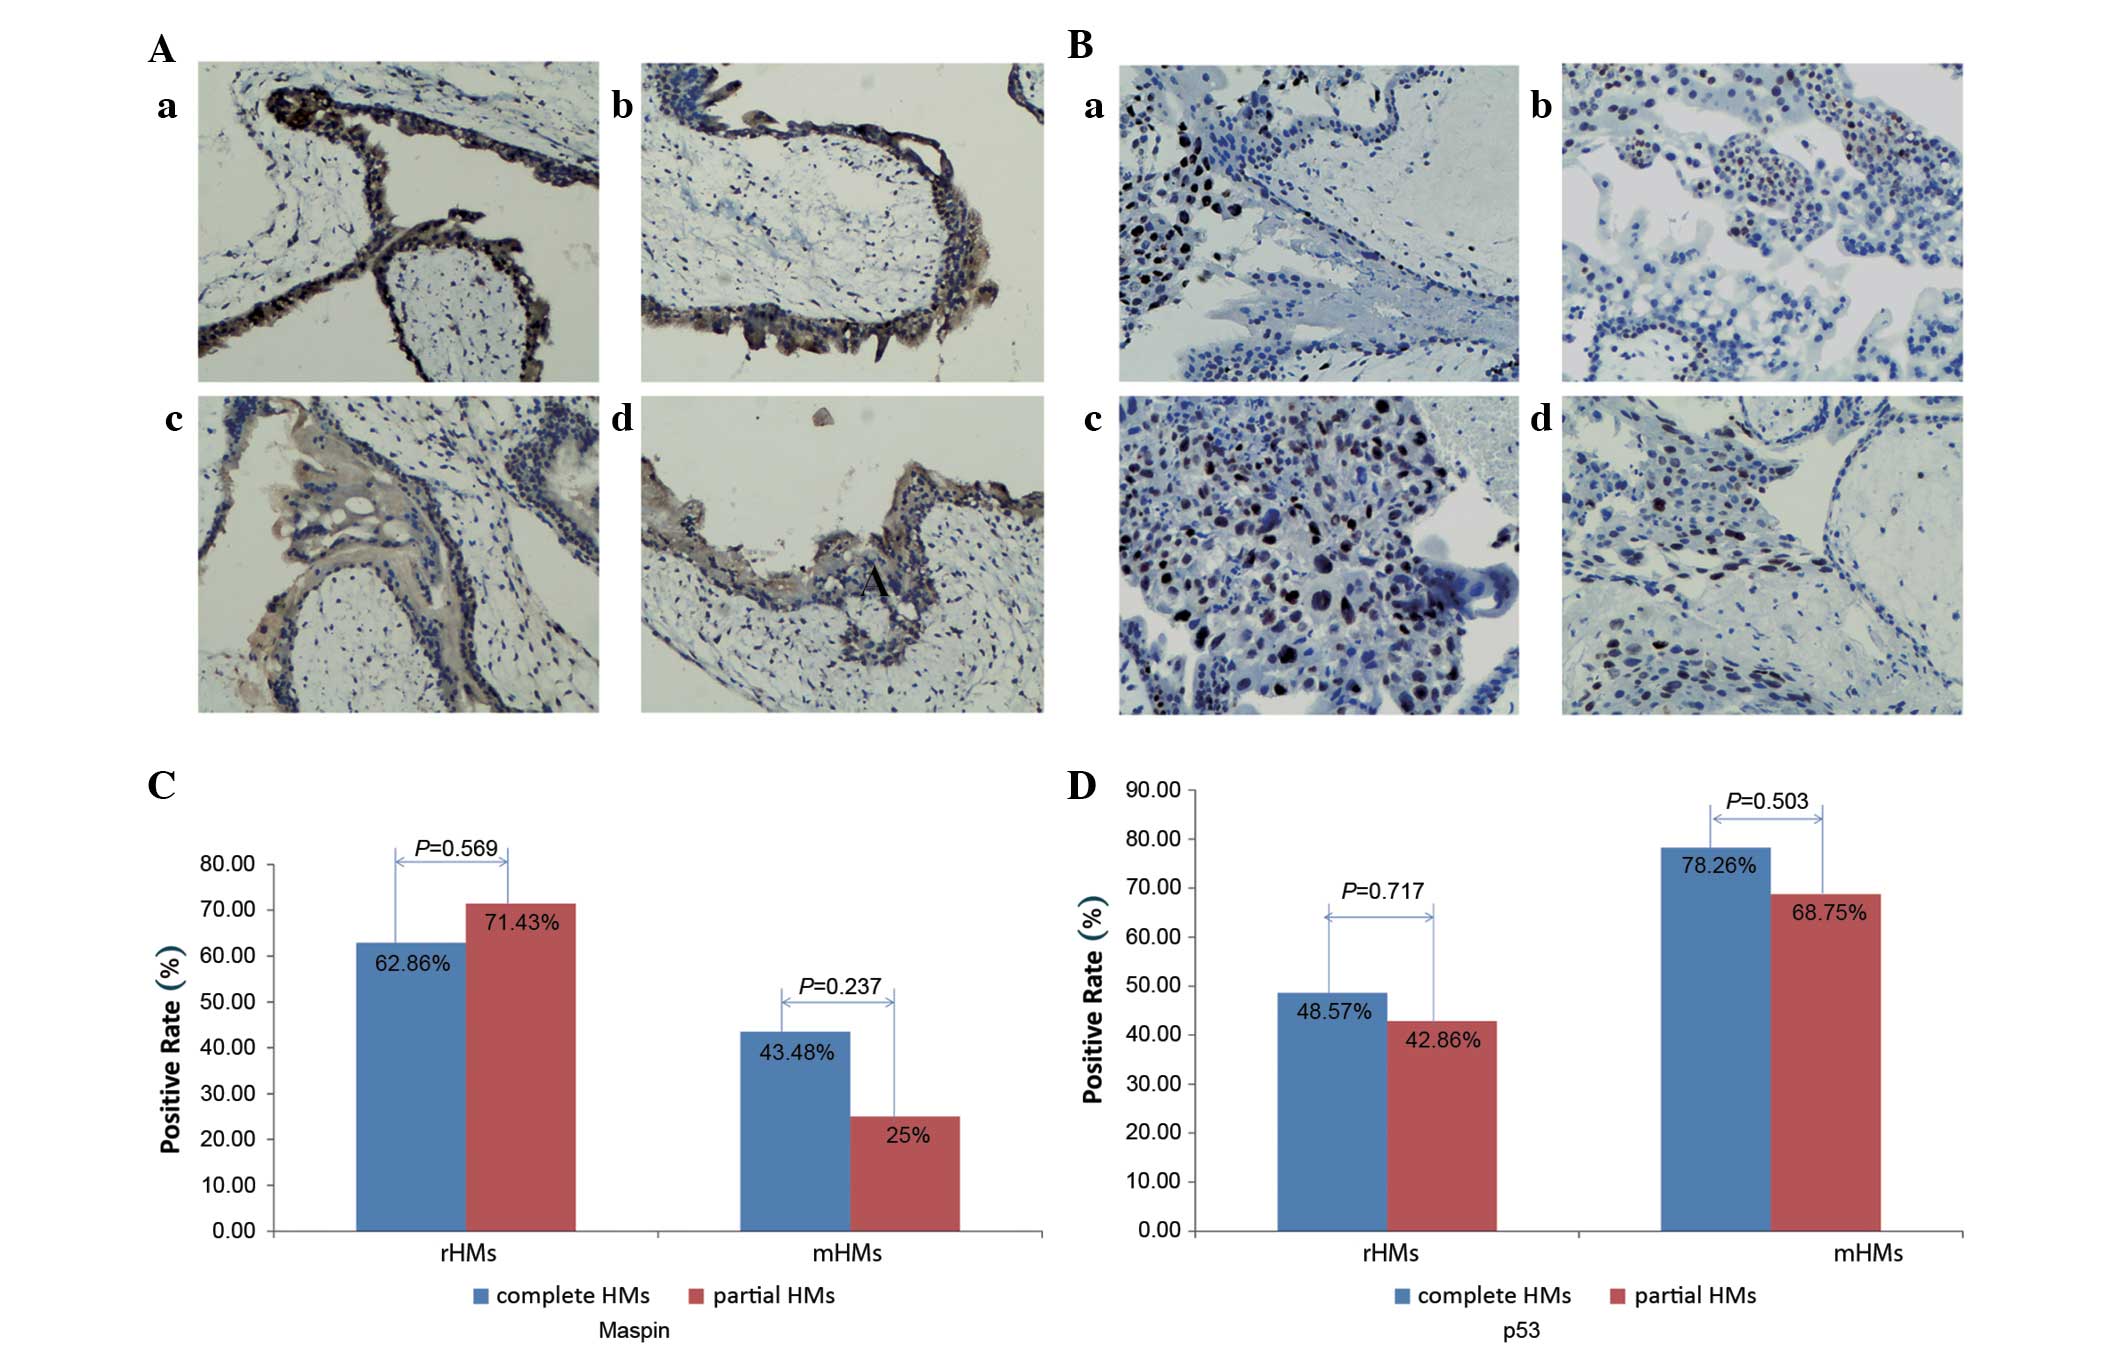 | Figure 3.Expression of maspin and m-p53 in
complete and partial HMs. (A) Expression of maspin in complete and
partial HMs: (a) Partial rHMs; (b) complete rHMs; (c) partial mHMs;
(d) complete mHMs. (B) Expression of m-p53 in complete and partial
HMs: (a) Partial rHMs; (b) complete rHMs; (c) partial mHMs; (d)
complete mHMs. No significant difference was observed in maspin or
m-p53 expression between complete and partial moles in rHMs and
mHMs. (C) In rHMs and mHMs, no significant difference was
identified in the expression of maspin between complete and partial
HMs. (D) In rHMs and mHMs, no significant difference was identified
in the expression of m-p53 between complete and partial HMs.
Following staining with the 3,3′-diaminobenzidine system, a yellow
to dark brown color for maspin expression was observed in the
cytoplasm of cells, while staining was observed in the nucleus of
cells for m-p53 staining. Magnification, ×100. M-p53, mutant tumor
protein 53; HM, hydatidiform mole; rHMs, regressive HMs; mHMs,
malignant HMs. |
Association between the expression of
maspin and m-p53 and clinical risk factors
Among the 88 cases of HMs, 39 developed into GTN
within the 2-year follow-up period. The present study analyzed the
association between the risk factors of HM and the expression of
maspin and m-p53 (Table II). The
expression of maspin was not associated with age. By contrast, it
was significantly decreased in the serum β-hCG >1×10⁶
mIU/ml group vs. the ≤106 group (χ2=15.88;
P<0.001), the large-for-date uterine size group vs. the smaller
group (χ2=13.00; P<0.001), and the ovarian
theca-lutein cysts >6 cm group vs. the ≤6 cm group
(χ2=7.57; P=0.006). Similarly, the expression of m-p53
did not differ between age groups. However, there was an observed
increase in the expression of m-p53 in patients with serum β-hCG
levels >1×10⁶ mIU/ml (χ2=7.65; P=0.006),
large-for-date uterine size (χ2=5.14; P=0.023) and
ovarian theca-lutein cysts >6 cm (χ2=6.29;
P=0.012).
| Table II.Expression of maspin and m-p53 in
hydatidiform moles with respect to different clinical risk factors
(n=88). |
Table II.
Expression of maspin and m-p53 in
hydatidiform moles with respect to different clinical risk factors
(n=88).
|
|
| Maspin(+) | m-p53(+) |
|---|
|
|
|
|
|
|---|
| Variable | Total patients,
n | rHMs, n | mHMs, n | P-value | rHMs, n | mHMs, n | P-value |
|---|
| Total patients | 88 | 32 | 14 |
| 23 | 29 |
|
| Age, years |
|
|
|
>0.05a |
|
|
>0.05a |
|
≤40 | 63 | 25 | 8 | 0.004b | 17 | 17 | 0.128b |
|
>40 | 25 | 7 | 6 | 0.693b | 6 | 12 | 0.030b |
|
P-valuec |
| 0.559 | 0.482 |
| 0.807 | 0.120 |
|
| β-hCG level
mIU/ml |
|
|
| 0.006a |
|
|
<0.001a |
|
≤106 | 36 | 20 | 8 | 0.678b | 10 | 5 | 1.000b |
|
>106 | 52 | 12 | 6 | 0.031b | 13 | 24 | 0.012b |
|
P-valuec |
| 0.027 | 0.007 |
| 0.321 | 0.017 |
| Uterine size |
|
|
|
<0.001a |
|
| 0.023a |
| ≤ for
date | 34 | 17 | 9 | 1.000b | 9 | 6 | 0.475b |
| >
for date | 54 | 15 | 5 | 0.002b | 14 | 23 | 0.025b |
|
P-valuec |
| 0.234 | <0.001 |
| 0.303 | 0.109 |
|
| Theca-lutein
cysts |
|
|
| 0.006a |
|
| 0.012a |
| ≤6
cm | 46 | 21 | 9 | 0.181b | 11 | 11 | 0.079b |
| >6
cm | 42 | 11 | 5 | 0.031b | 12 | 18 | 0.118b |
|
P-valuec |
| 0.208 | 0.091 |
| 0.128 | 0.282 |
|
Expression of maspin and m-p53 in
HMs
Of 88 HMs, 24 cases were positive for the expression
of maspin and negative for the expression of m-p53, 30 cases were
negative for the expression of maspin and positive for the
expression of m-p53, 22 cases were positive for the expression of
both maspin and m-p53, and 12 cases were negative for the
expression of both maspin and m-p53. Spearman's rank correlation
analysis revealed a significant inverse correlation between the
expression of maspin and m-p53 (r=−0.240; P=0.005). Maspin was
inversely correlated with serum β-hCG levels (r=−0.425;
P<0.001), uterine size (r=−0.384; P=0.001) and diameter of
theca-lutein cysts (r=−0.271; P=0.011). By contrast, the expression
of m-p53 was revealed to have a significant positive correlation
with serum β-hCG levels (r=0.425; P=0.005), uterine size (r=0.242;
P=0.023) and diameter of theca-lutein cysts (r=0.172; P=0.024;
Table III).
| Table III.Correlations between the expression
of maspin or m-p53 and different clinical high-risk factors in
patients with hydatidiform moles (n=88). |
Table III.
Correlations between the expression
of maspin or m-p53 and different clinical high-risk factors in
patients with hydatidiform moles (n=88).
| Marker | Maspin | m-p53 | Age | β-hCG | Uterine size | Theca-lutein
cysts |
|---|
| Maspin |
|
|
r-value | – | −0.240 | −0.024 | −0.425 | −0.384 | −0.271 |
|
P-value | – | 0.005 | 0.797 | <0.001 | 0.001 | 0.011 |
| m-p53 |
|
|
r-value | −0.240 | – | 0.146 | 0.425 | 0.242 | 0.172 |
|
P-value | 0.005 | – | 0.174 | 0.005 | 0.023 | 0.024 |
Expression of maspin and m-p53 in
GTNs
Maspin and m-p53 expression was analyzed in 50 cases
of GTN, including 39 HMs and 11 IM/CCAs. Maspin expression was
significantly higher in the low-risk group compared with the
high-risk group (37.8% in patients with FIGO scores <7, vs. 7.7%
in patients with scores ≥7; P=0.041). m-p53 expression was
significantly higher in advanced stages compared with early stages
(87.9% in FIGO stage III and IV vs. 58.8% in stage I and II;
P=0.019; Table IV).
| Table IV.Expression of maspin and p53 in
gestational trophoblastic neoplasia (n=50a). |
Table IV.
Expression of maspin and p53 in
gestational trophoblastic neoplasia (n=50a).
|
|
| Maspin(+) | p53(+) |
|---|
|
|
|
|
|
|---|
| Prognostic
factor | All patients,
n | n | % | P-value | n | % |
P-valueb |
|---|
| FIGO stage |
|
|
| 0.059 |
|
| 0.019 |
|
≤II | 17 | 8 | 47.1 |
| 10 | 58.8 |
|
|
≥III | 33 | 7 | 21.2 |
| 29 | 87.9 |
|
| FIGO score |
|
|
| 0.041 |
|
| 0.148 |
|
<7 | 37 | 14 | 37.8 |
| 27 | 73.0 |
|
| ≥7 | 13 | 1 | 7.7 |
| 12 | 92.3 |
|
Prognostic value of the expression of
maspin and m-p53 in the development of GTNs
Logistic regression analysis demonstrated that the
expression of maspin in HMs was associated with a lower risk of
developing GTNs (Table V; odds ratio
(OR)=0.305; P=0.011), whereas m-p53 expression was associated with
a greater risk of developing GTNs (OR=3.189; P=0.017). Of the
classic prognostic factors for the development of HMs into GTNs,
such as age (>40 or <20 years), high serum β-hCG levels,
larger uterine size and bigger theca-lutein cysts, only age and
serum β-hCG levels demonstrated significance, and therefore were
used in the regression model.
| Table V.Regression analysis of expression of
maspin and p53 in development of gestational trophoblastic
neoplasia (n=88). |
Table V.
Regression analysis of expression of
maspin and p53 in development of gestational trophoblastic
neoplasia (n=88).
| Variable | β value | Standard error | Wald | df | Odds ratio | 95% CI | P-value |
|---|
| Maspina | −1.187 | 0.466 | 6.494 | 1 | 0.305 | 0.123–0.760 | 0.011 |
| p53a |
1.160 | 0.484 | 5.742 | 1 | 3.189 | 1.235–8.234 | 0.017 |
| Ageb |
0.012 | 0.005 | 2.201 | 1 | – | – | 0.030 |
| β-hCGb |
2.734×10⁻⁷ |
1.196×10⁻⁷ | 2.286 | 1 | – | – | 0.026 |
| Uterine
sizea | – | – | – | 1 | – | – | 0.738c |
| Cyst diameter >6
cma | – | – | – | 1 | – | – | 0.829c |
As demonstrated by the regression
model, maspin and m-p53 expression predict the risks of developing
GTN (Table VI)
Absence of maspin expression had a 74.10%
sensitivity and 65.31% specificity, whereas the presence of m-p53
expression had a 74.36% sensitivity and 53.06% specificity in
predicting the development of GTN. Patients that were both negative
for maspin and positive for m-p53 had the highest risk of
developing GTN, with a specificity of 83.67%, a positive predictive
value of 75.68% and a negative predictive value of 70.21%.
Discussion
Worldwide, HMs occur in 0.5–3.8 per 1,000
pregnancies, with Asian populations experiencing a higher incidence
of GTD compared with Western populations (2–5).
Approximately 8–30% of HMs may develop into a malignant disease
(5–6).
At present, serial serum β-HCG levels are the standard in
predicting the development of GTN. However, in addition to being
time consuming and inconvenient, the diagnosis is typically delayed
when using this method (6,11). Although the majority of GTNs are
curable, ~25% of GTNs develop resistance to chemotherapy or relapse
following completion of initial therapy (6,7,11). At present, there is a relative lack of
predictive markers for GTN. Novel markers include telomerase
activity, apoptotic activity and expression of Siglec-6, all of
which have been associated with the development of GTN from HMs
(20–22); however, these correlations have yet to
be conclusively demonstrated.
Maspin is a tumor suppressor that has been
demonstrated to inhibit trophoblastic invasion (11–13,23). The
present study was conducted to investigate the hypothesis that HMs
with downregulated maspin expression may have a higher invasive
potential and a higher propensity for developing GTN. The p53 gene
was another good candidate due to its correlation with maspin
expression (14) and its expression
in cytotrophoblasts (24). Whether
these results regarding maspin and p53 have potential clinical
applications in terms of prognostic value requires further
investigation.
As demonstrated by immunohistochemistry, maspin was
expressed in the cytoplasm and nucleus, but mostly in the cytoplasm
of trophoblastic cells, with greater expression in cytotrophoblasts
than in syncytiotrophoblasts. However, Li et al (23) reported expression of maspin in the
nuclei of GTDs. The results of the present study were concordant
with those of several previous studies conducted on mammary,
prostate, larynx, hair follicle and colon epithelial cells
(11,25). Bai et al (26) also reported maspin expression
predominantly in the cytoplasm of trophoblastic cells. The various
subcellular locations of maspin may be indicative of its numerous
functions (11). To date, the most
notable intracellular and extracellular biological functions of
maspin have included promoting cell adhesion and apoptosis, and
inhibiting cell motility, invasion and angiogenesis (11,25,27,28).
In the current study, it was speculated that the cytoplasmic
expression of maspin in normal or benign tissues and the nuclear
expression of maspin in malignant tissues was associated with tumor
inhibition and good prognosis.
Maspin expression levels decreased gradually from
normal first-trimester placenta to rHMs, mHMs and IM/CCAs, whereas
the expression of m-p53 increased. In addition, GTNs exhibited
significantly lower expression levels of maspin and higher
expression levels of m-p53 than rHMs. The results of the present
study also indicated that the expression of maspin was inversely
correlated with the expression of m-p53 in HMs, which was similar
to the results reported for gastric cancer (29,30).
Furthermore, the expression of maspin was inversely correlated, and
that of m-p53 positively correlated, with a number of prognostic
factors, including serum β-hCG levels, uterine size and diameter of
theca-lutein cysts; however, age was not found to be associated. In
GTNs, expression of maspin was associated with a lower FIGO
prognostic score, whereas expression of m-p53 was associated with
an advanced FIGO stage. Overall, HMs with negative expression of
maspin and positive expression of m-p53 were strongly associated
with poor prognosis and a high risk of developing GTNs.
In conclusion, although the current study was small
and the data requires further validation, these results demonstrate
for the first time that there is downregulation of maspin and
upregulation of m-p53 expression in GTDs, particularly in those
that develop GTN. The pathogenesis and prognostic roles of maspin
and m-p53 in GTD are implied, and warrant further studies to reveal
the underlying mechanisms and potential clinical applications.
Acknowledgements
The authors would like to thank Dr Yi Chen and Dr
Ruilian Chen (Department of Obstetrics and Gynecology, Putian
University Affiliated Hospital, Putian, China) for their assistance
in providing specimens. The authors would also like to thank
Professor Alex Ferenczy and Mr. James Mclean (Department of
Pathology, Mcgill University, Montréal, Canada) for their help in
reviewing this article, and for their recommendations.
References
|
1
|
Savage P, Williams J, Wong SL, Short D,
Casalboni S, Catalano K and Seckl M: The demographics of molar
pregnancies in England and Wales from 2000–2009. J Reprod Med.
55:341–345. 2010.PubMed/NCBI
|
|
2
|
Grimes DA: Epidemiology of gestational
trophoblastic disease. Am J Obstet Gynecol. 150:309–318. 1984.
View Article : Google Scholar : PubMed/NCBI
|
|
3
|
Bracken MB, Brinton LA and Hayashi K:
Epidemiology of hydatidiform mole and choriocarcinoma. Epidemiol
Rev. 6:52–75. 1984.PubMed/NCBI
|
|
4
|
Bracken MB: Incidence and aetiology of
hydatidiform mole: An epidemiological review. Br J Obstet Gynaecol.
94:1123–1135. 1987. View Article : Google Scholar : PubMed/NCBI
|
|
5
|
Shi YF, Li JQ, Zheng W, Chen XJ, Qiao YH,
Hao M, Zhou CW, Hu YL, Wan GM, Sha YC and Zheng X: Survey of
gestational trophoblastic disease incidence among 3.6 million
pregnancies in China. Zhonghua Fu Chan Ke Za Zhi. 40:76–78.
2005.(In Chinese). PubMed/NCBI
|
|
6
|
Ngu SF and Chan KK: Management of
Chemoresistant and quiescent gestational trophoblastic disease.
Curr Obstet Gynecol Rep. 3:84–90. 2014. View Article : Google Scholar : PubMed/NCBI
|
|
7
|
Powles T, Savage PM, Stebbing J, Short D,
Young A, Bower M, Pappin C, Schmid P and Seckl MJ: A comparison of
patients with relapsed and chemo-refractory gestational
trophoblastic neoplasia. Br J Cancer. 96:732–737. 2007. View Article : Google Scholar : PubMed/NCBI
|
|
8
|
Ie M Shih: Gestational trophoblastic
neoplasia-pathogenesis and potential therapeutic targets. Lancet
Oncol. 8:642–650. 2007. View Article : Google Scholar : PubMed/NCBI
|
|
9
|
Nguyen NM and Slim R: Genetics and
epigenetics of recurrent Hydatidiform moles: Basic science and
genetic counselling. Curr Obstet Gynecol Rep. 3:55–64. 2014.
View Article : Google Scholar : PubMed/NCBI
|
|
10
|
Zou Z, Anisowicz A, Hendrix MJ, Thor A,
Neveu M, Sheng S, Rafidi K, Seftor E and Sager R: Maspin, a serpin
with tumor-suppressing activity in human mammary epithelial cells.
Science. 263:526–529. 1994. View Article : Google Scholar : PubMed/NCBI
|
|
11
|
Khalkhali-Ellis Z: Maspin: The new
frontier. Clin Cancer Res. 12:7279–7283. 2006. View Article : Google Scholar : PubMed/NCBI
|
|
12
|
Kaplun A, Dzinic S, Bernardo M and Sheng
S: Tumor suppressor maspin as a rheostat in HDAC regulation to
achieve the fine-tuning of epithelial homeostasis. Crit Rev
Eukaryot Gene Expr. 22:249–258. 2012. View Article : Google Scholar : PubMed/NCBI
|
|
13
|
Bodenstine TM, Seftor RE, Khalkhali-Ellis
Z, Seftor EA, Pemberton PA and Hendrix MJ: Maspin: Molecular
mechanisms and therapeutic implications. Cancer Metastasis Rev.
31:529–551. 2012. View Article : Google Scholar : PubMed/NCBI
|
|
14
|
Choy B, Findeis-Hosey JJ, Li F, McMahon
LA, Yang Q and Xu H: High frequency of coexpression of maspin with
p63 and p53 in squamous cell carcinoma but not in adenocarcinoma of
the lung. Int J Clin Exp Pathol. 6:2542–2547. 2013.PubMed/NCBI
|
|
15
|
Secord A Alvarez, Darcy KM, Hutson A,
Huang Z, Lee PS, Jewell EL, Havrilesky LJ, Markman M, Muggia F and
Murphy SK: The regulation of MASPIN expression in epithelial
ovarian cancer: Association with p53 status, and MASPIN promoter
methylation: A gynecologic oncology group study. Gynecol Oncol.
123:314–319. 2011. View Article : Google Scholar : PubMed/NCBI
|
|
16
|
Wang SE, Narasanna A, Whitell CW, Wu FY,
Friedman DB and Arteaga CL: Convergence of p53 and transforming
growth factor beta (TGFbeta) signaling on activating expression of
the tumor suppressor gene maspin in mammary epithelial cells. J
Biol Chem. 282:5661–5669. 2007. View Article : Google Scholar : PubMed/NCBI
|
|
17
|
Ngan HY, Bender H, Benedet JL, Jones H,
Montruccoli GC and Pecorelli S: FIGO Committee on Gynecologic
Oncology. Gestational trophoblastic neoplasia, FIGO 2000 staging
and classification. Int J Gynaecol Obstet. 83(Suppl 1): S175–S177.
2003.
|
|
18
|
Chan HY, Siu MK, Zhang HJ, Wong ES, Ngan
HY, Chan KY and Cheung AN: Activated Stat3 expression in
gestational trophoblastic disease: Correlation with
clinicopathological parameters and apoptotic indices.
Histopathology. 53:139–146. 2008. View Article : Google Scholar : PubMed/NCBI
|
|
19
|
Zhang HJ, Xue WC, Siu MK, Liao XY, Ngan HY
and Cheung AN: P63 expression in gestational trophoblastic disease:
Correlation with proliferation and apoptotic dynamics. Int J
Gynecol Pathol. 28:172–178. 2009. View Article : Google Scholar : PubMed/NCBI
|
|
20
|
Chen RJ, Chu CT, Huang SC, Chow SN and
Hsieh CY: Telomerase activity in gestational trophoblastic disease
and placental tissue from early and late human pregnancies. Hum
Reprod. 17:463–468. 2002. View Article : Google Scholar : PubMed/NCBI
|
|
21
|
Chiu PM, Ngan YS, Khoo US and Cheung AN:
Apoptotic activity in gestational trophoblastic disease correlates
with clinical outcome: Assessment by the caspase-related M30
CytoDeath antibody. Histopathology. 38:243–249. 2001. View Article : Google Scholar : PubMed/NCBI
|
|
22
|
Rumer KK, Post MD, Larivee RS, Zink M,
Uyenishi J, Kramer A, Teoh D, Bogart K and Winn VD: Siglec-6 is
expressed in gestational trophoblastic disease and affects
proliferation, apoptosis and invasion. Endocr Relat Cancer.
19:827–840. 2012. View Article : Google Scholar : PubMed/NCBI
|
|
23
|
Li HW, Leung SW, Cheung AN, Yu MM, Chan LK
and Wong YF: Expression of maspin in gestational trophoblastic
disease. Gynecol Oncol. 101:76–81. 2006. View Article : Google Scholar : PubMed/NCBI
|
|
24
|
Cheung AN, Shen DH, Khoo US, Chiu MP, Tin
VP, Chung LP and Ngan HY: Immunohistochemical and mutational
analysis of p53 tumor suppressor gene in gestational trophoblastic
disease: Correlation with mdm2, proliferation index, and
clinicopathologic parameters. Int J Gynecol Cancer. 9:123–130.
1999. View Article : Google Scholar : PubMed/NCBI
|
|
25
|
Marioni G, Zanoletti E, Stritoni P,
Lionello M, Giacomelli L, Gianatti A, Cattaneo L, Blandamura S,
Mazzoni A and Martini A: Expression of the tumour-suppressor maspin
in temporal bone carcinoma. Histopathology. 63:242–249. 2013.
View Article : Google Scholar : PubMed/NCBI
|
|
26
|
Bai SS, Pang YC and LM T: HZ. The effect
of Maspin on malignant transformation of hydatidiform mole. Chin J
Family Planning & Gynecotokology. 03:10–13. 2011.(In
Chinese).
|
|
27
|
Seftor RE, Seftor EA, Sheng S, Pemberton
PA, Sager R and Hendrix MJ: Maspin suppresses the invasive
phenotype of human breast carcinoma. Cancer Res. 58:5681–5685.
1998.PubMed/NCBI
|
|
28
|
Zhang M, Volpert O, Shi YH and Bouck N:
Maspin is an angiogenesis inhibitor. Nat Med. 6:196–199. 2000.
View Article : Google Scholar : PubMed/NCBI
|
|
29
|
Lee DY, Park CS, Kim HS, Kim JY, Kim YC
and Lee S: Maspin and p53 protein expression in gastric
adenocarcinoma and its clinical applications. Appl Immunohistochem
Mol Morphol. 16:13–18. 2008.PubMed/NCBI
|
|
30
|
Sedic M, Poznic M, Gehrig P, Scott M,
Schlapbach R, Hranjec M, Karminski-Zamola G, Pavelic K and Pavelic
S Kraljevic: Differential antiproliferative mechanisms of novel
derivative of benzimidazo[1,2-alpha]quinoline in colon cancer cells
depending on their p53 status. Mol Cancer Ther. 7:2121–2132. 2008.
View Article : Google Scholar : PubMed/NCBI
|