Introduction
Colorectal cancer (CRC), also known as colon cancer,
is one of the most prevalent malignancies worldwide and remains the
third leading cause of cancer-associated mortality (1). In 2014, ~65,000 women and 71,830 men
were estimated to be diagnosed with CRC (2).
Similar to the majority of other complex tumors, CRC
has been the subject of multiple studies with regards to its
pathogenesis, diagnosis and therapy. Much has been elucidated about
the molecular mechanism of CRC in recent years. It is widely
recognized that chromosomal instability is the most common genetic
abnormality to occur in CRC and has been found in almost 85% of all
CRC cases (3). Key genes involved in
this pathway include Kirsten rat sarcoma viral oncogene homolog
(KRAS), deleted in colorectal carcinoma (DCC), SMAD
family member 2 (SMAD2) and SMAD4. KRAS is a
proto-oncogene that plays a critical role in the transduction of
intracellular signals. The activation of KRAS by binding to
guanosine triphosphate could regulate downstream mediator
mitogen-activated protein kinase, which is involved in cell
division (4). Additionally,
SMAD2 and SMAD4 play a vital role in the transforming
growth factor-β signaling pathway, which in involved in the
regulation of cell proliferation, differentiation and apoptosis
(5). DCC has been shown to
correlate with metastasis and a poor prognosis in CRC (6). Moreover, chronic inflammation has been
shown to increase the incidence of bowel cancer (7). In the process of inflammation,
cyclooxygenase-2 (COX2) is a key molecule highlighted by
experiments (8). Previous studies
into the downstream effects of COX have illustrated that basic
fibroblast growth factor and vascular endothelial growth factor are
activated by COX2 via prostaglandin E2, all of which are involved
in the regulation of cell proliferation and angiogenesis
contributing to tumor development (9–11).
However, the pathogenesis of CRC is complex and multifactorial. The
complete elucidation of its etiology remains to be defined.
The present study analyzed three microarray
datasets, comparing between colon tumor samples and adjacent normal
mucosa tissue samples. Differentially-expressed genes (DEGs) were
identified and functional annotation was performed for significant
genes, followed by protein-protein interaction (PPI) network
construction. The study aimed to detect the molecular mechanisms
and associated genes in the development of CRC.
Materials and methods
Microarray data
A total of 3 microarray datasets were downloaded
from the Gene Expression Omnibus database (http://www.ncbi.nlm.nih.gov/geo/), including GSE44076
(12), GSE41328 (13) and GSE44861 (14). Expression data from GSE44076, which
included colon tumor samples from 98 patients and adjacent paired
normal mucosa tissues from 50 healthy donors, were obtained using
platform GPL13667 (Affymetrix Human Genome U219 Arrays). Microarray
data from GSE41328, which included 5 colorectal adenocarcinomas
samples and 5 matched normal colon tissue, were generated with the
[HG-U133_Plus_2] Affymetrix Human Genome U133 Plus 2.0 Array
platform. Expression data from GSE44861, which included 56 tumor
samples and 55 adjacent non-cancerous tissue samples, were obtained
through the [HT_HG-U133A] Affymetrix HT Human Genome U133A Array
platform.
Data preprocessing
Prior to analysis, probe identifications in each
dataset were converted into standard gene symbols. For genes with
more than one probe set in the array, the average value for the
probes was obtained as the expression value of the gene. By
contrast, the probe set was deleted when mapped to more than one
gene. As the genes were different in the 3 datasets, meta-analysis
was performed of these studies, pooling the microarray data across
different platforms. In the combined process, batch effects are
inevitable. To adjust the data for these batch effects, the
surrogate variable analysis package (15) was applied, and normalization was
performed using the preprocessCore package (16) in R.
Identification of DEGs in CRC
To identify significant DEGs in colon tumor samples
compared with adjacent non-cancerous controls, preprocessed data
were exported to Limma package in R language (17). An adjusted P-value was estimated using
the Benjamini & Hochberg (BH) method (18). Significant DEGs were identified as
those with |log 2 FC (fold-change)|>1 and an adjusted P-value of
<0.05.
Functional annotation of DEGs in
CRC
Testing for functional enrichment of DEGs in CRC was
performed using the Database for Annotation, Visualization, and
Integrated Discovery (DAVID) online tool (19). Categories analyzed included Gene
Ontology (GO) terms (20) and Kyoto
Encyclopedia of Genes and Genomes (KEGG) pathways (21). Data from the GO annotations was used
to construct a functional enrichment network, which was visualized
by the enrichment map plugin in Cytoscape (22). The BH correction for multiple testing
was performed with a cutoff for an adjusted P-value of
<0.05.
PPI network construction
NetBox software, which is written in the Java
language, is used to store and establishment the Human Interaction
Network based on public databases consisting of Reactome (23,24), the
Human Protein Reference Database (25), Memorial Sloan-Kettering Cancer Center
Cancer Cell Map (26) and the
National Cancer Institute-Nature Pathway Interaction Database
(27). Linker genes with statistical
significance, which are not differentially-expressed in colon
tumors, but interact with DEGs, were obtained through mapping DEGs
onto the network. Cytoscape software (28) was used to visualize the molecular
interaction. Besides the PPI network under the criteria, NetBox
also divided the network into modules. The modules with the maximum
number of nodes in the PPI network were subjected to GO terms and
Swiss-Prot and Protein Information Resource Keywords enrichment
analysis with the DAVID online tool.
Results
Preprocessed results and DEGs in
CRC
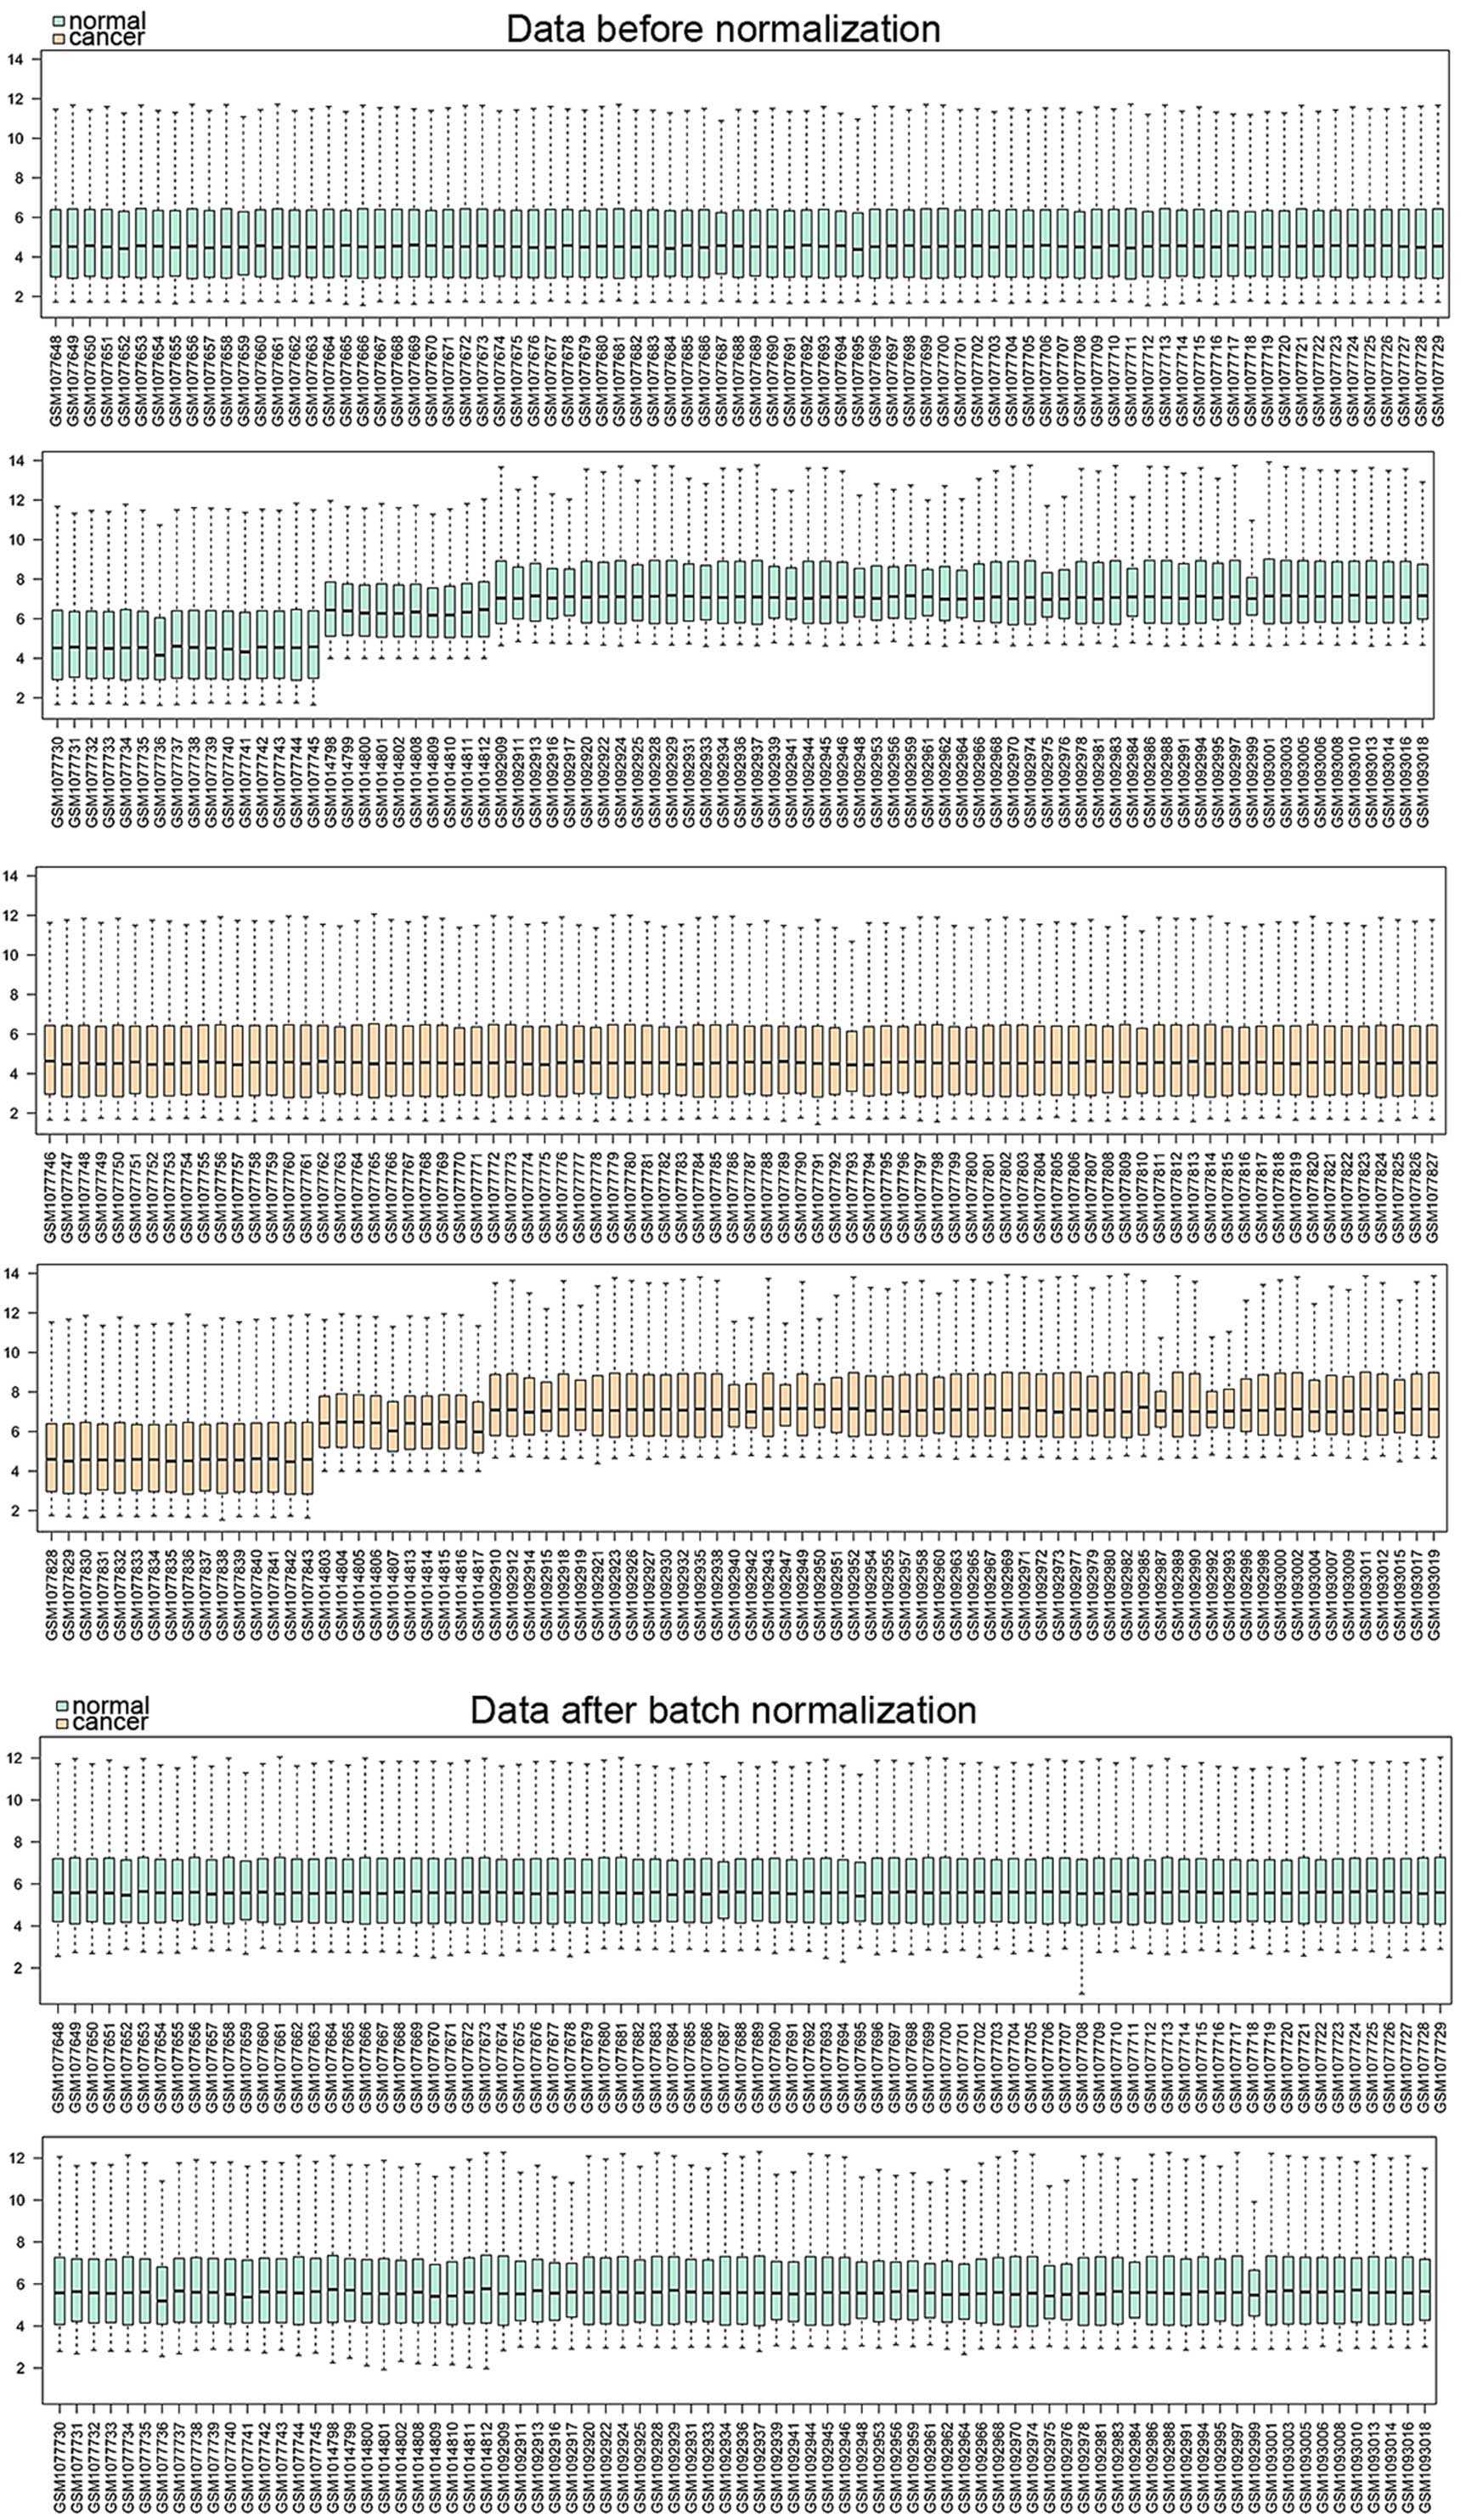
Following meta-analysis of these 3 studies to pool
microarray data across the different platforms, one dataset was
obtained that included 327 samples and 11,081 genes. The dataset
was preprocessed and normalized, followed by further analysis. The
normalized results are shown in Fig.
1. A total of 697 genes were selected as DEGs, including 286
upregulated and 411 downregulated genes, between CRC samples and
adjacent non-cancerous control.
Significant functions and pathways of
DEGs
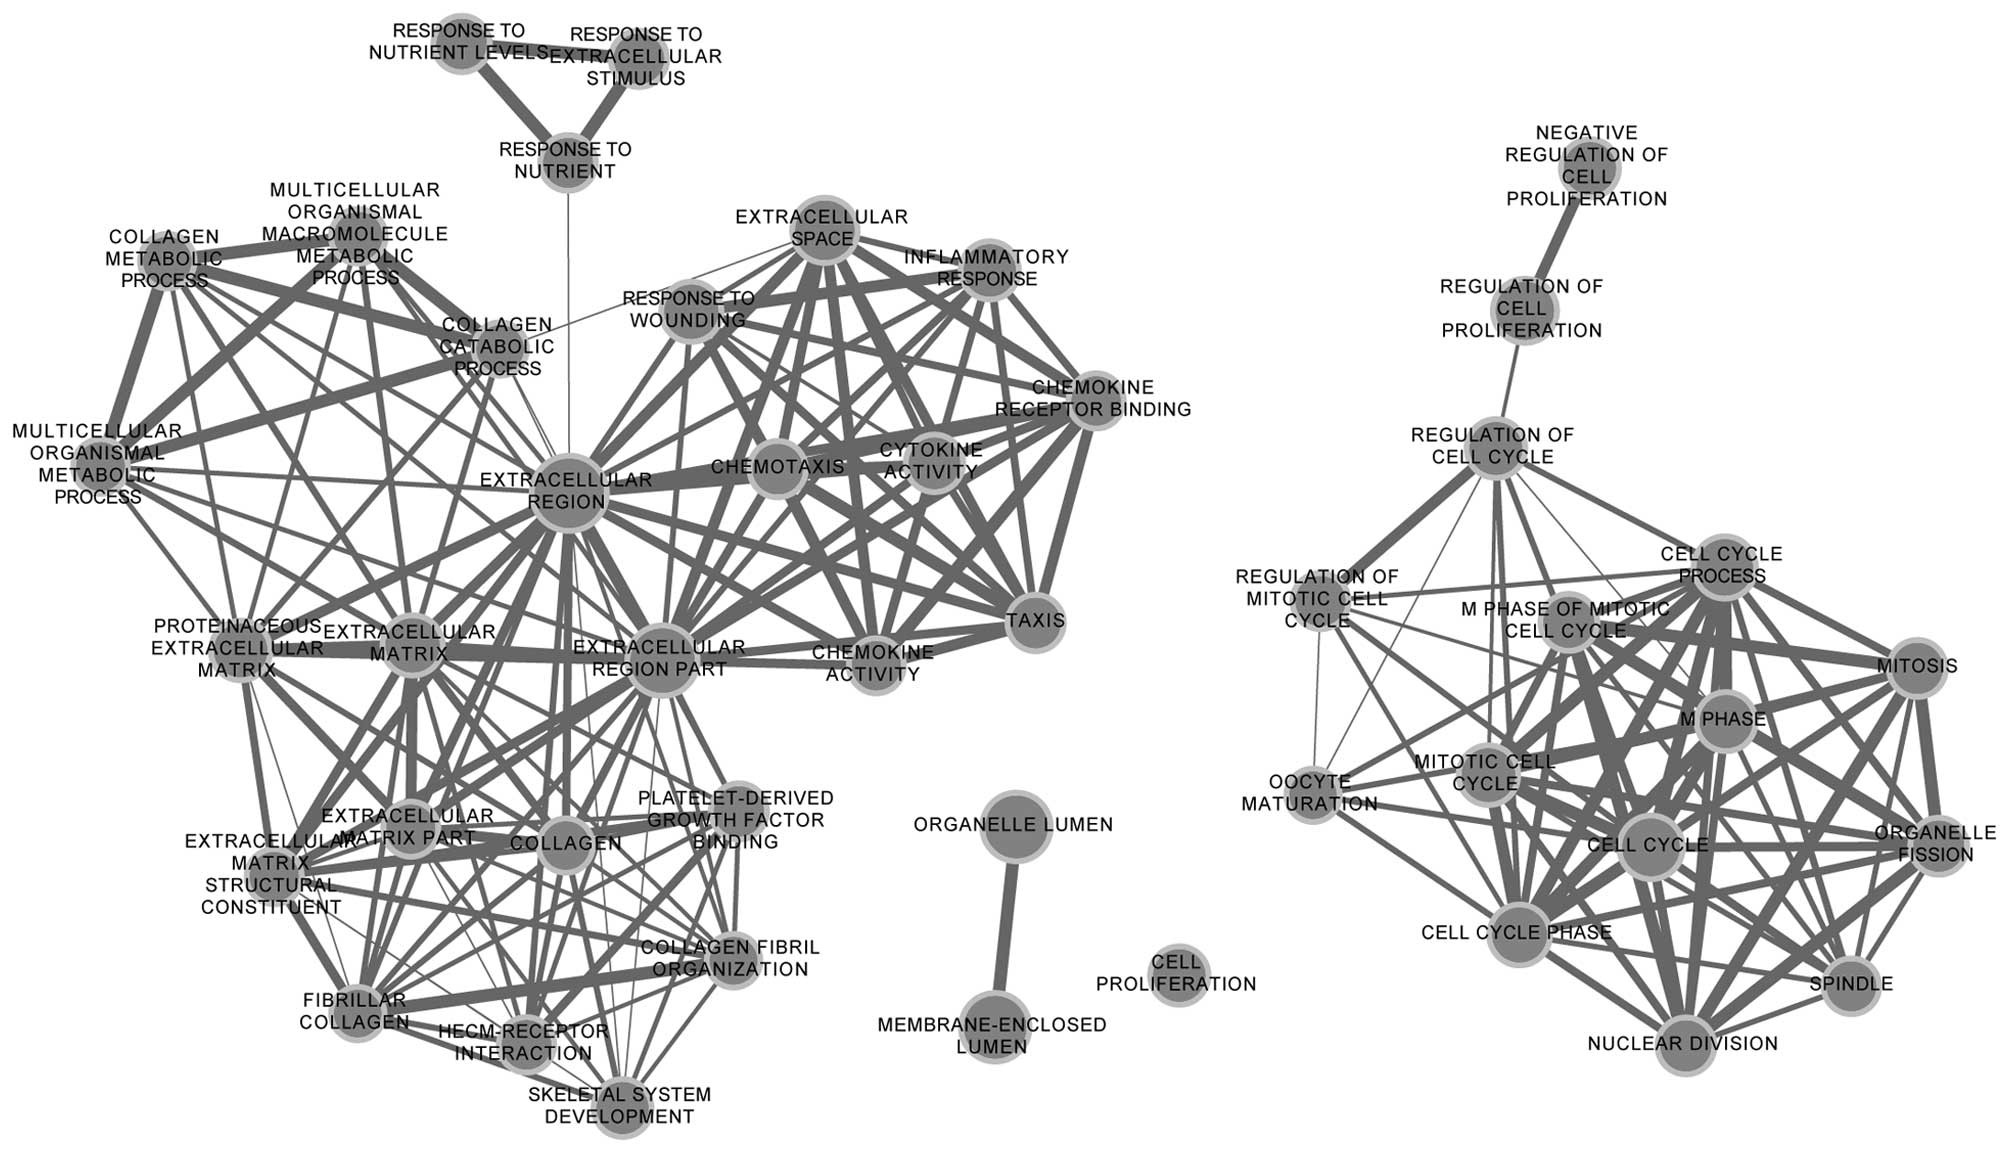
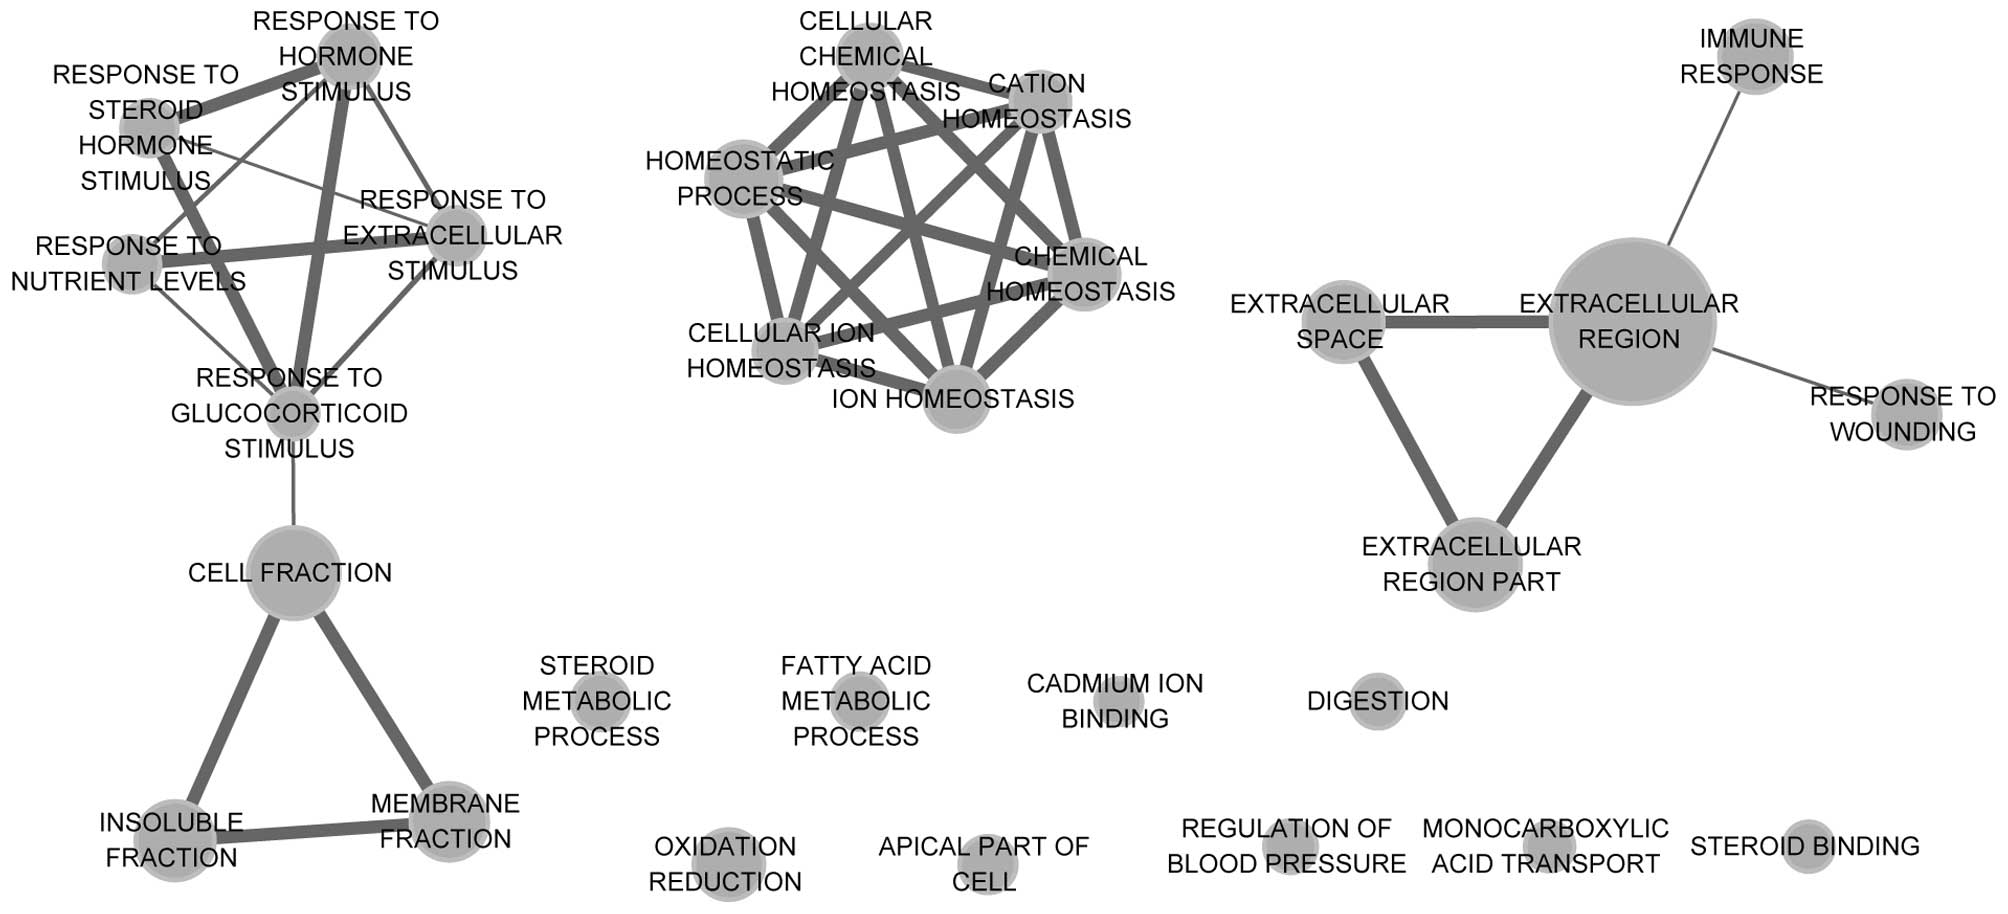
To annotate these DEGs in the tumor samples, DAVID
was used for GO function and KEGG pathway analysis, with the
threshold of the adjusted P-value at <0.05. Functional
enrichment networks of upregulated and downregulated DEGs are shown
in Figs. 2 and 3. The results showed that upregulated DEGs
were significantly enriched in cell cycle-related functions,
including the cell cycle process, the regulation of the mitotic
cell cycle and the regulation of cell proliferation. Downregulated
DEGs were mainly enriched in homeostasis-related functions,
including chemical homeostasis and cellular ion homeostasis.
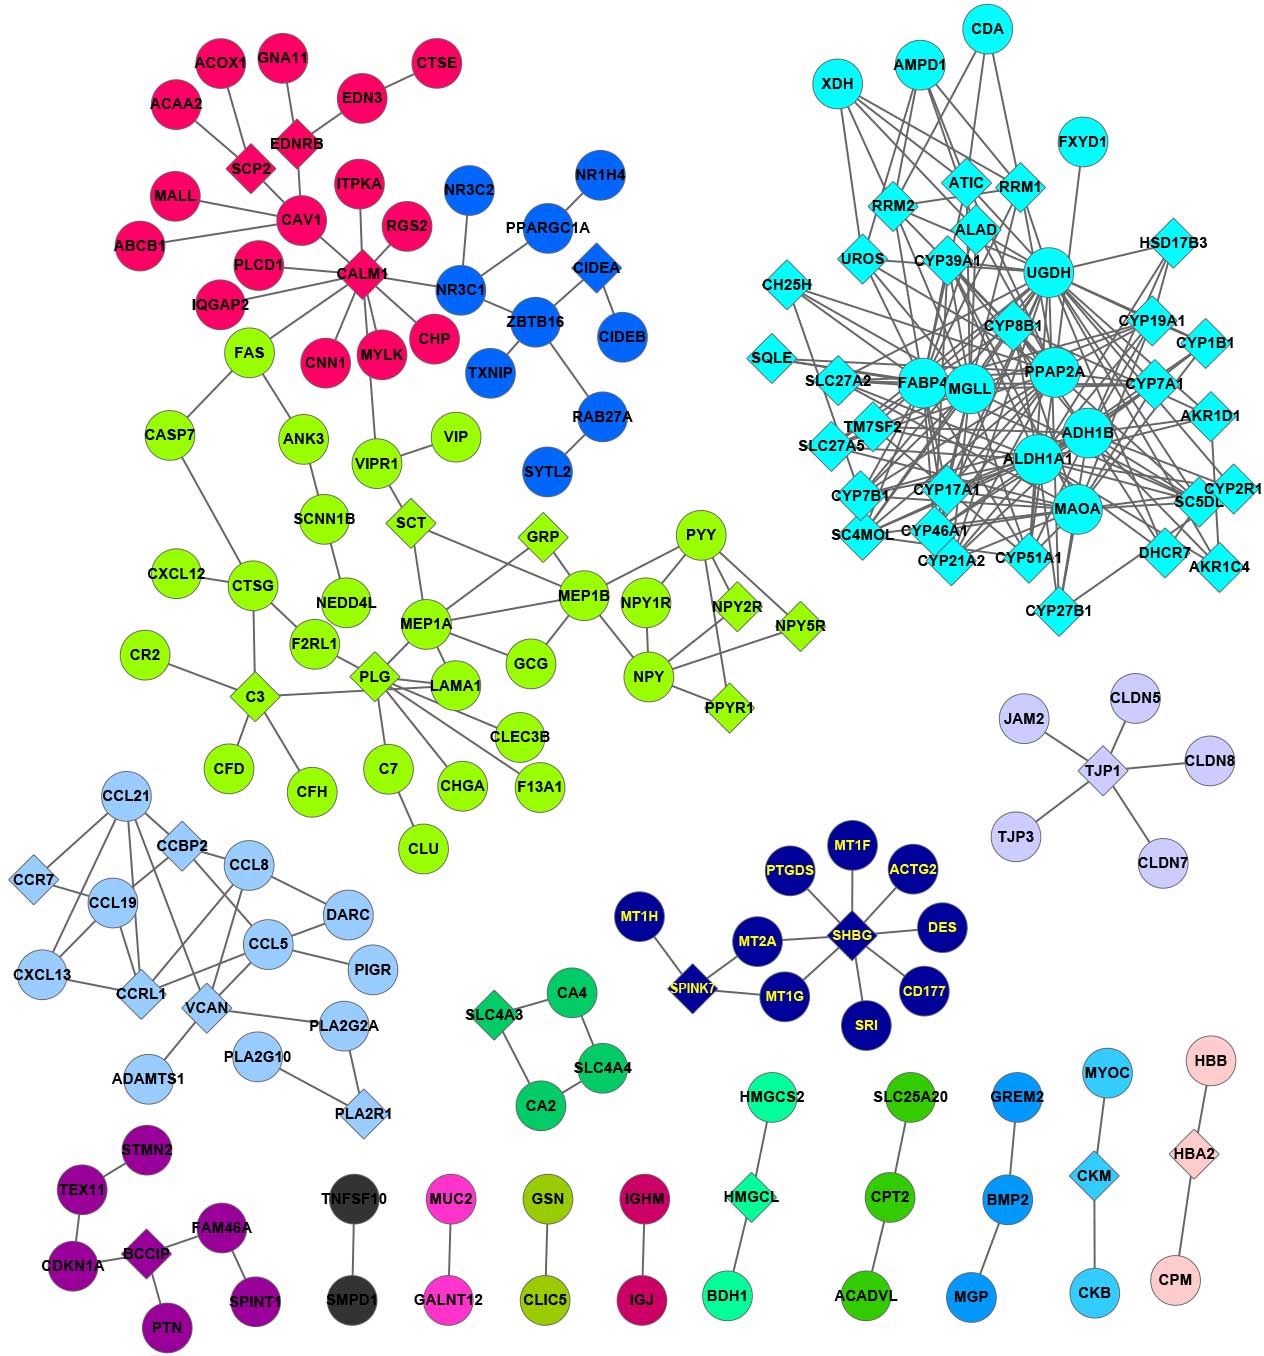
PPI network analysis
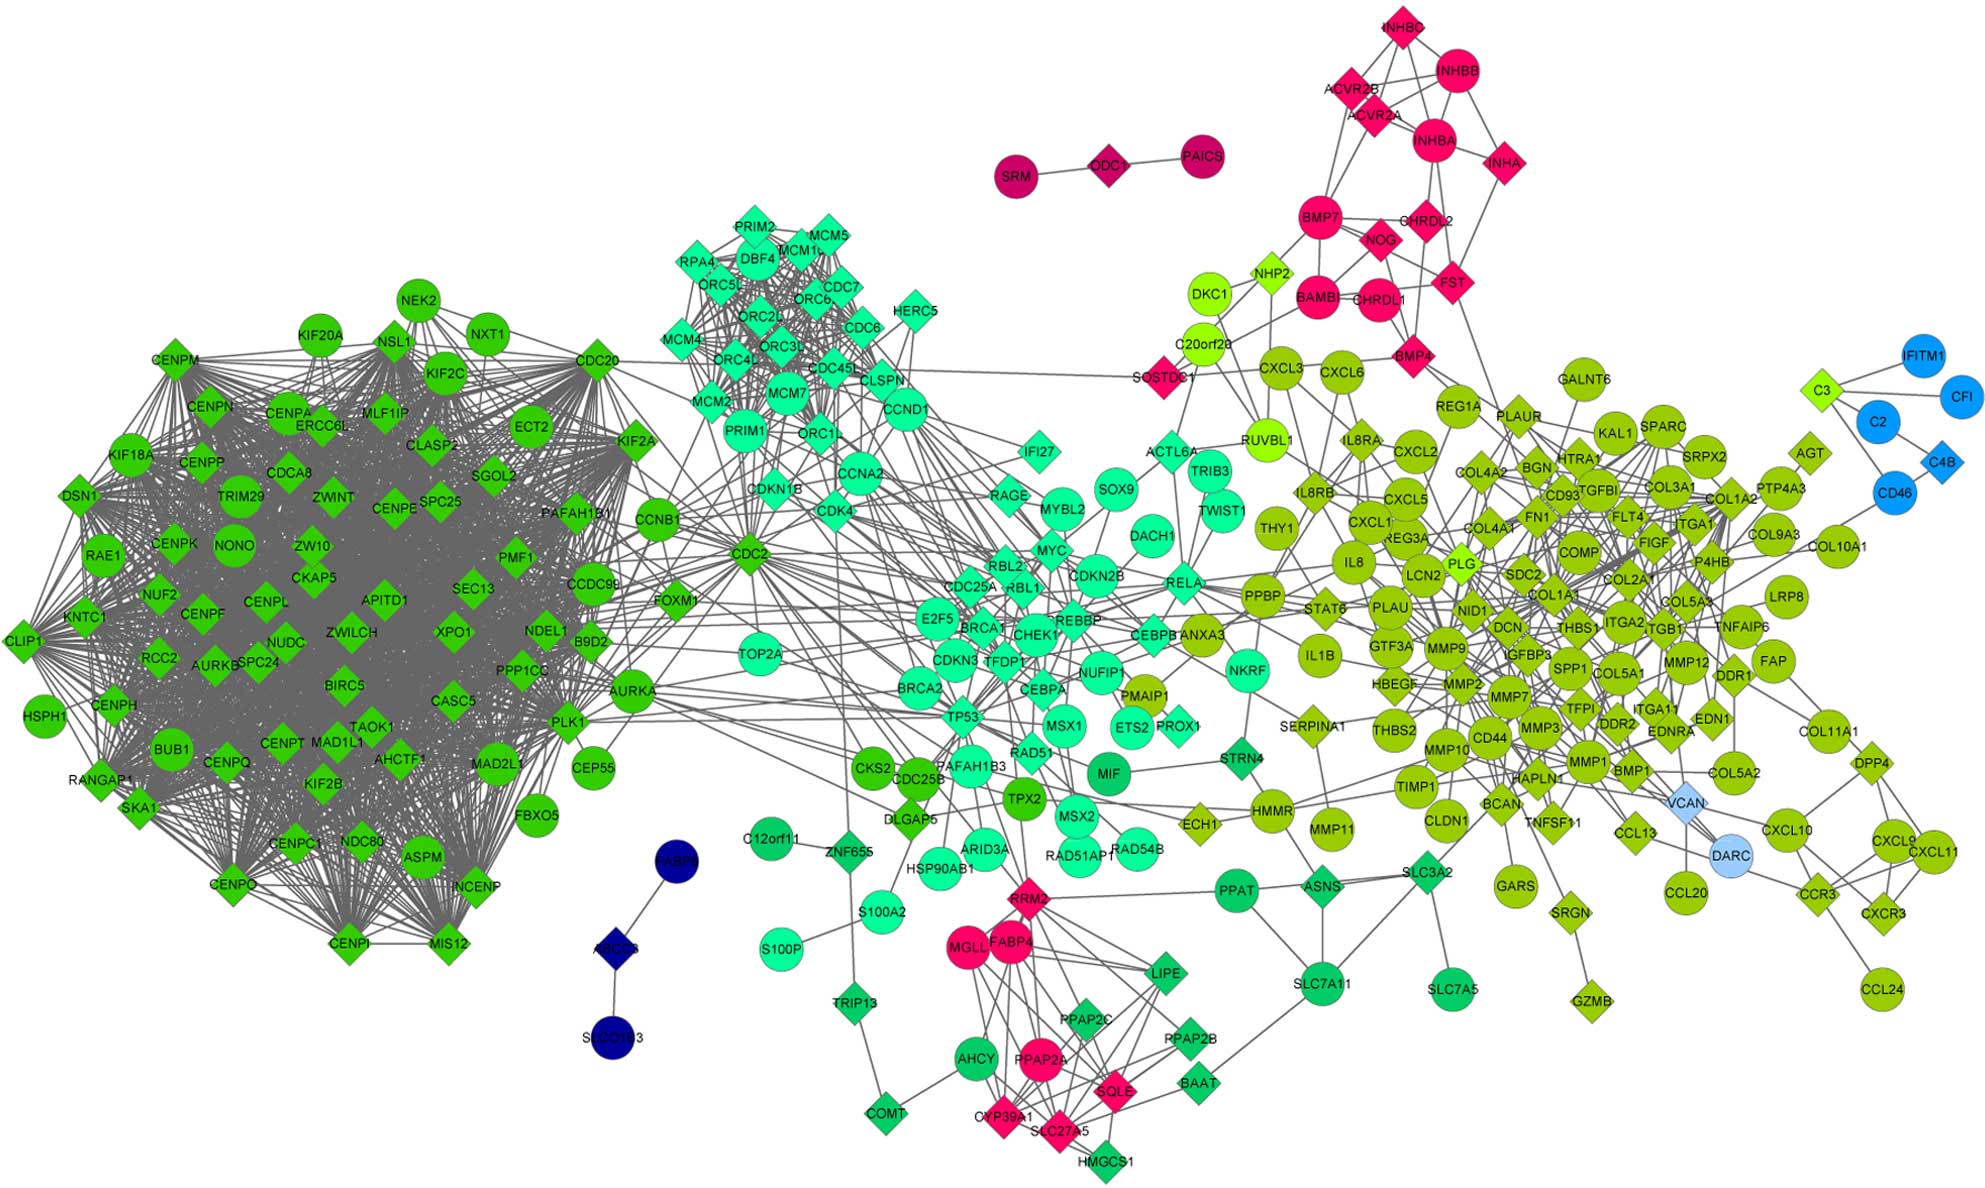
Significant DEGs and linker genes were used to
construct the PPI network (Figs. 4
and 5). In the PPI network for
upregulated DEGs (Fig. 4), there were
2,508 edges and 296 genes, including 140 DEGs and 156 linker genes.
The network was divided into 9 modules by NetBox, in which module 1
contained the maximum number of nodes. Additionally, in the PPI
network for downregulated DEGs, there were 301 edges and 165 genes,
including 113 DEGs and 42 linker genes. The network was divided
into 18 modules, in which module 5 contained the maximum number of
nodes. In the PPI network, the hub genes were mined with the
top-five degrees of connectivity in the different modules (Table I). The upregulated minichromosome
maintenance complex component 7 gene in module 0, linker genes
collagen, type I, α1 (COL1A1) and COL1A2, and
differentially-expressed matrix metallopeptidase 9 (MMP9) in
module 1, and linker genes polo-like kinase 1 and exportin 1 in
module 2 exhibited a connectivity degree of >20. Downregulated
genes UDP-glucose 6-dehydrogenase (UGDH), aldehyde
dehydrogenase 1 family, member A1 (ALDH1A1), fatty acid
binding protein 4, adipocyte (FABP4) and monoglyceride
lipase (MGLL) in module 5 exhibited a connectivity degree of
>20.
 | Table I.Connectivity degree of hub genes in
the top-five modules. |
Table I.
Connectivity degree of hub genes in
the top-five modules.
| Module no. | Hub gene | Degree |
|---|
| Upregulated gene
modules |
|
|
| 0 | MCM7 | 22 |
| 0 | TP53 | 21 |
| 0 | ORC1L | 21 |
| 0 | ORC4L | 20 |
| 0 | CDC45L | 20 |
| 1 | COL1A1 | 25 |
| 1 | COL1A2 | 20 |
| 1 | MMP9 | 20 |
| 1 | FN1 | 19 |
| 1 | ITGB1 | 18 |
| 2 | PLK1 | 71 |
| 2 | XPO1 | 68 |
| 2 | CDC20 | 66 |
| 2 | BIRC5 | 64 |
| 2 |
PAFAH1B1 | 63 |
| 4 | RRM2 | 11 |
| 4 | SLC27A5 | 9 |
| 4 | CYP39A1 | 8 |
| 4 | SQLE | 7 |
| 4 | LIPE | 6 |
| 5 | BMP7 | 7 |
| 5 | INHBA | 7 |
| 5 | BMP4 | 6 |
| 5 | INHBB | 5 |
| 5 | BAMBI | 5 |
| Downregulated gene
modules |
|
|
| 5 | UGDH | 26 |
| 5 | ALDH1A1 | 22 |
| 5 | FABP4 | 21 |
| 5 | MGLL | 21 |
| 5 | PPAP2A | 21 |
| 6 | PLG | 7 |
| 6 | MEP1A | 6 |
| 6 | MEP1B | 6 |
| 6 | C3 | 5 |
| 6 | NPY | 5 |
| 8 | SHBG | 8 |
| 8 | SPINK7 | 3 |
| 8 | MT1G | 2 |
| 8 | MT2A | 2 |
| 8 | MT1F | 1 |
| 9 | CCRL1 | 5 |
| 9 | VCAN | 5 |
| 9 | CCL5 | 5 |
| 9 | CCL21 | 5 |
| 9 | CCL19 | 4 |
| 12 | CALM1 | 11 |
| 12 | CAV1 | 5 |
| 12 | SCP2 | 3 |
| 12 | EDNRB | 3 |
| 12 | EDN3 | 2 |
The functional annotation results showed that the
DEGs in module 1 were mainly enriched in extracellular
region-related functions and extracellular matrix (ECM)-associated
functions (Table II). Downregulated
DEGs in module 5 were significantly enriched in metabolic process
and biosynthetic process-related functions (Table III).
| Table II.Functional annotation of genes in
module 1. |
Table II.
Functional annotation of genes in
module 1.
| Category | Term | Count | Bonferroni |
|---|
| Annotation cluster
1 | Enrichment score:
42.348195504843254 |
|
|
|
GOTERM_CC_FAT |
GO:0044421~extracellular region part | 63 |
2.07×10−45 |
|
SP_PIR_KEYWORDS | Secreted | 65 |
8.47×10−42 |
|
GOTERM_CC_FAT |
GO:0005576~extracellular region | 71 |
2.53×10⁻³⁵ |
| Annotation Cluster
2 | Enrichment score:
41.212870504723476 |
|
|
|
SP_PIR_KEYWORDS | Signal | 80 |
6.46×10−42 |
|
UP_SEQ_FEATURE | Signal peptide | 80 |
2.31×10−41 |
|
GOTERM_CC_FAT |
GO:0005576~extracellular region | 71 |
2.53×10⁻³⁵ |
| Annotation cluster
3 | Enrichment score:
26.15393329757373 |
|
|
|
SP_PIR_KEYWORDS | Extracellular
matrix | 32 |
3.45×10⁻³³ |
|
GOTERM_CC_FAT |
GO:0031012~extracellular matrix | 35 |
8.66×10⁻²⁸ |
|
GOTERM_CC_FAT |
GO:0005578~proteinaceous extracellular
matrix | 33 |
3.76×10⁻²⁶ |
|
GOTERM_CC_FAT |
GO:0044420~extracellular matrix part | 15 |
1.57×10⁻¹¹ |
| Table III.Functional annotation of genes in
module 5. |
Table III.
Functional annotation of genes in
module 5.
| Category | Term | Count | Benjamini |
|---|
| Annotation cluster
1 | Enrichment score:
28.81018243601853 |
|
|
|
SP_PIR_KEYWORDS | Oxidoreductase | 28 |
1.58×10⁻³¹ |
|
GOTERM_BP_FAT |
GO:0055114~oxidation reduction | 28 |
2.57×10⁻²⁵ |
|
GOTERM_BP_FAT | GO:0008202~steroid
metabolic process | 21 |
5.77×10⁻²⁵ |
| Annotation cluster
2 | Enrichment score:
17.61044037865203 |
|
|
|
GOTERM_BP_FAT | GO:0008202~steroid
metabolic process | 21 |
5.77×10⁻²⁵ |
|
SP_PIR_KEYWORDS | Nadp | 14 |
3.94×10⁻¹⁷ |
|
GOTERM_BP_FAT | GO:0016125~sterol
metabolic process | 12 |
2.20×10⁻¹³ |
|
GOTERM_BP_FAT |
GO:0008203~cholesterol metabolic
process | 10 |
1.82×10⁻¹⁰ |
| Annotation cluster
3 | Enrichment score:
10.153502326316204 |
|
|
|
GOTERM_BP_FAT | GO:0006694~steroid
biosynthetic process | 15 |
5.19×10⁻²⁰ |
|
GOTERM_BP_FAT | GO:0016125~sterol
metabolic process | 12 |
2.20×10⁻¹³ |
|
GOTERM_BP_FAT | GO:0008610~lipid
biosynthetic process | 15 |
6.44×10⁻¹² |
|
SP_PIR_KEYWORDS | Steroid
biosynthesis | 8 |
1.29×10⁻¹¹ |
|
GOTERM_BP_FAT | GO:0016126~sterol
biosynthetic process | 7 |
2.68×10⁻⁸ |
|
KEGG_PATHWAY | hsa00100:steroid
biosynthesis | 7 |
1.05×10⁻⁸ |
|
SP_PIR_KEYWORDS | Sterol
biosynthesis | 6 |
1.17×10⁻⁸ |
|
SP_PIR_KEYWORDS | Lipid
synthesis | 7 |
2.69×10⁻⁷ |
|
SP_PIR_KEYWORDS | Cholesterol
biosynthesis | 3 |
2.98×10⁻³ |
|
GOTERM_BP_FAT |
GO:0006695~cholesterol biosynthetic
process | 3 |
4.89×10⁻² |
Discussion
Using a meta-analysis approach to group 3 microarray
datasets, including GSE44076, GSE41328 and GSE44861, DEGs were
identified in CRC mucosa compared with adjacent normal mucosa
samples. The results suggested that there were 697 DEGs, including
286 upregulated genes. Functional annotation results showed that
the upregulated DEGs were involved in cell cycle-related functions,
in comparison with the downregulated DEGs, which were enriched in
homeostasis-associated functions. In the PPI network, the linker
genes COL1A1 and COL1A2, and the DEGs MMP9,
UGDH, ALDH1A1, FABP4 and MGLL, which
exhibited a connectivity degree of >20, participated in the
development of CRC.
After the upregulated and downregulated networks
were divided into multiple modules, modules 1 and 5 with the
maximum number of nodes were subjected to functional annotation. In
module 1, the linker genes COL1A1 and COL1A2, and the
DEG MMP9 exhibited the highest degree of connectivity.
COL1A1 and COL1A2, two type I collagen members, are
major components of the ECM. Growing evidence has shown that the
ECM plays a critical role in promoting epithelial-to-mesenchymal
transition (EMT), which is associated with tumor invasion and
metastasis (29). Additionally, EMT
is indicated to confer tumor cell resistance to apoptosis and to
promote the escape of tumor cells from the senescence process
(30,31). Moreover, a pioneer study uncovered the
fact that EMT has the capacity of endowing tumor cells with cancer
stem cell-like characteristics, which could promote tumor
development and chemoresistance (32). MMP9 (also known as gelatinase B), a
member of the MMP family, has been proven to degrade various
components of the ECM, including type I collagen (33). Notably, an elevated level of
MMP9 has been found in CRC (34), which is consistent with the present
analysis. Numerous studies have shown that MMP9 plays crucial roles
in invasion, metastasis, cell proliferation and angiogenesis
(35,36). Angiogenesis and cell proliferation are
critically important for tumor development and metastatic spreading
(37). From the results of the
functional annotation in the present study, the three important
genes in module 1 were mainly enriched in ECM-related functions and
the ECM-receptor interaction pathway. Accordingly, COL1A1,
COL1A2 and MMP9 are involved in CRC tumorigenesis and
metastasis via regulation of ECM-associated functions.
In module 5, UGDH, ALDH1A1,
FABP4 and MGLL were downregulated in colorectal tumor
samples and were significantly involved in metabolism-related
functions. UGDH is the four-electron transfer enzyme and is
associated with the biosynthesis of hyaluronan (HA), which
participants in tissue organization, development and cell
proliferation (38). A previous study
showed that elevated levels of HA are directly involved in the
progression of various cancers, and UGDH has been proposed as a
biomarker for prostate cancer (39).
In parallel, ALDH1A1, which belongs to a superfamily of enzymes,
has been identified as a crystalline in the lens and cornea
(40). Notably, ALDH1A1 also plays a
critical role in regulating lipid metabolism and gluconeogenesis
(41). In addition, FABP4, known as a
new adipokine, is involved in fatty acid trafficking from the
cytoplasm to the nucleus and in lipid metabolism (42). Furthermore, FABP4 is considered as a
candidate biomarker of lipodystrophy and metabolic syndrome
(43). It is well known that MGLL is
a member of the serine hydrolase superfamily, which hydrolyze
intracellular triglyceride and cholesteryl ester into free fatty
acid as an important fuel in mammals (44). More recently, MGLL was found to be
abnormally expressed in aggressive human cancer, and to promote
cell proliferation and tumor growth (45). It is now clear that the conversion of
cells from a normal to cancerous state requires metabolic
alterations, including changes in lipid metabolism and
gluconeogenesis, in order to support tumor growth and survival. As
a result, UGDH, ALDH1A1, FABP4 and MGLL
play a key role in metabolism-related functions and regulate the
tumorigenesis of CRC.
Taken together, the present results suggest that
COL1A1, COL1A2 and MMP9 in module 1, and
UGDH, ALDH1A1, FABP4 and MGLL in module
5 serve as key hub genes in CRC development, where the genes
regulate ECM and cell metabolism-associated functions that are
important for tumor growth. However, additional experiments will be
required to confirm the bioinformatic results.
References
|
1
|
Kemp Z, Thirlwell C, Sieber O, Silver A
and Tomlinson I: An update on the genetics of colorectal cancer.
Hum Mol Genet. 13:R177–R185. 2004. View Article : Google Scholar : PubMed/NCBI
|
|
2
|
Siegel R, DeSantis C and Jemal A:
Colorectal cancer statistics, 2014. CA Cancer J Clin. 64:104–117.
2014. View Article : Google Scholar : PubMed/NCBI
|
|
3
|
Grady WM and Carethers JM: Genomic and
epigenetic instability in colorectal cancer pathogenesis.
Gastroenterology. 135:1079–1099. 2008. View Article : Google Scholar : PubMed/NCBI
|
|
4
|
Hatzivassiliou G, Song K, Yen I,
Brandhuber BJ, Anderson DJ, Alvarado R, Ludlam MJ, Stokoe D, Gloor
SL, Vigers G, et al: RAF inhibitors prime wild-type RAF to activate
the MAPK pathway and enhance growth. Nature. 464:431–435. 2010.
View Article : Google Scholar : PubMed/NCBI
|
|
5
|
Bellam N and Pasche B: Tgf-beta signaling
alterations and colon cancer. Cancer Treat Res. 155:85–103. 2010.
View Article : Google Scholar : PubMed/NCBI
|
|
6
|
Chang SC, Lin JK, Yang SH, Wang HS, Li AF
and Chi CW: Relationship between genetic alterations and prognosis
in sporadic colorectal cancer. Int J Cancer. 118:1721–1727. 2006.
View Article : Google Scholar : PubMed/NCBI
|
|
7
|
Harpaz N and Polydorides AD: Colorectal
dysplasia in chronic inflammatory bowel disease: Pathology,
clinical implications and pathogenesis. Arch Pathol Lab Med.
134:876–895. 2010.PubMed/NCBI
|
|
8
|
Zisman TL and Rubin DT: Colorectal cancer
and dysplasia in inflammatory bowel disease. World J Gastroenterol.
14:2662–2669. 2008. View Article : Google Scholar : PubMed/NCBI
|
|
9
|
Wang D and Dubois RN: Prostaglandins and
cancer. Gut. 55:115–122. 2006. View Article : Google Scholar : PubMed/NCBI
|
|
10
|
Eisinger AL, Prescott SM, Jones DA and
Stafforini DM: The role of cyclooxygenase-2 and prostaglandins in
colon cancer. Prostaglandins Other Lipid Mediat. 82:147–154. 2007.
View Article : Google Scholar : PubMed/NCBI
|
|
11
|
Doherty GA, Byrne SM, Molloy ES, Malhotra
V, Austin SC, Kay EW, Murray FE and Fitzgerald DJ: Proneoplastic
effects of PGE2 mediated by EP4 receptor in colorectal cancer. BMC
Cancer. 9:2072009. View Article : Google Scholar : PubMed/NCBI
|
|
12
|
Sanz-Pamplona R, Berenguer A, Cordero D,
Molleví DG, Crous-Bou M, Sole X, Paré-Brunet L, Guino E, Salazar R,
Santos C, et al: Aberrant gene expression in mucosa adjacent to
tumor reveals a molecular crosstalk in colon cancer. Mol Cancer.
13:462014. View Article : Google Scholar : PubMed/NCBI
|
|
13
|
Lin G, He X, Ji H, Shi L, Davis RW and
Zhong S: Reproducibility probability score-incorporating
measurement variability across laboratories for gene selection. Nat
Biotechnol. 24:1476–1477. 2006. View Article : Google Scholar : PubMed/NCBI
|
|
14
|
Ryan BM, Zanetti KA, Robles AI, Schetter
AJ, Goodman J, Hayes RB, Huang WY, Gunter MJ, Yeager M, Burdette L,
et al: Germline variation in NCF4, an innate immunity gene, is
associated with an increased risk of colorectal cancer. Int J
Cancer. 134:1399–1407. 2014. View Article : Google Scholar : PubMed/NCBI
|
|
15
|
Leek JT, Johnson WE, Parker HS, Fertig EJ,
Jaffe AE and Storey JD: Package ‘SVA’: Surrogate Variable Analysis.
R package version 3. 2013, https://www.bioconductor.org/packages/devel/bioc/manuals/sva/man/sva.pdf
|
|
16
|
Bolstad BM: Package ‘preprocessCore’: A
collection of pre-processing functions. R package version 1. 2013,
https://www.bioconductor.org/packages/devel/bioc/manuals/preprocessCore/man/preprocessCore.pdf
|
|
17
|
Smyth GK: Limma: Linear models for
microarray dataBioinformatics and computational biology solutions
using R and Bioconductor. Springer; NY: pp. 397–420. 2005,
View Article : Google Scholar
|
|
18
|
Ferreira JA: The Benjamini-Hochberg method
in the case of discrete test statistics. Int J Biostat. 3:112007.
View Article : Google Scholar
|
|
19
|
Dennis G Jr, Sherman BT, Hosack DA, Yang
J, Gao W, Lane HC and Lempicki RA: DAVID: Database for annotation,
visualization, and integrated discovery. Genome Biol. 4:P32003.
View Article : Google Scholar : PubMed/NCBI
|
|
20
|
Ashburner M, Ball CA, Blake JA, Botstein
D, Butler H, Cherry JM, Davis AP, Dolinski K, Dwight SS, Eppig JT,
et al: Gene ontology: Tool for the unification of biology. The Gene
Ontology Consortium. Nat Genet. 25:25–29. 2000. View Article : Google Scholar : PubMed/NCBI
|
|
21
|
Kanehisa M and Goto S: KEGG: Kyoto
encyclopedia of genes and genomes. Nucleic Acids Res. 28:27–30.
2000. View Article : Google Scholar : PubMed/NCBI
|
|
22
|
Merico D, Isserlin R and Bader GD:
Visualizing gene-set enrichment results using the Cytoscape plug-in
enrichment map. Methods Mol Biol. 781:257–277. 2011. View Article : Google Scholar : PubMed/NCBI
|
|
23
|
Joshi-Tope G, Gillespie M, Vastrik I,
D'Eustachio P, Schmidt E, de Bono B, Jassal B, Gopinath GR, Wu GR,
Matthews L, et al: Reactome: A knowledgebase of biological
pathways. Nucleic Acid Res. 33:D428–D432. 2005. View Article : Google Scholar : PubMed/NCBI
|
|
24
|
Matthews L, Gopinath G, Gillespie M, Caudy
M, Croft D, de Bono B, Garapati P, Hemish J, Hermjakob H, Jassal B,
et al: Reactome knowledgebase of human biological pathways and
processes. Nucleic Acid Res. 37:D619–D622. 2009. View Article : Google Scholar : PubMed/NCBI
|
|
25
|
Prasad TK, Goel R, Kandasamy K,
Keerthikumar S, Kumar S, Mathivanan S, Telikicherla D, Raju R,
Shafreen B, Venugopal A, et al: Human protein reference
database-2009 update. Nucleic Acid Res. 37:D767–D772. 2009.
View Article : Google Scholar : PubMed/NCBI
|
|
26
|
Somwar R, Erdjument-Bromage H, Larsson E,
Shum D, Lockwood WW, Yang G, Sander C, Ouerfelli O, Tempst PJ,
Djaballah H and Varmus HE: Superoxide dismutase 1 (SOD1) is a
target for a small molecule identified in a screen for inhibitors
of the growth of lung adenocarcinoma cell lines. Proc Natl Acad Sci
USA. 108:16375–16380. 2011. View Article : Google Scholar : PubMed/NCBI
|
|
27
|
Schaefer CF, Anthony K, Krupa S, Buchoff
J, Day M, Hannay T and Buetow KH: PID: The pathway interaction
database. Nucleic Acid Res. 37:D674–D679. 2009. View Article : Google Scholar : PubMed/NCBI
|
|
28
|
Kohl M, Wiese S and Warscheid B:
Cytoscape: software for visualization and analysis of biological
networks. Methods Mol Biol. 696:291–303. 2011. View Article : Google Scholar : PubMed/NCBI
|
|
29
|
De Craene B and Berx G: Regulatory
networks defining EMT during cancer initiation and progression. Nat
Rev Cancer. 13:97–110. 2013. View
Article : Google Scholar : PubMed/NCBI
|
|
30
|
Valdes F, Alvarez AM, Locascio A, Vega S,
Herrera B, Fernández M, Benito M, Nieto MA and Fabregat I: The
epithelial mesenchymal transition confers resistance to the
apoptotic effects of transforming growth factor Beta in fetal rat
hepatocytes. Mol Cancer Res. 1:68–78. 2002.PubMed/NCBI
|
|
31
|
Ansieau S, Bastid J, Doreau A, Morel AP,
Bouchet BP, Thomas C, Fauvet F, Puisieux I, Doglioni C, Piccinin S,
et al: Induction of EMT by twist proteins as a collateral effect of
tumor-promoting inactivation of premature senescence. Cancer Cell.
14:79–89. 2008. View Article : Google Scholar : PubMed/NCBI
|
|
32
|
Mani SA, Guo W, Liao MJ, Eaton EN, Ayyanan
A, Zhou AY, Brooks M, Reinhard F, Zhang CC, Shipitsin M, et al: The
epithelial-mesenchymal transition generates cells with properties
of stem cells. Cell. 133:704–715. 2008. View Article : Google Scholar : PubMed/NCBI
|
|
33
|
Roy R, Yang J and Moses MA: Matrix
metalloproteinases as novel biomarkers and potential therapeutic
targets in human cancer. J Clin Oncol. 27:5287–5297. 2009.
View Article : Google Scholar : PubMed/NCBI
|
|
34
|
Turpeenniemi-Hujanen T: Gelatinases (MMP-2
and −9) and their natural inhibitors as prognostic indicators in
solid cancers. Biochimie. 87:287–297. 2005. View Article : Google Scholar : PubMed/NCBI
|
|
35
|
Deryugina EI and Quigley JP: Pleiotropic
roles of matrix metalloproteinases in tumor angiogenesis:
Contrasting, overlapping and compensatory functions. Biochim
Biophys Acta. 1803:103–120. 2010. View Article : Google Scholar : PubMed/NCBI
|
|
36
|
Gialeli C, Theocharis AD and Karamanos NK:
Roles of matrix metalloproteinases in cancer progression and their
pharmacological targeting. FEBS J. 278:16–27. 2011. View Article : Google Scholar : PubMed/NCBI
|
|
37
|
Carmeliet P and Jain RK: Molecular
mechanisms and clinical applications of angiogenesis. Nature.
473:298–307. 2011. View Article : Google Scholar : PubMed/NCBI
|
|
38
|
Viola M, Vigetti D, Genasetti A, Rizzi M,
Karousou E, Moretto P, Clerici M, Bartolini B, Pallotti F, De Luca
G and Passi A: Molecular control of the hyaluronan biosynthesis.
Connect Tissue Res. 49:111–114. 2008. View Article : Google Scholar : PubMed/NCBI
|
|
39
|
Huang D, Casale GP, Tian J, Lele SM,
Pisarev VM, Simpson MA and Hemstreet GP III: Udp-glucose
dehydrogenase as a novel field-specific candidate biomarker of
prostate cancer. Int J Cancer. 126:315–327. 2010. View Article : Google Scholar : PubMed/NCBI
|
|
40
|
Chen Y, Koppaka V, Thompson DC and
Vasiliou V: Focus on molecules: ALDH1A1: From lens and corneal
crystallin to stem cell marker. Exp Eye Res. 102:105–106. 2012.
View Article : Google Scholar : PubMed/NCBI
|
|
41
|
Kiefer FW, Orasanu G, Nallamshetty S,
Brown JD, Wang H, Luger P, Qi NR, Burant CF, Duester G and Plutzky
J: Retinaldehyde dehydrogenase 1 coordinates hepatic
gluconeogenesis and lipid metabolism. Endocrinology. 153:3089–3099.
2012. View Article : Google Scholar : PubMed/NCBI
|
|
42
|
Wootan MG, Bernlohr DA and Storch J:
Mechanism of fluorescent fatty acid transfer from adipocyte fatty
acid binding protein to membranes. Biochemistry. 32:8622–8627.
1993. View Article : Google Scholar : PubMed/NCBI
|
|
43
|
Karakas SE, Almario RU and Kim K: Serum
fatty acid binding protein 4, free fatty acids, and metabolic risk
markers. Metabolism. 58:1002–1007. 2009. View Article : Google Scholar : PubMed/NCBI
|
|
44
|
Long JZ and Cravatt BF: The metabolic
serine hydrolases and their functions in mammalian physiology and
disease. Chem Rev. 111:6022–6063. 2011. View Article : Google Scholar : PubMed/NCBI
|
|
45
|
Nomura DK, Long JZ, Niessen S, Hoover HS,
Ng SW and Cravatt BF: Monoacylglycerol lipase regulates a fatty
acid network that promotes cancer pathogenesis. Cell. 140:49–61.
2010. View Article : Google Scholar : PubMed/NCBI
|