Introduction
The pituitary tumor-transforming gene 1 (PTTG1) is
an oncogene that was originally identified in the mouse pituitary
tumor GH4 cell line using a messenger (m)RNA differential display
polymerase chain reaction (PCR) technique (1). PTTG1 has been reported to be highly
expressed in malignant astrocytoma and is closely associated with
tumor invasion (2). As a potent tumor
transforming gene, PTTG1 induces oncogenesis by facilitating cell
proliferation and independent tumorigenesis in in vivo and
in vitro studies (3,4). However, the complex mechanism by which
PTTG1 affects tumor cell proliferation and invasion remains unclear
and requires additional investigation. It has been demonstrated
that PTTG1 regulates cell proliferation via a mitogen-activated
protein kinase (MAPK) phosphorylation site
(proline-X-serine/threonine-proline) in its transcriptional
activation domain, which using serine162 as the specific site. This
is important for the PTTG1 transcription activation that is
potentiated by the MAPK signal pathway and involves various growth
factors, including epidermal growth factor (5–7). Previous
studies using human cervical adenocarcinoma HeLa S3 cells
demonstrated that the c-Myc gene acts as a downstream target of
PTTG1 in tumorigenesis, accompanied by an upregulation in cell
proliferation and colony formation, following the induction of
PTTG1 expression (8,9). Overall, the MAPK and c-Myc pathways may
be involved in PTTG1-induced cell proliferation, although
additional studies are required to confirm this hypothesis.
MicroRNAs (miRNAs) are endogenous non-coding RNAs,
20–23 nucleotides long, which negatively regulate gene expression
at the transcriptional level by complementary base paring with
their target mRNAs to induce mRNA degradation or translation
inhibition (10). It has been
demonstrated that miRNAs are associated with oncogenesis. Levels of
certain miRNAs are reduced in several human cancers, suggesting the
potential function of miRNAs as tumor inhibitors under normal
conditions (11). miRNAs regulate
gene expression by inhibiting target protein synthesis, as reported
by Lewis et al (12), who
developed a computational model to identify the target genes of
miRNAs and revealed that miRNAs are involved in numerous biological
functions. These findings suggest potential applications of miRNAs
as drug candidates in cancer treatment, as specific gene expression
may be blocked by RNA interference using synthetic miRNAs, which
has potential prospects in treating various cancers and genetic
diseases, such as colon, breast and lung cancer, hepatocellular
carcinoma, Parkinson's disease, Alzheimer's disease and
Huntington's disease. To provide an improved understanding of the
effect of PTTG1 on the proliferation and invasion of human glioma
cells, the present study suppressed the expression of the PTTG1
gene using exogenous miRNA induced by pcDNA6.2-GW/EmGFP-miR. In
addition, the present study investigated the role of PTTG1 in
inducing the apoptosis of human malignant glioma U251 cells.
Materials and methods
Sample preparation and hematoxylin and
eosin (HE) staining
The 52 samples of glioma tissues used were obtained
from surgical resections performed between 2012 and 2014 at the
Affiliated Hospital of Nantong University (Nantong, China). All
fresh frozen human glioma tissue samples were obtained and in
accordance with an Institutional Review Board protocol approved by
the Partners Human Research Committee. The tissues were rinsed in
normal saline and divided into three sections. One section was
fixed in 10% formalin (Boster Biological Technology, Ltd., Wuhan,
China) for routine pathological examinations. The other two
sections were frozen immediately in liquid nitrogen, stored at
−70°C and were used for immunohistochemical (IHC) staining and
western blot analysis.
Following fixation, the tissues were embedded in
paraffin and sectioned. All the tissue slices were dewaxed in
xylene (Chengdu Feike BioTechnology Co., Ltd, Chengdu, China),
rehydrated in gradient ethanol (35, 55, 75 and 95% ethanol; Chengdu
Feike BioTechnology Co., Ltd), stained in hematoxylin (Chengdu
Feike BioTechnology Co., Ltd) for 5 min, washed in tap water,
dehydrated in gradient ethanol and sealed in neutral gum. The
tissue morphology was observed under a light-field microscope
(BX50F; Olympus, Tokyo, Japan).
IHC staining
Human malignant glioma U251 cells were provided by
the Chinese Academy of Science (Shanghai, China) and were cultured
in Gibco Dulbecco's modified Eagle's medium (DMEM; Thermo Fisher
Scientific, Inc., Waltham, MA, USA) supplemented with 10% fetal
bovine serum (FBS; Jackson ImmunoResearch Laboratories, Inc., West
Grove, PA, USA) at 37°C in a 5% CO2 atmosphere. The
cells were passed with 0.25% trypsin (Boster Biological Technology,
Ltd.) at a split ratio of 1:3. U251 cells in the log phase of
growth were collected and rinsed in sterilized phosphate-buffered
saline (PBS; PAA Laboratories GmbH, Pasching, Austria) three times
and fixed with 2 ml sterilized 4% paraformaldehyde (Chengdu Feike
BioTechnology Co., Ltd) for 30 min. Following three washes with
PBS, 3% H2O2 (Dakewe Biotech Co., Ltd,
Shenzhen, China) was used to quench the endogenous peroxidase
activity. A rabbit anti-PTTG1 polyclonal antibody (dilution, 1:500;
catalog no., 34–1500; Invitrogen; Thermo Fisher Scientific, Inc.)
was incubated with cells at 4°C overnight subsequent to 1 h
blocking in 5% goat serum (PAA Laboratories GmbH) containing 0.1%
Triton X (Carl Roth GmbH & Co. KG, Karlsruhe, Germany). A
negative control was performed using PBS instead of the primary
antibody. A mouse anti-rabbit horseradish peroxidase
(HRP)-conjugated secondary antibody (dilution, 1:200; catalog no.,
sc-2004; Invitrogen; Thermo Fisher Scientific, Inc.) was used to
amplify the signal with the chromogenic substrate
3,3′-diaminobenzidine (Invitrogen; Thermo Fisher Scientific, Inc.).
Using a light-field microscope equipped with a measurement grid,
500–1,000 cells were counted from 10 randomly selected fields under
a ×400 magnification.
Vector constructs and cell
transfection
The Invitrogen pcDNA6.2-GW/EmGFP-miR plasmids were
purchased from Thermo Fisher Scientific, Inc. Competent Escherichia
coli cells were purchased from Tiangen Biotech Co., Ltd. (Beijing,
China). Two pairs of miRNA sequences (Table I) were designed using Invitrogen
Block-iT™ RNAi Designer software (Thermo Fisher Scientific, Inc.)
based on the human PTTG1 gene sequence (gene ID, 3232; GeneBank;
National Center for Biotech Information, Bethesda, MD, USA). Each
oligonucleotide possessed a length of 64 bp and could form a
hairpin structure. These oligonucleotides were able to form unique
sticky ends following annealing, and could be ligated onto the
sticky ends of the pcDNA6.2-GW/EmGFPmiR vector. The
oligonucleotides (10 µM) were incubated in Invitrogen annealing
buffer (Thermo Fisher Scientific, Inc.) at 95°C for 4 min and 37°C
for 10 min prior to being ligated to the empty vector using
Invitrogen T4 ligase (Thermo Fisher Scientific, Inc.). Recombinant
vectors were used to transform competent cells, which were then
seeded onto lysogeny broth (LB)-spectinomycin culture plates (BD
Biosciences, Franklin Lakes, NJ, USA). In total, 4 monoclonal
colonies were additionally incubated in 3 ml of LB medium
(Sigma-Aldrich, St. Louis, MO, USA) containing 50 µg/ml of cells at
37°C overnight. Extracted plasmids were screened by a double
digestion with BsrDІ and BamHI (Invitrogen; Thermo Fisher
Scientific, Inc.) and confirmed by sequencing (reverse,
5′-CTCTAGATCAACCACTTTGT-3′; forward, 5′-ACAATCAGATTACTAACGAG-3′;
Invitrogen, Thermo Fisher Scientific, Inc.). The results revealed
that the recombinant pcDNA6.2-GW/EmGFP-miR-PTTG1 plasmid had an
inserted target gene of 64 bp, which was the same as the original
design. Positive constructs with the correct miRNA insertions were
termed miRNA-1 (miR-1) and miRNA-2 (miR-2), with the negative
control being termed Neg. All plasmids were purified using the
AxyPrep kit (Corning Inc., Corning, NY, USA) for additional
transfection.
 | Table I.Oligonucleotide sequences of miRs for
reverse transcription-quantitative polymerase chain reaction. |
Table I.
Oligonucleotide sequences of miRs for
reverse transcription-quantitative polymerase chain reaction.
| Primer name | Sequence, 5′-3′ |
|---|
| miR-1 |
|
|
Forward |
TGCTGATCCTTAGCAACCACACGGGTGTTTTGGCCACTGACTGACACCCGTGTTTGCTAAGGAT |
|
Reverse |
CCTGATCCTTAGCAAACACGGGTGTCAGTCAGTGGCCAAAACACCCGTGTGGTTGCTAAGGATC |
| miR-2 |
|
|
Forward |
TGCTGAGCTTCAGCCCATCCTTAGCAGTTTTGGCCACTGACTGACTGCTAAGGGGGCTGAAGCT |
|
Reverse |
CCTGAGCTTCAGCCCCCTTAGCAGTCAGTCAGTGGCCAAAACTGCTAAGGATGGGCTGAAGCTC |
| Control |
|
|
Forward |
TGCTGGCATCATGACGTCGTGACCTACTCAGTAGATGCTCTAGTTAGTAATCTGATTGCGCACA |
|
Reverse |
CCTGTGTGCGCAATCAGATTACTAACTAGAGCATCTACTGAGTAGGTCACGACGTCATGATGCC |
| PTTG1 |
|
|
Forward |
CTGTAAAGACCAAGGGACCCCT |
|
Reverse |
GCAGGAACAGAGCTTTTTGCTT |
| GAPDH |
|
|
Forward |
GACAACTTTGGTATCGTGGAAGG |
|
Reverse |
CCAGTAGAGGCAGGGATGATGT |
U251 cells in the log phase of growth
(1×10⁵ cells/ml) were digested, seeded into 6-well
plates (BD Biosciences) and cultured for 48 h to reach a stable
growth status with 80% confluency. miR-1, miR-2 and Neg plasmids
were transfected into U251 cells using Invitrogen
Lipofectamine® 2000 (Thermo Fisher Scientific, Inc.)
following the manufacturer's protocol. An empty control group was
established by adding Lipofectamine 2000 only. The transfection
efficiency was determined subsequent to 24 h by evaluating emerald
green fluorescent protein (EmGFP) expression under an Axiovert 200M
inverted fluorescence microscope (excitation, 488 nm; emission, 509
nm; Carl Zeiss, AG, Oberkochen, Germany).
Quantitative PCR (qPCR) and western
blot analysis
Total RNA was extracted from U251 cells 48 h
subsequent to transfection using RNeasy Mini kit (Qiagen China Co.,
Ltd., Shanghai, China) and was measured for PTTG1 mRNA levels using
qPCR. Primer sequences for PTTG1 and glyceraldehyde 3-phosphate
dehydrogenase, as an internal control, are reported in Table I. qPCR was performed by quantitative
fluorescent PCR reactor (BioRad Laboratories, Inc., Hercules, CA,
USA) using the following program repeated for 40 cycles: 94°C for 4
min; 94°C for 20 sec; and 60°C for 30 sec. All samples were
normalized to β-actin using the 2−ΔΔCq method (13).
The cells were lysed 72 h subsequent to transfection
with 2-D lysis buffer (Beyotime Institute of Biotechnology, Haimen,
China) and the total protein was quantified using the Bradford
method. The cell lysates were subjected to 12% sodium dodecyl
sulfate-polyacrylamide gel electrophoresis separation, transferred
to polyvinylidene difluoride membranes (Merck Millipore, Darmstadt,
Germany), blocked in 5% non-fat milk powder (Sangon Biotech,
Shanghai, China) and incubated with rabbit anti-human PTTG1
polyclonal antibody (dilution, 1:500), mouse anti-Ki67 monoclonal
antibody (dilution, 1:100; catalog no., sc-15402; Santa Cruz
Biotechnology, Inc., Dallas, TX, USA), mouse anti-matrix
metalloproteinase (MMP)-2 monoclonal antibody (dilution, 1:100;
catalog no., MS-567-P0; Thermo Fisher Scientific, Inc.), mouse
anti-MMP-9 monoclonal antibody (dilution, 1:100; Thermo Fisher
Scientific, Inc.) or Invitrogen mouse anti-human β-actin (dilution,
1:500; catalog no., sc-2405; Thermo Fisher Scientific, Inc.).
Subsequent to 2 h incubation at room temperature and washing with
Tris-buffered saline and Tween 20 (Beyotime Institute of
Biotechnology), HRP-conjugated goat anti-rabbit immunoglobulin G
secondary antibodies (dilution, 1:400; Santa Cruz Biotechnology,
Inc.) were added to the membrane for a 1 h incubation, followed by
rinsing with Tris-buffered saline, and developed using enhanced
chemiluminescence reagent (Pierce Biotechnology, Inc., Rockford,
IL, USA) and X-ray exposure. Western blot analysis bands were
quantified using the Odyssey densitometry program (LI-COR
Biosciences, Lincoln, NE, USA.). β-actin was used as an internal
control for normalizing the protein load.
Cell proliferation and migration
assay
The cells in the log phase of growth were seeded in
96-well plates (1×10⁵ cells/ml; 100µl/well; BD
Biosciences) and cultured at 37°C with 5% CO2 for 18 h.
The cells were washed with Gibco Opti-MEM™ (Thermo Fisher
Scientific, Inc.) without serum and transfected with control and
miRNA plasmids. In total, 100 µl fresh Opti-MEM medium (Gibco;
Thermo Fisher Scientific, Inc.) was added 6 h subsequent to
transfection. Methylthiazol tetrazolium (MTT) reagent (100 µl/well)
was added 4 h prior to each time point. The cells were then treated
with 100 µl dimethyl sulfoxide (Boster Biological Technology, Ltd.)
and were agitated for 15 min until all the crystals had been
dissolved. The optical density absorption values were measured at
490 nm and the mean values were calculated from 6 repeated
experiments.
Matrigel (BD Biosciences) was thawed overnight at
4°C, diluted with DMEM without serum and added to the top chamber
of a pre-cold Transwell filter plate (pore size, 8 µm; Costar;
Cambridge, NY, USA). The 24-well plate was incubated for 2 h at
37°C to allow complete polymerization of the Matrigel. Transfected
cells (1×10⁵ cells; 100 µl/well) were added to the top
chamber, while 600 µl chemokines prepared from mouse embryo
fibroblast NIH/3T3 cells (American Type Culture Collection,
Manassas, VA, USA) (14) were added
to the bottom chamber. The Transwell plate was incubated at 37°C
with 5% CO2 for 36 h. The plate was cleaned to remove
immobile cells, and was fixed in 100% methanol (Seebio Biotech,
Inc., Shanghai, China) for 10 min, followed by Giemsa staining
(Seebio Biotech, Inc.) for 15 min. The number of cells in 5
randomly selected fields from the lower region of the plate was
counted under the light-field microscope at a magnification of
×320. The invasive ability of the tumor cells was determined by the
relative number of invasive cells.
Following digestion, cultured cells (106
cells/well) were seeded into 6-well plates with 10% FBS/DMEM medium
for overnight incubation. The following day, vertical scratches
were labeled inside each well using a 200-µl micropipette tip
(Shanghai Rong Tai Biochemical Engineering Co., Ltd., Shanghai,
China). Following two washes with Hanks' solution (Seebio Biotech,
Inc.), Opti-MEM I Reduced Serum medium (Thermo Fisher Scientific,
Inc.) without serum was used to incubate cells for 24 h. The total
number of migrated cells in 5 randomly selected fields was counted
using an inverted phase contrast microscope (Leica DMI3000 B;
Leica, Wetzlar, Germany) at a magnification of ×100.
Apoptosis assay
miRNA and Neg (200 nmol/l) constructs were used to
transfect cells, which were incubated for 48 h, prepared for cell
slides, fixed in paraformaldehyde for 1 h, washed with PBS 3 times,
stained in the dark using 10 mg/l Hoechst 33258 (0.5 ml/well;
Beyotime Institute of Biotechnology) and sealed in 500 g/l PBS with
glycerol (Beyotime Institute of Biotechnology). The cells were
observed under a fluorescent microscope.
Assay of caspase-3 activity and the
cell cycle
The cells were collected at various time points (24,
48, 72 and 96 h) following transfection and centrifuged at 872 × g
for 5 min (Eppendorf 5415R; Eppendorf, Hamburg, Germany),
re-suspended and counted to provide 1×10⁶ cells/ml cell
suspensions. Subsequently, 0.3 ml cell suspension from each group
was mixed with 1 µl Z-VAD-FMK (Santa Cruz Biotechnology, Inc.),
incubated at 37°C with 5% CO2 for 40 min, centrifuged at
2616 × g for 5 min and was re-suspended in 5 ml washing buffer for
flow cytometry.
Subsequent to 48 h of transfection using 200 nmol/l
miRNA, the cells were collected, digested using trypsin,
centrifuged at 2616 × g and re-suspended in 5 ml PBS. Following
fixation in 70% ethanol at 4°C for 30 min, the cells were stained
using buffer containing RNase and propidium iodine (PI). The cell
cycle analysis was performed using EPICS Elite ESP Cell Sorter
(Beckman Coulter, Inc., Brea, CA, USA) with ~11,000 cells in each
sample, via the percentage measurement of cell numbers at each
phase.
Subcutaneous transplantation of
tumors
The animal study proposal was approved by the
Laboratory Animal Center of Nantong University (permit number,
20140310-009). All mouse experimental procedures were performed in
accordance with the Regulations for the Administration of Affairs
Concerning Experimental Animals approved by the State Council of
People's Republic of China (15). In
total, 21 BALB/C nude mice (4–6 weeks old; body weight, 18±2 g)
were provided by the animal experimental center at Affiliated
Hospital of Nantong University (Nantong, Jiangsu, China) and kept
in a specific-pathogen-free facility. The female mice were randomly
divided into three groups: miR-2-transfected U251 cell group;
Neg-U251 group; and non-transfected U251 (mock) group. Subsequent
to 48 h of transfection, the cells were collected and digested, and
a 5×10⁷ cells/ml cell suspension was rendered. In total,
0.2 ml of the cell suspension was subcutaneously injected into the
dorsal skin of the nude mice.
The tumor size was measured each week following
inoculation. The tumor volume was calculated as follows: Tumor
volume = ab2 / 2, where a was the length and b was the
width. The mice were sacrificed 4 weeks subsequent to inoculation.
The tumor tissues were removed and weighed, and the differences
between groups were compared. Sections of the tumor tissues were
then fixed in 10% neutral-buffered formalin (Boster Biological
Technology, Ltd.), embedded in paraffin (Boster Biological
Technology, Ltd.) within 24 h, sectioned into 4-µm serial tissue
slices and examined for tissue morphology. The remainder of the
tumor tissues was frozen in liquid nitrogen for future use.
Statistical analysis
SPSS software version 11.0 (SPSS, Inc., Chicago, IL,
USA) was used to process all collected data, which were presented
as the mean ± standard deviation. The comparison of means was
performed by one-way analysis of variance, t-test and χ2
test, as appropriate. Multiple comparisons between the groups were
performed using the Student-Newman-Keuls method. P<0.05 was
considered to indicate a statistically significant difference.
Results
PTTG1 expression is significantly
elevated in high-grade glioma
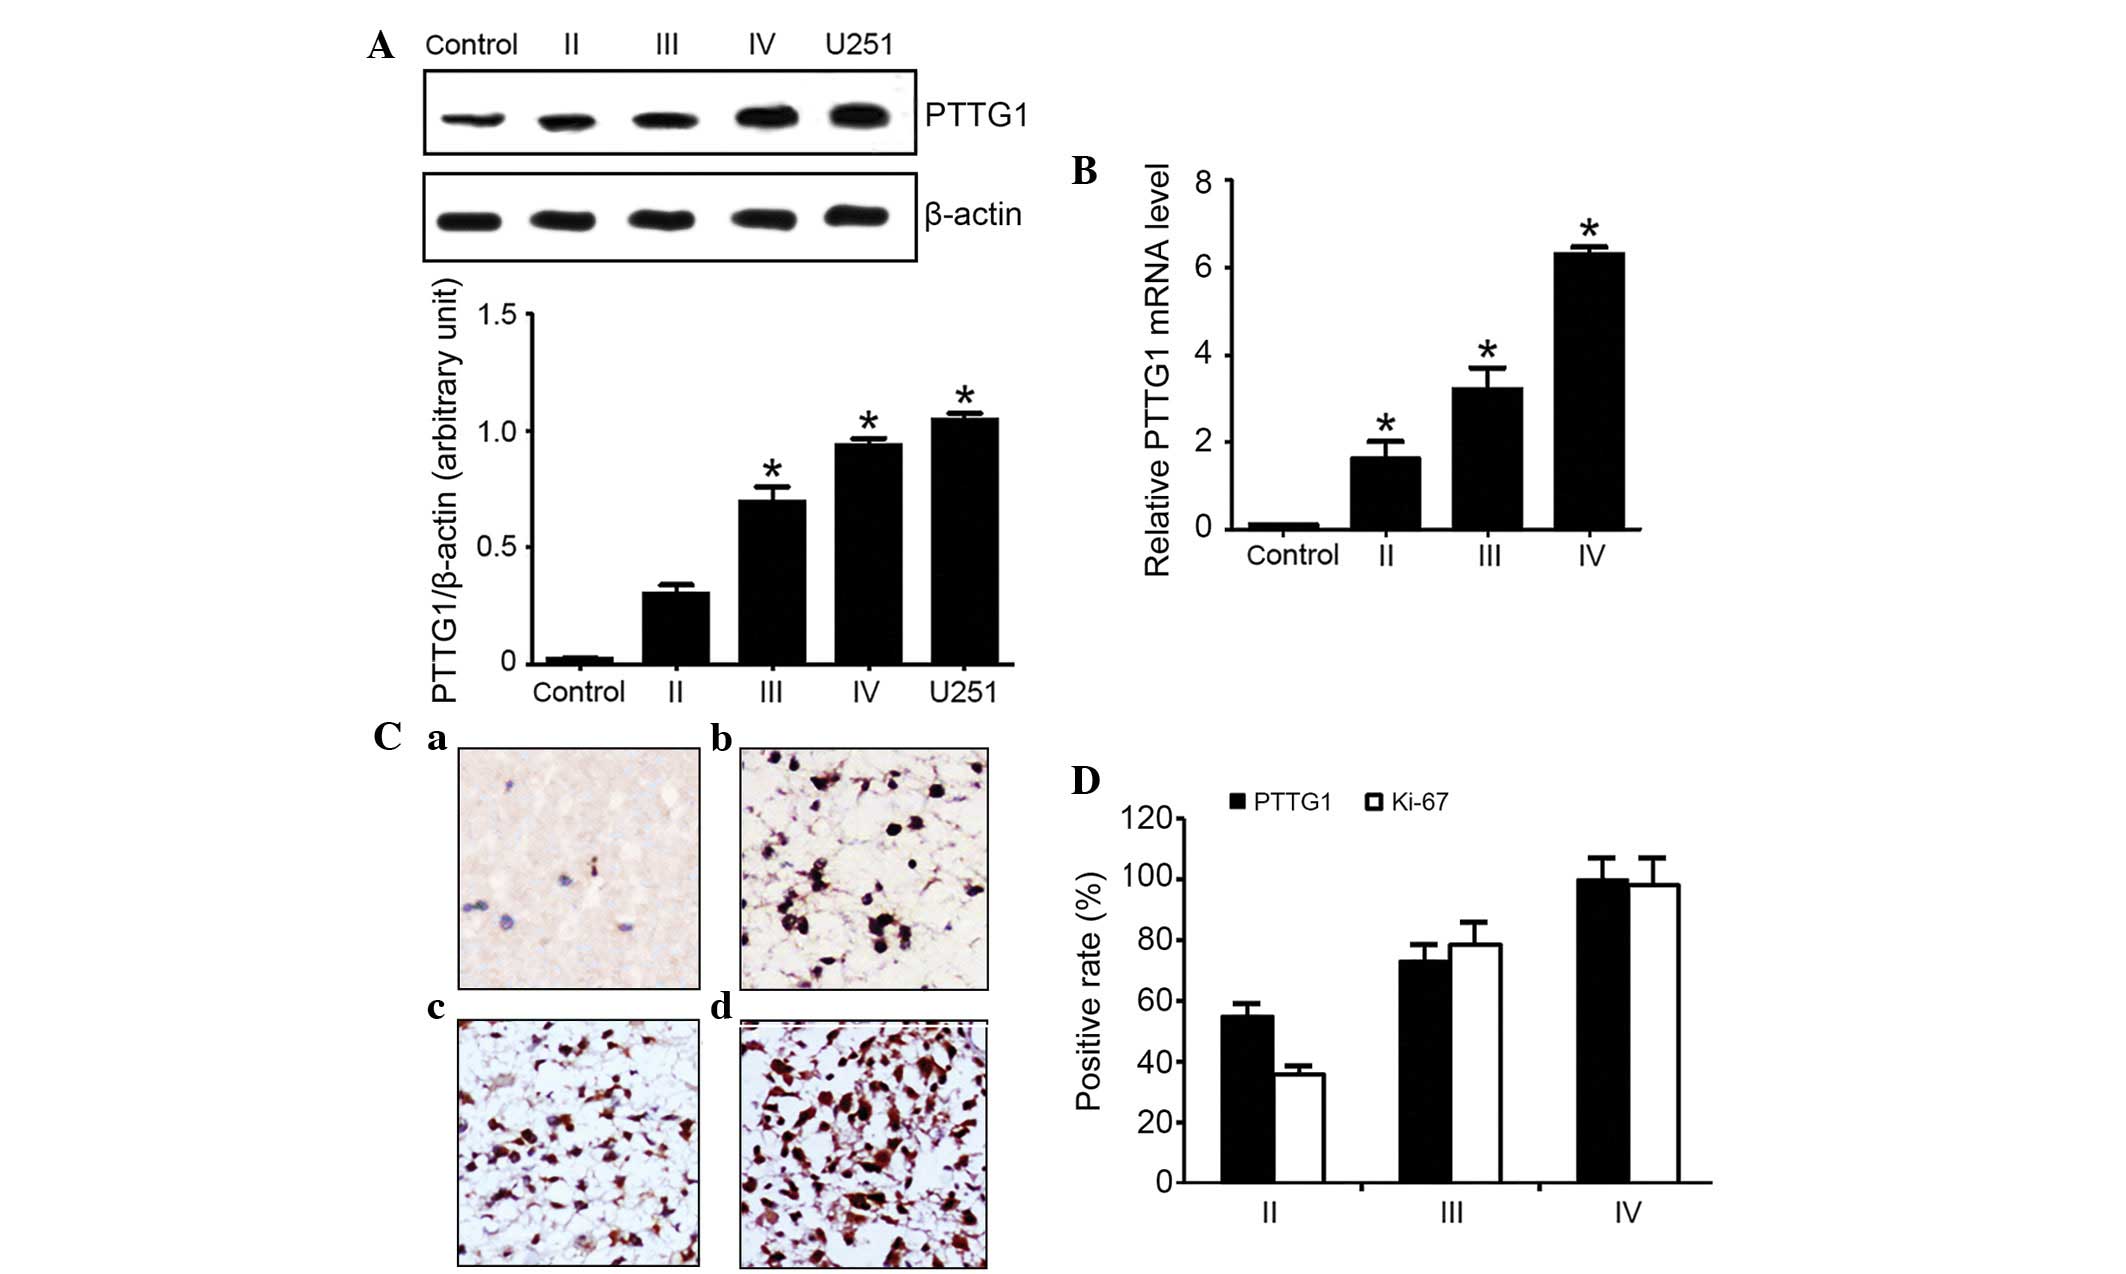
The present results from western blotting analysis
(Fig. 1A) and fluorescent qPCR
(Fig. 1B) revealed extremely low
levels of PTTG1 in normal brain tissues. However, the protein
expression level of PTTG1 became elevated with increased malignancy
of glioma, as U251 cells possessed the most increased PTTG1
level.
IHC staining of the PTTG1 protein resulted in
granular signals, and the tumor cell cytoplasm stained brown. In
certain tumor samples, the peripheral connective tissues and vessel
endothelial cells exhibited weak expression of PTTG1. The strength
of staining was variable across tumor samples at various
pathological stages, consisting of the fibrous astrocytoma,
anaplastic astrocytoma and multiform glioblastoma stages. Tumors
with a lower malignancy exhibited weak staining in astrocytes in
comparison with advanced glioma, which demonstrated clear staining
in the majority of cells (Fig.
1C).
Out of a total of 52 glioma samples, the PTTG1 gene
was expressed in 39 samples, accounting for 75% of all glioma
samples. By contrast, no PTTG1 was expressed in the healthy brain
tissues. In the 39 samples that did express PTTG1, 11 tumor samples
were classified as fibrous astrocytoma stage II (PTTG1 expression,
55%), 11 samples were anaplastic astrocytoma stage III (PTTG1
expression, 55%), and 17 samples were multiform glioblastoma stage
IV (PTTG1 expression, 100%), as demonstrated by Fig. 1D.
Suppression of PTTG1 expression by
exogenous miRNA in human malignant glioma U251 cells
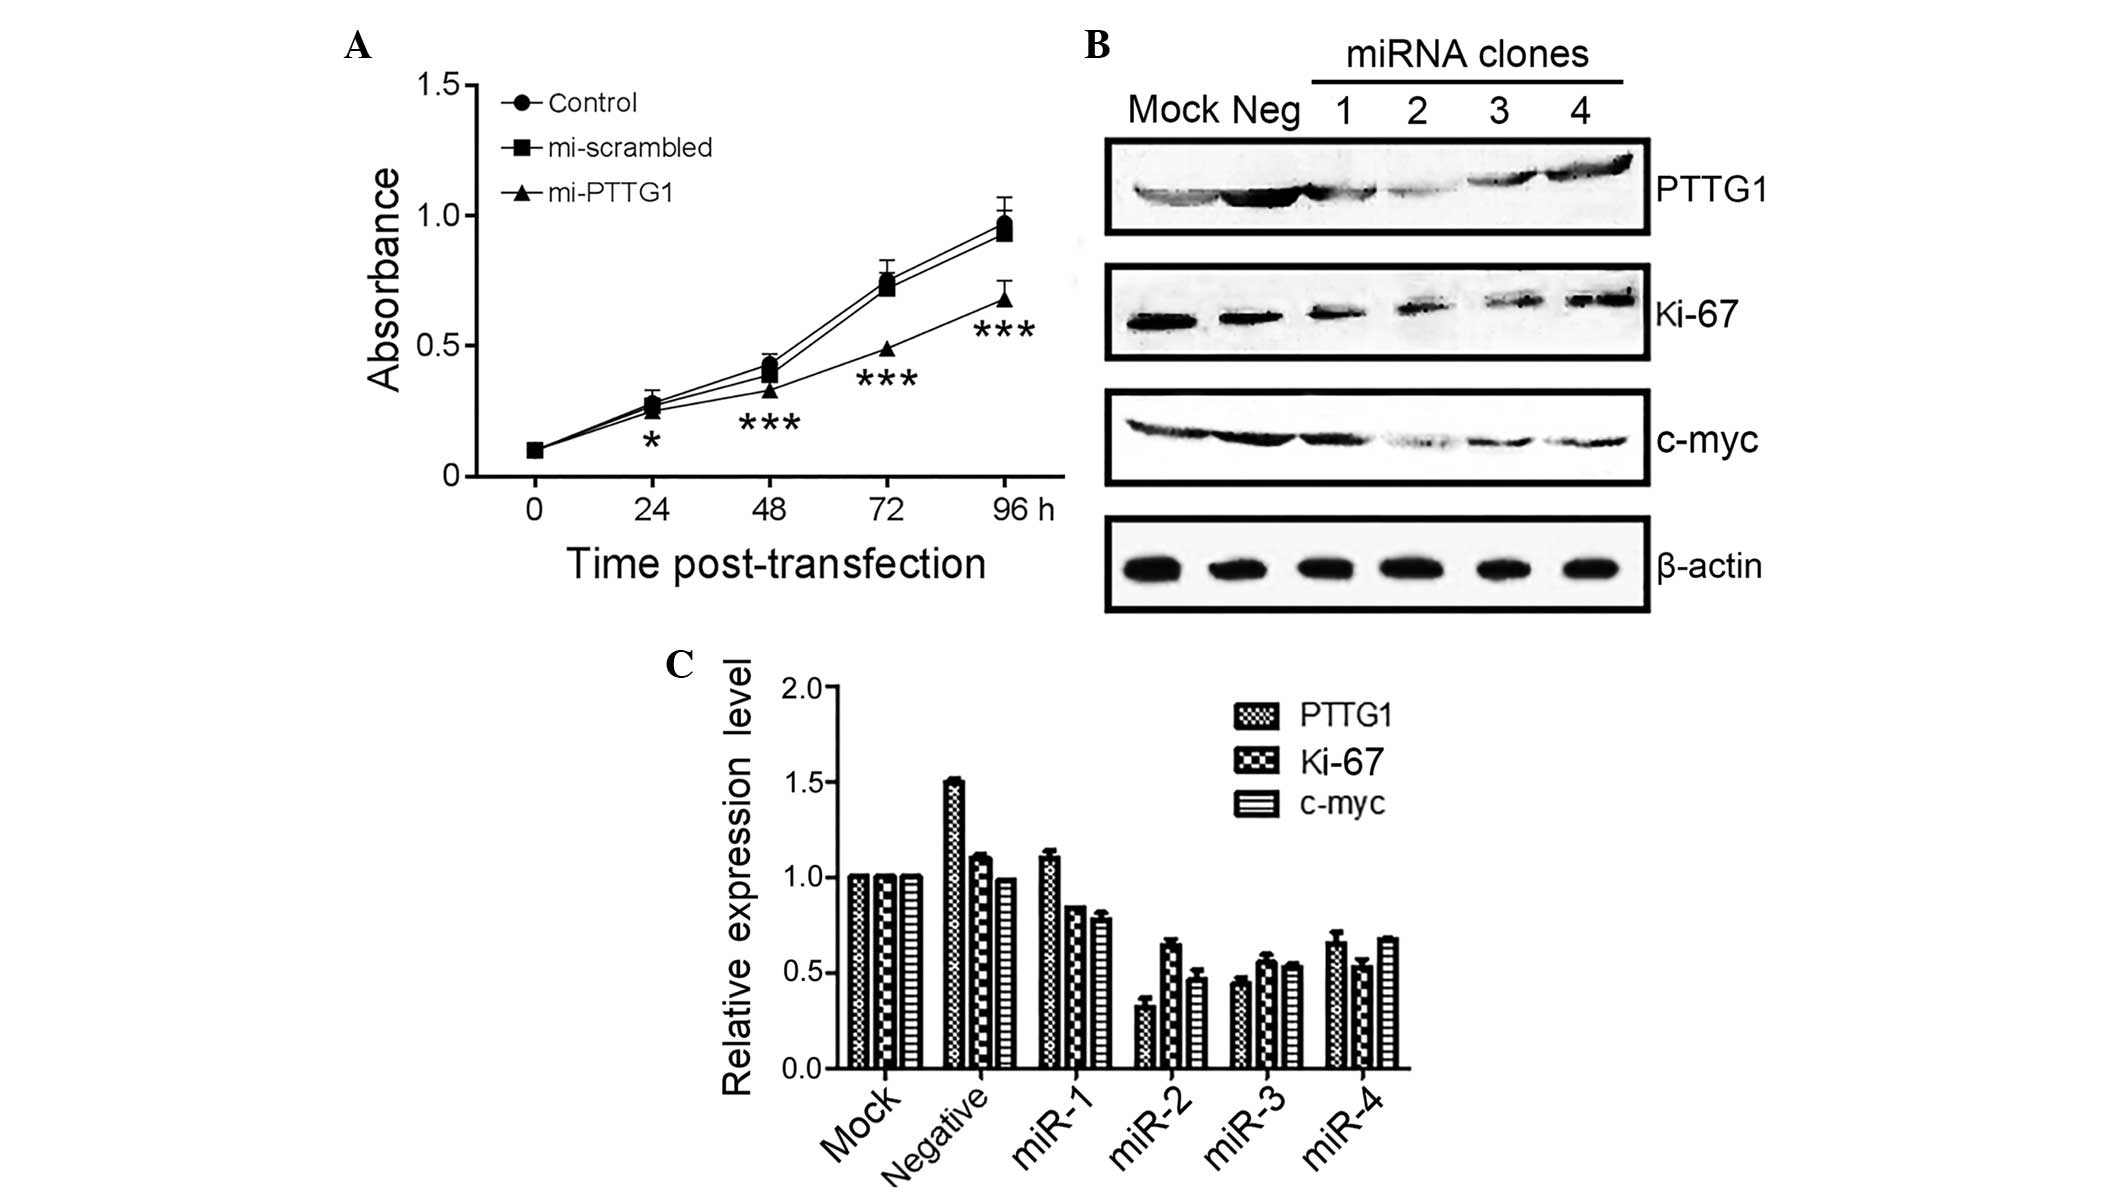
In total, ~80% of the U251 cells were transfected
with and expressed EmGFP 24 h subsequent to transfection. The qPCR
results demonstrated that there was no significant difference in
PTTG1 mRNA levels between the empty and Neg control groups (F=0.95;
P>0.05). However, the PTTG1 mRNA levels in the miR-1 and miR-2
groups were decreased compared with the empty group (F=258;
P<0.01).
Western blot analysis demonstrated that there were
significantly lower PTTG1 protein levels in the miR-1 and miR-2
cells, compared with the empty and Neg control cells, while there
was no difference in PTTG1 protein expression between the empty and
Neg control groups.
Inhibition of glioma cell
proliferation by PTTG1 suppression
The present study measured the light absorption
value (A490) of the U251 cells using the MTT method at various time
points (24, 48, 72 and 96 h) following transfection. The present
results demonstrated an increasing suppression of the A490 value in
cells transfected with miR-2 subsequent to 24 h (P<0.05;
Table II; Fig. 2A), suggesting the participation of
PTTG1 in glioma cell proliferation.
| Table II.Light absorption values (A490) of
human malignant glioma U251 cells following transfection with miR-2
plasmids. |
Table II.
Light absorption values (A490) of
human malignant glioma U251 cells following transfection with miR-2
plasmids.
|
| Group |
|
|
|---|
|
|
|
|
|
|---|
| Time point, h | Empty | Negative | miR-2 | F-value | P-value |
|---|
| 24 | 0.28±0.05 | 0.27±0.02 | 0.25±0.03 |
7.0 | <0.050 |
| 48 | 0.43±0.04 | 0.39±0.04 | 0.33±0.02 |
76.0 | <0.001 |
| 72 | 0.75±0.08 | 0.72±0.06 |
0.49±0.03a | 303.5 | <0.001 |
| 96 | 0.97±0.10 | 0.93±0.09 |
0.68±0.07a | 741.0 | <0.001 |
In the western blot analysis, the expression of
PTTG1, Ki67 and c-Myc in U251 cells (Fig.
2B and C) were all significantly decreased in cells transfected
with miRNA-PTTG1 plasmids, but not in cells without transfection or
with negative control plasmids.
PTTG1 suppression induces glioma cell
apoptosis
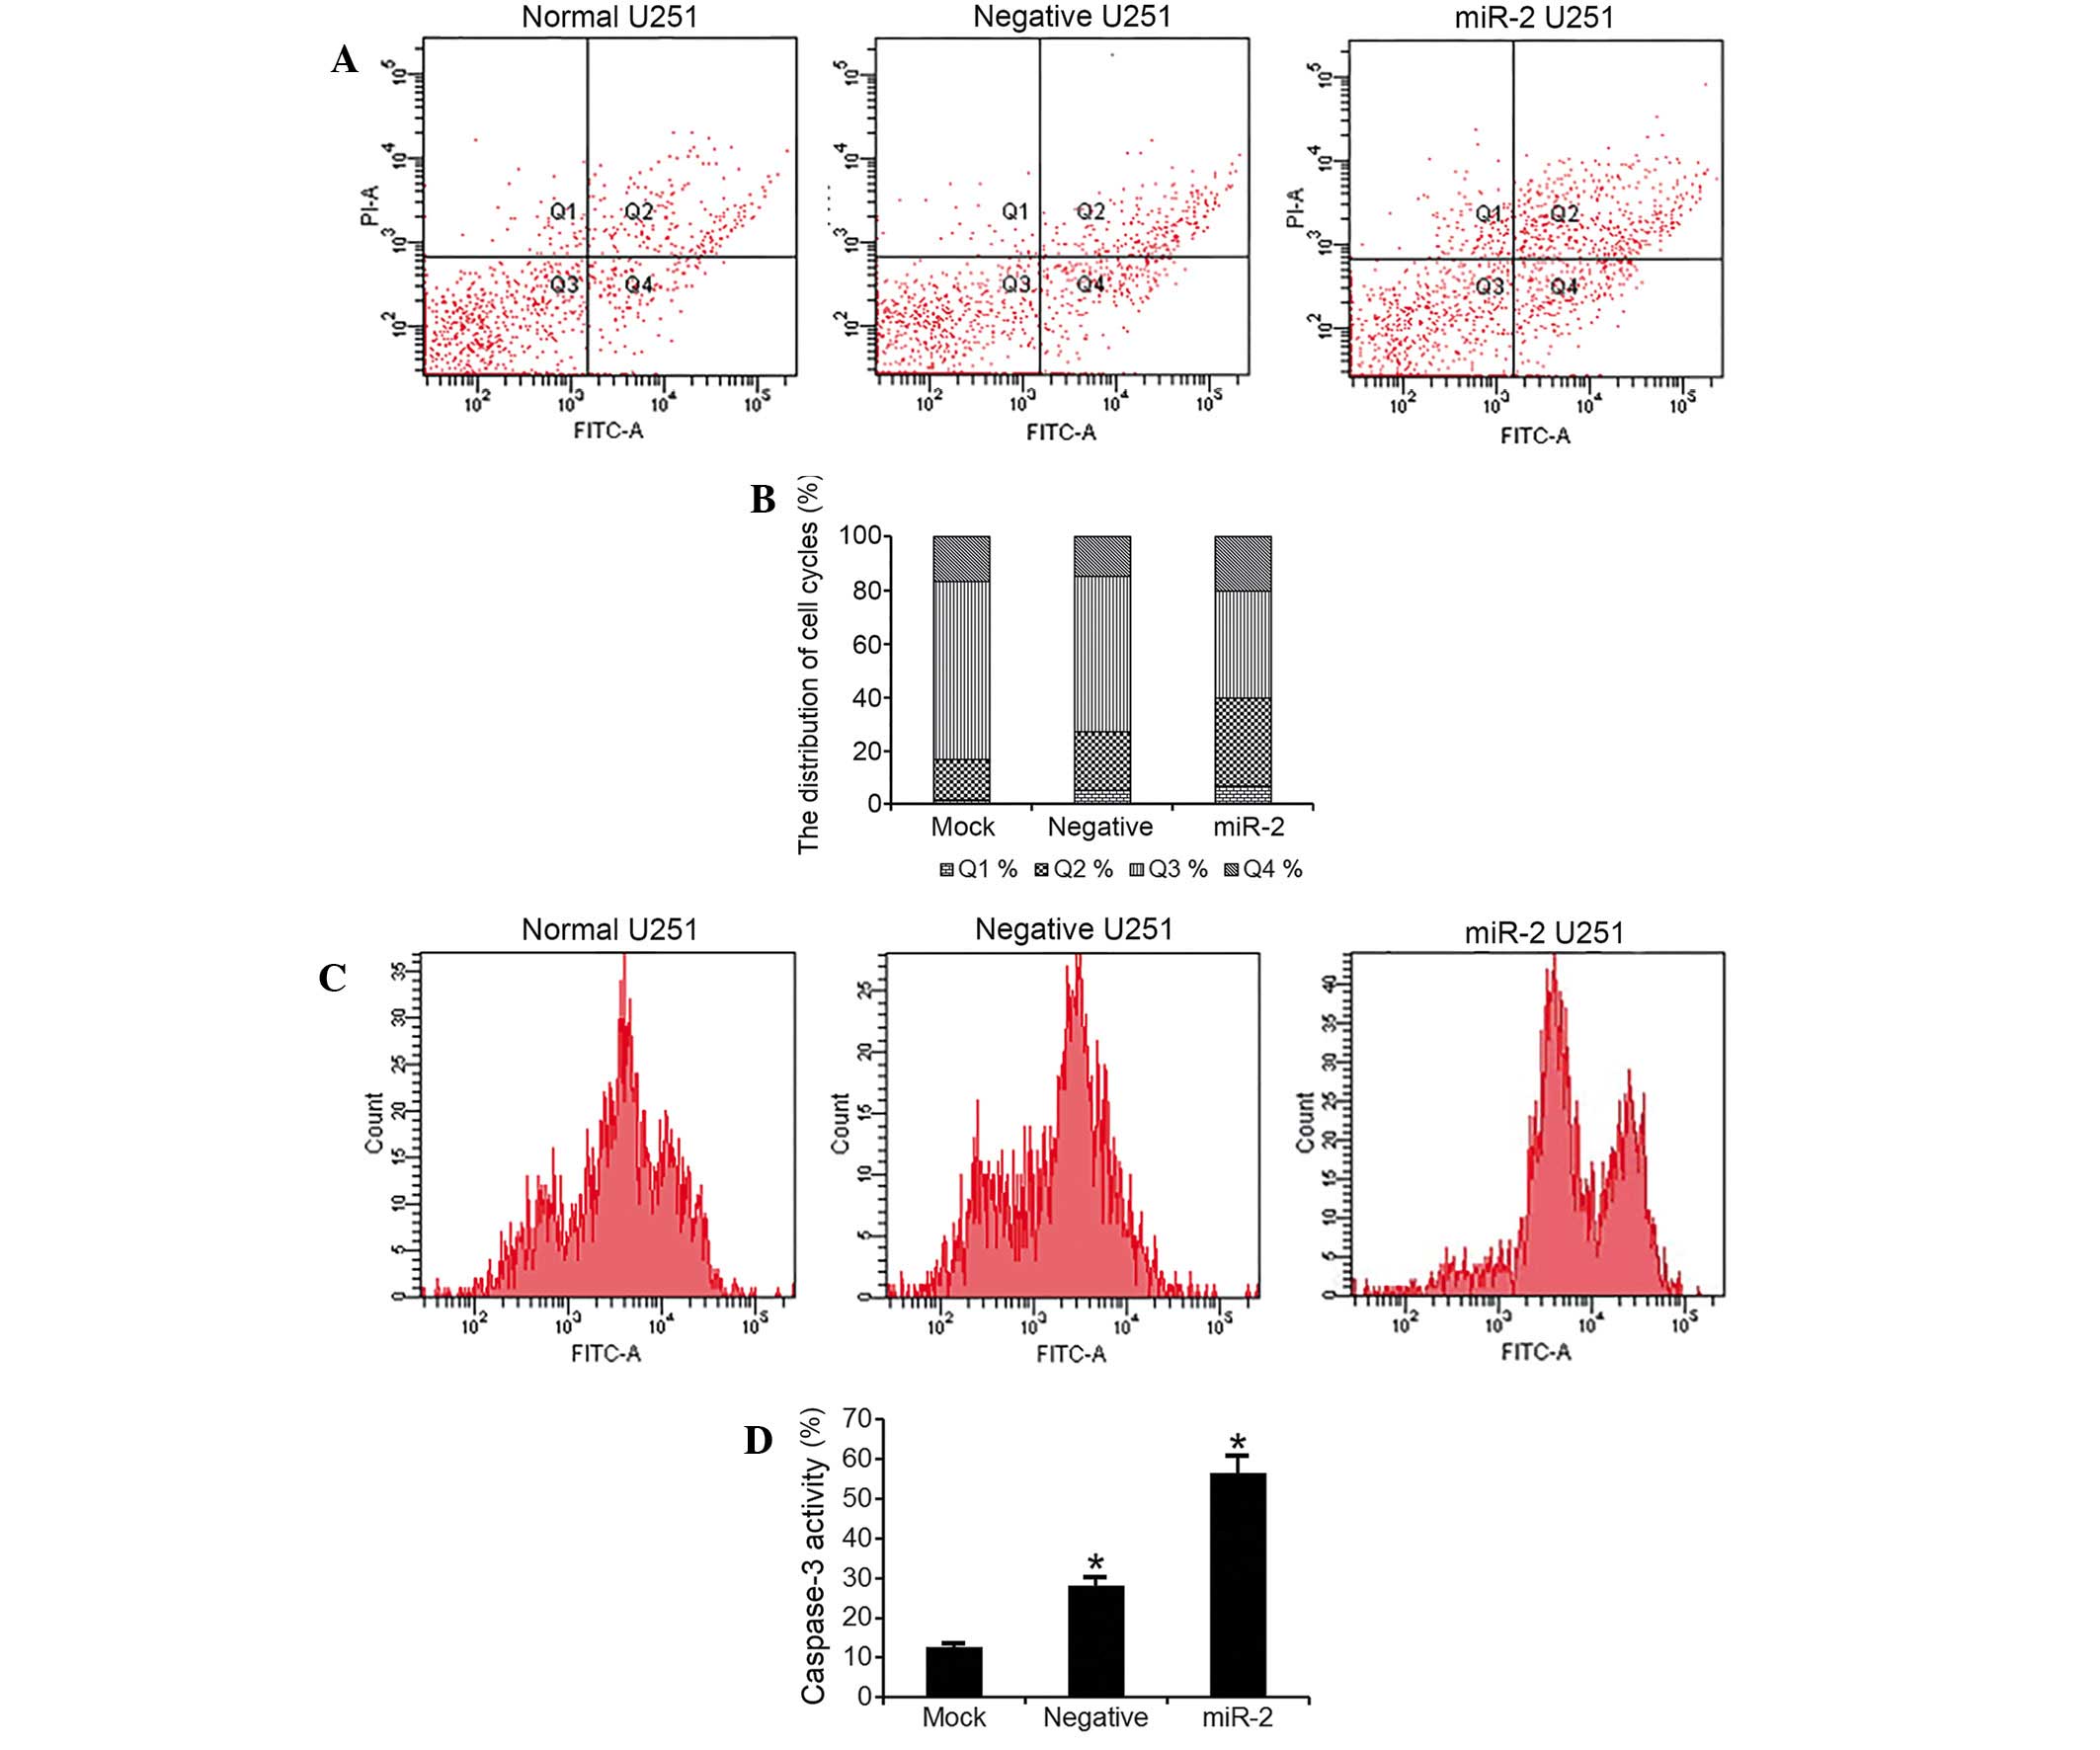
The flow cytometry quantitative analysis revealed a
statistically significant increase in the percentage of apoptotic
cells in U251 cells transfected with miR-2 interference plasmids
(apoptotic cells subsequent to 48 h, 53.6%) compared with empty
cells (apoptotic cells subsequent to 48 h, 32.4%) and Neg cells
(apoptotic cells subsequent to 48 h, 37%; F=124; P<0.001;
Fig. 3A and B). In addition, the
present study measured the caspase-3 levels in the cells. The
results demonstrated a significantly elevated caspase-3 activity in
miR-2-transfected U251 cells, compared with empty or Neg cells
(Fig. 3C and D).
PTTG1 suppression inhibits glioma cell
migration and invasion
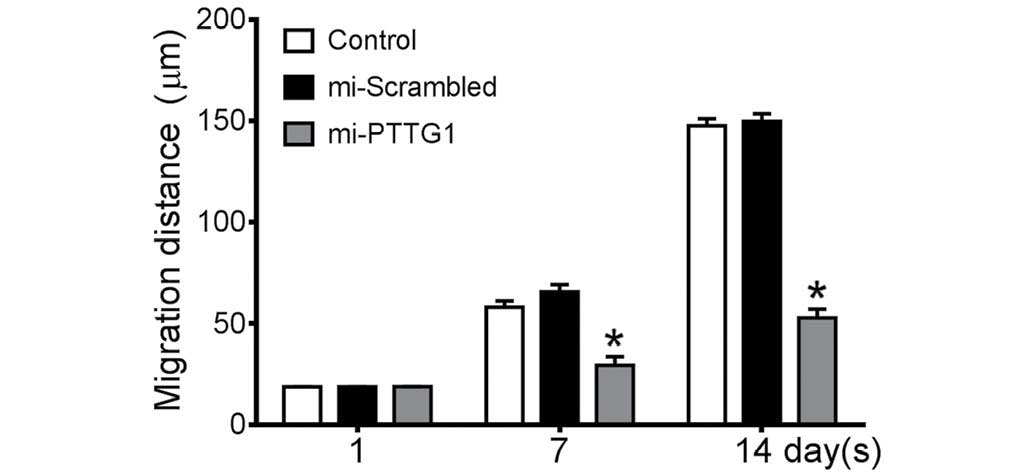
In the scratch cell migration assay, the average
migration distance of miR-2-transfected U251 cells (Fig. 4) on day 7 was 29.9 µm, which was
significantly lower compared with empty cells (58.03 µm) or Neg
cells (65.66 µm). On day 14, miR-2-transfected cells migrated by an
average of 52.83 µm compared with blank cells (147.67 µm) or Neg
cells (149.78 µm).
The Matrigel invasion assay additionally revealed
the impaired ability of glioma cell invasion when miRNA
interference was present. The total number of invasive cells in 5
randomly selected fields at ×100 magnification was 69.7
miR-2-transfected U251 cells, which was significantly decreased
compared with empty (109.8 cells) or Neg cells (99.6 cells). The
present study observed that there was a statistically significant
decrease in the number of miR-2-transfected cells (12.3±1.0%) that
crossed the artificial basal membrane compared with the control
cells (24.7±1.4%; F=266; P<0.001).
In vivo studies of PTTG1
suppression-induced tumor growth inhibition
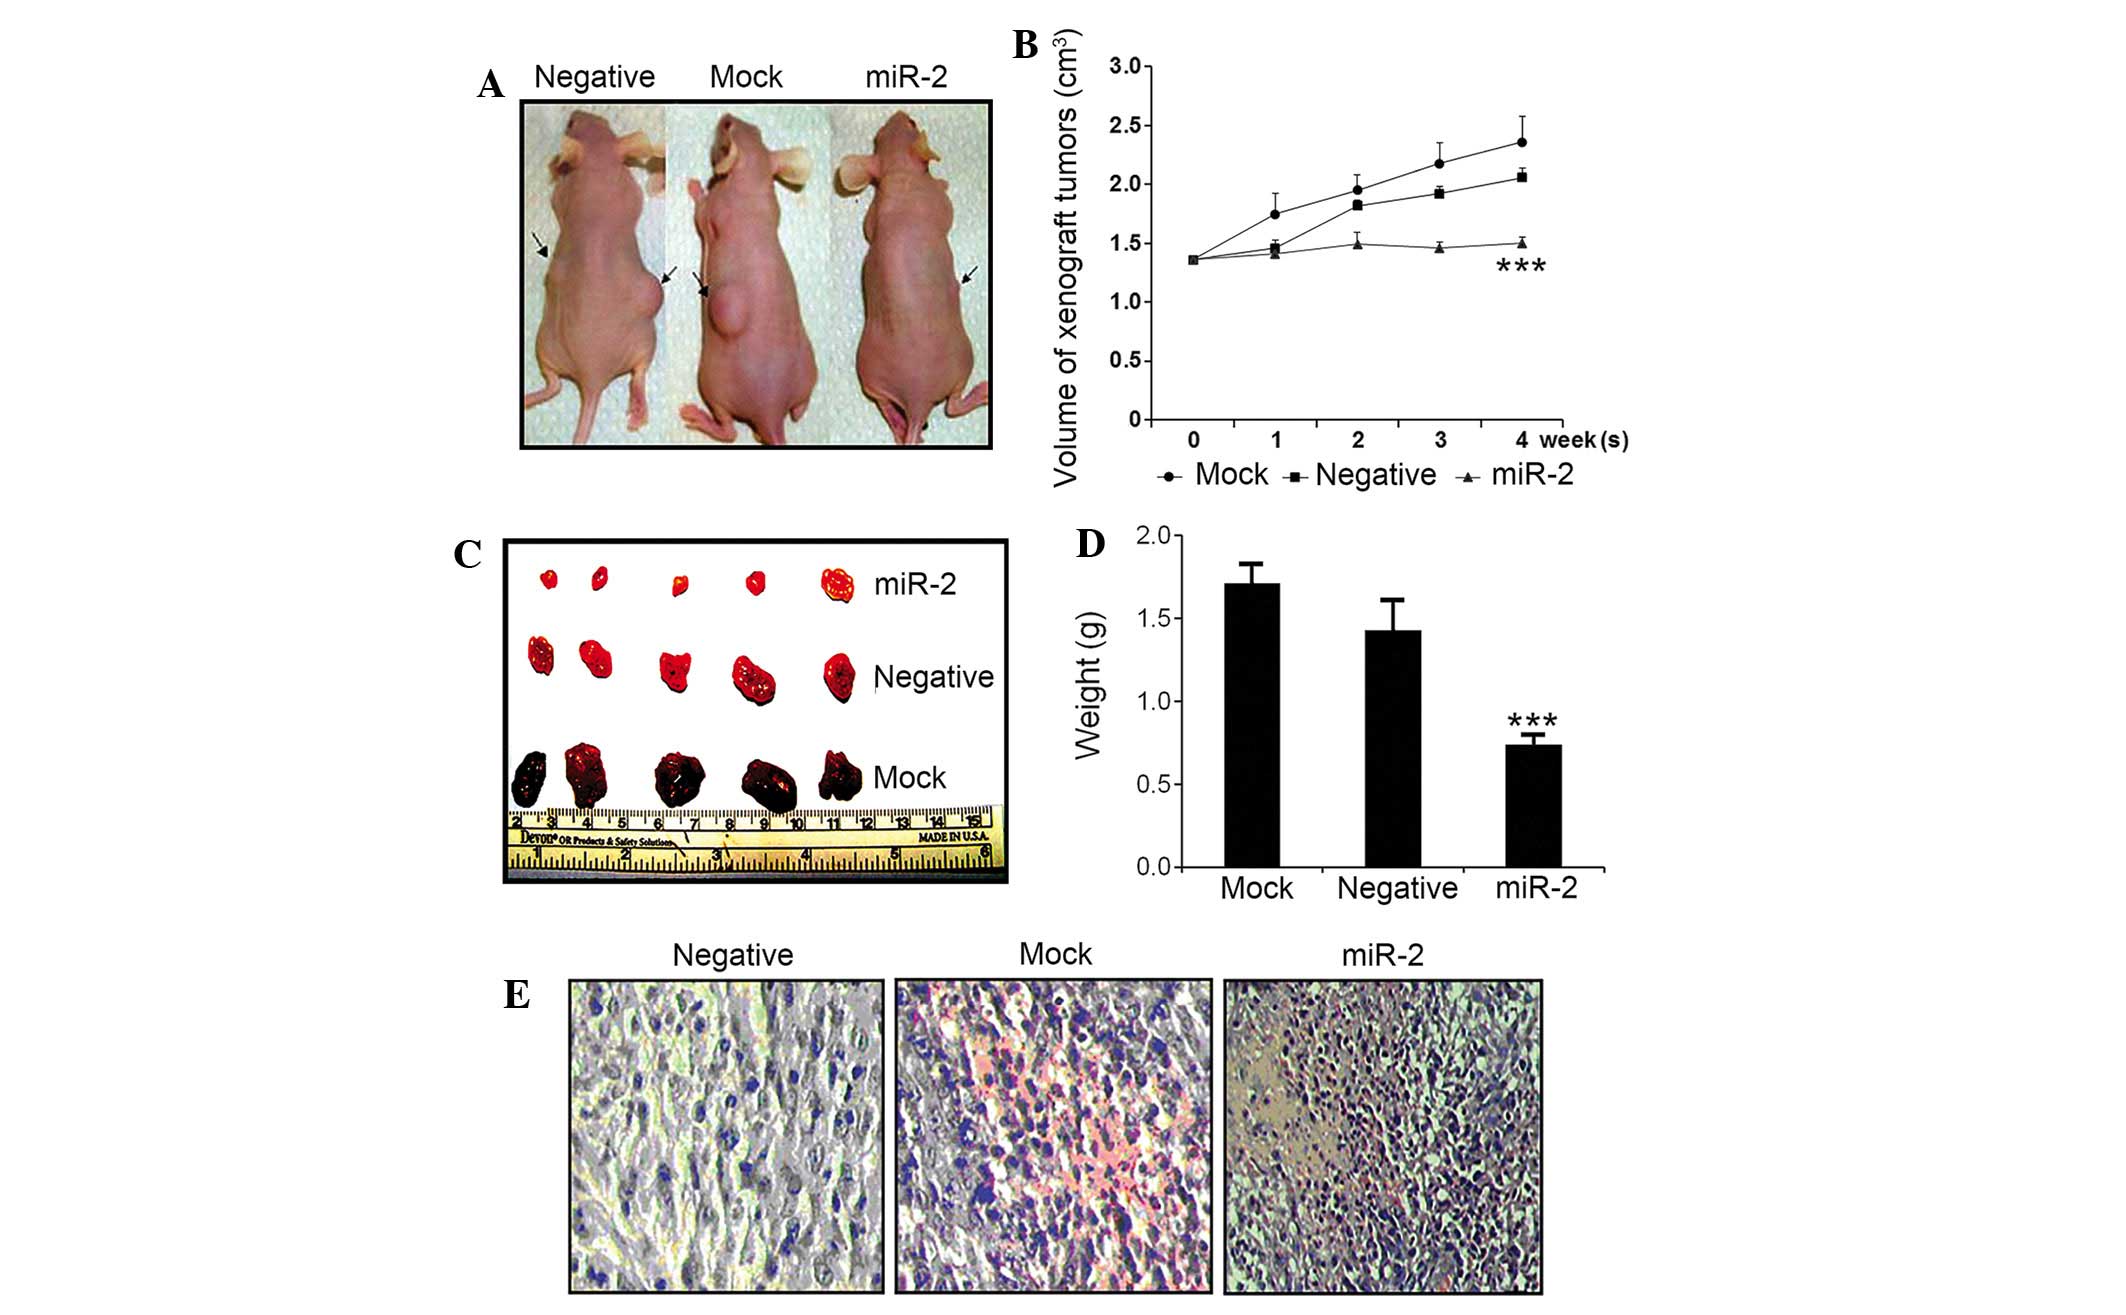
During the 4-week observation window, tumors in the
mock mouse and Neg group exhibited rapid tumor growth, and the mice
exhibited decreased activity, loss of body weight and a slow
response. However, in the miR-2 group, the tumor exhibited a lower
growth rate, and the mice exhibited free activity and quick
response rates. No mice in any group succumbed due to glioma or any
other alternative causes.
In a longitudinal examination, tumor nodules formed
~3 days subsequent to the subcutaneous injection of glioma cells.
Following 2 weeks, mock and Neg control mice, but not
miR-2-transfected mice, possessed visible tumor nodules. Subsequent
to 4 weeks, it was observed that mock mice had significantly larger
tumors compared with the Neg and miR-2 groups (Fig. 5A). Following sacrifice, the tumors
from the mock group were significantly larger in size (Fig. 5B; mock tumor size, 2.36±0.22
cm3; Neg tumor size, 1.82±0.15 cm3; miR-2
tumor size, 0.99±0.17 cm3) and weight (Fig. 5D; mock tumor weight, 1.71±0.13 g; Neg
tumor weight, 1.43±0.19 g; miR-2 tumor weight, 0.74±0.07 g)
compared with tumors from the Neg and miR-2 groups (P<0.001).
The tumor growth curve, which was plotted weekly and recorded tumor
size, also demonstrated that the slow growth of tumors in mice
injected with miR-2-transfected tumor cells was also significant
(Fig. 5B).
In additional morphological examination of the tumor
tissues using HE staining, tissue necrosis in the center of tumor
was observed in mice injected with miR-2-transfected tumor cells,
with sparsely distributed cell debris. The peripheral region of the
tumor tissues also exhibited clear edema and hemorrhage and
apoptotic features, including karyopyknosis (Fig. 5E).
Discussion
The present study successfully decreased PTTG1
expression levels in the human malignant glioma U251 cell line with
exogenous PTTG1-miRNA. The proliferation of cells transfected with
miRNA was significantly inhibited, accompanied by a slow growth of
cells, and the cells possessed a lower transmembrane potential in a
Matrigel assay. The present results support the hypothesis that
glioma cells with a lower PTTG1 expression possess decreased
invasive potential, suggesting that PTTG1 facilitates glioma
invasion.
Tumor cells have an invasive nature, as they may
penetrate the basal membrane of tissues and metastasize; therefore,
evaluation of the migration ability of cells is an important index
in the study of tumor cell invasion (16). The Matrigel cell migration assay
performed in the present study reflected the process of tumor
invasion and metastasis, including matrix degradation and cell
adhesion and migration. In vitro studies have demonstrated
that PTTG1 and basic fibroblast growth factor (b-FGF) may mutually
induce the expression of each other and form feedback loops in an
autocrine or paracrine manner (17,18). PTTG1
expression and tumor invasiveness have been observed to be
associated with the expression of b-FGF and the b-FGF receptor
FGF-R1, and also with vascular endothelial growth factor and its
receptor kinase insert domain receptor in pituitary tumors
(7). This demonstrates the close
association between PTTG1 and glioma invasion and tumor
angiogenesis, which requires additional investigation.
To study the effect of targeted silencing of the
PTTG1 gene on the apoptotic rate of cells and the cell cycle in
human malignant glioma U251 cells, the present study used Annexin V
staining to detect cell apoptosis, while PI staining was used for
cell cycle phase identification. Flow cytometry results suggested
significant U251 cell apoptosis following miRNA transfection.
Furthermore, the cells arrested at phase G2/M in the cell cycle,
suggesting that there was significant cell apoptosis and cell cycle
arrest following targeted suppression of PTTG1. These results are
consistent with previous studies in other tumor cell lines
(19,20). The possible mechanism of PTTG1 in the
process of cell apoptosis may be associated with the inhibitory
effects of PTTG1 on apoptotic factors, including p53 and caspase
family members, such as caspase 3 and caspase 7 (21). However, the elucidation of the
detailed mechanism and demonstration of similar results to the
study is required. Caspase 3 has been reported to be associated
with glioma cell apoptosis. The cytotoxic cytokine cluster of
differentiation 95 (22), tamoxifen
(23) and adenovirus-mediated
transfer of caspase 3 (24) greatly
induced apoptosis of glioma cells in combination with intracellular
Ca2+ homeostasis (25).
The upstream regulator of caspase 3 has been associated with lipid
peroxidation (26) and the Src-MAPK
signaling pathway (27). Direct
evidence was obtained in a previous RNA interference study that
targeted the caspase 3 gene, which consequently suppressed the
levels of apoptosis of human glioma cells (28). Furthermore, the
gliomagenesis-associated miR-21 is known to exert its role via the
inhibition of caspase 3 expression (29). The synergistic function of caspase 3
and p53 in etoposide-induced apoptosis has also been reported
(30). Overall, these results clearly
support the role of caspase 3 in the proliferation and apoptosis of
glioma cells.
The present study demonstrated the essential role of
PTTG1 in glioma cell proliferation and invasion, which was
supported by the inhibition of PTTG1 expression and the
corresponding suppression of U251 cell proliferation and migration.
Furthermore, a targeted suppression of PTTG1 by exogenous miRNAs
effectively induced U251 cell apoptosis and cell cycle arrest.
Additional studies are required to investigate the role of PTTG1 as
a regulator of p53 function, which may provide novel strategies for
the treatment of malignant tumors.
Acknowledgements
The present study was supported by the National
Natural Science Foundation of Jiangsu province (grant no.
BK20130386), Jiangsu Planned Projects for Postdoctoral Research
Funds (grant no. 1402200C) and Six Major Human Resources Project of
Jiangsu Province (grant no. 2014-WSW-028).
References
|
1
|
Pei L and Melmed S: Isolation and
characterization of a pituitary tumor-transforming gene (PTTG). Mol
Endocrinol. 11:433–441. 1997. View Article : Google Scholar : PubMed/NCBI
|
|
2
|
Zhang X, Horwitz GA, Prezant TR, Valentini
A, Nakashima M, Bronstein MD and Melmed S: Structure, expression,
and function of human pituitary tumor-transforming gene (PTTG). Mol
Endocrinol. 13:156–166. 1999. View Article : Google Scholar : PubMed/NCBI
|
|
3
|
Puri R, Tousson A, Chen L and Kakar SS:
Molecular cloning of pituitary tumor transforming gene 1 from
ovarian tumors and its expression in tumors. Cancer Lett.
163:131–139. 2001. View Article : Google Scholar : PubMed/NCBI
|
|
4
|
Kakar SS, Chen L, Puri R, Flynn SE and
Jennes L: Characterization of a polyclonal antibody to human
pituitary tumor transforming gene 1 (PTTG1) protein. J Histochem
Cytochem. 49:1537–1546. 2001. View Article : Google Scholar : PubMed/NCBI
|
|
5
|
Chamaon K, Kirches E, Kanakis D,
Braeuninger S, Dietzmann K and Mawrin C: Regulation of the
pituitary tumor transforming gene by insulin-like-growth factor-I
and insulin differs between malignant and non-neoplastic
astrocytes. Biochem Biophys Res Commun. 331:86–92. 2005. View Article : Google Scholar : PubMed/NCBI
|
|
6
|
Vlotides G, Cruz-Soto M, Rubinek T, Eigler
T, Auernhammer CJ and Melmed S: Mechanisms for growth
factor-induced pituitary tumor transforming gene-1 expression in
pituitary folliculostellate TtT/GF cells. Mol Endocrinol.
20:3321–3335. 2006. View Article : Google Scholar : PubMed/NCBI
|
|
7
|
Lewy GD, Ryan GA, Read ML, Fong JC, Poole
V, Seed RI, Sharma N, Smith VE, Kwan PP, Stewart SL, et al:
Regulation of pituitary tumor transforming gene (PTTG) expression
and phosphorylation in thyroid cells. Endocrinology. 154:4408–4422.
2013. View Article : Google Scholar : PubMed/NCBI
|
|
8
|
Pei L: Activation of mitogen-activated
protein kinase cascade regulates pituitary tumor-transforming gene
transactivation function. J Biol Chem. 275:31191–31198. 2000.
View Article : Google Scholar : PubMed/NCBI
|
|
9
|
Solbach C, Roller M, Peters S, Nicoletti
M, Kaufmann M and Knecht R: Pituitary tumor-transforming gene
(PTTG): A novel target for anti-tumor therapy. Anticancer Res.
25:121–125. 2005.PubMed/NCBI
|
|
10
|
Qin B, Yang H and Xiao B: Role of
microRNAs in endothelial inflammation and senescence. Mol Biol Rep.
39:4509–4518. 2012. View Article : Google Scholar : PubMed/NCBI
|
|
11
|
Saito Y and Jones PA: Epigenetic
activation of tumor suppressor microRNAs in human cancer cells.
Cell Cycle. 5:2220–2222. 2006. View Article : Google Scholar : PubMed/NCBI
|
|
12
|
Lewis BP, Burge CB and Bartel DP:
Conserved seed pairing, often flanked by adenosines, indicates that
thousands of human genes are microRNA targets. Cell. 120:15–20.
2005. View Article : Google Scholar : PubMed/NCBI
|
|
13
|
Livak and Schmittgen, . Analysis of
relative gene expression data using real-time quantitative PCR and
the 2-ΔΔCt method. Methods. 25:402–408. 2001. View Article : Google Scholar : PubMed/NCBI
|
|
14
|
Burger M, Hartmann T, Burger JA and
Schraufstatter I: KSHV-GPCR and CXCR2 transforming capacity and
angiogenic responses are mediated through a JAK2-STAT3-dependent
pathway. Oncogene. 24:2067–2075. 2005. View Article : Google Scholar : PubMed/NCBI
|
|
15
|
Xia L, Huang Q, Nie D, Shi J, Gong M, Wu
B, Gong P, Zhao L, Zuo H, Ju S, et al: PAX3 is overexpressed in
human glioblastomas and critically regulates the tumorigenicity of
glioma cells. Brain Res. 1521:68–78. 2013. View Article : Google Scholar : PubMed/NCBI
|
|
16
|
Lettau I, Hattermann K, Held-Feindt J,
Brauer R, Sedlacek R and Mentlein R: Matrix metalloproteinase-19 is
highly expressed in astroglial tumors and promotes invasion of
glioma cells. J Neuropathol Exp Neurol. 69:215–223. 2010.
View Article : Google Scholar : PubMed/NCBI
|
|
17
|
Heaney AP, Singson R, McCabe CJ, Nelson V,
Nakashima M and Melmed S: Expression of pituitary-tumour
transforming gene in colorectal tumours. Lancet. 355:716–719. 2000.
View Article : Google Scholar : PubMed/NCBI
|
|
18
|
Horwitz GA, Miklovsky I, Heaney AP, Ren SG
and Melmed S: Human pituitary tumor-transforming gene (PTTG1) motif
suppresses prolactin expression. Mol Endocrinol. 17:600–609. 2003.
View Article : Google Scholar : PubMed/NCBI
|
|
19
|
Mora-Santos M, Castilla C, Herrero-Ruiz J,
Giráldez S, Limón-Mortés MC, Sáez C, Japón MÁ, Tortolero M and
Romero F: A single mutation in Securin induces chromosomal
instability and enhances cell invasion. Eur J Cancer. 49:500–510.
2013. View Article : Google Scholar : PubMed/NCBI
|
|
20
|
Huang SQ, Liao QJ, Wang XW, Xin DQ, Chen
SX, Wu QJ and Ye G: RNAi-mediated knockdown of pituitary
tumor-transforming gene-1 (PTTG1) suppresses the proliferation and
invasive potential of PC3 human prostate cancer cells. Braz J Med
Biol Res. 45:995–1001. 2012. View Article : Google Scholar : PubMed/NCBI
|
|
21
|
Kim D, Pemberton H, Stratford AL, Buelaert
K, Watkinson JC, Lopes V, Franklyn JA and McCabe CJ: Pituitary
tumour transforming gene (PTTG) induces genetic instability in
thyroid cells. Oncogene. 24:4861–4866. 2005. View Article : Google Scholar : PubMed/NCBI
|
|
22
|
Hueber A, Winter S and Weller M:
Chemotherapy primes malignant glioma cells for CD95 ligand-induced
apoptosis up-stream of caspase 3 activation. Eur J Pharmacol.
352:111–115. 1998. View Article : Google Scholar : PubMed/NCBI
|
|
23
|
Tseng SH, Wang CH, Lin SM, Chen CK, Huang
HY and Chen Y: Activation of c-Jun N-terminal kinase 1 and caspase
3 in the tamoxifen-induced apoptosis of rat glioma cells. J Cancer
Res Clin Oncol. 130:285–293. 2004. View Article : Google Scholar : PubMed/NCBI
|
|
24
|
Shinoura N, Muramatsu Y, Yoshida Y, Asai
A, Kirino T and Hamada H: Adenovirus-mediated transfer of caspase-3
with Fas ligand induces drastic apoptosis in U-373MG glioma cells.
Exp Cell Res. 256:423–433. 2000. View Article : Google Scholar : PubMed/NCBI
|
|
25
|
Qi H, Chen HZ and Jin ZJ: Caspase 3 gene
expression and [Ca2+]i homeostasis underlying desipramine-induced
C6 glioma cell apoptosis. Acta Pharmacol Sin. 23:803–807.
2002.PubMed/NCBI
|
|
26
|
Higuchi Y and Yoshimoto T: Arachidonic
acid converts the glutathione depletion-induced apoptosis to
necrosis by promoting lipid peroxidation and reducing caspase-3
activity in rat glioma cells. Arch Biochem Biophys. 400:133–140.
2002. View Article : Google Scholar : PubMed/NCBI
|
|
27
|
Beretta F, Bassani S, Binda E, Verpelli C,
Bello L, Galli R and Passafaro M: The GluR2 subunit inhibits
proliferation by inactivating Src-MAPK signalling and induces
apoptosis by means of caspase 3/6-dependent activation in glioma
cells. Eur J Neurosci. 30:25–34. 2009. View Article : Google Scholar : PubMed/NCBI
|
|
28
|
Kugler W, Buchholz F, Köhler F, Eibl H,
Lakomek M and Erdlenbruch B: Downregulation of Apaf-1 and caspase-3
by RNA interference in human glioma cells: Consequences for
erucylphosphocholine-induced apoptosis. Apoptosis. 10:1163–1174.
2005. View Article : Google Scholar : PubMed/NCBI
|
|
29
|
Zhou X, Zhang J, Jia Q, Ren Y, Wang Y, Shi
L, Liu N, Wang G, Pu P, You Y and Kang C: Reduction of miR-21
induces glioma cell apoptosis via activating caspase 9 and 3. Oncol
Rep. 24:195–201. 2010.PubMed/NCBI
|
|
30
|
Yin D, Tamaki N and Kokunai T: Wild-type
p53-dependent etoposide-induced apoptosis mediated by caspase-3
activation in human glioma cells. J Neurosurg. 93:289–297. 2000.
View Article : Google Scholar : PubMed/NCBI
|