Introduction
In 2001, the hematopoietic and lymphoid tissue tumor
classification was revised (1) to
include the definition of a type of myeloid tumor known as
myelodysplastic/myeloproliferative neoplasm (MDS/MPN). This type of
tumor is a rare clonal myeloid neoplasm that initially presents
with overlapping myelodysplastic and myeloproliferative features
(1), with the incidence estimated at
0.1–3/100,000 individuals (2).
In 2008, the World Health Organization (WHO) further
classified MDS/MPN into four subcategories: Juvenile myelomonocytic
leukemia (JMML), atypical chronic myeloid leukemia
(BCR-ABL1_negative; aCML), chronic myelomonocytic leukemia (CMML),
and unclassifiable MDS/MPN (MDS/MPN-U) (3). It has been demonstrated that MDS/MPN is
a heterogeneous entity at various molecular and clinical levels and
has no specific molecular markers. Patients with MDS/MPN have a
relatively long survival time and there is no treatment consensus
except for the administration of allogenic hematopoietic stem cell
transplantation (allo-HSCT, which requires a match of ≥3 loci with
the HLA gene) (4). The current study
focused on the last three types of tumors, which include
hematologic malignancies that significantly harm adult
patients.
Although certain genetic mutations, including RAS,
TET2, SRF2, ASXL1, SETBP1, CSF3R, SF3B1, have been detected in
patients, MDS/MPN remains a challenging disease to diagnose due to
its heterogeneity in clinical and laboratory features (3). Examinations of peripheral blood and bone
marrow morphology are important in the diagnosis of MDS/MPN
(2). The aim of the current study was
to assess the importance of routine blood parameters in the
reliable diagnosis of MDS/MPN, by measuring white blood cell (WBC)
differential counts and the morphological features of peripheral
blood cells.
Patients and methods
Patients
Based on the 2001 and 2008 WHO hematopoietic and
lymphoid tissue tumor classifications (1,3) MDS/MPN
was diagnosed in 236 patients, including 181 males and 56 females,
between September 2002 and October 2013 at the Department of
Clinical Laboratory Medicine, Provincial Hospital Affiliated to
Shandong University (Shandong, China). There were 113 CMML, 107
aCML and 16 MDS/MPN-U cases. None of the patients were diagnosed
with myelodysplastic syndrome (MDS) or myeloproliferative neoplasms
(MPN), or had previously received cytokine therapy or cytotoxic
drugs, which may cause the manifestation of myeloproliferative or
myelodysplastic features. All patients were preliminarily diagnosed
to be free of breakpoint cluster region/abelson murine leukemia
viral oncogene homolog 1 (BCR/ABL), platelet derived growth factor
receptors (PDGFR) α and β, and fibroblast growth factor receptor 1
(FGFR1) rearrangement. The present study was conducted in
accordance with the declaration of Helsinki and with the approval
of the Ethics Committee of the Shandong Provincial Hospital
Affiliated to Shandong University. Written informed consent was
obtained from all participants.
Blood routine analysis and neutrophil
alkaline phosphatase (NAP)
Intravenous blood was collected and mixed with 2 ml
EDTA-K2 anticoagulant. Blood was analyzed using a Sysmex XE-2100™
Automated Hematology Analyzer (Shandong Zhixin Medical Equipment,
Co., Ltd., Jinan, China). Dry blood smears were stained using the
NAP method (5) and the NAP staining
kit (Shenzhen Beisuo Biotechnology Company, Shenzhen, China). The
percentage and score of NAP-positive cells was subsequently
calculated. The 12 different parameters that were measured are
presented in Table II.
 | Table II.Routine blood parameters and the NAP
scores of MDS/MPNs cases. |
Table II.
Routine blood parameters and the NAP
scores of MDS/MPNs cases.
|
| All patients | CMML | aCML | MDS/MPN-U |
|
|---|
|
|
|
|
|
|
|
|---|
| Variables | N=236 (%) | N=113 (%) | N=107 (%) | N=16 (%) | P-value |
|---|
| WBC,
×109/l |
|
|
|
| 0.02a |
| Mean ±
SD | 27.8±22.1 | 22.0±12.4 | 36.5±24.0 | 13.9±14.01 |
|
| Median
(range) | 18.0
(3.4–90.5) | 25.7
(5.0–41.2) | 31.4
(8.4–90.5) | 10.2
(3.4–60.2) |
|
| Hb, g/l |
|
|
|
| n.s |
| Mean ±
SD | 88±25.2 | 87±27.3 | 92±26.2 | 90±26.9 |
|
| Median
(range) | 88 (43–139) | 89 (43–137) | 96 (51–139) | 92 (47–158) |
|
| PLT,
×109/l |
|
|
|
| 0.04a |
| Mean ±
SD | 235±271.1 | 143±161 | 138±103.4 | 396±381.6 |
|
| Median
(range) | 116 (9–1432) | 88 (20–382) | 115 (9–412) | 249 (22–1432) |
|
| MCV, fl |
|
|
|
| 0.05 |
| Mean ±
SD | 89±15.4 | 97±11.0 | 91±14.0 | 82±6.72 |
|
| Median
(range) | 88 (60.5–125) | 95 (79–115) | 88 (65–119) | 80 (60.5–125) |
|
| RDW, % |
|
|
|
| n.s |
| Mean ±
SD | 18.2±4.46 | 18.2±3.85 | 17.5±2.28 | 18.7±6.71 |
|
| Median
(range) | 17.3
(12.5–34.5) | 18.1
(11.9–25.5) | 17.2
(12.5–22.5) | 16.7
(12.5–34.5) |
|
| PDW, % |
|
|
|
| 0.05 |
| Mean ±
SD | 13.2±3.95 | 13.5±4.31 | 12.7±4.29 | 14.6±3.17 |
|
| Median
(range) | 12.5
(6.5–21.5) | 11 (9.6–20.9) | 11.5
(6.5–21.5) | 14.5
(8.5–21.5) |
|
| Eosinophil ratio,
% |
|
|
|
| n.s |
| Mean ±
SD | 1.1±1.30 | 1.4±0.75 | 0.9±1.83 | 0.8±1.76 |
|
| Median
(range) | 0.4 (0–8) | 0.5 (0–6.3) | 0 (0–8) | 0 (0–7) |
|
| Eosinophil count,
×109/l |
|
|
|
| n.s |
| Mean ±
SD | 1.4±0.54 | 2.7±0.75 | 0.2±0.4 | 0.1±0.13 |
|
| Median
(range) | 0.8 (0–8.8) | 1.6 (0–8.8) | 0 (0–1.3) | 0 (0–0.46) |
|
| Basophil ratio,
% |
|
|
|
| n.s |
| Mean ±
SD | 0.68±0.83 | 0.49±0.20 | 0.76±1.37 | 1.51±1.80 |
|
| Median
(range) | 0.28 (0–7) | 0.45 (0–2) | 0 (0–5) | 1.05 (0–7) |
|
| Basophil count,
×109/l |
|
|
|
| n.s |
| Mean ±
SD | 0.56±0.48 | 0.94±0.45 | 0.26±0.60 | 0.003±0.008 |
|
| Median
(range) | 0.38 (0–2.6) | 0.80 (0–1.9) | 0 (0–2.6) | 0 (0–0.03) |
|
| Positive rate of
NAP, % |
|
|
|
| n.s |
| Mean ±
SD | 43±28 | 35±24 | 54±27 | 47±42 |
|
| Median
(range) | 40 (8–96) | 44 (8–72) | 57 (26–80) | 47 (10–96) |
|
| NAP score |
|
|
|
| 0.02a |
| Mean ±
SD | 96±97 | 59±51 | 96±79 | 143±143 |
|
| Median
(range) | 74 (10–365) | 40 (10–148) | 69 (34–185) | 160 (10–365) |
|
Differential count and morphological
analysis
Blood smears were stained using the Wright-Giemsa
method. A differential white blood cell count was performed using
an OLYMPUS BX51 microscope on 200 cells in the peripheral blood to
determine the blast (including myeloblast, monoblasts and
promonoblast), neutrophil precursor and monocyte percentages.
Absolute counts were subsequently calculated. Cell morphological
features were identified by staining blood films with Wright's
stain. The same experts in cytomorphology centrally reviewed each
blood slide at the time of diagnosis. The 13 measured parameters
are presented in Tables III and
IV.
| Table III.Differential counts of peripheral
blood cells in MDS/MPNs cases. |
Table III.
Differential counts of peripheral
blood cells in MDS/MPNs cases.
|
| All patients | CMML | aCML | MDS/MPN-U |
|
|---|
|
|
|
|
|
|
|
|---|
| Variables | n=236 (%) | n=113 (%) | n=107 (%) | n=16 (%) | P-value |
|---|
| Monocyte ratio,
% |
|
|
|
| 0.02a |
| Mean ±
SD | 11.1±8.92 | 24.0±8.19 | 6.4±2.61 | 6.7±5.47 |
|
|
| Median
(range) | 8.0 (1–39) | 24.0 (15–39) | 6.5 (1–10) | 5.5 (0–20) |
|
|
| Monocyte count,
×109/l |
|
|
|
| 0.02a |
| Mean ±
SD | 2.5±3.02 | 5.7±5.2 | 3.4±5.33 | 0.7±0.12 |
|
|
| Median
(range) | 1.82
(0.1–16.1) | 4.2 (1.2–16.1) | 2.0 (0.2–26.0) | 0.8 (0–1.8) |
|
|
| Blast ratio, % |
|
|
|
| 0.05 |
| Mean ±
SD | 1.7±2.13 | 0.6±1.13 | 3.5±2.20 | 0.2±0.51 |
|
|
| Median
(range) | 1 (0–9) | 0 (0–3) | 2 (0–9) | 0 (0–2) |
|
|
| Blast count,
×109/l |
|
|
|
| 0.05 |
| Mean ±
SD | 0.50±0.65 | 0.55±1.13 | 0.87±0.68 | 0.05±0.19 |
|
|
| Median
(range) | 0.19 (0–2.72) | 0 (0–3) | 0.81 (0–2.72) | 0 (0–1) |
|
|
| Neutrophil precusor
ratio, % |
|
|
|
| 0.02a |
| Mean ±
SD | 9.8±8.46 | 9.1±13.2 | 14.2±4.46 | 1.9±1.89 |
|
|
| Median
(range) | 10 (0–24) | 3 (0–20) | 14 (8–24) | 1 (0–6) |
|
|
| Neutrophil
precursor count, ×109/l |
|
|
|
| 0.02a |
| Mean ±
SD | 3.26±3.66 | 1.37±2.85 | 53.7±70.54 | 0.43±0.91 |
|
| Median
(range) | 1.98 (0–278.7) | 0.28 (0–8.8) | 9.14
(0.97–278.7) | 0.11 (1–3.6) |
|
| Table IV.Presence of morphology features of
peripheral blood cells in percentages of the MDS/MPNs cases. |
Table IV.
Presence of morphology features of
peripheral blood cells in percentages of the MDS/MPNs cases.
|
| All patients | CMML | aCML | MDS/MPN-U |
|
|---|
|
|
|
|
|
|
|
|---|
| Variables | n=236 (%) | n=113 (%) | n=107 (%) | n=16 (%) | P-value |
|---|
| Blasts | 47 | 10 | 91 | 11 | 0.002a |
| Neutrophile
precusors | 83 | 67 | 100 | 80 | n.s |
| Atypical
monocytes | 73 | 91 | 66 | 30 | 0.02a |
| Nucleus-cytoplasm
synchrony of granulocytes | 68 | 58 | 84 | 47 | 0.04a |
| Abnormal condensed
nuclear chromatin of granulocytes | 71 | 67 | 77 | 70 | n.s |
|
Hypogranulation | 87 | 87 | 88 | 87 | n.s |
| Pseudo-Pelger
cells | 60 | 51 | 67 | 80 | 0.05 |
Statistical analysis
All data were analyzed using the Statistical Package
for the Social Sciences (SPSS) for Windows ver. 19.0 (IBM SPSS,
Armonk, NY, USA). Continuous variable data are presented as mean ±
standard deviation (SD) and median and range (min-max), and count
data are expressed as percentages. A one-way analysis of variance
with a Bonferroni correction was used to compare continuous
variables among the different groups and a χ2 test was
applied to categorical variables. P<0.05 was considered to
indicate a statistically significant difference.
Results
Age and male to female (M:F) ratio of
MDS/MPN patients
Table I presents the
age and gender of the MDS/MPN patients. Median patient age was 70
years (range, 16–87) and did not differ significantly by subtype
(P>0.05). The median M:F ratio of MDS/MPN patients was 3.0:1 and
the M:F ratio of the MDS/MPN-U group differed significantly from
the other two subtypes (P=0.002; Table
I).
| Table I.Age and male to female ratio in cases
of MDS/MPN. |
Table I.
Age and male to female ratio in cases
of MDS/MPN.
|
| All patients | CMML | aCML | MDS/MPN-U |
|
|---|
|
|
|
|
|
|
|
|---|
| Parameters | n=236 | n=113 | n=107 | n=16 | P-value |
|---|
| Age, years |
|
|
|
| n.s |
| Mean ±
SD | 65.2±17.5 | 64.3±23.4 | 67±16.3 | 63.5±17.1 |
|
| Median
(range) | 70 (16–87) | 80 (18–84) | 70 (16–87) | 72 (23–81) |
| Gender |
|
|
|
| 0.002a |
| Male | 177 | 85 | 78 | 14 |
|
|
Female | 59 | 28 | 29 | 2 |
|
| Male:
female ratio | 1:3.0 | 1:3.0 | 1:2.7 | 1:7.0 |
|
Routine blood parameters of the
MDS/MPN patients
Table II presents the
routine blood parameters of the MDS/MPN patients. The median WBC
count was 18.0×10⁹/l and significantly differed by
subtype; the highest average blood counts were observed in the aCML
group, followed by CMML, and then the MDS/MPN-U group (P=0.02). The
median hemoglobin (Hb) value was 88 g/l and did not differ between
different subtypes (P>0.05). By contrast, the median platelet
(PLT) count was 116×109/l and differed significantly by
subtype; specifically, the PLT count was significantly higher in
the MDS/MPN-U group than in the other two groups (P=0.04). Median
mean corpuscular volume (MCV) level was 88 fl, however, there were
no significant differences in MCV levels among the subtypes
(P>0.05). This was also the case with median platelet
distribution width (PDW) levels. The eosinophil and basophil count
and the red blood cell distribution width (RDW) were in the normal
range and did not significantly differ among subtypes
(P>0.05).
The average positive rate and NAP score of all
patients were 40% and 74 points, respectively, and were within the
normal range. The NAP score of the MDS/MPN-U group was 160 points,
which was significantly higher than those observed in other groups
(P=0.02).
Differential count of the peripheral
blood cells
Table III presents
the peripheral blood cell differential count. The absolute count
and percentage of monocytes in the peripheral blood of MDS/MPN
patients increased significantly and differed by subtype (P=0.02,
P=0.02, respectively; CMML group>aCML group>MDS/MPN-U group).
The percentage and absolute counts of blasts in the peripheral
blood were also increased, however there were no significant
differences among the subtypes. The proportion of neutrophil
precursors in the peripheral blood increased to 10%,
(1.98×10⁹/l) and significantly differed by subtype (aCML
group>CMML group>MDS/MPN-U group; P=0.02).
Morphological features of peripheral
blood cells in MDS/MPN patients
Table IV presents the
morphological features of MDS/MPN patients. The morphological
features of peripheral blood cells were analyzed in detail and it
was observed that 47% of the patients presented with blasts and 83%
presented with neutrophile precursors. A total of 73% of all
patients presented with atypical monocytes and these abnormal cells
were most frequently observed in the CMML group (P=0.02). Moreover,
Pseudo-Pelger cells were observed in 60% of patients, most
frequently in the MDS/MPN-U group (P=0.04). Furthermore, 71% of all
patients presented with abnormal condensed nuclear chromatin and
hypogranulation in granulocytes, and 68% presented with
nucleus-cytoplasm synchrony in granulocytes, particularly in
neutrophil precusors.
Discussion
MDS/MPN is a newly defined independent hematological
malignancy. Currently, its diagnosis primarily depends on analyses
performed in the clinic and laboratory. Certain genetic
characteristics of MDS/MPN have been documented (3,4), however,
the diagnosis of this disease lacks specific markers. The present
study demonstrated that routine blood examinations, combined with
WBC differential counts and morphological analyses of peripheral
blood cells, are important in the diagnosis of MDS/MPN.
An innate characteristic of MDS/MPN is that it
exhibits overlapping dysplastic and proliferative features
simultaneously (3). In the present
study, the median age, M:F ratio, WBC count and platelet count of
all patients were 70 years, 3.0:1, 19.8×10⁹/l and
116×109/l (range, 9–1432×109/l),
respectively. These data differ slightly from that of a previous
study, which were 58 years, 1.65:1, 18.0×10⁹/l and
158×109/l, respectively (6). This difference may be due to a larger
number of patients included in the current study and the fact that
patients with JMML were excluded. Within the subtypes of MDS/MPN,
the WBC count of CMML group (25.7×10⁹/l; range,
11–23×109/l) is slightly higher than counts reported in
previous studies. The median age of CMML group was 80 years (range,
18–84 years), higher than the median ages of 57–72 years reported
in previous studies (6). In the
present study, the platelet count was 88×109/l, lower
than in previous reports where it varied from
197–220×109/l (7–10). In the aCML group, the median age, M:F
ratio, WBC count and platelet count were 70 years, 2.7:1,
31.4×10⁹/l and 115×109/l, respectively, in
the current study, whereas in previous studies, these parameters
all tended to be lower; 68–72 years, 0.85:1 to no gender tendency,
24–40.8×10⁹/l and 112×109/l, respectively
(11–16). In the MDS/MPN-U group, these
parameters were 72 years, 7.0:1, 10.2×10⁹/l and
249×109/l (ranging from 22–1432×109/l) in the
present study, whereas in previous studies, they were 68–70 years,
1.0:1–2.5:1, 7.5–17×109/l, 100–653×109/l,
respectively (6,15,17–19).
All the results suggest that MDS/MPN is a type of
disease that generally occurs in the elderly, with a high male
incidence rate (although the M:F ratio of aCML remains uncertain),
elevated counts of WBC and varying platelet counts. The WBC count
in the aCML group is higher than in the other subtypes and the
platelet counts greatly vary (range from
22–1432×109/l).
In the present study, the differential counts of
peripheral blood cells in MDS/MPN patients obtained demonstrated
that 47% of MDS/MPN patients presented with myeloblasts and 83%
presented with neutrophil precursors. The median proportion of
monocytes was elevated to 8% (1.82×10⁹/l), the median
level of blasts was 1% (0.19×10⁹/l) and the proportion
of neutrophil precursors was 10% (1.98×10⁹/l). In the
CMML group, the median proportion of monocytes was 24%
(4.2×10⁹/l), which was the highest among the three
subtypes and the median proportion of blasts and neutrophil
precursors were 0.6% and 3%, respectively. This is similar to
proportions observed within this group in previous studies
(7–10). Therefore, all results indicate the
percentage of monocytes in CMML patients is >10%, the percentage
of blasts is <5% and neutrophil precursors make up <10% in
peripheral blood.
In the current study, the median proportion of
monocytes, blasts and neutrophil precursors were 6.5%
(2.0×10⁹/l), 3.5% and 14% in the aCML group, compared
with 2.46–10%, 3.3% and 6.27–10.5%, respectively, in previous
studies (3,11–15). The
results indicate the percentage of monocytes in the peripheral
blood of aCML patients is <10% (but may exceed
1.0×10⁹/l), the percentage of blasts is <5% and the
proportion of neutrophil precursors is 5–15%. In the MDS/MPN-U
group, these parameters were 5.5% (0.8×10⁹/l), 0.2%
(0.05×10⁹/l) and 1.9% (0.43×10⁹/l) in the
present study, and were 6% (0.45×10⁹/l), 1% and 4.5% in
previous studies, respectively (6).
The results from differential counts demonstrate
that the MDS/MPN patients exhibit a high proportion of monocytes, a
low percentage of blast cells and nearly 10% neutrophil precursors.
The presence of blasts and neutrophil precursors are frequent
features in peripheral blood smears of patients with MDS/MPN and
their percentages, together with the proportion of monocytes, are
important for the diagnosis of MDS/MPN subtypes.
According to the current study, not only are the
number of WBC and proportion of monocytes and nuetrophil precursors
increased in MDS/MPN patients, their morphological features are
altered. Atypical monocytes were frequently observed, particularly
in CMML patients.
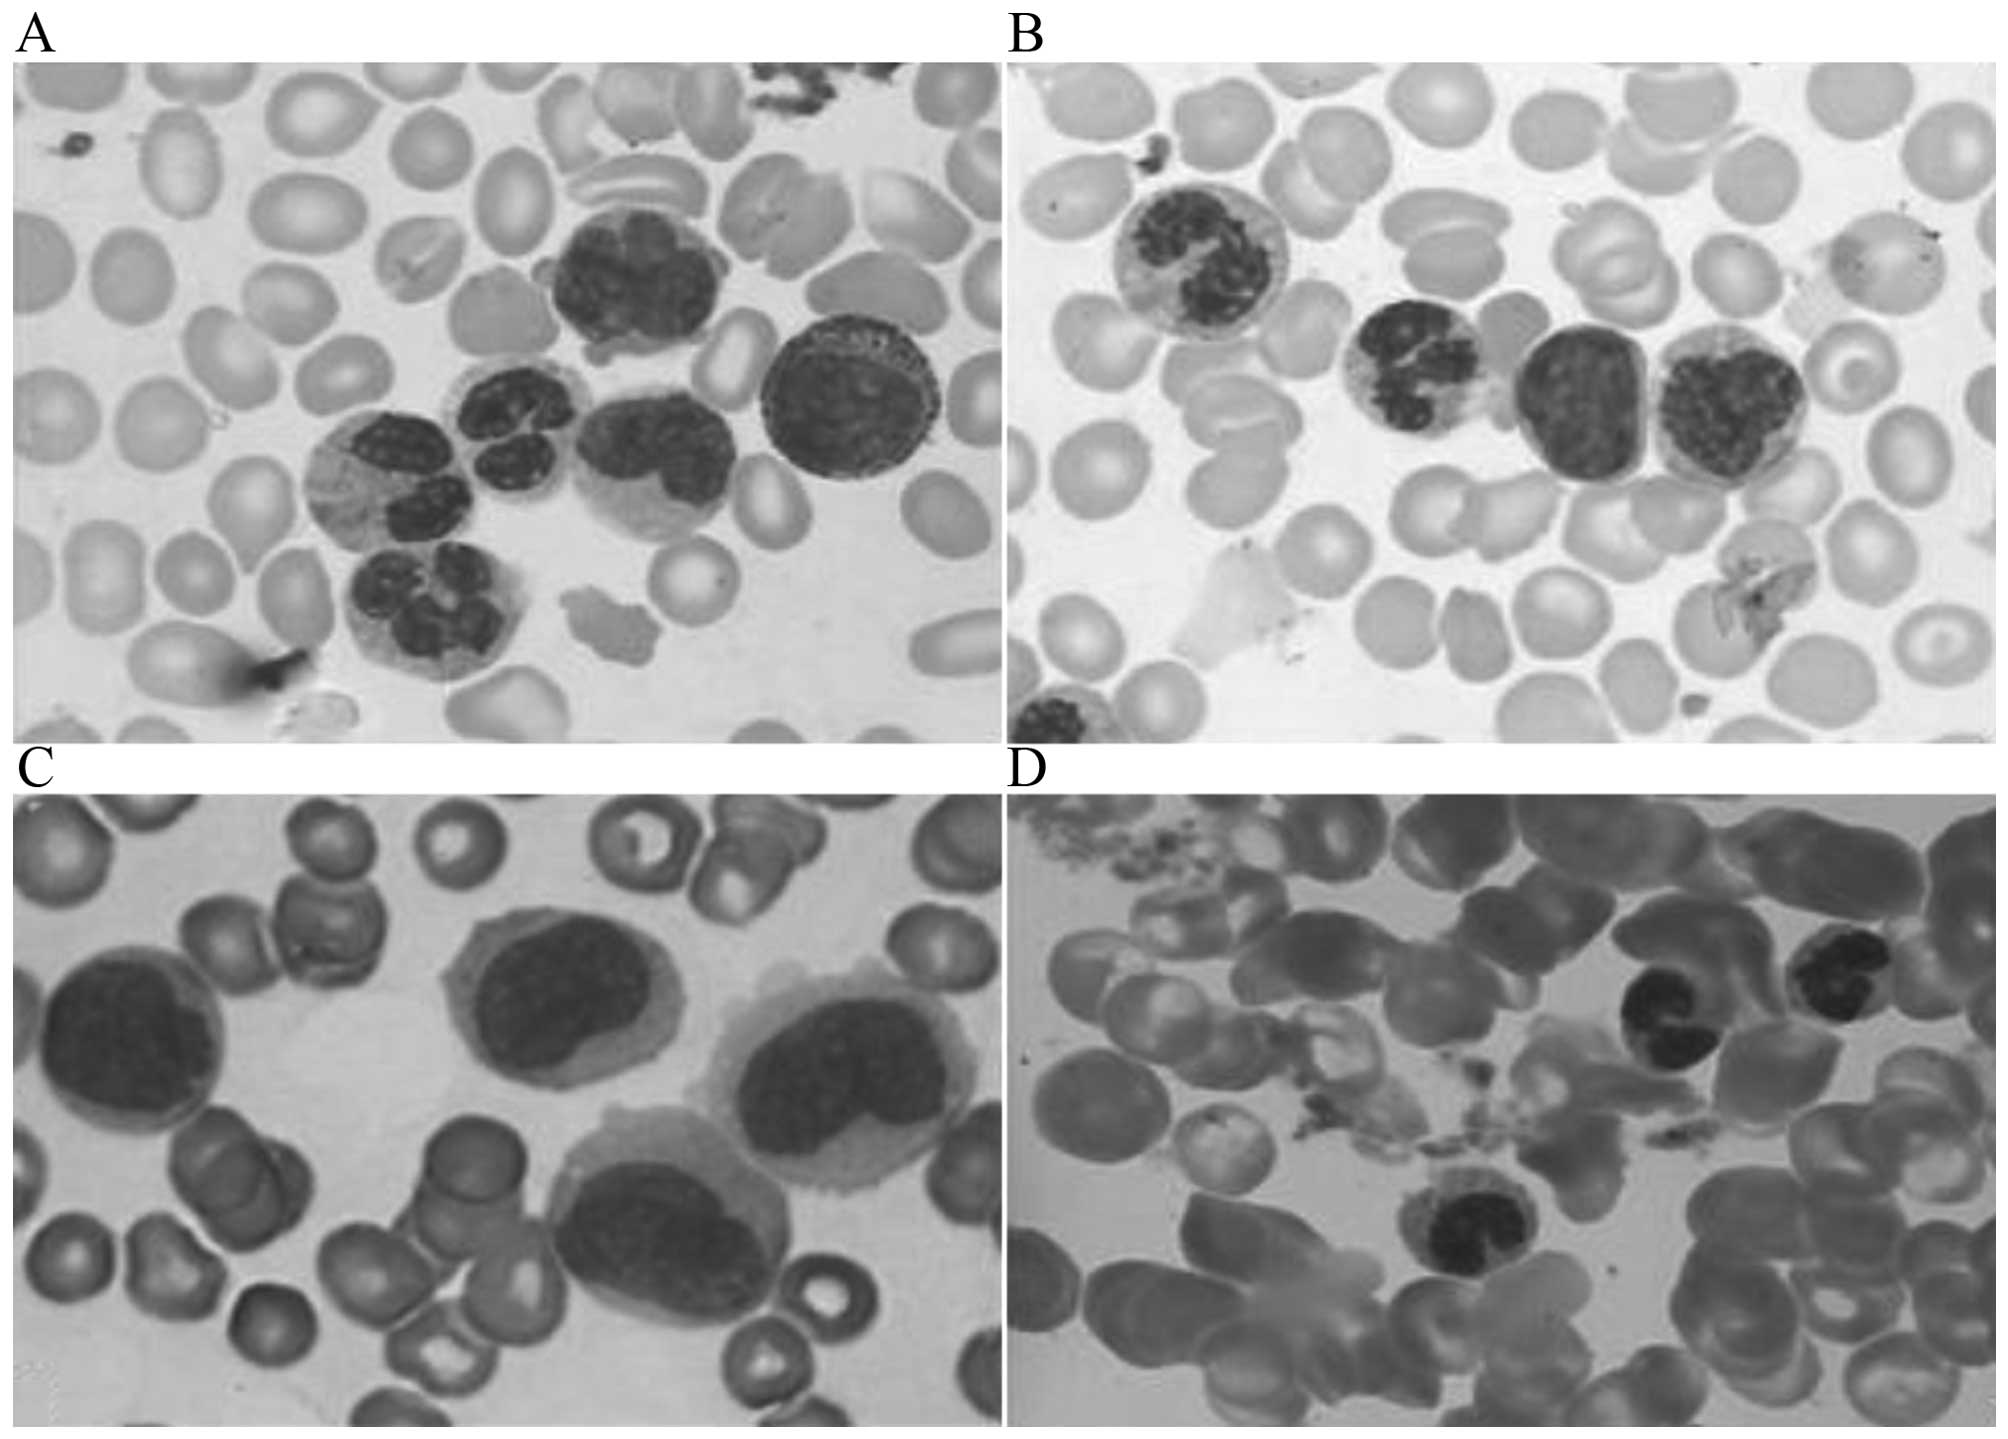
Atypical monocytes differ from promonocytes and
monoblasts. They contain no nucleolus, exhibit swelling, abnormally
folded nuclei, aggregated chromatin, nucleus-cytoplasm asynchrony,
variably basophilic plasma, hypo/hypergranulation and tumor-like
changes (20,21) (Fig. 1A and
B). Promonocytes exhibit clear nucleoli, mildly folding nuclei,
immature chromatin (particle mesh without obvious aggregation) and
a basophilic cytoplasm (Fig. 1C). By
contrast, mature monocytes exhibit an inconspicuous or absent
nucleolus, obviously folding nuclei and aggregated chromatin with a
grey-blue cytoplasm. When considering the morphology of nuclei on a
continuum, with those of mature monocytes at one end and those of
immature monocytes at the other end, the morphological features of
atypical monocyte nuclei are at the midway point.
A total of 91% of CMML patients, 66% of aCML
patients and 30% of MDS/MPN-U patients presented with atypical
monocytes. The features of atypical monocytes are important for the
characterization of MDS/MPN and its subtypes. Furthermore, accurate
identification of atypical monocytes and promonocytes is very
important when distinguishing cases of CMML from those of acute
myeloid leukemia (AML) (22).
Promonocytes are considered as ‘blast equivalents’, whereas
atypical monocytes are considered as more mature monocytes with
dysplastic features. A diagnosis of AML should be made when blasts
(including myeloblasts, monoblasts and promonocytes) ≥20% in the
peripheral blood or bone marrow, whereas blasts in MDS/MPN should
be <20%.
In the present study, it was observed that 87% of
the MDS/MPN patients presented with hypogranulation and 71% with
abnormal condensed nuclear chromatin. The present study
demonstrated that abnormally condensed chromatin is usually
presented as the uniform aggregation of accumulation of the nuclear
chromatin and is frequently noted as the patchwork of the deeper
and lighter staining region. This phenomenon was most frequently
identified in the aCML group. Hypogranulation and abnormal
condensed nuclear chromatin were the top two most frequently
observed morphological changes in the granulocytes of all patients
with MDS/MPN. As far as neutrophil precursors were concerned, in
peripheral blood, nucleus-cytoplasm asynchrony was observed in 68%
of cases. This usually presents as immature tiny chromatin,
sometimes with a nucleolus but more mature cytoplasm.
Nucleus-cytoplasm asynchrony is generally observed in the
maturation model of the nucleus and cytoplasm of the myelocytes and
metamylocytes and may be presented in the band granulocytes in
MDS/MPN. Pseudo-Pelger cells are also frequently observed on blood
slides (Fig. 1D). The present study
demonstrated that, apart from hypogranulation, nucleus-cytoplasm
asynchrony is the second most frequent detection in the aCML group
and Pseudo-Pelger cells are the second most frequent feature
observed in the MDS/MPN-U group. These morphological changes are
rarely observed in chronic infectious diseases (23).
Atypical monocytes, hypogranulation and abnormal
condensed nuclear chromatin of granulocytes, nucleus-cytoplasm
asynchrony of nuetrophil precursors and Pseudo-Pelger cells are
important morphological features in MDS/MPN peripheral blood when
diagnosing MDS/MPN and distinguishing MDS/MPN from similar diseases
(including AML and various infectious diseases). These
morphological features may also help practitioners classify
patients into the WHO subtypes of MDS/MPN.
Although bone marrow aspirates, chromosome karyotype
analyses, immunophenotype analyses and molecular biological
measurements are necessary for a conclusive diagnosis and essential
in prognosis assessments of MDS/MPN (6,24–26), routine examinations of whole blood,
combining peripheral blood parameters, differential counts and
morphological features of peripheral blood cells are the first step
and pivotal in the diagnosis and differential diagnosis of MDS/MPN
and its WHO subcategories. Early and reliable diagnoses of MDS/MPN
and its subtypes are currently only made in this manner. Increases
of WBC count, abnormalities in morphological features of white
blood cells, including a low percentage of blast cells, high
percentage of monocytes, presence of atypical monocytes and certain
dysplastic features in neuphile cells, are critical characteristics
for the early and accurate diagnosis of MDS/MPN.
Acknowledgements
The present study was partially supported by the
Construction Program of Shandong Key Clinical Laboratory [Luwei
medical no. (2013) 26] and Shandong Medicine Health Project (grant
no. 2014WSB01013). The authors would like to thank Professors BC
Zhang and ZM Lu for their careful review of the draft
manuscript.
References
|
1
|
Vardiman JW, Harris NL and Brunning RD:
The World Health Organization (WHO) classification of the myeloid
neoplasms. Blood. 100:2292–2302. 2002. View Article : Google Scholar : PubMed/NCBI
|
|
2
|
Geyer JT and Orazi A: Myeloproliferative
neoplasms (BCR-ABL1 negative) and
myelodysplastic/myeloproliferative neoplasms: Current diagnostic
principles and upcoming updates. Int J Lab Hematol. 38(Suppl 1):
S12–S19. 2016. View Article : Google Scholar
|
|
3
|
Orazi A and Germing U: The
myelodysplastic/myeloproliferative neoplasms: Myeloproliferative
diseases with dysplastic features. Leukemia. 22:1308–1319. 2008.
View Article : Google Scholar : PubMed/NCBI
|
|
4
|
Mughal TI, Cross NC, Padron E, Tiu RV,
Savona M, Malcovati L, Tibes R, Komrokji RS, Kiladjian JJ,
Garcia-Manero G, et al: An International MDS/MPN Working Group's
perspective and recommendations on molecular pathogenesis,
diagnosis and clinical characterization of
myelodysplastic/myeloproliferative neoplasms. Haematologica.
100:1117–1130. 2015. View Article : Google Scholar : PubMed/NCBI
|
|
5
|
Shibata A, Bennett JM, Castoldi GL,
Catovsky D, Flandrin G, Jaffe ES, Katayama I, Nanba K, Schmalzl F,
Yam LT, et al: Recommended methods for cytological procedures in
haematology. International Committee for Standardization in
Haematology (ICSH). Clin Lab Haematol. 7:55–74. 1985.
|
|
6
|
Wu H, Bian S, Chu J, Zhong X, Sun H, Zhang
B and Lu Z: Characteristics of the four subtypes of
myelodysplastic/myeloproliferative neoplasms. Exp Ther Med.
5:1332–1338. 2013.PubMed/NCBI
|
|
7
|
Beran M, Wen S, Shen Y, Onida F, Jelinek
J, Cortes J, Giles F and Kantarjian H: Prognostic factors and risk
assessment in chronic myelomonocytic leukemia: Validation study of
the M.D. Anderson Prognostic Scoring System. Leuk Lymphoma.
48:1150–1160. 2007. View Article : Google Scholar
|
|
8
|
Germing U, Strupp C, Knipp S, Kuendgen A,
Giagounidis A, Hildebrandt B, Aul C, Haas R, Gattermann N and
Bennett JM: Chronic myelomonocytic leukemia in the light of the WHO
proposals. Haematologica. 92:974–977. 2007. View Article : Google Scholar : PubMed/NCBI
|
|
9
|
Parikh SA and Tefferi A: Chronic
myelomonocytic leukemia: 2013 update on diagnosis, risk
stratification, and management. Am J Hematol. 87:610–619. 2012.
View Article : Google Scholar : PubMed/NCBI
|
|
10
|
Benton CB, Nazha A, Pemmaraju N and
Garcia-Manero G: Chronic myelomonocytic leukemia: Forefront of the
field in 2015. Crit Rev Oncol Hematol. 95:222–242. 2015. View Article : Google Scholar : PubMed/NCBI
|
|
11
|
Koldehoff M, Steckel NK, Hegerfeldt Y,
Ditschkowski M, Beelen DW and Elmaagacli AH: Clinical course and
molecular features in 21 patients with atypical chronic myeloid
leukemia. Int J Lab Hematol. 34:e3–e5. 2012. View Article : Google Scholar : PubMed/NCBI
|
|
12
|
Vardiman JW, Thiele J, Arber DA, Brunning
RD, Borowitz MJ, Porwit A, Harris NL, Le Beau MM,
Hellstrom-Lindberg E, Tefferi A and Bloomfield CD: The 2008
revision of the World Health Organization (WHO) classification of
myeloid neoplasms and acute leukemia: rationale and important
changes. Blood. 114:937–951. 2009. View Article : Google Scholar : PubMed/NCBI
|
|
13
|
Breccia M, Biondo F, Latagliata R,
Carmosino I, Mandelli F and Alimena G: Identification of risk
factors in atypical chronic myeloid leukemia. Haematologica.
91:1566–1568. 2006.PubMed/NCBI
|
|
14
|
Xubo G, Xingguo L, Xianguo W, Rongzhen X,
Xibin X, Lin W, Lei Z, Xiaohong Z, Genbo X and Xiaoying Z: The role
of peripheral blood, bone marrow aspirate and especially bone
marrow trephine biopsy in distinguishing atypical chronic myeloid
leukemia from chronic granulocytic leukemia and chronic
myelomonocytic leukemia. Eur J Haematol. 83:292–301. 2009.
View Article : Google Scholar : PubMed/NCBI
|
|
15
|
Wang SA, Hasserjian RP, Fox PS, Rogers HJ,
Geyer JT, Chabot-Richards D, Weinzierl E, Hatem J, Jaso J,
Kanagal-Shamanna R, et al: Atypical chronic myeloid leukemia is
clinically distinct from unclassifiable
myelodysplastic/myeloproliferative neoplasms. Blood. 123:2645–2651.
2014. View Article : Google Scholar : PubMed/NCBI
|
|
16
|
Onida F, Ball G, Kantarjian HM, Smith TL,
Glassman A, Albitar M, Scappini B, Rios MB, Keating MJ and Beran M:
Characteristics and outcome of patients with Philadelphia
chromosome negative, bcr/abl negative chronic myelogenous leukemia.
Cancer. 95:1673–1684. 2002. View Article : Google Scholar : PubMed/NCBI
|
|
17
|
Triantafyllidis I, Ciobanu A, Stanca O,
Draghici C, Angelescu S and Tapelea E: Peculiarities in the
Diagnosis Approach of MDS/MPN-U Patients. Maedica (Buchar).
7:173–176. 2012.PubMed/NCBI
|
|
18
|
Seo JY, Lee KO, Kim SH, Kim K, Jung CW,
Jang JH and Kim HJ: Clinical significance of SF3B1 mutations in
Korean patients with myelodysplastic syndromes and
myelodysplasia/myeloproliferative neoplasms with ring sideroblasts.
Ann Hematol. 93:603–608. 2014. View Article : Google Scholar : PubMed/NCBI
|
|
19
|
DiNardo CD, Daver N, Jain N, Pemmaraju N,
Bueso-Ramos C, Yin CC, Pierce S, Jabbour E, Cortes JE, Kantarjian
HM, et al: Myelodysplastic/myeloproliferative neoplasms,
unclassifiable (MDS/MPN, U): Natural history and clinical outcome
by treatment strategy. Leukemia. 28:958–961. 2014. View Article : Google Scholar : PubMed/NCBI
|
|
20
|
Hyjek E and Vardiman JW:
Myelodysplastic/myeloproliferative neoplasms. Semin Diagn Pathol.
28:283–297. 2011. View Article : Google Scholar : PubMed/NCBI
|
|
21
|
Goasguen JE, Bennett JM, Bain BJ, Vallespi
T, Brunning R and Mufti GJ: International Working Group on
Morphology of Myelodysplastic Syndrome: Morphological evaluation of
monocytes and their precursors. Haematologica. 94:994–997. 2009.
View Article : Google Scholar : PubMed/NCBI
|
|
22
|
Hall J and Foucar K: Diagnosing
myelodysplastic/myeloproliferative neoplasms: Laboratory testing
strategies to exclude other disorders. Int J Lab Hematol.
32:559–571. 2010. View Article : Google Scholar : PubMed/NCBI
|
|
23
|
Vermi W, Facchetti F, Rosati S, Vergoni F,
Rossi E, Festa S, Remotti D, Grigolato P, Massarelli G and Frizzera
G: Nodal and extranodal tumor-forming accumulation of plasmacytoid
monocytes/interferon-producing cells associated with myeloid
disorders. Am J Surg Pathol. 28:585–595. 2004. View Article : Google Scholar : PubMed/NCBI
|
|
24
|
Tiu RV and Sekeres MA: Making sense of the
myelodysplastic/myeloproliferative neoplasms overlap syndromes.
Curr Opin Hematol. 21:131–140. 2014. View Article : Google Scholar : PubMed/NCBI
|
|
25
|
Cazzola M, Malcovati L and Invernizzi R:
Myelodysplastic/myeloproliferative neoplasms. Hematology Am Soc
Hematol Educ Program. 2011:264–272. 2011.PubMed/NCBI
|
|
26
|
Kern W, Bacher U, Schnittger S, Alpermann
T, Haferlach C and Haferlach T: Multiparameter flow cytometry
reveals myelodysplasia-related aberrant antigen expression in
myelodysplastic/myeloproliferative neoplasms. Cytometry B Clin
Cytom. 84:194–197. 2013. View Article : Google Scholar : PubMed/NCBI
|