Introduction
Osteosarcoma (OS) is the most common pediatric
orthopedic malignant tumor. The latest research shows that loss of
regulation of the immune system is likely to be one of the most
important mechanisms of occurrence for this disease (1). Programmed cell death 1 (PD-1), also
known as PDCD1 or CD279, is a member of the CD28 family, and is
expressed on the surface of activated T cells, B cells, dendritic
cells and macrophages (2,3). Studies have shown that the resistance of
PD-1 antibodies play an important role in cancer treatment and
immune stimulation, and that the inhibitory effect of PD-1 on
immune cells occurs mainly by inhibiting the inflammatory reaction
process of the T cells, infection and immunity (1–3). When the
PD-1 receptors of the T cell surface combine with PD-1 ligand 1
(PD-L1) and PD-L2 on its target protein chain, the intracellular
phosphorylation of PD1 triggers the accumulation of phosphokinases.
For example, tyrosine-protein phosphatase non-receptor type 11
inhibits T-cell receptor signaling pathways, blocking the PD-1
channel, which can strengthen the antitumor immune responses,
reduce the number of inhibitory T cells, and enhance the activity
of T-cell active factor and the organization of the anti-tumor
microenvironment (4–6). By inhibiting the PD-1 channel, the
activity of natural killer cells is also strengthened, prompting
the generation of PD-1 B cell antibodies. PD-1 and its synergistic
inhibition factors, including cytotoxic T-cell antigen 4, T-cell
immune globulin, mucins area 3, are the most common checkpoint
molecules. These molecules play the role of the ‘toll station’,
estimating extracellular signal information, and deciding whether
the cell cycle or other activities in the cell can proceed. Hence,
there is a close association with tumor progression (7,8). At the
same time, a number of studies have confirmed that cells exist in
bone sarcoma tissues that are similar to stem cells and have
potential for pluripotent differentiation, which is associated with
the invasion and progress of the tumor (7,8). The
present study aimed to investigate the association between PD-1 and
OS stem cells, in order to provide guidance to the use of targeted
therapy in OS.
Materials and methods
Sorting and identification of OS
series cancer stem cells
MG63 cells were purchased from the American Type
Culture Collection (Manassas, VA, USA), and cultured in Dulbecco's
modified Eagle's medium (DMEM)/F12 medium containing 10% fetal
bovine serum at room temperature and 5% CO2 for 10
generations. To form OS spheres (>50 cells), the MG63 cells were
cultured at room temperature in DMEM/F12 serum free medium with
epidermal growth factor (EGF; 10 ng/ml), basic fibroblast growth
factor (bFGF; 10 ng/ml) and N2 additives (20% N2) in a low adhesion
cell culture plate suspension for 7–12 days. The OS cells were
removed, and added to the serum-free suspension medium, and then it
was observed whether cells were able to reform spheres. The OS cell
sphere vaccinate was added into a culture environment (room
temperature) containing serum OS and growth was observed. Bone
sarcoma MG63 cells and OS cells were collected subsequent to being
cultured in a serum-free suspension for 7–10 days. MG63 cells
(1×10⁵) and stem cells in OS cell spheres were analyzed
and compared for the expression of associated surface markers, such
as CD133 (examined using rabbit anti-human CD133 polyclonal
antibody; dilution, 1:3,000; catalog no., ab19898; Abcam,
Cambridge, MA, USA), as determined by flow cytometry (FCM). Bone
sarcoma MG63 cells and OS cells were collected subsequent to being
cultured in a serum-free suspension for 7–10 days, and then the
growth situation of the MG63 cells and OS cell spheres was detected
following incubation with EGF (10 ng/ml), bFGF (10 ng/ml) and N2
additives (20% N2) in DMEM/F12 serum-free medium from days 1–7, and
the growth curve was depicted.
FCM detects the expression of PD-1 on
the membrane surface of OS tumor stem cells
The OS cancer stem cells were stained with
phycoerythrin (PE)-labeled PD-1 at 4°C for 20 min in the dark.
PE-labeled mouse anti-human immunoglobulin G was used as an isotype
control, detecting the expression of PD-1 protein in the cell
membrane. The cells were flushed using 0.1% calf serum
phosphate-buffered saline solution at 48°C, incubated and then
added to the 10-ml antibodies. FACS Vantage (BD Biosciences,
Franklin Lakes, NJ, USA) and Epics XL (BD Biosciences) instruments
were used for data analysis. PE-conjugated mouse anti-human CD133
(clone AC133/1; dilution, 1:3,000; catalog no., 130-098-826;
Miltenyi Biotec, Bergisch Gladbach, Germany), mouse anti-human CD34
(clone AC136; dilution, 1:3,000; catalog no., 130-098-140; Miltenyi
Biotec), mouse anti-human CD117 (clone A3C6E2; dilution, 1:3,000;
catalog no., 130-098-212; Miltenyi Biotec), mouse anti-human CD24
(clone 32D12; dilution, 1:3,000; catalog no., 130-098-861; Miltenyi
Biotec), mouse anti-human CD90 (clone DG3; dilution, 1:3,000;
catalog no., 130-097-932; Miltenyi Biotec), mouse anti-human CD29
(clone TS2/16; dilution, 1:3,000; catalog no., 130-101-275;
Miltenyi Biotec), monoclonal mouse anti-human CD44 (dilution,
1:3,000; catalog no., ab46793; Abcam), monoclonal mouse anti-human
CD105 (dilution, 1:3,000; ab53321; Abcam) and monoclonal mouse
anti-human CD271 (dilution, 1:3,000; catalog no., ab157333; Abcam)
antibodies were used. Isolated cells were stained on ice for 30
min.
Reverse transcription-polymerase chain
reaction (RT-PCR)
The OS cell spheres were collected using TRIzol to
extract total mRNA, according to the manufacturer's instructions in
the Takara retrovirus kit (Takara Bio Inc., Otsu, Japan). mRNA (2
µg) was reverse-transcribed into cDNA by using 1 µl reverse
transcription reaction product with 20 µl (10 pmol) primers using a
PCR machine (5331 MasterCycler; Eppendorf, Hamburg, Germany). All
reverse transcription reaction reagents were part of the RevertAid
First Strand cDNA Synthesis kit (Thermo Fisher Scientific, Inc.,
Waltham, MA, USA). Reagents for PCR, including DNA polymerase,
dNTPs, primers, buffer and DNase were part of the QuantiTect SYBR
Green PCR kit (Qiagen GmbH, Hilden, Germany). The amplification
protocols were as follows: 94°C for 30 sec, followed by annealing
at 60°C for 30 sec and extension at 72°C for 60 sec for a total of
30 cycles. β-actin was used as a loading control. The primer
sequences were as follows: Oct3/4 forward,
5′-TGGAGAAGGAGAAGCTGGAGCAAAA-3′ and reverse,
5′-GGCAGAGGTCGTTTGGCTGAATAGACC-3′; nanog forward,
5′-TCCTCCTCTTCCTCTATACTAAC-3′ and reverse,
5′-CCCACAATCACAGGCATAG-3′); nestin forward,
5′-GAGGACCAGAGTATTGTGAGAC-3′ and reverse,
5′-CACAGTGGTGCTTGAGTTTC-3′; MDR1 forward,
5′-TTCAAACTTGTCACAATGCAGACAGCAGGA-3′ and reverse,
5′-GGTTGCAGGCCTCCATTTATAATGGCACAA-3′; PD-1 forward,
5′-CCCAAGGCGCAGATCAA-3′ and reverse, 5′-GCACTTCTGCCCTTCTCTCTGT-3′;
CD133 forward, 5′-GCACTCTATACCAAAGCGTCAA-3′ and reverse,
5′-CTCCCATACTTCTTAGTTTCCTCA-3′; and β-actin forward,
5′-GCGGGAAATCGTGCGTGACATT-3′ and reverse,
5′-GGCAGATGGTCGTTTGGCTGAATA-3′. The PCR reaction was repeated at
least 6 times.
Following electrophoresis on 1.4% agarose gels (with
ethidium bromide), the gel images of each PCR product were
digitally captured with a charge-coupled device camera and analyzed
with the ImageJ version 1.45 (imagej.nih.gov/ij/).
Statistical analysis
SPSS 16.0 software (SPSS Inc., Chicago, IL, USA) was
used for data analysis. Student's t-test was used for comparative
analysis between two groups. Data is presented as the mean ±
standard deviation. P<0.05 was used to indicate a statistically
significant difference.
Results
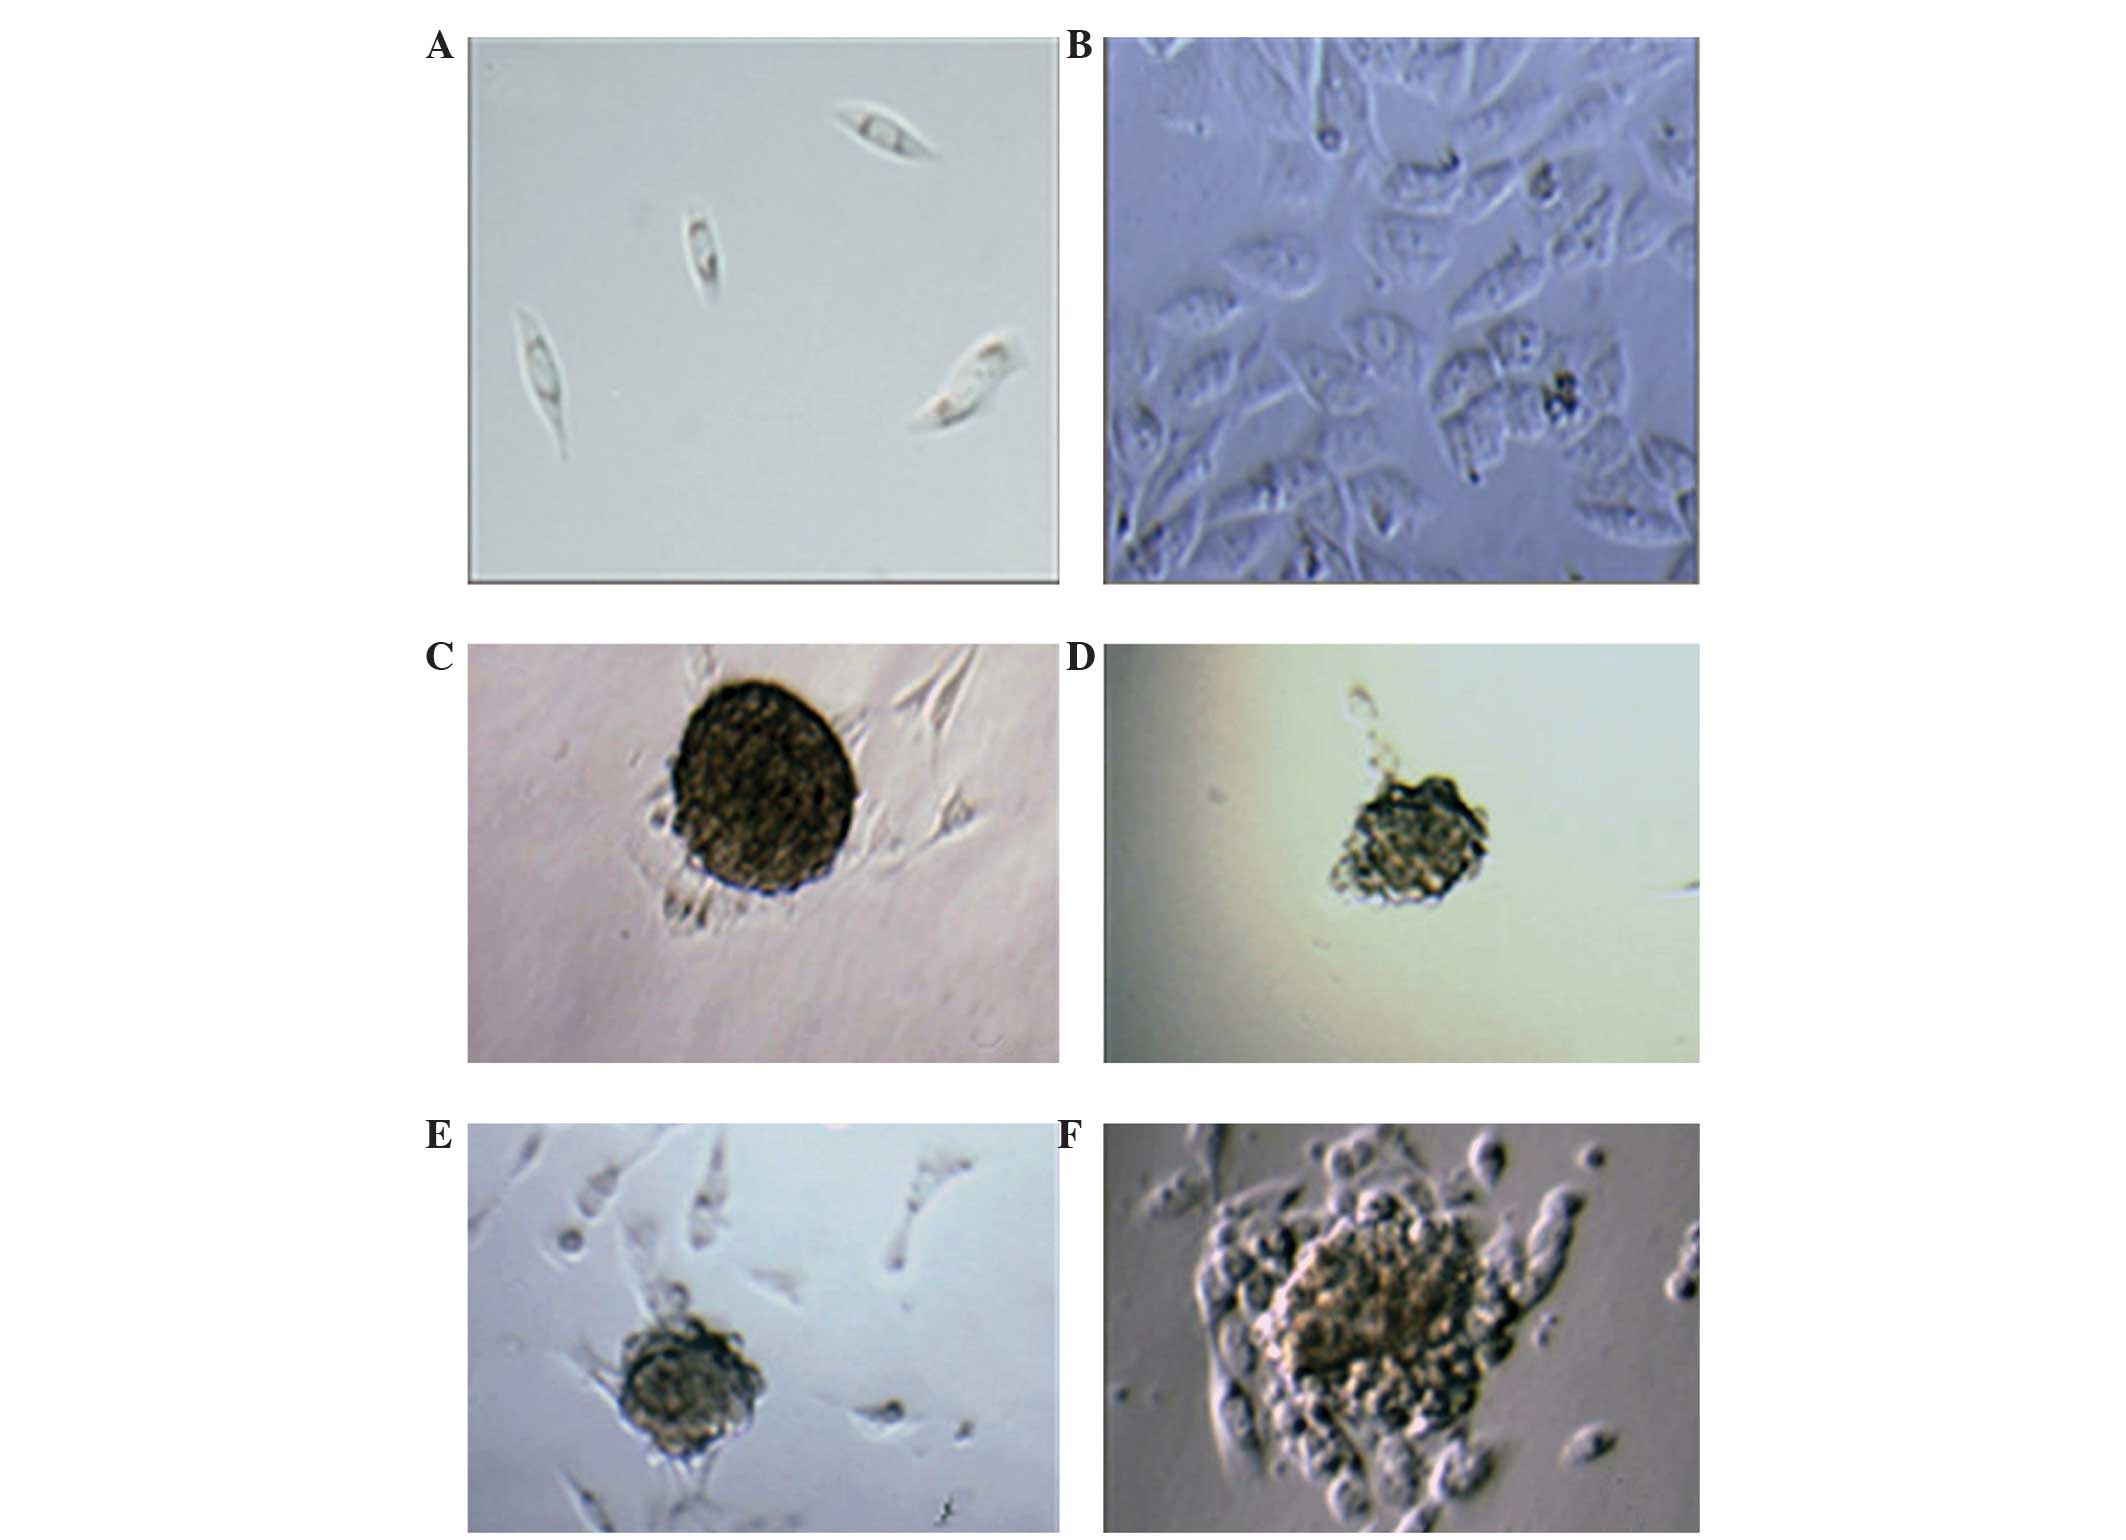
Proliferation of OS cells
The majority of cells were fusiform or polygon in
shape, with no contact inhibition. As shown in Fig. 1A and B, obvious cancer cell
proliferation was detected within 1 week, indicating their strong
proliferation and aggressive ability. The MG-63 cells were either
trained in medium containing 10% fetal bovine serum or in
serum-free medium for 10 days to form tumor cell spheres (Fig. 1C and D). The former number of cancer
cells and the volume of tumor formation were significantly
increased. If we remove the spheres of the OS cells and add them to
the serum-free suspension culture medium, there was no obvious
formation of tumor cell spheres 12 days later. With the OS cell
spheres vaccinated to a serum-containing culture environment,
marked proliferation of cancer cells and formation of tumor cell
spheres was evident, and at the same time around 12 days, the
cancel cells were spreading and invading their surroundings
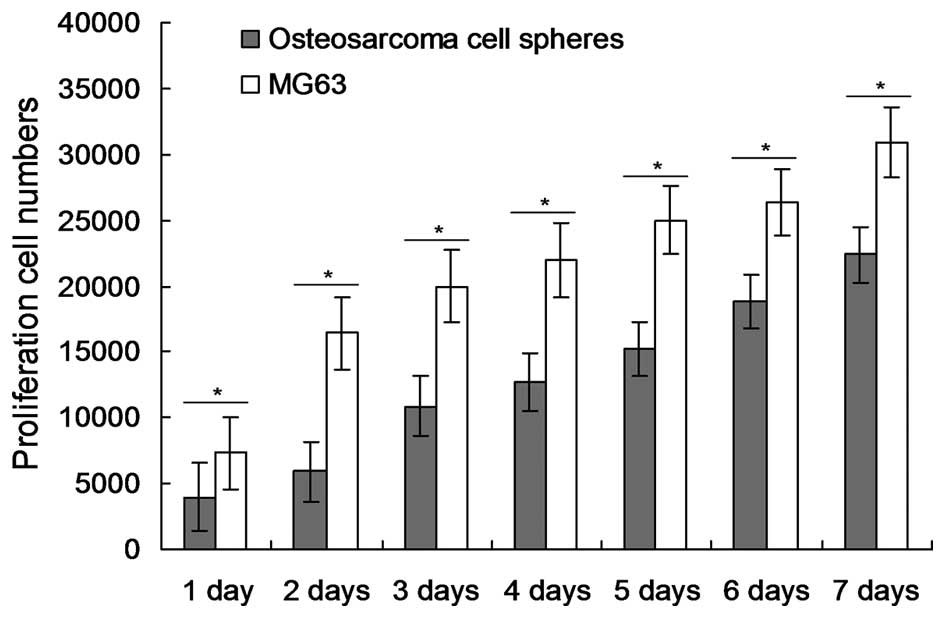
(Fig. 1E and F). Counting MG63 cells
and OS cell spheres cultured for 1–7 days within serum-free
suspension showed similar results to those observed by microscopy,
with the proliferation number of MG63 cells in the serum culture
medium being significantly higher than the cell spheres (P=0.031,
0.021, 0.019, 0.014, 0.015, 0.034 and 0.045 for days 1 to 7,
respectively, for the MG63 cells compared with the osteosarcoma
cell spheres; Fig. 2).
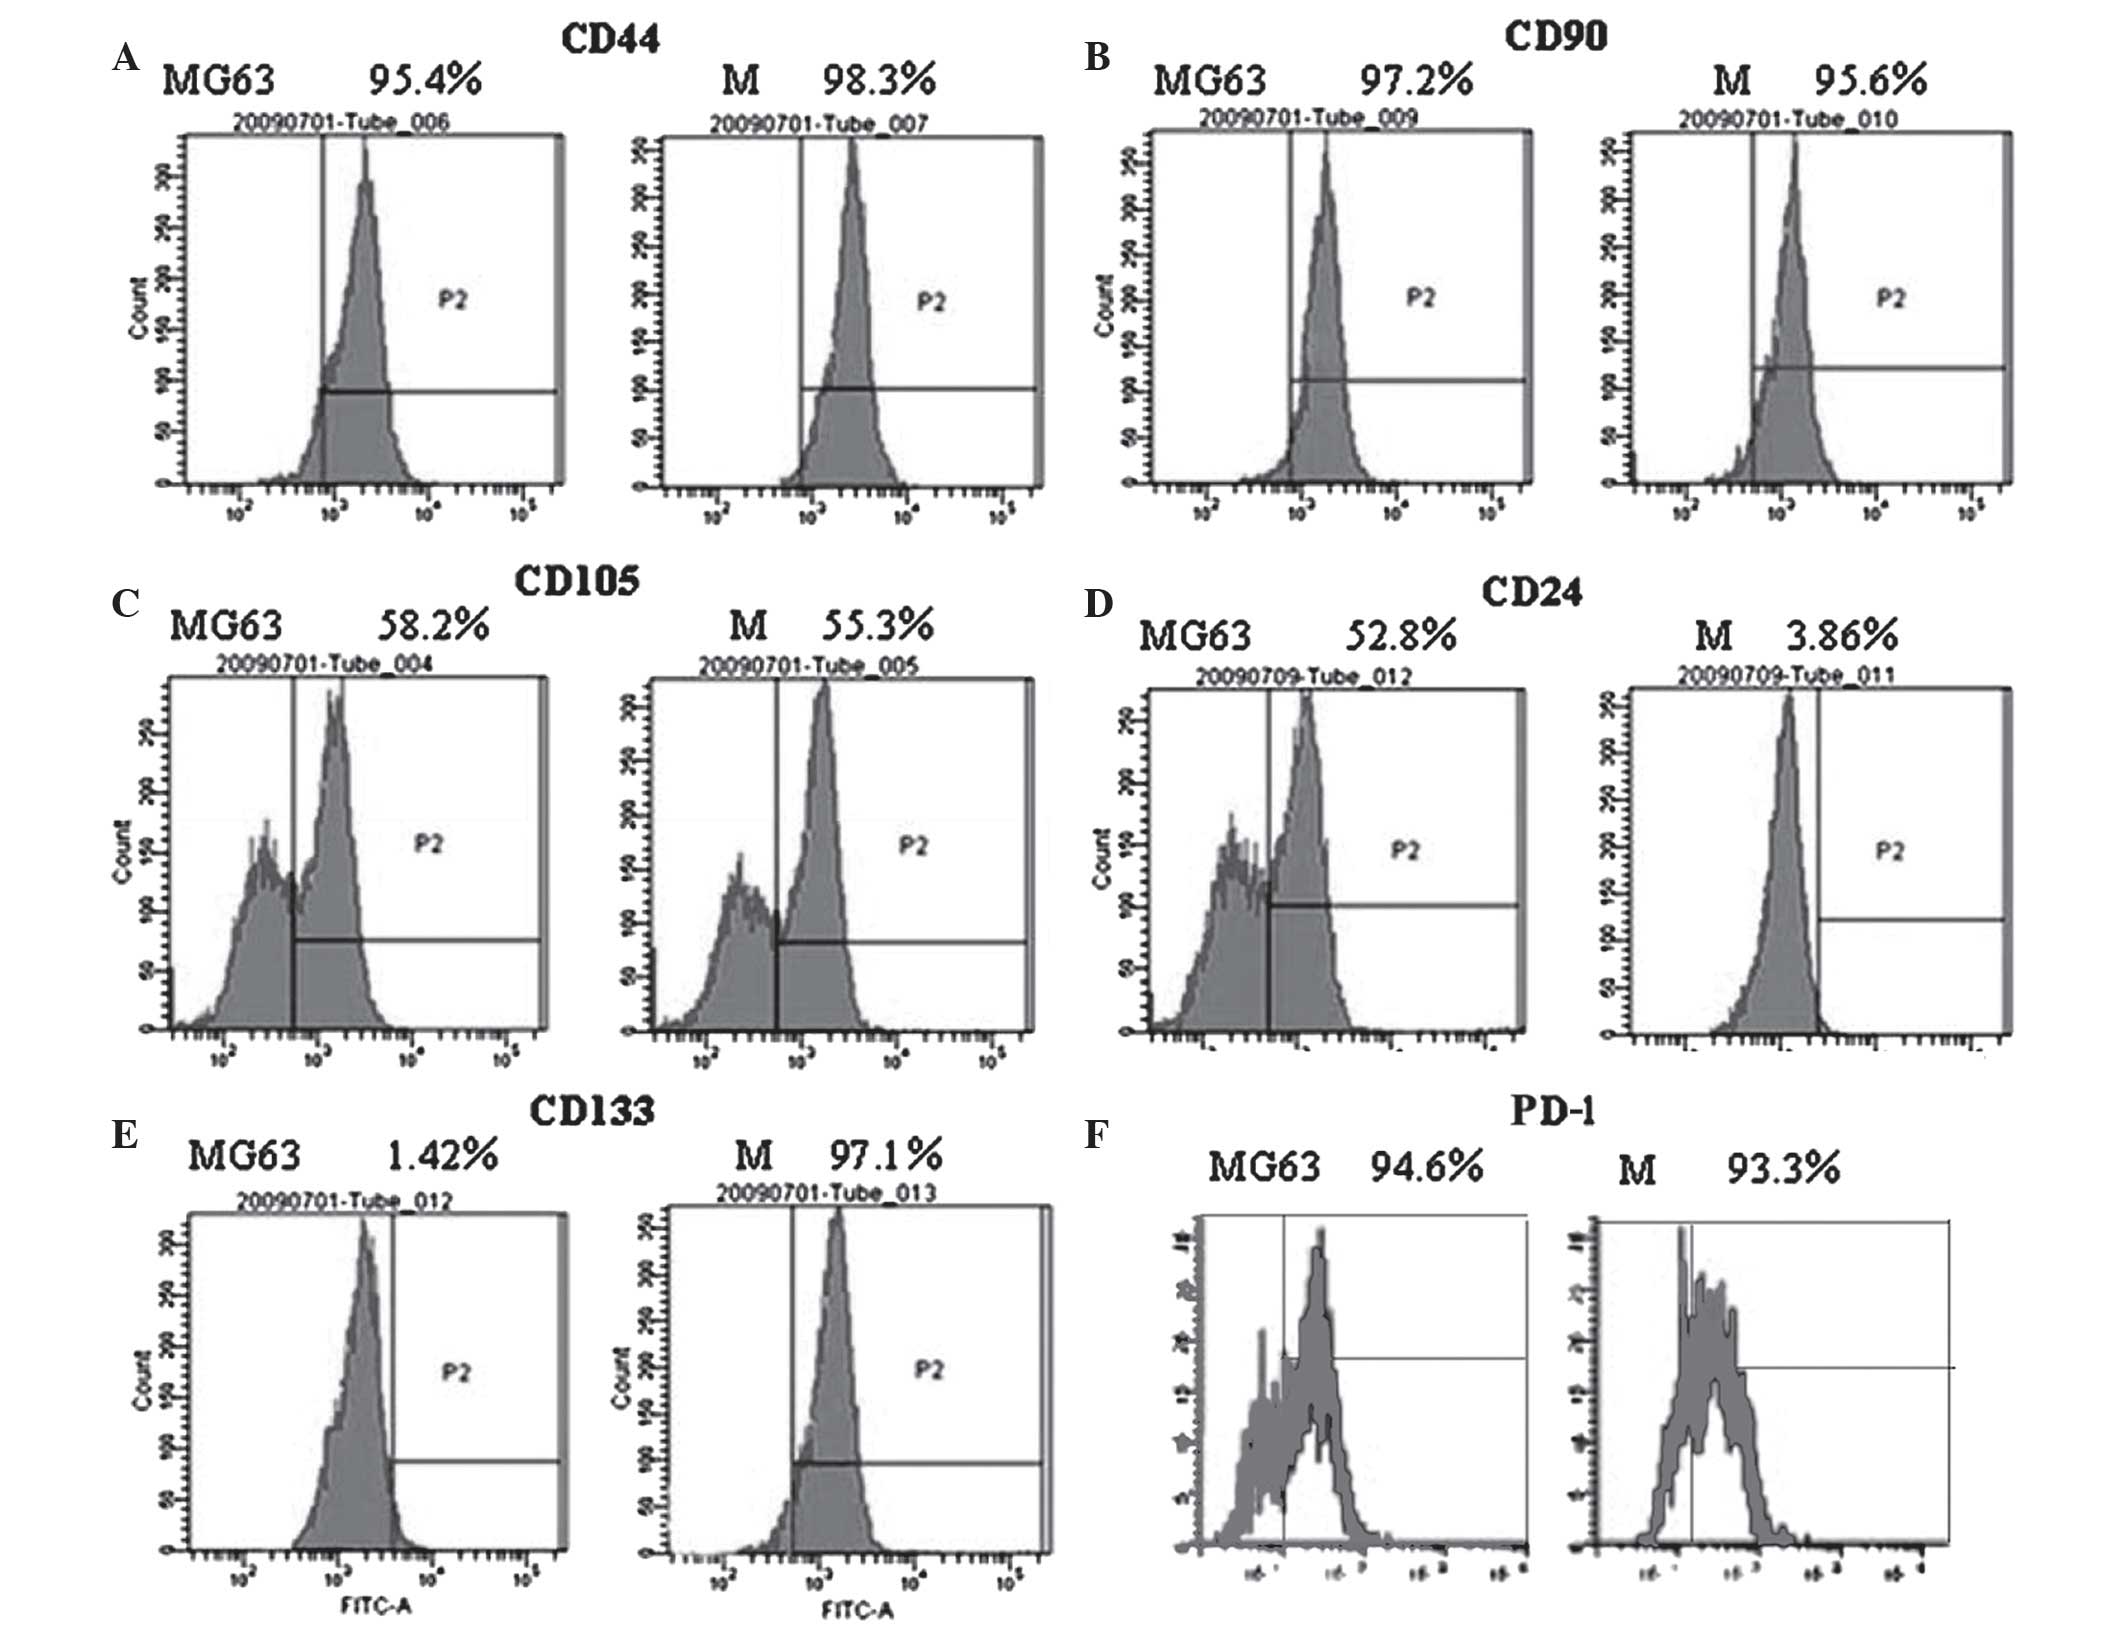
Detection of stem cell surface markers
by FCM
Surface marker expression of ectomesenchymal stem
cells (CD105, CD90, CD44, CD29), hematopoietic stem cells (CD34,
CD133) and epithelial stem cells (CD24) was determined by flow
cytometry. The study failed to detect CD34, CD31 and CD105
expression in the MG63 cells and the cancer spheres. The expression
of CD90 and CD44 was significantly increased in the two cell types.
CD29 expression in the cancer cell spheres was higher than that in
the MG63 cells, while CD24 expression was highest in the MG63
cells. The expression level of the stem cell marker CD133 in the
spheres was significantly higher than that in the MG63 cells, which
is consistent with the results of the RT-PCR. Meanwhile, the
expression of PD-1 in the cancer cell spheres was increased
compared to the MG63 cells (Fig.
3).
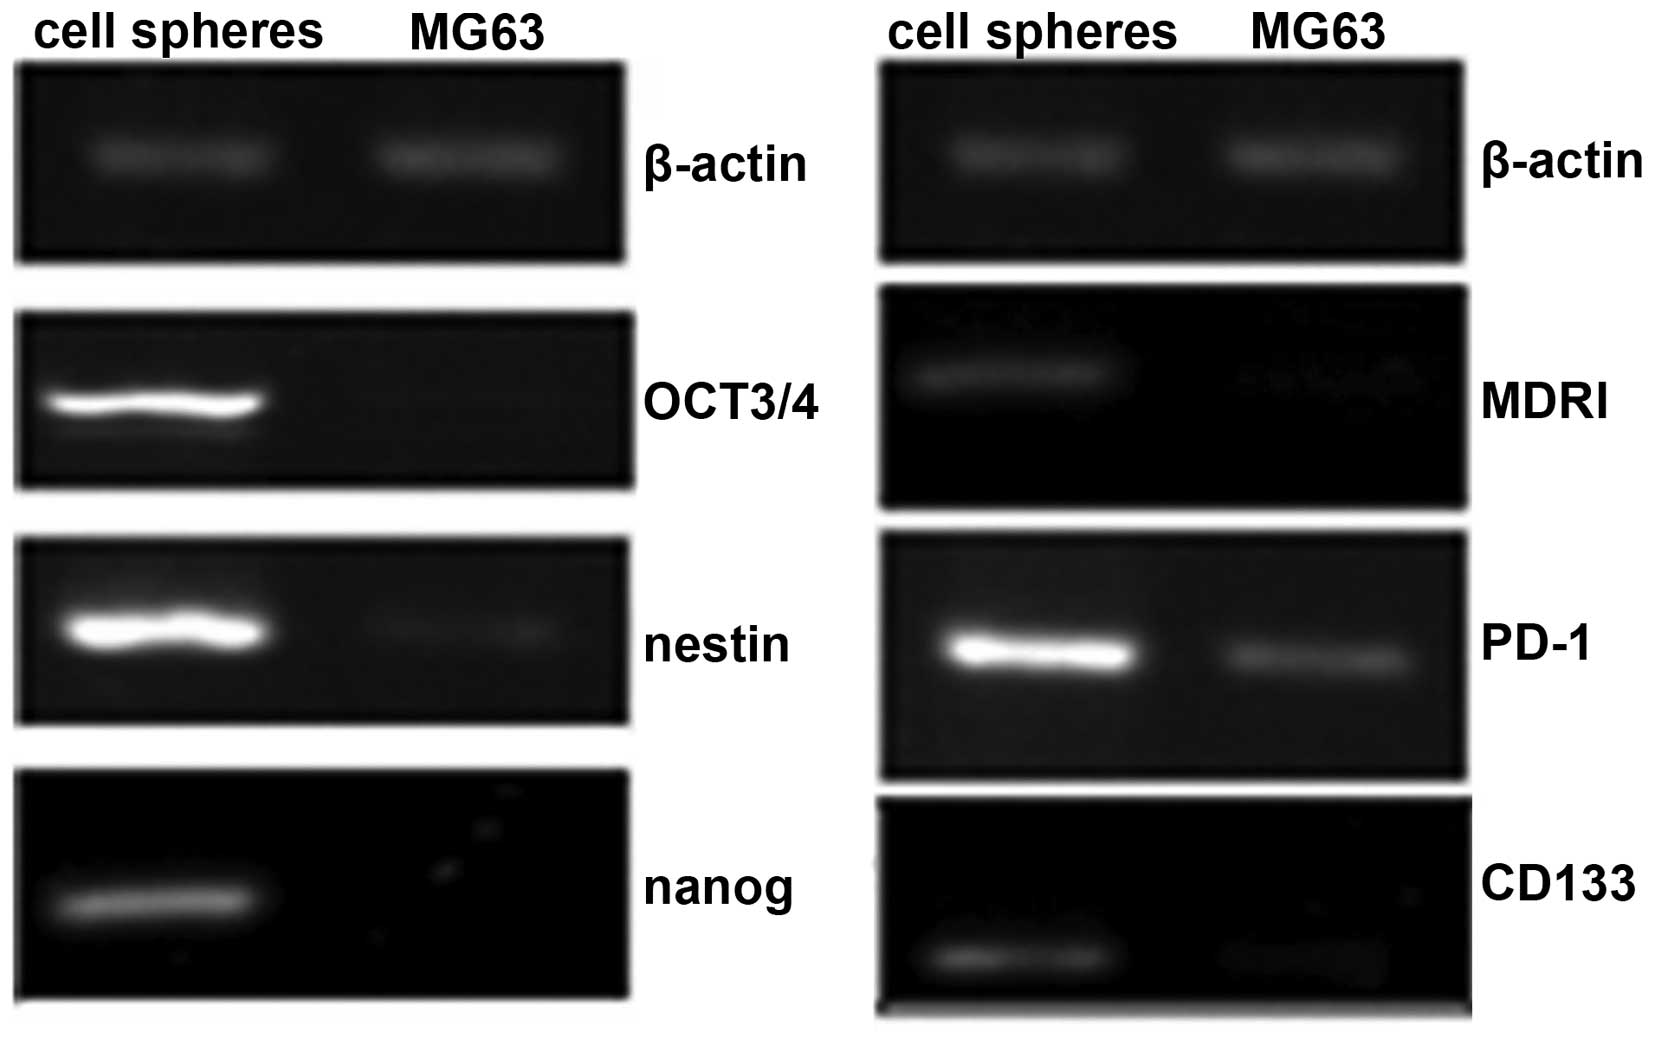
Detection of mRNA expression in cancer
cells by RT-PCR
mRNA analysis showed that the specific pluripotent
stem cell marker CD133 and the embryonic stem cell sphere markers
octamer-binding transcription factor (OCT)3/4, nestin and nanog
were markedly enhanced in the cancer cell spheres compared with the
MG63 cells. The expression of PD-1 mRNA in the cancer cell spheres
was also increased compared to the MG63 cells (Fig. 4).
Discussion
Although they exhibit allobiosis, MG63 cells are not
monoclonal. This is believed to be important to cytological study
from the point of the purification of monoclonal cells of cell
lines (9,10). In order to obtain monoclonal stem cell
samples from MG63 cells, the cloned cells densely distributed in a
round or oval shape were selected, which have the ability to form
tumors. However, the cultured monoclonal cells are not able to
maintain specific characteristics. Therefore, the cells used for
each experiment are derived from the same line in the present
study. Contrasting with the osteosarcoma cells spheres, the
expression level of cancer stem cell-associated genes in the MG63
cells was relatively low. In total, >90% of the cells in the
cancer cell spheres expressed the pluripotent stem cell marker
CD133, while the expression level in the MG63 cells was low.
The migration, invasion, conglutination and growth
analyses of cancer cells are the most commonly used methods to
judge cytoactivity. These methods can reflect the fact that the
tumor leaves the primary tumor extracellular matrix (11–15). In
the present study, it was found that the reproduction rate of the
tumor cells was relatively low in the early passage. With the
increase of passages, the reproduction rate also increased.
However, there was no clear difference in the invasion and transfer
ability of the cells. The analysis of the cell cycle showed that
the percentage of cells in the G0/G1 phase was relatively high.
This means that the cloning ability was strong.
Cancer stem cells mainly express markers of
mesenchymal stem cells (CD29, CD44, CD105 and CD45), and express a
number of genes derived from the mesoderm, ectoderm and endoderm
(16,17). Tumor spheres express markers of
embryonic stem cells (OCT3/4, nestin and nanog) (16). Further studies have shown that various
stem cell markers are often observed in the early formation stage
of tumor spheres; with an increase in the volume of the sphere and
an increase in the number of cells, the expression of these various
markers decreases, and so the balls of cells become more
specialized (and diversified), and each tumor cell becomes more
homogenous (16,17). Therefore, as they are growing, the
original tumor cells are making the transition towards tumor
heterogeneity, i.e. clumps of different cancerous cells are growing
that originated from the tumor sphere during its early formation.
Heterogeneity that is observed between tumor cells is the result of
differences in the stem cells from which they originated (16,17).
Oct-3/4 is transcription factor of the POU family. At the early
stage, the Oct-3/4 is mainly expressed in the endoderm, and
associated with the pluripotent maintenance of embryonic stem
cells, with the growth of the embryo, its expression level
gradually decreases (18–20). The gene expression of nanog is not
commonly found in somatic cells, and the activation of the gene is
vital for the control of self-renewal and the pluripotency of
embryonic stem cells (21). In the
present study, the expression level of the nanog genes in the
cancer cells was markedly increased, indicating that cancer cell
spheres, as in embryonic stem cells, exhibit equal multidirectional
differentiation potential. OCT3/4, nanog and nestin are associated
with cell differentiation and self-renewal (21). If such a protein in tumor stem cell
samples has the same effect, it will become the ideal target
therapy for OS (21).
At present, a number of studies have confirmed that
PD-1 is a synergistic inhibitory receptor, which can regulate T
cell proliferation (12,22). The antigen-stimulated high expression
of PD-1 on the CD8+ T-cell surface is associated with
T-cell depletion. The cytokine secretion of CD8+ T
cells, plus interleukin 2, tumor necrosis factor-α, interferon-γ
and other cell factors are gradually lost. PD-1+
CD8+ T cells are found in tumor-infiltrating or chronic
virus-infected lymphocytes (22). The
function of PD-1 in CD4+ T cells remains unclear at
present. Certain studies have shown that PD-1 can limit the degree
of CD4+ T-cell aggregation following immunostimulation.
The CD4+ T-cell regulating action of PD-1 varies in
different illnesses. The expression of PD-1 in CD4+ T
cells may be closely associated with the progression of numerous
diseases (23,24). The PD-1 expression of CD4+
and CD8+ T cells in OS was increased significantly
compared with MG63 cells. The PD-1 level is higher with tumor
metastasis, in advanced tumors or with merged pathological fracture
(23,24). RT-PCR and flow cytometry have
confirmed that the expression of PD-1 is markedly increased with
the proliferation of tumor cells and enhanced invasiveness. The
expression of PD-1 is closely associated with the occurrence and
progression of tumors (23,24).
The MG63 cell line possesses the feature of OS stem
cells. The MG63 cell line can express the corresponding cell
markers. The expression of PD-1 is also increased significantly,
which can reduce the immune functions of affected patients and is
closely associated with the occurrence and development of
tumors.
Acknowledgements
This study was supported by the Project of Anhui
Province for Excellent Young Talents in Universities (grant no.
2013SQRL049ZD) and the Project of Anhui Provincial Department of
Health (grant no. KJ2012Z251).
References
|
1
|
Bai X, Meng H, Ma L and Guo A: Inhibitory
effects of evodiamine human osteosarcoma cell proliferation and
apoptosis. Oncol Lett. 9:801–805. 2015.PubMed/NCBI
|
|
2
|
Fleuren ED, Versleijen-Jonkers YM, Boerman
OC and van der Graaf WT: Targeting receptor tyrosine kinases in
osteosarcoma and Ewing sarcoma: Current hurdles and future
perspectives. Biochim Biophys Acta. 1845:266–276. 2014.PubMed/NCBI
|
|
3
|
Botter SM, Neri D and Fuchs B: Recent
advances in osteosarcoma. Curr Opin Pharmacol. 16:15–23. 2014.
View Article : Google Scholar : PubMed/NCBI
|
|
4
|
Siewe B, Wallace J, Rygielski S, Stapleton
JT, Martin J, Deeks SG and Landay A: Regulatory B cells inhibit
cytotoxic T lymphocyte (CTL) activity and elimination of infected
CD4 T cells after in vitro reactivation of HIV latent reservoirs.
PLoS One. 9:e929342014. View Article : Google Scholar : PubMed/NCBI
|
|
5
|
Xu P, Chen YJ, Chen H, Zhu XY, Song HF,
Cao LJ and Wang XF: The expression of programmed death-1 in
circulating CD4+ and CD8+ T cells during
hepatitis B virus infection progression and its correlation with
clinical baseline characteristics. Gut Liver. 8:186–195. 2014.
View Article : Google Scholar : PubMed/NCBI
|
|
6
|
Philip NH, Dillon CP, Snyder AG,
Fitzgerald P, Wynosky-Dolfi MA, Zwack EE, Hu B, Fitzgerald L,
Mauldin EA, Copenhaver AM, et al: Caspase-8 mediates caspase-1
processing and innate immune defense in response to bacterial
blockade of NF-kB and MAPK signaling. Proc Natl Acad Sci USA.
11:7385–7590. 2014. View Article : Google Scholar
|
|
7
|
Pedoeem A, Azoulay-Alfaguter I, Strazza M,
Silverman GJ and Mor A: Programmed death-1 pathway in cancer and
autoimmunity. Clin Immunol. 153:145–152. 2014. View Article : Google Scholar : PubMed/NCBI
|
|
8
|
Notaro A, Sabella S, Pellerito O, Di Fiore
R, De Blasio A, Calvaruso G and Giuliano M: Involvement of PAR-4 in
cannabinoid-dependent sensitization of osteosarcoma cells to
TRAIL-induced apoptosis. Int J Biol Sci. 10:466–478. 2014.
View Article : Google Scholar : PubMed/NCBI
|
|
9
|
Oba J, Nakahara T, Abe T, Hagihara A,
Moroi Y and Furue M: Expression of programmed death receptor ligand
1 in melanoma may indicate tumor progression and poor patient
survival. J Am Acad Dermatol. 70:954–956. 2014. View Article : Google Scholar : PubMed/NCBI
|
|
10
|
Mittendorf EA, Philips AV, Meric-Bernstam
F, Qiao N, Wu Y, Harrington S, Su X, Wang Y, Gonzalez-Angulo AM,
Akcakanat A, et al: PD-L1 expression in triple-negative breast
cancer. Cancer Immunol Res. 2:361–370. 2014. View Article : Google Scholar : PubMed/NCBI
|
|
11
|
Joseph RW, Parasramka M, Eckel-Passow JE,
Seri D, Wu K, Jiang L, Kalari K, Thompson RJ, Huu Ho T, Castle EP,
et al: Inverse association between programmed death ligand 1 and
genes in the VEGF pathway in primary clear cell renal cell
carcinoma. Cancer Immunol Res. 1:378–385. 2013. View Article : Google Scholar : PubMed/NCBI
|
|
12
|
Macfarlane AW IV, Jillab M, Plimack ER,
Hudes GR, Uzzo RG, Litwin S, Dulaimi E, Al-Saleem T and Campbell
KS: PD-1 expression on peripheral blood cells increases with stage
in renal cell carcinoma patients and is rapidly reduced after
surgical tumor resection. Cancer Immunol Res. 2:320–331. 2014.
View Article : Google Scholar : PubMed/NCBI
|
|
13
|
Flies DB, Han X, Higuchi T, Zheng L, Sun
J, Ye JJ and Chen L: Coinhibitory receptor PD-1H preferentially
suppresses CD4+ T cell-mediated immunity. J Clin Invest.
124:1966–1975. 2014. View
Article : Google Scholar : PubMed/NCBI
|
|
14
|
Barker CA and Postow MA: Combinations of
radiation therapy and immunotherapy for melanoma: A review of
clinical outcomes. Int J Radiat Oncol Biol Phys. 88:986–997. 2014.
View Article : Google Scholar : PubMed/NCBI
|
|
15
|
Tosti G, Cocorocchio E and Pennacchioli E:
Anti-cytotoxic T lymphocyte antigen-4 antibodies in melanoma. Clin
Cosmet Investig Dermatol. 6:245–256. 2013.PubMed/NCBI
|
|
16
|
Feng D, Yang X, Li S, Liu T, Wu Z, Song Y,
Wang J, Gao W, Huang Q, Huang W, et al: Cytotoxic T-lymphocyte
antigen-4 genetic variants and risk of Ewing's sarcoma. Genet Test
Mol Biomarkers. 17:458–463. 2013. View Article : Google Scholar : PubMed/NCBI
|
|
17
|
Liu Y, He Z, Feng D, Shi G, Gao R, Wu X,
Song W and Yuan W: Cytotoxic T-lymphocyte antigen-4 polymorphisms
and susceptibility to osteosarcoma. DNA Cell Biol. 30:1051–1055.
2011. View Article : Google Scholar : PubMed/NCBI
|
|
18
|
Wang W, Wang J, Song H, Liu J, Song B and
Cao X: Cytotoxic T-lymphocyte antigen-4+ 49G/A
polymorphism is associated with increased risk of osteosarcoma.
Genet Test Mol Biomarkers. 15:503–506. 2011. View Article : Google Scholar : PubMed/NCBI
|
|
19
|
Yang S, Wang C, Zhou Y, Sun G, Zhu D and
Gao S: Cytotoxic T-lymphocyte antigen-4 polymorphisms and
susceptibility to Ewing's sarcoma. Genet Test Mol Biomarkers.
16:1236–1240. 2012. View Article : Google Scholar : PubMed/NCBI
|
|
20
|
Shang Y, Li Z, Li H, Xia H and Lin Z:
TIM-3 expression in human osteosarcoma: Correlation with the
expression of epithelial-mesenchymal transition-specific
biomarkers. Oncol Lett. 6:490–494. 2013.PubMed/NCBI
|
|
21
|
Ramsay AG: Immune checkpoint blockade
immunotherapy to activate anti-tumour T-cell immunity. Br J
Haematol. 162:313–325. 2013. View Article : Google Scholar : PubMed/NCBI
|
|
22
|
Ott PA, Hodi FS and Robert C: CTLA-4 and
PD-1/PDL1 blockade: New immunotherapeutic modalities with durable
clinical benefit in melanoma patients. Clin Cancer Res.
19:5300–5309. 2013. View Article : Google Scholar : PubMed/NCBI
|
|
23
|
Okazaki T, Chikuma S, Iwai Y, Fagarasan S
and Honjo T: A rheostat for immune responses: The unique properties
of PD-1 and their advantages for clinical application. Nat Immunol.
14:1212–1218. 2013. View
Article : Google Scholar : PubMed/NCBI
|
|
24
|
Pan XC, Li L, Mao JJ, Yao W, Zheng JN, Liu
M and Fu JJ: Synergistic effects of soluble PD-1 and IL-21 on
antitumor immunity against H22 murine hepatocellular carcinoma.
Oncol Lett. 5:90–96. 2013.PubMed/NCBI
|