Introduction
Reverse transcription quantitative polymerase chain
reaction (RT-qPCR) is frequently used in gene expression studies
and is currently considered the gold standard for accurate,
sensitive and rapid measurements of gene expression. Relative
quantification is an important and commonly used technique to
evaluate RT-qPCR data, during which the expression levels of target
genes are compared with those of a stably expressed endogenous
control gene, determined simultaneously in the same biological
sample. Therefore, the gene expression levels require normalization
using reference genes in order to obtain reliable data. The
identification of appropriate reference genes is a crucial stage
involved in this approach. It is important for the ideal reference
genes to be universally valid under the experimental conditions
(1,2).
In general, cellular maintenance genes, including
glyceraldehyde-3-phosphate dehydrogenase (GAPDH), β-actin (ACTB)
and ribosomal RNA (18S rRNA), are selected as reference genes to
examine the variability between clinical samples. However, several
studies have demonstrated that the expression levels of these
commonly used reference genes vary in different tissues or between
treatments in the same tissue (3–6), as well
as across cell types (7–9).
Tongue carcinoma is the most common malignancy of
the oral cavity, accounting for 12.2% of all head and neck cancers
(10,11). Tongue cancer is characterized by a
high malignant degree, high local recurrence rate, high neck
metastasis rate and high rate of mortality. It is the focus of oral
tongue cancer surgery.
RT-qPCR is a frequently used technique to
investigate differential gene expression, thus a review of the
normalization standards used in quantitative gene expression
studies of human tongue carcinoma was deemed necessary. To the best
of our knowledge, no systematic study has previously been performed
on the selection of suitable reference genes for investigating
target gene profiling between human tongue carcinoma cell lines and
tissues.
The present study aimed to identify the most
suitable reference gene or set of genes for target gene profiling
of human tongue carcinoma. The stabilities of a panel of 12 common
reference genes in human tongue carcinoma cell lines and tissues
were validated. The 12 candidate genes: ACTB, 5′-aminolevulinate
synthase 1 (ALAS1), GAPDH, TATA-box binding protein (TBP),
hypoxanthine phosphoribosyltransferase 1 (HPRT1), ribosomal protein
L29 (RPL29), hydroxymethylbilane synthase (HMBS), peptidylprolyl
isomerase A (PPIA), pumilio RNA binding family member 1 (PUM1),
glucuronidase β (GUSB), β-2-microglobulin (B2M) and 18S rRNA are
frequently used as endogenous controls in the context of tongue
carcinoma, but are not restricted to this. A number of these genes
have been identified as optimal reference genes in certain other
cancer types, including HPRT1 and ACTB (12,13). Three
common software packages, geNorm (14), NormFinder (15) and Bestkeeper (16), were used to investigate these genes.
The aim was to provide useful information for the selection of
suitable reference genes in further gene expression studies on
human tongue carcinoma.
Materials and methods
Human tongue carcinoma cell lines
The human tongue carcinoma cell line Tca-8113 was
provided by Jilin Cancer Hospital (Changchun, China) and CAL-27
cells were provided by the Hospital of Stomatology, Jilin
University (Changchun, China). Cells were cultivated in Iscove's
modified Dulbecco's medium (Gibco; Thermo Fisher Scientific, Inc.,
Waltham, MA, USA) containing 10% fetal bovine serum (Gibco; Thermo
Fisher Scientific, Inc.) with 100 units of penicillin, maintained
at 37°C in a 5% CO2 humidified atmosphere, according to
the recommendation of the supplier.
Tongue carcinoma tissue samples
A total of 8 tongue carcinoma tissue samples were
provided by the Tissue Bank of China-Japan Union Hospital, Jilin
University (Changchun, China). The clinicopathological
characteristics of the patients were summarized in Table I. The present study was approved by
the Ethics Committee of the China-Japan Union Hospital, Jilin
University (Changchun, China).
 | Table I.Clinicopathological characteristics of
patients. |
Table I.
Clinicopathological characteristics of
patients.
| Clinicopathological
characteristic | Patients with tongue
carcinoma |
|---|
| Age (mean ± standard
deviation) | 56.75±4.06 |
| Sex |
|
| Male | 6 |
|
Female | 2 |
| Histopathological
type |
|
| Squamous
cell carcinomas | 8 |
|
Adenocarcinoma | 0 |
| TNM
stagea |
|
| Stage
0 | 1 |
| Stage
I | 1 |
| Stage
II | 3 |
| Stage
III | 2 |
| Stage
IV | 1 |
RNA extraction and complementary DNA
(cDNA) synthesis
The cell lines were recovered from liquid nitrogen
and cultured for 72 h. A total of 50–100 mg tissue samples were
homogenized in 1 ml TRIzol reagent (Invitrogen; Thermo Fisher
Scientific, Inc.). Total RNA was extracted from the cells and each
tissue sample using TRIzol reagent following the manufacturer's
protocol. DNase I (Sangon Biotech Co., Ltd., Shanghai, China) was
used to eliminate genomic DNA contamination. The concentrations and
purity of the isolated RNA were measured by NanoDrop 2000 (Thermo
Fisher Scientific, Inc.).
The cDNA synthesis reaction was performed three
times using the M-MuLV First Strand cDNA Synthesis kit (Sangon
Biotech Co., Ltd., Shanghai, China) according to the manufacturer's
protocol. The total reaction volume was 20 µl. Total RNA (1 µg), 1
µl random primer and RNase free water were mixed, incubated at 65°C
for 5 min and then cooled down immediately on ice for 30 sec. The
rest of the reaction reagents were added, then the mixture was
incubated at 42°C for 60 min and the reaction was terminated by
heating at 70°C for 10 min.
RT-qPCR
The primers of 12 putative reference genes were
selected based on previous studies, and are widely used and
recognized to be good reference genes (18,19). The
primers were synthesized by Sangon Biotech Co., Ltd. and the
sequences are listed in Table II. A
Roche LightCycler 480 detection system (Roche Diagnostics GmbH,
Mannheim, Germany) was used for RT-qPCR. Reactions were performed
using 2xSG Fast qPCR Master Mix (Sangon Biotech Co., Ltd.)
according to the manufacturer's protocol. All the samples were run
in triplicate. The PCR volume was 20 µl, containing 2 µl cDNA. The
following cycling conditions were used: 55°C for 5 min; 95°C for 5
min; 40 cycles of 95°C for 20 sec, 55°C for 20 sec and 72°C for 4
min. This cycle was followed by melting curve analysis, and the
baseline and cycle threshold values (Cq values) were automatically
determined for all the plates using Roche LightCycler 480 software
v1.5.0 (Roche Diagnostics GmbH). RT-qPCR amplification products
were detected by 1% agarose gel electrophoresis and melting curve
to verify the specificity of the primers. A standard curve was
constructed for each primer pair to determine the product
specificity.
| Table II.Summary of reference genes used in the
present study. |
Table II.
Summary of reference genes used in the
present study.
| Symbol | Official full
name | Accession number | Primer sequence | Product size
(bp) |
|---|
| 18S | 18S ribosomal
RNA | NM_10098.1 |
F:CGGCTACCACATCCAAGGAA | 186 |
|
|
|
|
R:GCTGGAATTACCGCGGCT |
|
| GAPDH |
glyceraldehyde-3- | NM_002046.5 | F:
GACAGTCAGCCGCATCTTCT | 127 |
|
| phosphate
dehydrogenase |
| R:
TTAAAAGCAGCCCTGGTGAC |
|
| B2M |
β-2-microglobulin | NM_004048.2 | F:
AGCGTACTCCAAAGATTCAGGTT | 306 |
|
|
|
| R:
ATGATGCTGCTTACATGTCTCGAT |
|
| ACTB | β-actin | NM_001101.3 | F:
AGAAAATCTGGCACCACACC | 173 |
|
|
|
| R:
TAGCACAGCCTGGATAGCAA |
|
| ALAS1 | 5′-aminolevulinate
synthase 1 | NM_000688.5 | F:
GGCAGCACAGATGAATCAGA | 150 |
|
|
|
| R:
CCTCCATCGGTTTTCACACT |
|
| GUSB | glucuronidase β | NM_000181.3 | F:
AGCCAGTTCCTCATCAATGG | 160 |
|
|
|
| R:
GGTAGTGGCTGGTACGGAAA |
|
| HPRT1 | hypoxanthine | NM_000194.2 | F:
GACCAGTCAACAGGGGACAT | 132 |
|
|
phosphoribosyltransferase 1 |
| R:
CCTGACCAAGGAAAGCAAAG |
|
| HMBS | hydroxymethylbilane
synthase | NM_000190.3 | F:
AGTGTGGTGGGAACCAGC | 144 |
|
|
|
| R:
CAGGATGATGGCACTGAACTC |
|
| PPIA | peptidylprolyl
isomerase A | NM_021130.4 | F:
AGACAAGGTCCCAAAGAC | 118 |
|
|
|
| R:
ACCACCCTGACACATAAA |
|
| PUM1 | pumilio
RNA-binding | NM_001020658.1 | F:
CAGGCTGCCTACCAACTCAT | 217 |
|
| family member
1 |
| R:
GTTCCCGAACCATCTCATTC |
|
| RPL29 | ribosomal protein
L29 | NM_000992.2 | F:
GGCGTTGTTGACCCTATTTC | 120 |
|
|
|
| R:
GTGTGTGGTGTGGTTCTTGG |
|
| TBP | TATA-box binding
protein | NM_003194.4 | F:
TGCACAGGAGCCAAGAGTGAA | 132 |
|
|
|
| R:
CACATCACAGCTCCCCACCA |
|
The Cq values were identified by quantitative
comparison of the amplification of the candidate genes. The Cq
values were calculated to relative quantities (Q) for data
analysis, in view of the PCR efficiencies of the candidate genes
according to the equation: Q=2−ΔΔCq (20).
PCR efficiency
A random pool of cDNA from the samples was selected
and used for 10-fold serial dilutions, ranging between 0.001 and
1X. PCR analysis was run in triplicate, as mentioned previously.
PCR efficiency was calculated using the slopes of the calibration
curve and by the formula: E=10−1/slope.
Statistical analysis
All the samples were divided into three groups: Cell
line + tissue group, cell line group and tissue group. In order to
evaluate the stability of the reference genes, three frequently
used software programs, geNorm v3.5 (http://medgen.ugent.be/~jvdesomp/genorm/), NormFinder
v0.953 (http://moma.dk/normfinder-software) and BestKeeper
version 1 (http://www.gene-quantification.de/bestkeeper.html),
were utilized. GeNorm is designed to establish reference genes for
RT-qPCR and is used to analyze and determine the M-value, which
refers to the stability of the reference gene expression. M is the
mean pairwise variation for a given gene compared with other tested
genes, following stepwise exclusion of the gene with the highest M
value and calculated in order to select the most two stable genes.
The default value suggested by geNorm is M=1.5. A higher M-value
indicates less stable expression, and a lower M value indicates
more stable expression. If M >1.5, the gene is not suitable for
use as a reliable reference gene. GeNorm software was also used to
analyze the pair-wise variation value of the normalization factor
(V), which has a default value of 0.15. It is possible to use the
value of Vn/Vn+1 to determine whether adding a novel reference gene
affects the normalization factor. If the value of Vn/Vn+1 is
>0.15, it is necessary to use the n+1 reference genes as
internal controls. If it is <0.15, then it is not necessary to
use novel reference genes. NormFinder software is a tool designed
to identify the optimal reference gene among a set of candidates
and it has a similar operation principle to geNorm. This program
analyzes expression data, ranks the set of candidate normalization
genes according to their expression stability and considers the
gene with the minimum expression data as the most stable gene. It
is also possible to use this software to compare the stability of
inter and intragroup reference genes and propose an optimal
combination of two genes. BestKeeper evaluates candidate reference
gene stability based on the correlation coefficient (R-value). The
genes were ranked according to their R value, with a higher R value
indicating a more stable and reliable gene.
Results
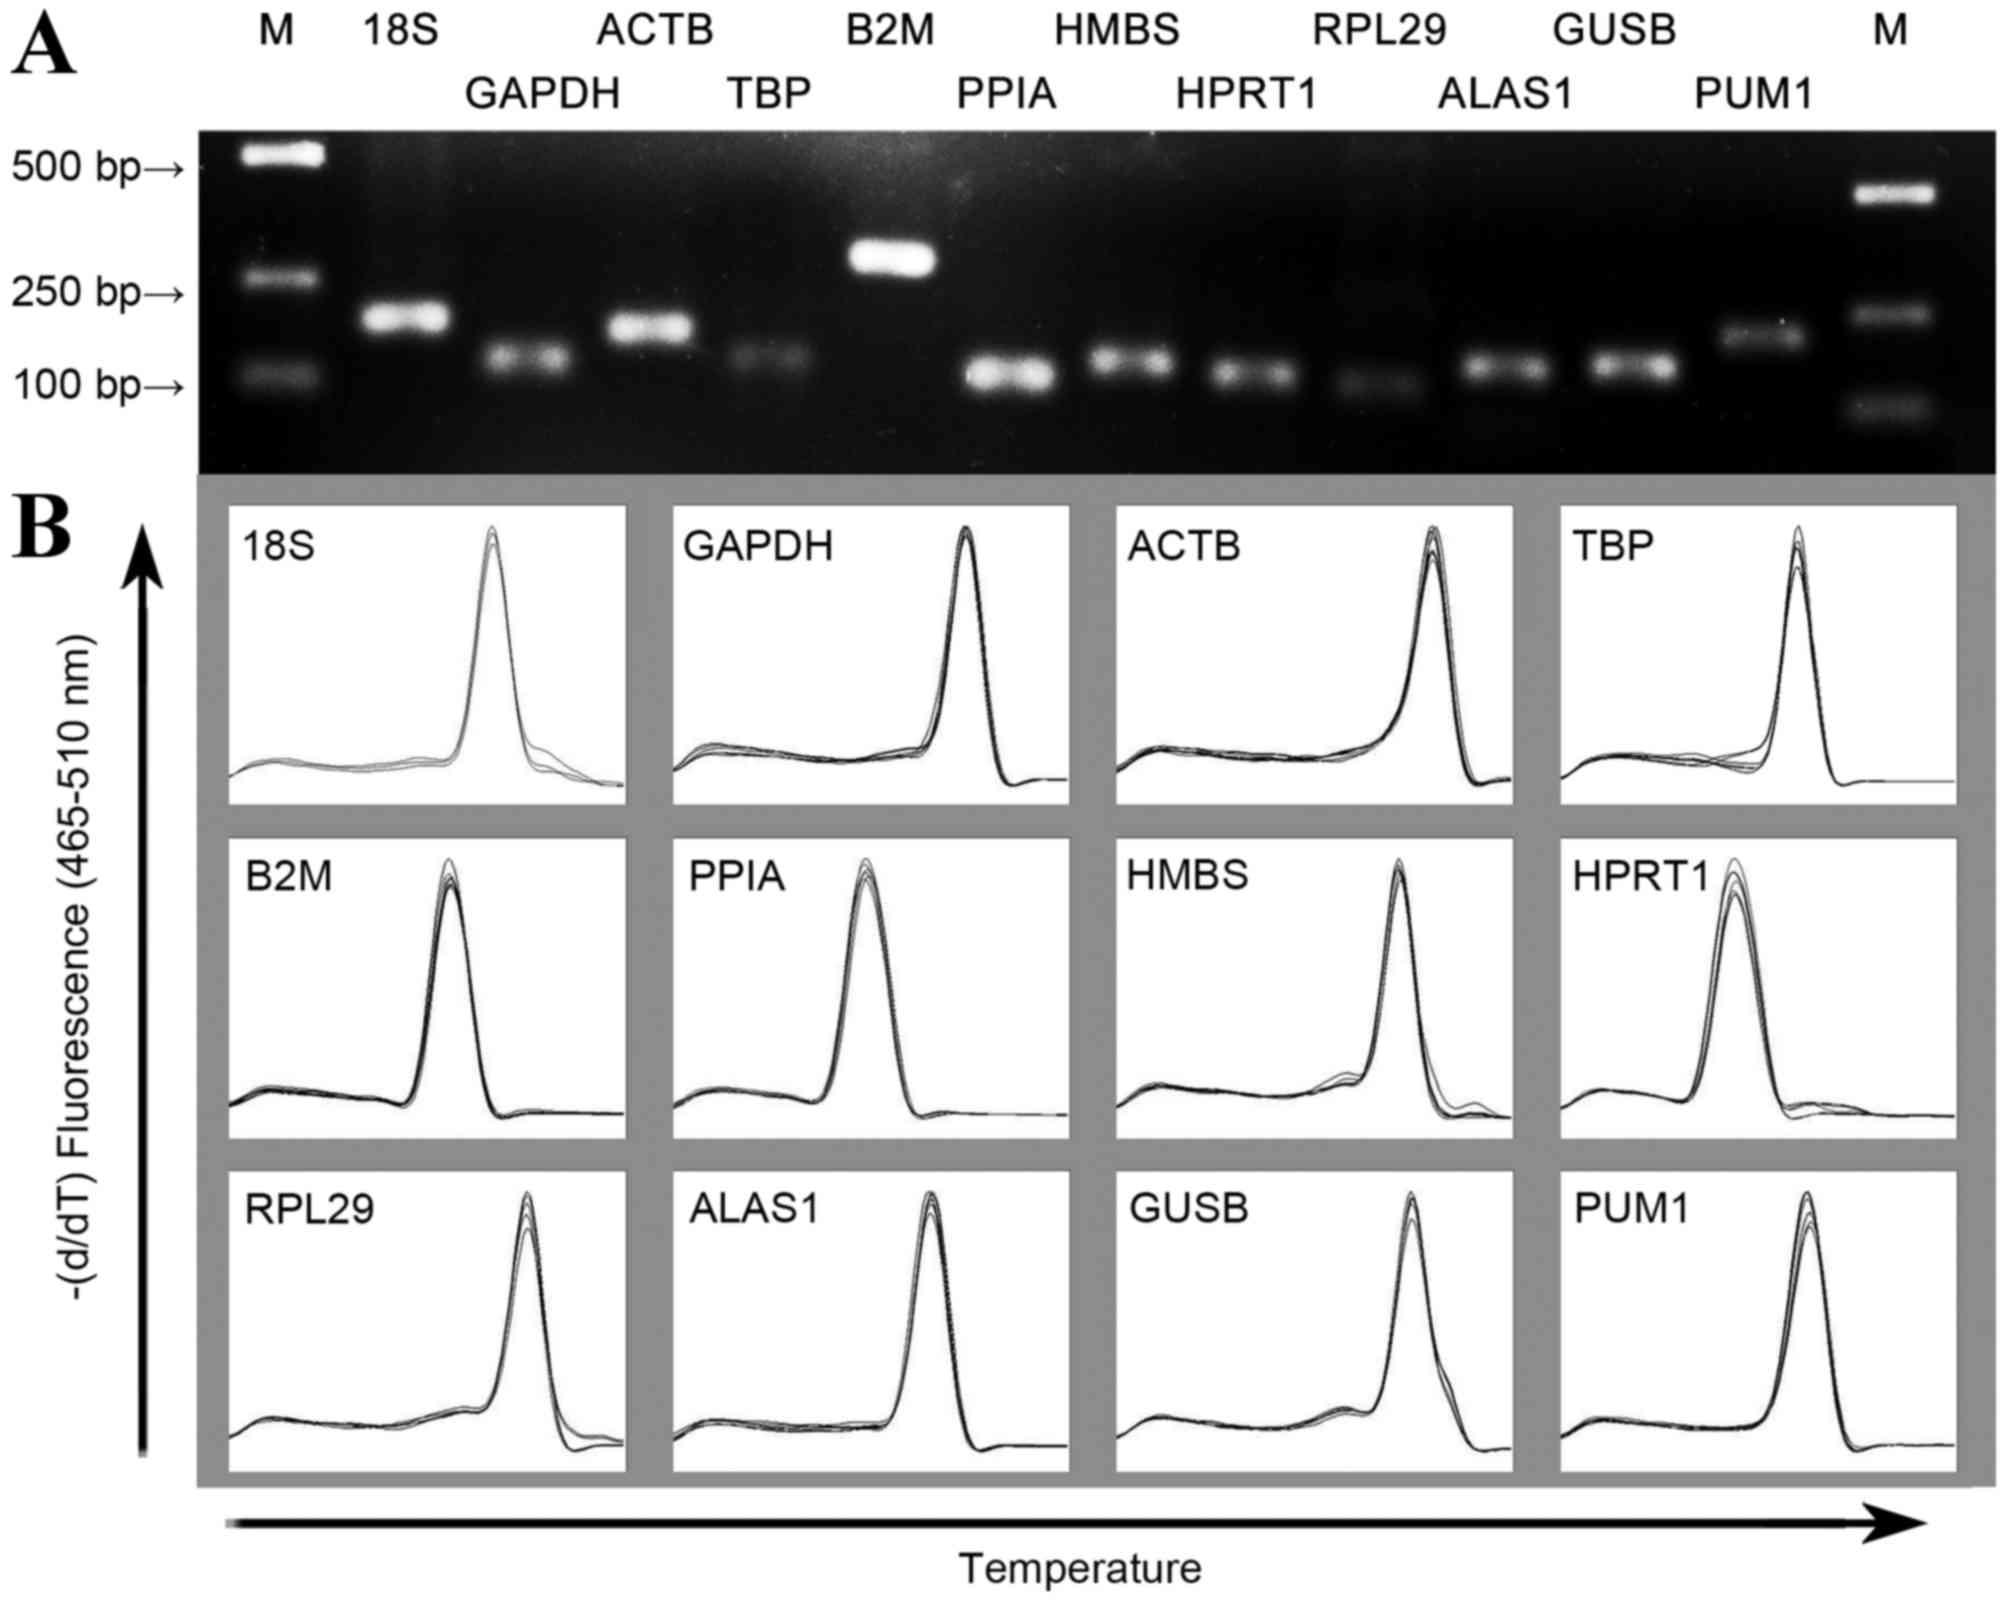
Amplification specificity and
efficiency of primers
The primer sequences, corresponding length of the
amplified products and PCR amplification efficiency are listed in
Table II. The gel imaging system
indicated that the size of the amplified fragment was consistent
with the expected size, with a clear band and without primer dimers
and nonspecific bands (Fig. 1A). In
addition, melting curve analysis of each gene fragment amplified by
qPCR revealed that all curves exhibited a single signal peak
(Fig. 1B). For the candidate
reference genes, the amplification efficiency range of the standard
curve was 1.95–2.09 and all correlation coefficients were
>0.96.
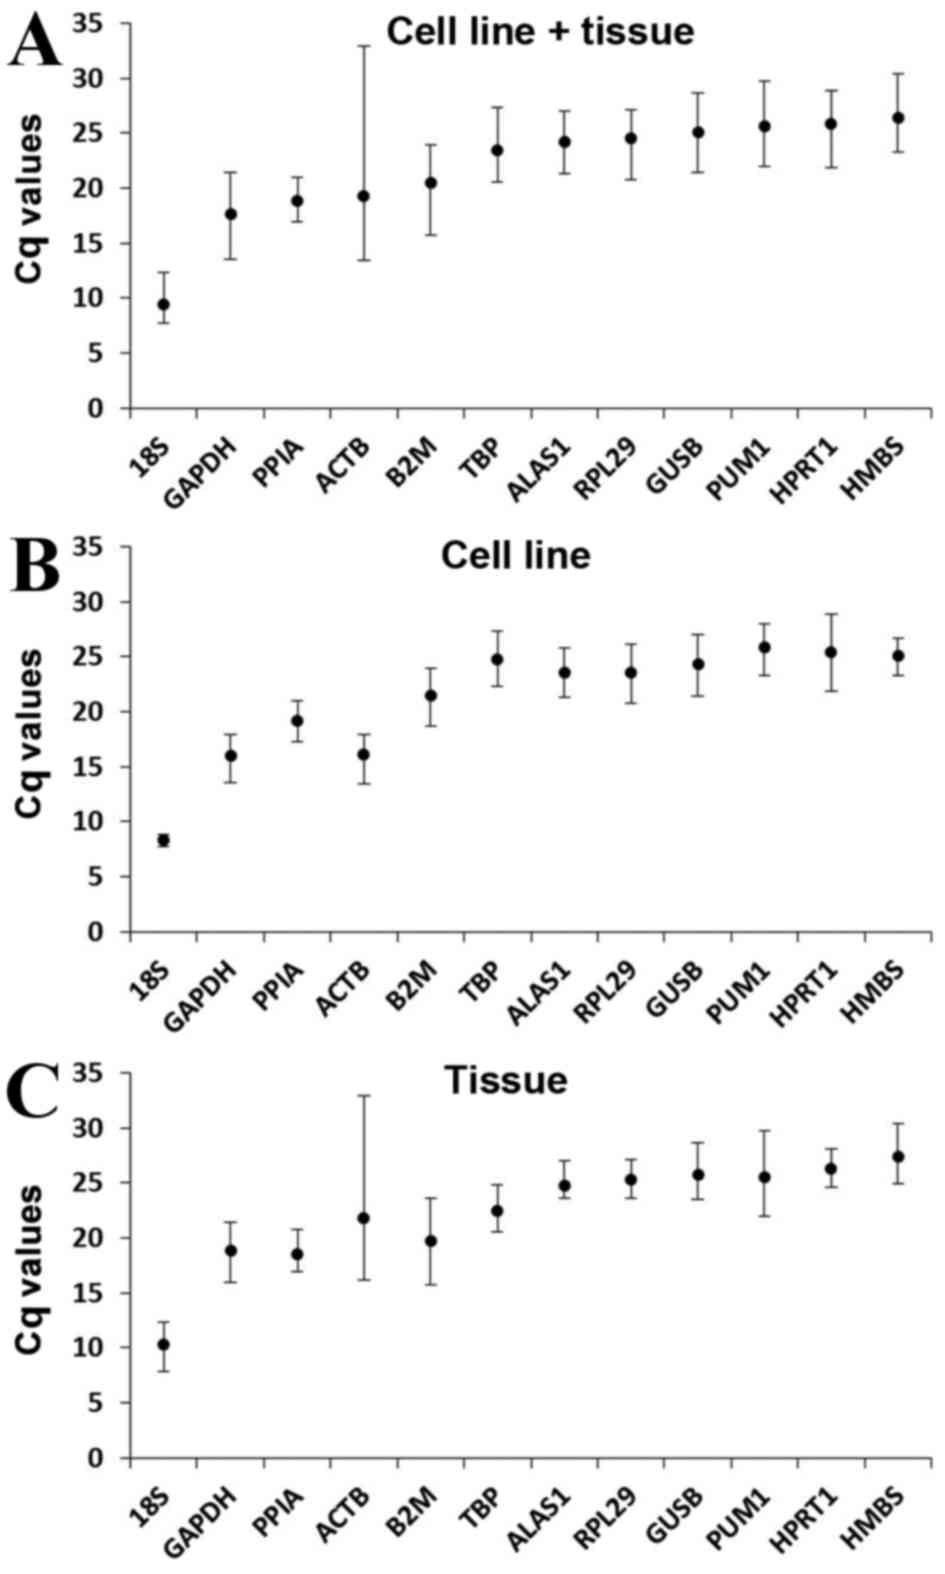
Gene expression levels
The expression level of the candidate reference
genes was determined by the Cq value, which is inversely
proportional to the expression level of the gene. Higher Cq values
indicated smaller expression quantities. The Cq value of all the
samples ranged between 7.70 and 32.93 (Fig. 2). In all groups, 18S had the smallest
mean Cq values of 9.48±1.51 (cell line + tissue group; Fig. 2A), 8.38±0.43 (cell line group;
Fig. 2B) and 10.30±1.52 (tissue
group; Fig. 2C) and HMBS had the
greatest mean Cq values of 26.41±2.37 (cell line + tissue group;
Fig. 2A), 25.06±1.70 (cell line
group; Fig. 2B) and 27.43±2.37
(tissue group; Fig. 2C).
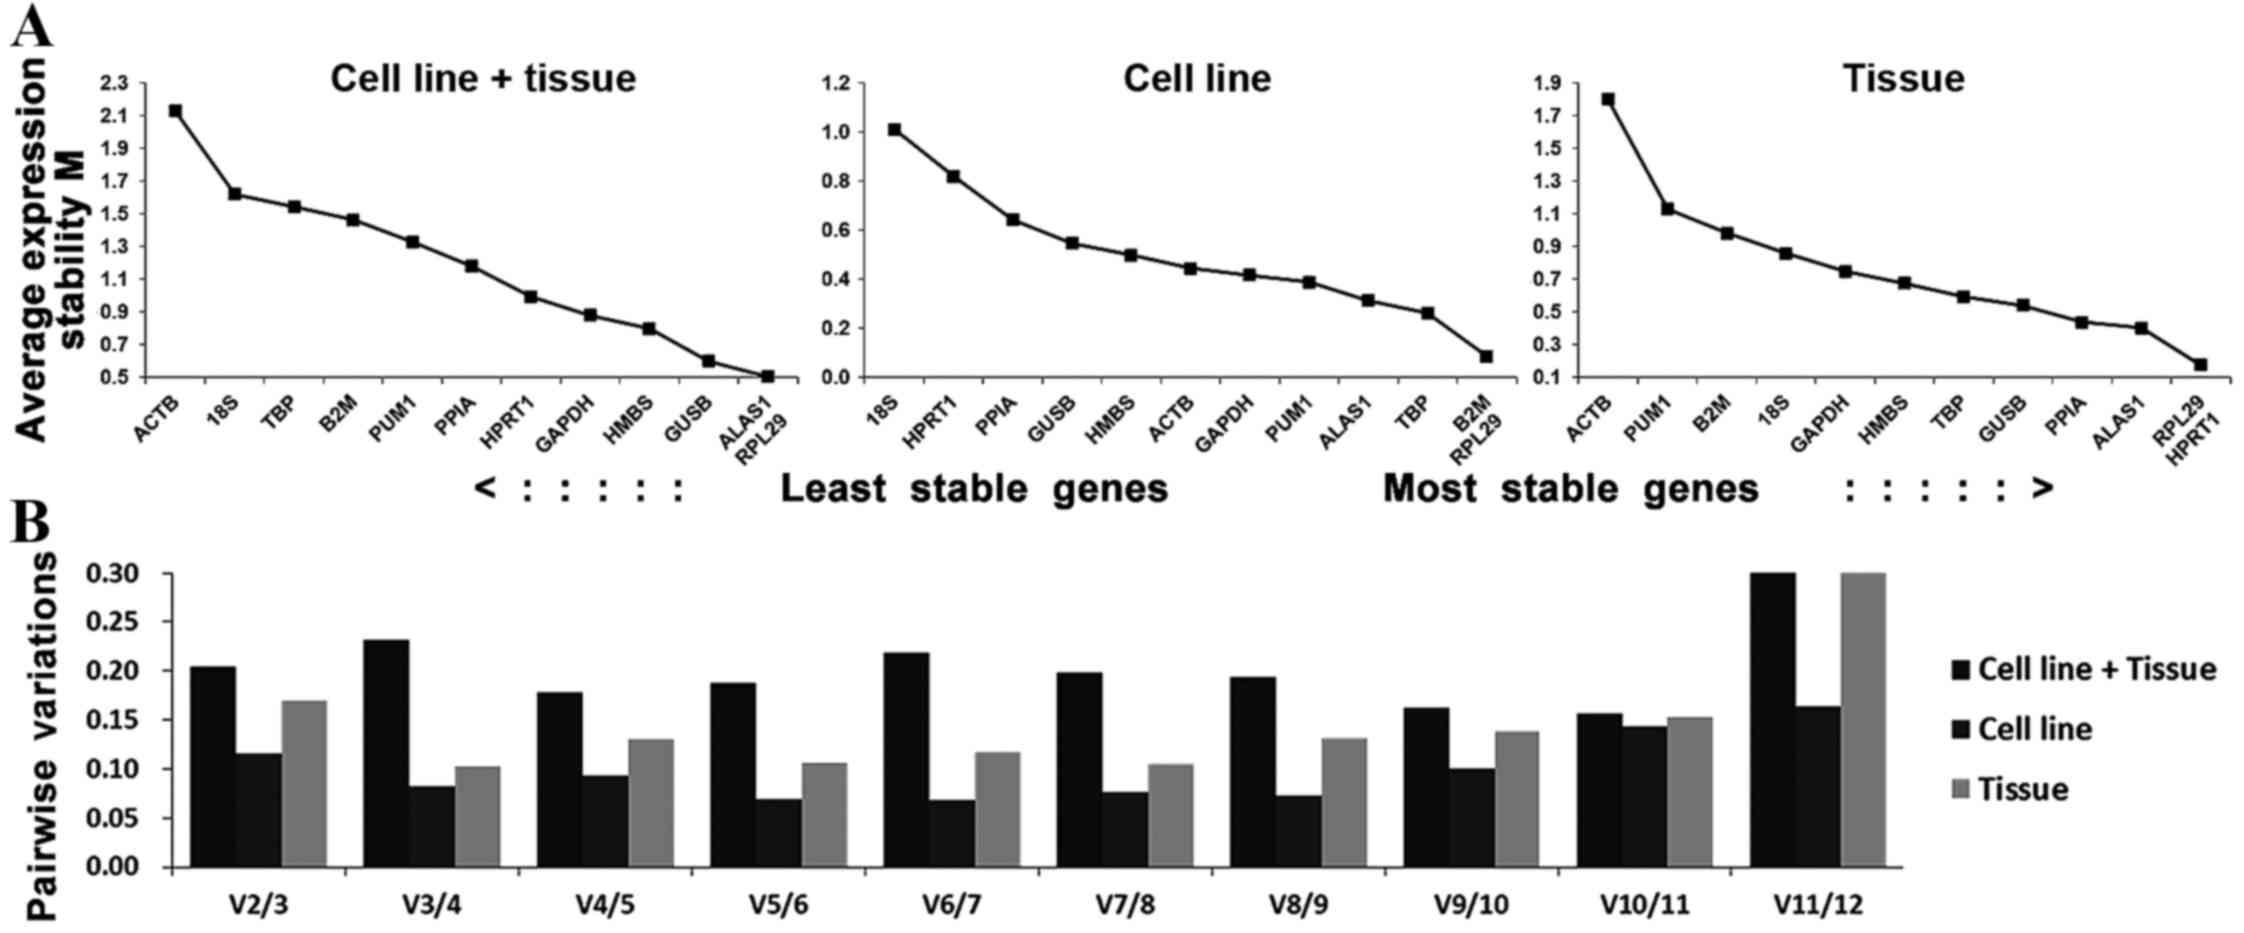
Stability analysis of the candidate
reference gene
Theoretically, the 12 reference genes constituted
appropriate internal controls for gene expression. In the cell line
+ tissue group, ALAS1 and RPL29 had the lowest M-values, followed
by GUSB, which suggested that these were the most stable candidate
genes for studies between human tongue carcinoma cell lines and
tissue. In the cell line group, B2M and RPL29, followed by TBP,
were suggested as the most stable reference genes for studies
between Tca-8113 and CAL-27 cell lines. In the tissue group, RPL29
and HPRT1, followed by ALAS1, were suggested as most stable
reference genes for studies on human tongue carcinoma tissue
(Fig. 3A). A combination of 2 and 3
reference genes were optimal in the cell line group (V2/3=0.116)
and tissue group (V3/4=0.103), respectively (Fig. 3B).
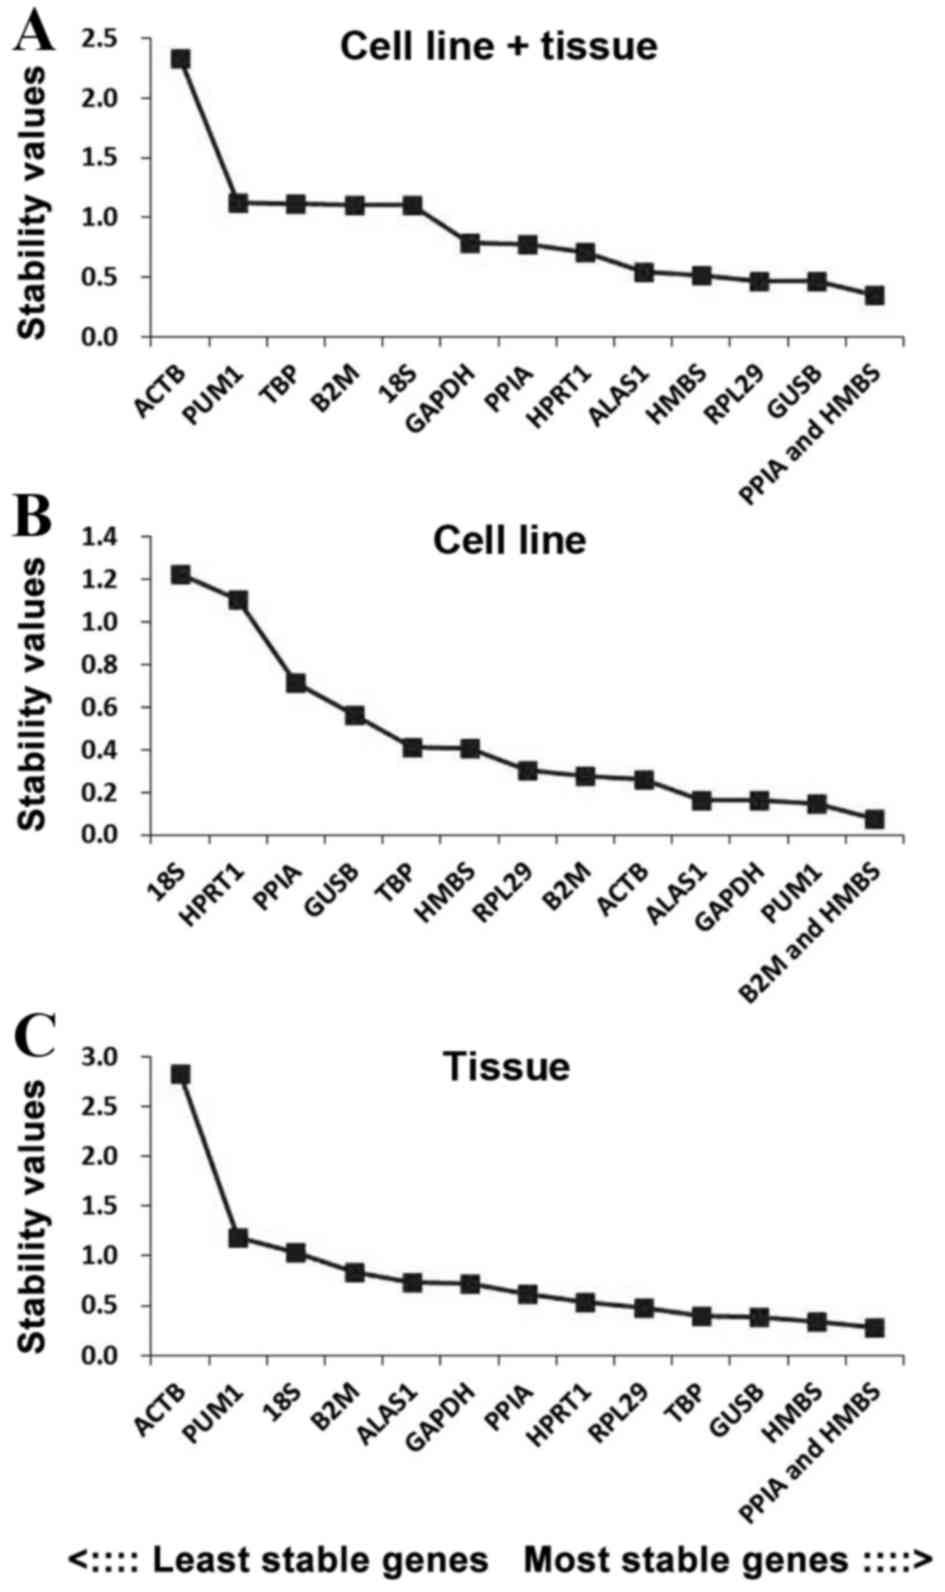
In order to further evaluate the stability of the 12
reference genes, the present study also used the NormFinder
program. PPIA + HMBS was the most stable reference gene combination
in the cell line + tissue group, whilst GUSB and RPL29 were the
most stably expressed genes in this group (Fig. 4A). In the cell line group, B2M + HMBS
was the most stable reference gene combination, whilst PUM1 and
GADPH were the most stably expressed genes (Fig. 4B). In the tissue group, PPIA + HMBS
was the most stable reference gene combination, whilst HMBS and
GUSB were the most stably expressed genes (Fig. 4C).
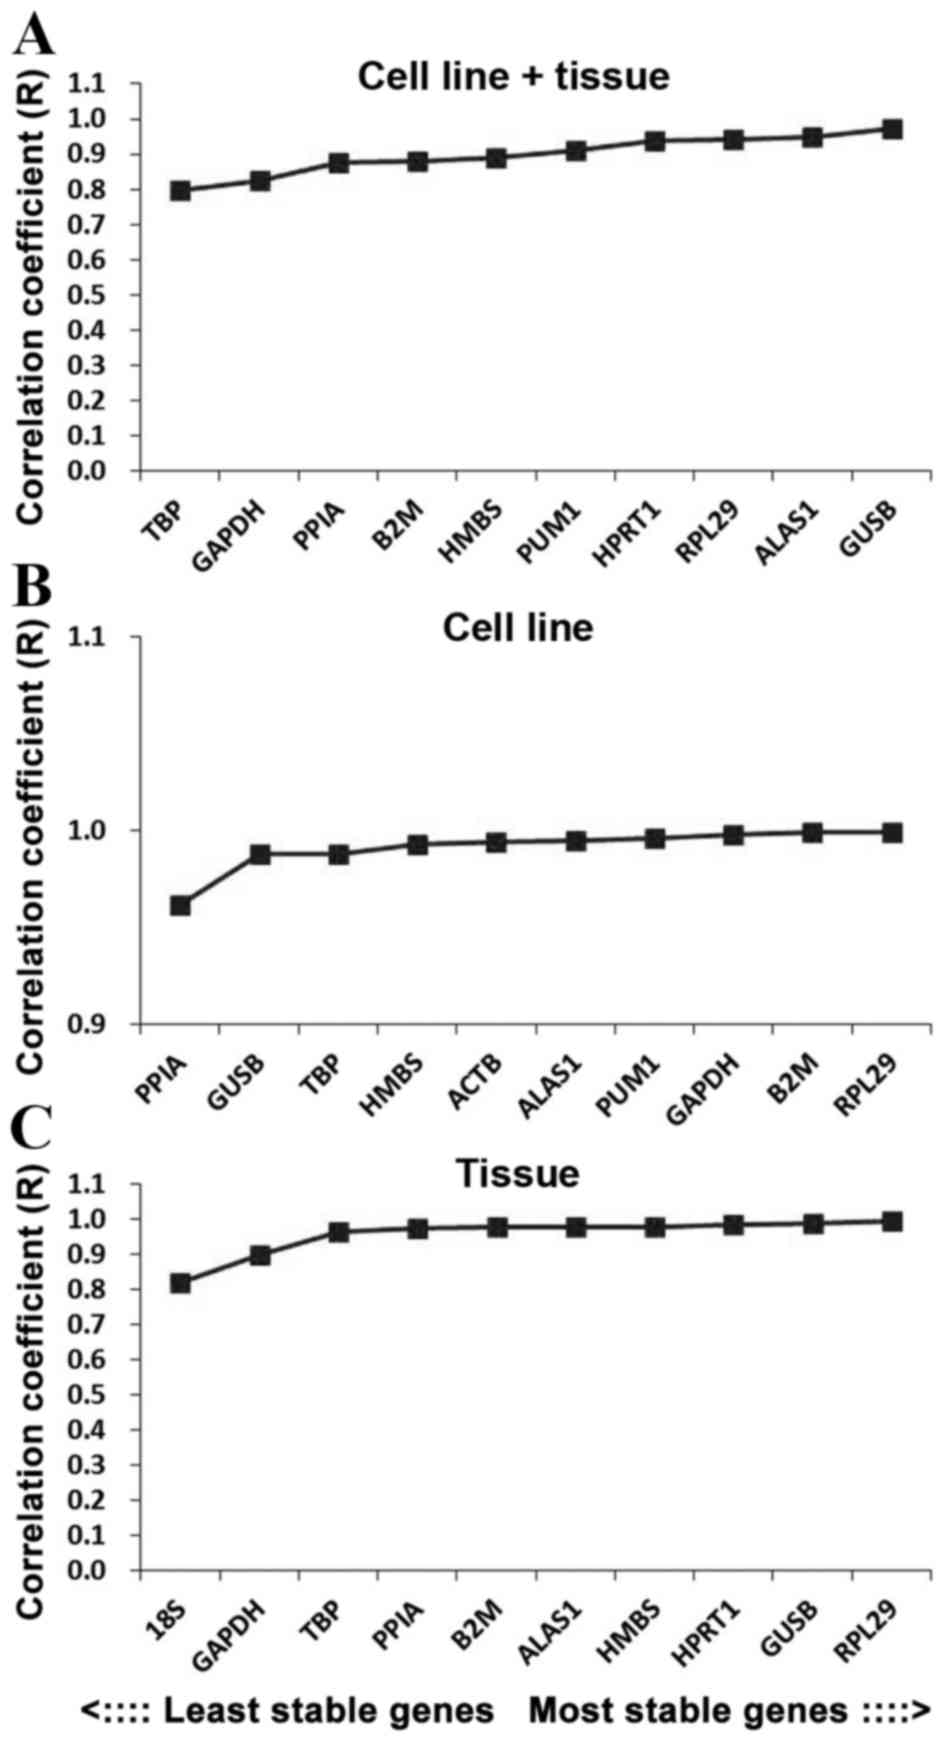
The BestKeeper program was also used to compare the
stability of internal reference genes. As the BestKeeper program is
only able to analyze 10 internal reference genes, the 2 most
unstable internal reference genes indicated by the geNorm software
were removed in each group. In terms of the R-value, the most
stable internal reference gene in the cell line + tissue group was
GUSB, followed by ALAS1 and RPL29 (Fig.
5A). In the cell line group the most stable internal reference
gene was RPL29, followed by B2 M and GAPDH (Fig. 5B), and in the tissue group the most
stable internal reference gene was RPL29, followed by GUSB and
HPRT1 (Fig. 5C).
Discussion
A gene with a steady expression level is required to
normalize the data during detection of target gene expression, and
these are known as internal reference genes. Previous studies have
indicated that the majority of commonly used internal control genes
have flaws. Expression levels of these genes vary significantly
depending on experimental conditions, including different cell
types and tissues, different individuals and different stages of
cell proliferation, organ development and in vitro culture
(4–6).
To the best of our knowledge, the present study is first to compare
the stability of commonly used internal reference genes in human
tongue carcinoma cell line and tissues. As studies investigating
tongue carcinoma gene profiling increase, the confirmation of
stable and reliable internal control genes is required. In the
present study, the reference genes commonly used in studies of gene
expression in tongue carcinoma were those frequently used in
studies examining molecular markers in other cancer types.
To obtain accurate experimental data and reliable
conclusions, the present study used an experimental process with a
number of characteristics. Cell lines and tissues are investigated
in the present study. For the study of cell lines, Tca-8113 and
CAL-27, which are the most commonly used tongue carcinoma cell
lines for in vitro studies, were used. For the study of
tissues, due to limitations for tongue carcinoma surgery, biopsy
specimens were not selected by grades and stages as, according to
previous research, the expression of reference genes is not
directly associated with the grade or stage of a malignant tumor
(12,21). The specimens were confirmed by the
Pathology Department of China-Japan Union Hospital, Jilin
University (Changchun, China) as malignant and the tongue cancer
samples used were the most common pathological types of squamous
cell carcinomas.
A total of 12 common reference genes were compared
in terms of their expression stability and the geNorm, NormFinder
and BestKeeper software programs, commonly used to compare
stability between reference genes, were selected for data
analysis.
The geNorm program was used for initial analysis.
This software program is based on a pairwise-comparison statistical
model. By calculating the values of M and V, the two most stable
reference genes and the optimum number of reference gene
combinations was determined. Following this analysis, the results
suggested that ALAS1 and RPL29 in the cell line + tissue group, B2M
and RPL29 in the cell line group and RPL29 and HPRT1 in the tissue
group were the most stable reference genes. GUSB and the
combination of PPIA and HMBS in the cell line + tissue group, PUM1
and the combination of B2M and HMBS in the cell line group, and
HMBS and the combination of PPIA and HMBS in the tissue group were
considered to be the most stable reference genes and the best
combinations by the NormFinder software program, which is based on
analysis of variance as the statistical model. Finally, in order to
reduce the one-sidedness of the computing models of the
aforementioned software programs, the Bestkeeper program was used
for further analysis. The results suggested that GUSB, RPL29 and
RPL29 were the most stable reference genes in the cell line +
tissue group, cell line group and tissue group, respectively. As
the rank of the candidate gene stability was slightly different,
potentially caused by different calculation algorithms (22,23), no
specific single reference gene was recommended as the optimal
reference gene for normalizing relative quantitative investigations
of tongue carcinoma. In addition, by calculating the value of V,
the optimal number of reference gene combinations of the cell line
+ tissue group, cell line group and tissue group were 11, 2 and 3,
respectively. The boundary value suggested by geNorm was 0.15,
however, rather than a stringent standard consideration, which
provided guidance to determine the optimal number of reference
genes. Regarding the standardized principle of RT-qPCR, previous
studies have recommended selecting a minimum of 3 internal control
genes to perform relative quantitative investigations (24). The present study also recommended that
a combination of 3 reference genes was sufficient for normalizing
relative quantitative investigations. The recommended combination
for the cell line + tissue group was ALAS1 + GUSB + RPL29, for the
cell line group B2M + RPL29 and for the tissue group PPIA + HMBS +
RPL29. These genes were ranked in the forefront of each group
across the three software packages used.
The present study identified the most suitable
reference genes and reference gene combinations for human tongue
carcinoma cell lines and tissues for use in gene expression profile
analysis. A reliable standardized method has the potential to
improve understanding of the biological mechanisms underlying
tongue carcinoma in the future. The relevant clarification of tumor
molecular expression markers may improve the accuracy of diagnosis
and estimation of prognostic factors, and provide novel
treatments.
Acknowledgements
The present study was supported in part by grants
from the Natural Science Foundation of China (grant no. 81503531),
the Education Department of Jilin Province (grant no. 2015536) and
the Science and Technology Department of Jilin Province (grant nos.
201201060 and 201215078).
References
|
1
|
Radonić A, Thulke S, Mackay IM, Landt O,
Siegert W and Nitsche A: Guideline to reference gene selection for
quantitative real-time PCR. Biochem Biophys Res Commun.
313:856–862. 2004. View Article : Google Scholar : PubMed/NCBI
|
|
2
|
Derveaux S, Vandesompele J and Hellemans
J: How to do successful gene expression analysis using real-time
PCR. Methods. 50:227–230. 2010. View Article : Google Scholar : PubMed/NCBI
|
|
3
|
Ali H, Du Z, Li X, Yang Q, Zhang YC, Wu M,
Li Y and Zhang G: Identification of suitable reference genes for
gene expression studies using quantitative polymerase chain
reaction in lung cancer in vitro. Mol Med Rep. 11:3767–3773.
2015.PubMed/NCBI
|
|
4
|
Ma H, Yang Q, Li D and Liu J: Validation
of suitable reference genes for quantitative polymerase chain
reaction analysis in rabbit bone marrow mesenchymal stem cell
differentiation. Mol Med Rep. 12:2961–2968. 2015.PubMed/NCBI
|
|
5
|
Yang Q, Ali HA, Yu S, Zhang L, Li X, Du Z
and Zhang G: Evaluation and validation of the suitable control
genes for quantitative PCR studies in plasma DNA for non-invasive
prenatal diagnosis. Int J Mol Med. 34:1681–1687. 2014.PubMed/NCBI
|
|
6
|
Yu S, Yang Q, Yang JH, Du Z and Zhang G:
Identification of suitable reference genes for investigating gene
expression in human gallbladder carcinoma using reverse
transcription quantitative polymerase chain reaction. Mol Med Rep.
11:2967–2974. 2015.PubMed/NCBI
|
|
7
|
He YX, Zhang Y, Yang Q, Wang C and Su G:
Selection of suitable reference genes for reverse
transcription-quantitative polymerase chain reaction analysis of
neuronal cells differentiated from bone mesenchymal stem cells. Mol
Med Rep. 12:2291–2300. 2015.PubMed/NCBI
|
|
8
|
Li X, Yang Q, Bai J, Xuan Y and Wang Y:
Identification of appropriate reference genes for human mesenchymal
stem cell analysis by quantitative real-time PCR. Biotechnol Lett.
37:67–73. 2015. View Article : Google Scholar : PubMed/NCBI
|
|
9
|
Li X, Yang Q, Bai J, Yang Y, Zhong L and
Wang Y: Identification of optimal reference genes for quantitative
PCR studies on human mesenchymal stem cells. Mol Med Rep.
11:1304–1311. 2015.PubMed/NCBI
|
|
10
|
Moore SR, Johnson NW, Pierce AM and Wilson
DF: The epidemiology of tongue cancer: A review of global
incidence. Oral Dis. 6:75–84. 2000. View Article : Google Scholar : PubMed/NCBI
|
|
11
|
Zhang S, Du Y, Tao J, Wu Y and Chen N:
Expression of cytosolic phospholipase A2 and cyclooxygenase 2 and
their significance in human oral mucosae, dysplasias and squamous
cell carcinomas. ORL J Otorhinolaryngol Relat Spec. 70:242–248.
2008. View Article : Google Scholar : PubMed/NCBI
|
|
12
|
Ohl F, Jung M, Xu C, Stephan C, Rabien A,
Burkhardt M, Nitsche A, Kristiansen G, Loening SA, Radonić A and
Jung K: Gene expression studies in prostate cancer tissue: Which
reference gene should be selected for normalization? J Mol Med
(Berl). 83:1014–1024. 2005. View Article : Google Scholar : PubMed/NCBI
|
|
13
|
Huan P, Maosheng T, Zhiqian H, Long C and
Xiaojun Y: TLR4 expression in normal gallbladder, chronic
cholecystitis and gallbladder carcinoma. Hepatogastroenterology.
59:42–46. 2012.PubMed/NCBI
|
|
14
|
Vandesompele J, De Preter K, Pattyn F,
Poppe B, Van Roy N, De Paepe A and Speleman F: Accurate
normalization of real-time quantitative RT-PCR data by geometric
averaging of multiple internal control genes. Genome Biol.
3:Research00342002. View Article : Google Scholar : PubMed/NCBI
|
|
15
|
Andersen CL, Jensen JL and Ørntoft TF:
Normalization of real-time quantitative reverse transcription-PCR
data: A model-based variance estimation approach to identify genes
suited for normalization, applied to bladder and colon cancer data
sets. Cancer Res. 64:5245–5250. 2004. View Article : Google Scholar : PubMed/NCBI
|
|
16
|
Pfaffl MW, Tichopad A, Prgomet C and
Neuvians TP: Determination of stable housekeeping genes,
differentially regulated target genes and sample integrity:
BestKeeper-Excel-based tool using pair-wise correlations.
Biotechnol Lett. 26:509–515. 2004. View Article : Google Scholar : PubMed/NCBI
|
|
17
|
Sobin LH, Gospodarowicz MK and Wittekind
C: International Union Against CancerTNM Classification of
Malignant Tumours. 7th. Wiley-Blackwell; Chichester, UK: 2009
|
|
18
|
Battula VL, Bareiss PM, Treml S, Conrad S,
Albert I, Hojak S, Abele H, Schewe B, Just L, Skutella T and
Bühring HJ: Human placenta and bone marrow derived MSC cultured in
serum-free, b-FGF-containing medium express cell surface frizzled-9
and SSEA-4 and give rise to multilineage differentiation.
Differentiation. 75:279–291. 2007. View Article : Google Scholar : PubMed/NCBI
|
|
19
|
Mane VP, Heuer MA, Hillyer P, Navarro MB
and Rabin RL: Systematic method for determining an ideal
housekeeping gene for real-time PCR analysis. J Biomol Tech.
19:342–347. 2008.PubMed/NCBI
|
|
20
|
Livak KJ and Schmittgen TD: Analysis of
relative gene expression data using real-time quantitative PCR and
the 2(−Delta Delta C(T)) method. Methods. 25:402–408. 2001.
View Article : Google Scholar : PubMed/NCBI
|
|
21
|
Wan H, Zhao Z, Qian C, Sui Y, Malik AA and
Chen J: Selection of appropriate reference genes for gene
expression studies by quantitative real-time polymerase chain
reaction in cucumber. Anal Biochem. 399:257–261. 2010. View Article : Google Scholar : PubMed/NCBI
|
|
22
|
Chang E, Shi S, Liu J, Cheng T, Xue L,
Yang X, Yang W, Lan Q and Jiang Z: Selection of reference genes for
quantitative gene expression studies in Platycladus orientalis
(Cupressaceae) Using real-time PCR. PLoS One. 7:e332782012.
View Article : Google Scholar : PubMed/NCBI
|
|
23
|
Brugè F, Venditti E, Tiano L, Littarru GP
and Damiani E: Reference gene validation for qPCR on normoxia- and
hypoxia-cultured human dermal fibroblasts exposed to UVA: Is
β-actin a reliable normalizer for photoaging studies? J Biotechnol.
156:153–162. 2011. View Article : Google Scholar : PubMed/NCBI
|
|
24
|
Wisnieski F, Calcagno DQ, Leal MF, dos
Santos LC, Gigek Cde O, Chen ES, Pontes TB, Assumpção PP, de
Assumpção MB, Demachki S, et al: Reference genes for quantitative
RT-PCR data in gastric tissues and cell lines. World J
Gastroenterol. 19:7121–7128. 2013. View Article : Google Scholar : PubMed/NCBI
|