Introduction
Bladder cancer (BC) is the fourth most common cancer
and the eighth leading cause of cancer-associated mortality
worldwide. BC is an important public health issue as it is
biologically very aggressive and highly prevalent in Western
countries (1). In 2017, an estimated
79,030 new cases of BC and 16,870 mortalities will occur in the USA
(2). In China, the incidence and
mortality rates of BC rank the highest among tumors of the male
urogenital system (3). Painless
hematuria is the main symptom of BC, and its diagnosis is
established based on urinary cytology and transurethral tumor
resection (4). There is an increasing
trend in incidence and mortality rates of BC. Numerous studies have
identified various risk factors that may induce BC, including
geography, race, gender, schistosomiasis infection, environmental
or occupational exposure, smoking and genetic susceptibility
(5–7).
Tumor progression is a complicated procedure of
cancer cell development from normal epithelial cells, which
involves changes in various genes, including oncogenes, cell
cycle-associated genes, tumor suppressor genes and DNA damage
repair genes. These are potential tumor markers in clinical
practice; however, additional clinical studies are required to
confirm their clinical utility (8–10).
Development of molecular biology has increased the understanding of
the mechanism underlying BC. Dyrskjøt et al (11) detected carcinoma in situ gene
expression that is reflected in carcinoma in situ biopsies
and superficial transitional cell carcinoma. Biton et al
(12) demonstrated that a molecular
urothelial differentiation program was maintained by applying
independent component analysis to bladder cancer transcriptome data
and exploiting additional molecular and clinic pathological
data.
Network-based approaches, particularly co-expression
networks, offer a more effective means to identify potential
malignancy diagnostic molecules based on connecting them together.
Co-expression networks are generally used to study disease
mechanisms (13) and provide a
systems level view of dysregulated signaling pathways (14). The basic premise of co-expression
analysis is that strongly correlated genes are likely to be
functionally associated. Furthermore, it is possible to gain a
clear insight into the important tumorigenic genes and signaling
pathways of a variety of diseases, many of which are applicable to
early detection and treatment (15).
In order to investigate the molecular and genetic
mechanisms of BC, the present study identified the differentially
expressed genes (DEGs) between BC and normal controls and
constructed co-expression networks of BC via differentially
co-expressed genes and links (DCGL); subsequently, the hub genes
and pathways were further investigated by centrality analysis and
using the Kyoto Encyclopedia of Genes and Genomes (KEGG) database,
respectively. In addition, the hub genes that were potential tumor
markers for BC progression were validated in BC tissues using
reverse transcription-quantitative polymerase chain reaction
(RT-qPCR) and western blotting.
Materials and methods
Data collection and preprocessing
A total of two gene expression datasets from healthy
people and BC patients, including E-MTAB-1940 and E-GEOD-3167, were
obtained from the ArrayExpress database (www.ebi.ac.uk/arrayexpress/). A total of 146 samples
(128 cases and 18 controls) were collected in the present study.
The dataset E-MTAB-1940 (12)
included 4 controls (samples from normal bladders) and 82 cases
(samples from BC tissue); the dataset E-GEOD-3167 (11) included 14 controls and 46 cases.
Data preprocessing for all original expression
information was performed prior to the analysis. In order to reduce
the influence of nonspecific factors about, the background
correction and normalization were performed using the robust
multichip average method (16) and
the quantile based algorithm (17),
respectively. Perfect match and mismatch values were revised and
selected using the Micro Array Suite 5.0 (MAS 5.0) algorithm
(18) and the median method,
respectively. Subsequently, the data were screened by the feature
filter method of the genefilter package (http://bioconductor.org/packages/release/bioc/html/genefilter.html).
Each probe was mapped to one gene using getSYMBOL, whoch is is a
function in package annotate of the genefilter package (http://www.bioconductor.org/packages/release/bioc/html/annotate.html),
and the probe was discarded if it did not match any genes. The two
expression datasets were merged and synthetically analyzed using
Batch Mean-centering, a merged data method (19), following adaptation according to
Support Vector Machines, through the inSilicoMerging package
(20).
Detection of DEGs
In the present study, the DEGs between BC patients
and normal controls were screened by the linear models for
microarray data (LIMMA) package (21). t-tests and F-tests were
performed on the matrix, and the P-values were transformed to
-log10. Empirical Bayes (22)
statistics and false discovery rate (23) calibration of P-values for the data
were conducted using the lmFit function (lmFit:http://lmfit.github.io//lmfit-py/). The DEGs were
selected from following inspection for the following cut-off
criteria: values of |log fold change (FC)|≥2 and P<0.05.
Construction of differential
co-expression networks by DCGL
It is critical to construct a co-expression network
for identifying modules and the intra-modular connectivity. DCGL
2.0 (24) is an R package for
identifying differentially co-expressed genes (DCGs) and
differentially co-expressed links (DCLs) from gene expression
microarray data. It examines the expression correlation based on
the exact co-expression changes of gene pairs between two
conditions, and thus is able to differentiate significant
co-expression changes from relatively trivial ones (25). It has four functional modules: Gene
filtration, link filtration, differential co-expression analysis
(DCEA) and differential regulation analysis. Differential
co-expression profile (DCp) and differential co-expression
enrichment (DCe) are involved in the DCEA module for extracting
DCGs and DCLs. DCp worked on the filtered set of gene co-expression
value pairs, where each pair was composed of two co-expression
values worked out under two different conditions separately
(24,26). The present study used a
length-normalized Euclidean distance to measure differential
co-expression (dC) of the co-expression value pairs associated with
a particular gene. A permutation test was performed to assess the
significance of dC. The sample permutation was repeated N times,
and a large number of permutation dC statistics formed an empirical
null distribution. The P-value for each gene could then be
estimated.
DCe was also used to identify DCGs and DCLs, which
were based on the ‘Limit Fold Change’ (LFC) model. Initially,
correlation pairs were divided into 3 parts according to the
pairing of signs of co-expression values and the multitude of
co-expression values: Pairs with the same signs, pairs with
different signs and pairs with differently-signed high
co-expression values. The first two groups were processed with the
‘LFC’ model separately to produce two subsets of DCLs, while the
third group was added to the set of DCLs directly. Therefore, a
total of DCLs was determined from all gene links.
Centrality analysis
To additionally assess the key genes of BC, a
centricity analysis was performed based on the nodes degree in the
networks (27). Centrality measures
mainly contain degree centrality, closeness centrality and shortest
path between centrality, in which degree, the equivalent of the
number of nodes directly adjacent to a given node (indicating the
degree the vertex), is the simplest topological index (27). In the present study, centrality
analysis, which was particularly useful to identify key players in
biological processes, was implemented to study the differential
co-expression networks. Calculation of the degree allows
determining the ‘degree distribution’, which gives the probability
that a selected node has exact links. Nodes with high degree
(highly connected) are called ‘hubs’, which interact with several
other genes, suggesting a central role in the interaction network
(28). An obvious order of the
vertices of a graph may be established by sorting them according to
their degree (29). Genes with degree
≥9 were defined as hub genes in the present study.
Pathway enrichment analysis
To investigate the enriched signaling pathways of
the DEGs, enrichment analysis was performed based on the KEGG
database (www.genome.jp/kegg/). The DEGs were
applied to this database for investigating the association between
the biochemical pathways and the occurrence of bladder cancer. The
analysis was conducted by DAVID (30)
(david.abcc.ncifcrf.gov/tools.jsp). The enrichment
pathway analysis of the DEGs contributed to additional observation
of these genes at the macroscopic level. Categories were obtained
according to the Expression Analysis Systematic Explorer (31) score for 0.01.
Patients
Tumor tissues from 10 BC patients were obtained
during biopsy in Qilu Hospital of Shandong University (Jinan,
China) between January 2015 and March 2015. Normal samples were
collected from 2 cm away from the tumor. The present study was
approved by the Ethical Committee of Qilu Hospital of Shandong
University. Written informed consent was obtained from patients who
agreed to participate in the study.
Validation of hub genes by RT-qPCR and
western blotting
The tumor tissues of 10 BC patients and normal
tissue samples obtained from 2 cm away from the tumor were analyzed
with polymorphic DNA markers, and total RNA was prepared using
TRIzol (Beyotime Institute of Biotechnology- Haimen, China). Total
RNA was reverse transcribed with an oligo (dT18) primer and was
treated with 2 µl RNasin (40 U/µl), 8.0 µl 5X reverse transcriptase
buffer, 8.0 µl dNTPs and 2 µl AMV reverse transcriptase (5 U/µl)
according to the manufacturer's protocol. The RT reagents were
purchased from Invitrogen (Thermo Fisher Scientific, Inc., Waltham,
MA, USA). For RT-qPCR, primer sequences of the 5 hub genes are
listed in Table I. The qPCR mix
composition was as follows: 10 µl of 10X qPCR buffer, 1 µl of Taq
DNA polymerase, 3 µl of each forward and reverse primer and 8 µl of
dNTPs. The qPCR reagents were purchased from Invitrogen (Thermo
Fisher Scientific, Inc.). The qPCR conditions are shown in Table II. Complementary DNA was used as a
template, and β-actin was used as an internal reference. RT-PCR
products were separated using 1.5% agarose gel electrophoresis and
gels were visualized using Quantity One Software v4.62 (Bio-Rad
Laboratories, Inc., Hercules, CA, USA). Every sample was run 3
times along with the internal control.
 | Table I.Primer sequences and product length
of the 5 hub genes. |
Table I.
Primer sequences and product length
of the 5 hub genes.
| Gene | Primer sequences
(5′-3) | Length (bp) |
|---|
| LGALS4 | F:
GCCTTCCACTTCAATCCGC | 355 |
|
| R:
GGCTGTTCAGCTGTTGATGG |
|
| PTPRN2 | F:
GTGGACCATGGAGTAGCTCG | 541 |
|
| R:
GTCCGAGAACCTCTCTGTCT |
|
|
TMPRSS11E | F:
GTCTCAGGATCGTTGGTGGG | 720 |
|
| R:
ACAAGAAAGTTGGCAAGATACCAGT |
|
| TRIM31 | F:
GTCTTGTGCAGAAGTGAAGAGTT | 178 |
|
| R:
TCACAAAACCAAGCCCGGAT |
|
| KCND3 | F:
TTTACACTGGAGGTGGGGGA | 506 |
|
| R:
TGCAGTGCGATTTCAGGTCT |
|
| β-actin | F:
AAGTACTCCGTGTGGATCGG | 615 |
|
| R:
TCAAGTTGGGGGACAAAAAG |
|
| Table II.Quantitative polymerase chain
reaction amplification conditions for the 5 hub genes. |
Table II.
Quantitative polymerase chain
reaction amplification conditions for the 5 hub genes.
| Gene | Reaction
conditions |
|---|
| LGALS4 | 94°C 1 min; 35
cycles of 98°C 10 sec, 54°C 15 sec, 68°C 1 min; 72°C 7 min |
| PTPRN2 | 94°C 2 min; 35
cycles of 98°C 10 sec, 50°C 15 sec, 68°C 1 min; 72°C 7 min |
|
TMPRSS11E | 94°C 2 min; 33
cycles of 98°C 10 sec, 55°C 15 sec, 68°C 1 min; 72°C 7 min |
| TRIM31 | 94°C 2 min; 35
cycles of 98°C 10 sec, 54°C 15 sec, 68°C 1 min; 72°C 7 min |
| KCND3 | 94°C 2 min; 33
cycles of 98°C 10 sec, 54°C 15 sec, 68°C 1 min; 72°C 7 min |
| β-actin | 94°C 2 min; 30
cycles of 98°C 10 sec, 51°C 15 sec, 68°C 1 min; 72°C 7 min |
Proteins were extracted from tumor tissues and
adjacent normal tissues according to the method reported by Yoon
et al (32). Protein
concentration was measured with a BCA Protein Assay kit (CW
Biotech, Beijing, China). SDS-PAGE (12%) was performed for 10 µg
protein, and the protein was electrotransferred (4°C, 300 mA, 2 h)
to a nitrocellulose membrane. The membrane was blocked in TBST
containing 5% skimmed milk powder at 37°C for 2 h, and incubated
with rabbit anti-human antibodies (1:10,000) against lectin,
galactoside-binding, soluble, 4 (LGALS4) [AP12391a; Abgent Biotech
(SuZhou) Co., Ltd., Suzhou, China], protein tyrosine phosphatase,
receptor type N2 (PTPRN2) (bs-19591R; BIOSS, Beijing, China),
transmembrane protease, serine 11E (TMPRSS11E) [AP16520C; Abgent
Biotech (SuZhou) Co., Ltd.], tripartite motif containing 31
(TRIM31) (bs-6220R; BIOSS), potassium voltage-gated channel
subfamily D member 3 (KCND3) (bs-20219R; BIOSS) and GAPDH [AP50811;
Abgent Biotech (SuZhou) Co., Ltd.] at 37°C for 2 h. Unbound
antibody was washed away by TBST (3 times), and the membrane was
incubated with horseradish peroxdiase-labeled sheep anti-rabbit
immunoglobulin G secondary antibody (1:5,000; SC-2048; Beijing
Zhongshan Jinqiao Biotechnology Co., Ltd., Beijing, China) at 37°C
for 2 h. Following washing with TBST, the substrate was developed
on the membrane for 3 min and exposed in the dark. Protein bands
were visualized with Amersham ECL Western Blotting Detection kit
(GE Healthcare Life Sciences, Chalfont, UK). GAPDH was used as an
internal control, and western blots were analyzed using ImageJ
1.36b software (National Institutes of Health, Bethesda, MD, USA;
http://rsb.info.nih.gov/ij/).
Statistical analysis
Statistical analysis was conducted using SPSS 20.0
software (IBM SPSS, Armonk, NY, USA). All data were presented as
mean ± standard deviation. Statistical differences among groups
were assessed using one way analysis of variance. P<0.05 was
considered to indicate a tatistically significanct difference.
Graphs were designed using GraphPad Prism 5.0 (GraphPad Software,
Inc., La Jolla, CA, USA).
Results
Detection of DEGs
In the present study, a total of 146 samples of two
datasets associated with BC were preprocessed to identify DEGs
using the LIMMA package. A total of 329 DEGs, including 147
upregulated and 182 downregulated genes between BC patients and
normal subjects were detected under the criteria of |logFC|≥2 and
P<0.05.
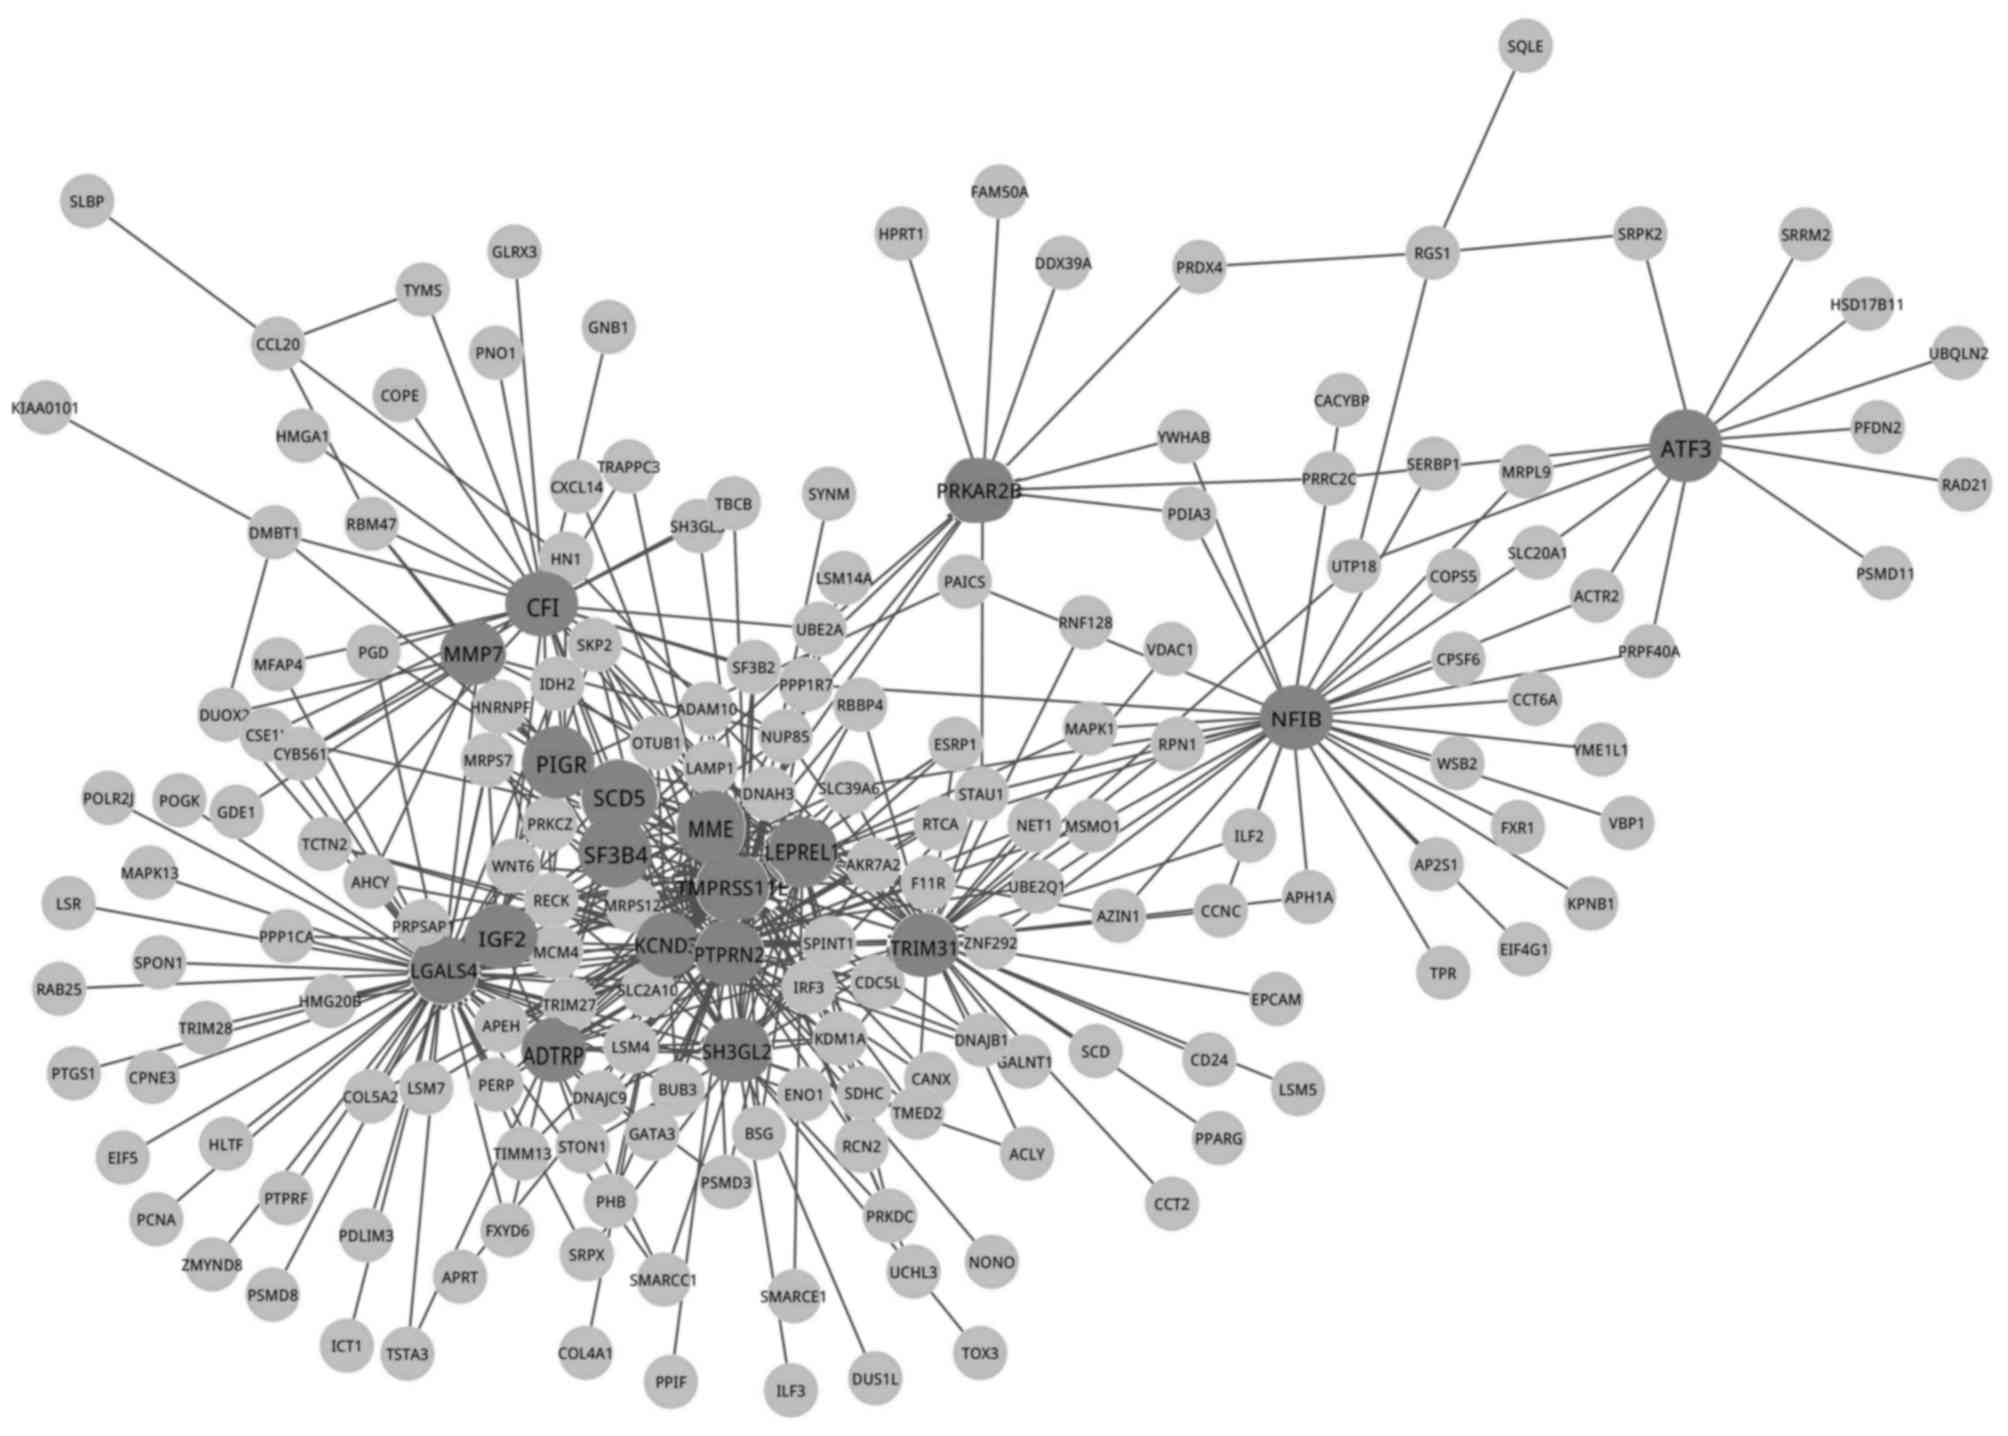
Construction of differential
co-expression networks by DCGL
The present study applied the DCGL 2.0 package in R
to identify DCGs and DCLs, in which DCp and DCe methods involved in
DCEA module were employed. A total of 434 DCLs were included in the
co-expression network, and the two genes in each link were DCGs. A
gene co-expression network containing 182 nodes and 434 edges was
constructed in the analysis (Fig.
1).
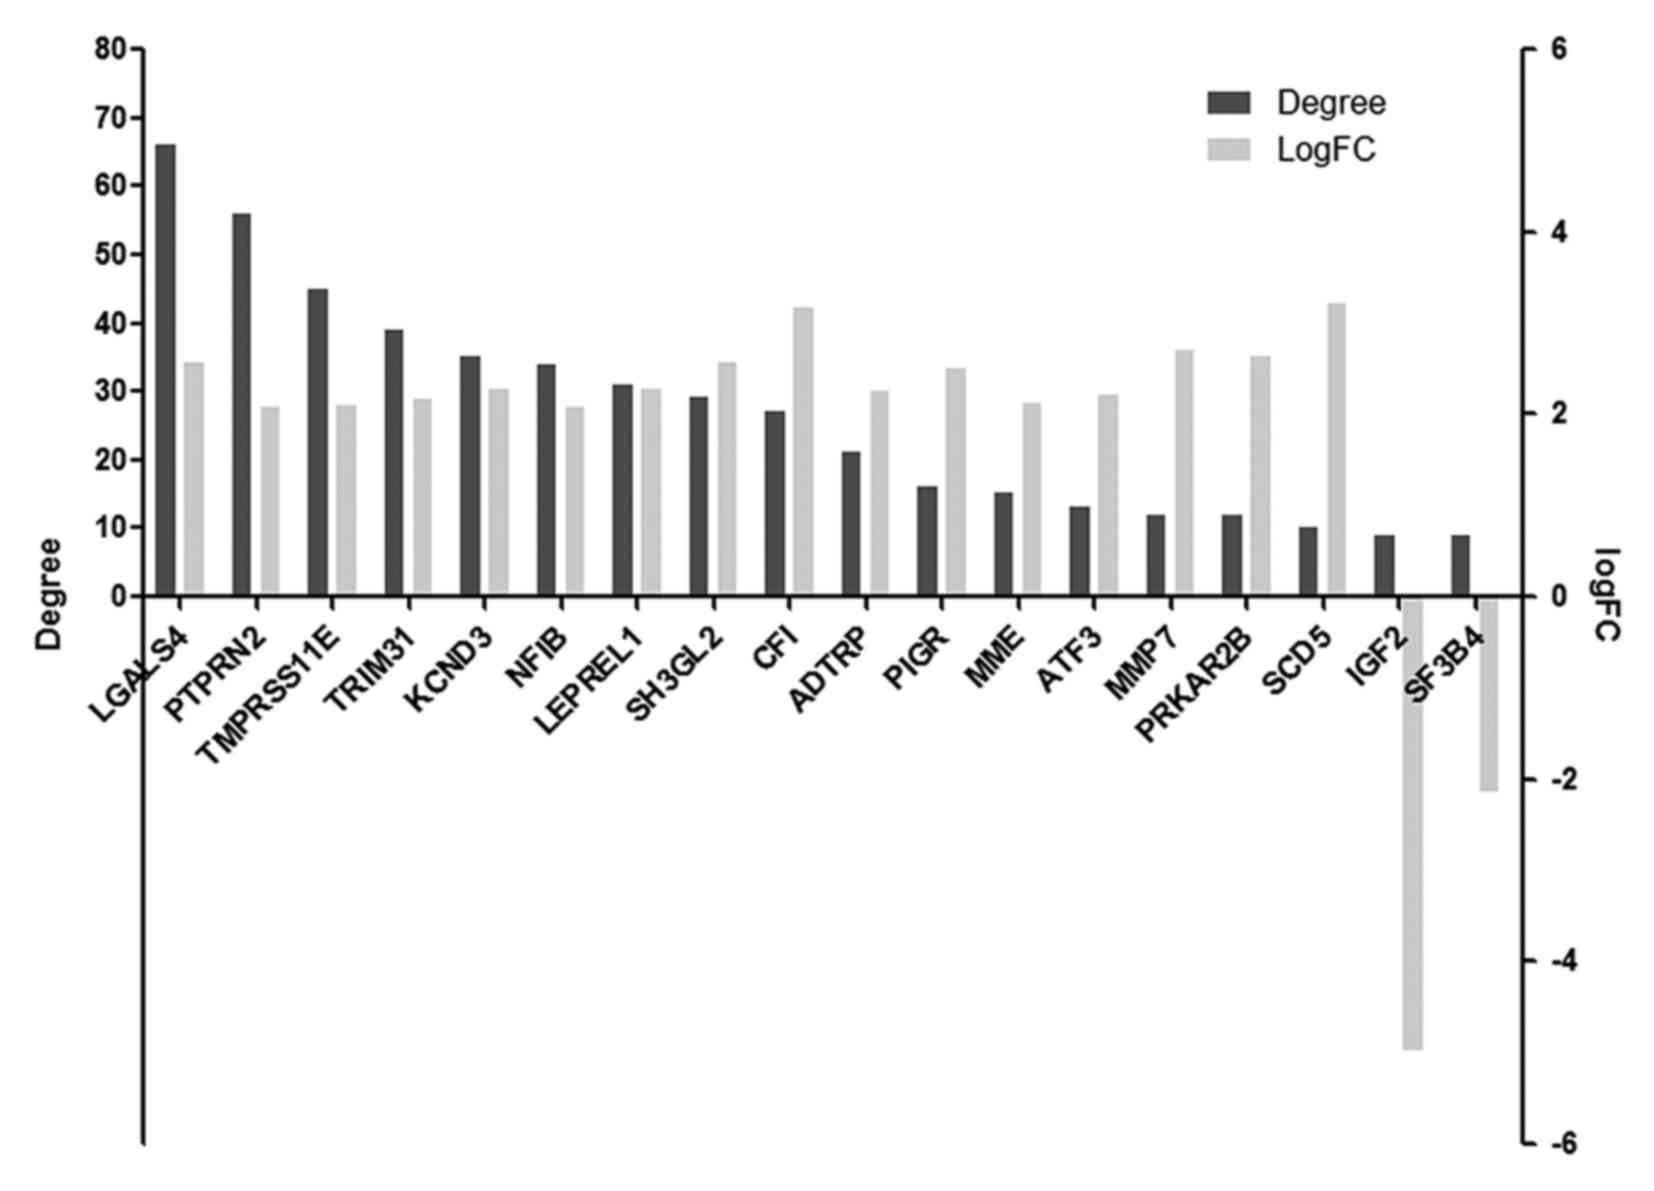
Centrality analysis
By accessing degree centrality analysis of the
co-expression network, 18 hub genes were obtained with degree ≥9
(Table III), of which 16 genes were
upregulated and 2 were downregulated (Fig. 2). The genes LGALS4, PTPRN2, TMPRSS11E,
TRIM31 and KCND3 were the top 5 hub genes with high degree, and all
of them were upregulated.
| Table III.Eighteen hub genes where the degree
was ≥9 in the co-expression network. |
Table III.
Eighteen hub genes where the degree
was ≥9 in the co-expression network.
| Genes | Degree |
|---|
| LGALS4 | 66 |
| PTPRN2 | 56 |
|
TMPRSS11E | 45 |
| TRIM31 | 39 |
| KCND3 | 35 |
| NFIB | 34 |
| LEPREL1 | 31 |
| SH3GL2 | 29 |
| CFI | 27 |
| ADTRP | 21 |
| PIGR | 16 |
| MME | 15 |
| ATF3 | 13 |
| MMP7 | 12 |
| PRKAR2B | 12 |
| SCD5 | 10 |
| IGF2 | 9 |
| SF3B4 | 9 |
Pathway enrichment analysis
Pathway analysis based on the KEGG database revealed
that these DEGs were significantly enriched in 5 terms, which were
cell cycle (P=4.37×10⁻⁷), DNA replication
(P=1.95×10⁻³), oocyte meiosis (P=6.47×10⁻³),
p53 signaling pathway (P=7.17×10⁻³) and the peroxisome
proliferator-activated receptor (PPAR) signaling pathway
(P=7.70E-03). Among the 5 terms, the cell cycle pathway was the
most significant term, which also enriched more genes compared with
the other terms.
Validation by RT-qPCR and western
blotting
In the present study, to confirm the messenger RNA
(mRNA) and protein expression levels of 5 hub genes (LGALS4,
PTPRN2, TMPRSS11E, TRIM31 and KCND3) from the co-expression
network, RT-qPCR and western blotting was performed on BC patient
samples. The results of the relative expression of all the hub
genes are shown in Figs. 3 and
4. It was observed that 4/5 hub genes
and the corresponding proteins including LGALS4, PTPRN2,
TMPRSS11E and TRIM31 were significantly differentially
expressed between BC patients and healthy subjects (P<0.05),
while KCND3 was not significantly differentially expressed
(P>0.05). Furthermore, it was noted that the relative expression
of LGALS4, TMPRSS11E and TRIM31 was increasing, which
was consistent with the result of the bioinformatics analysis,
while PTPRN2 demonstrated the opposite trend. KCND3,
which was downregulated in the bioinformatics investigation, was
not significantly differentially expressed.
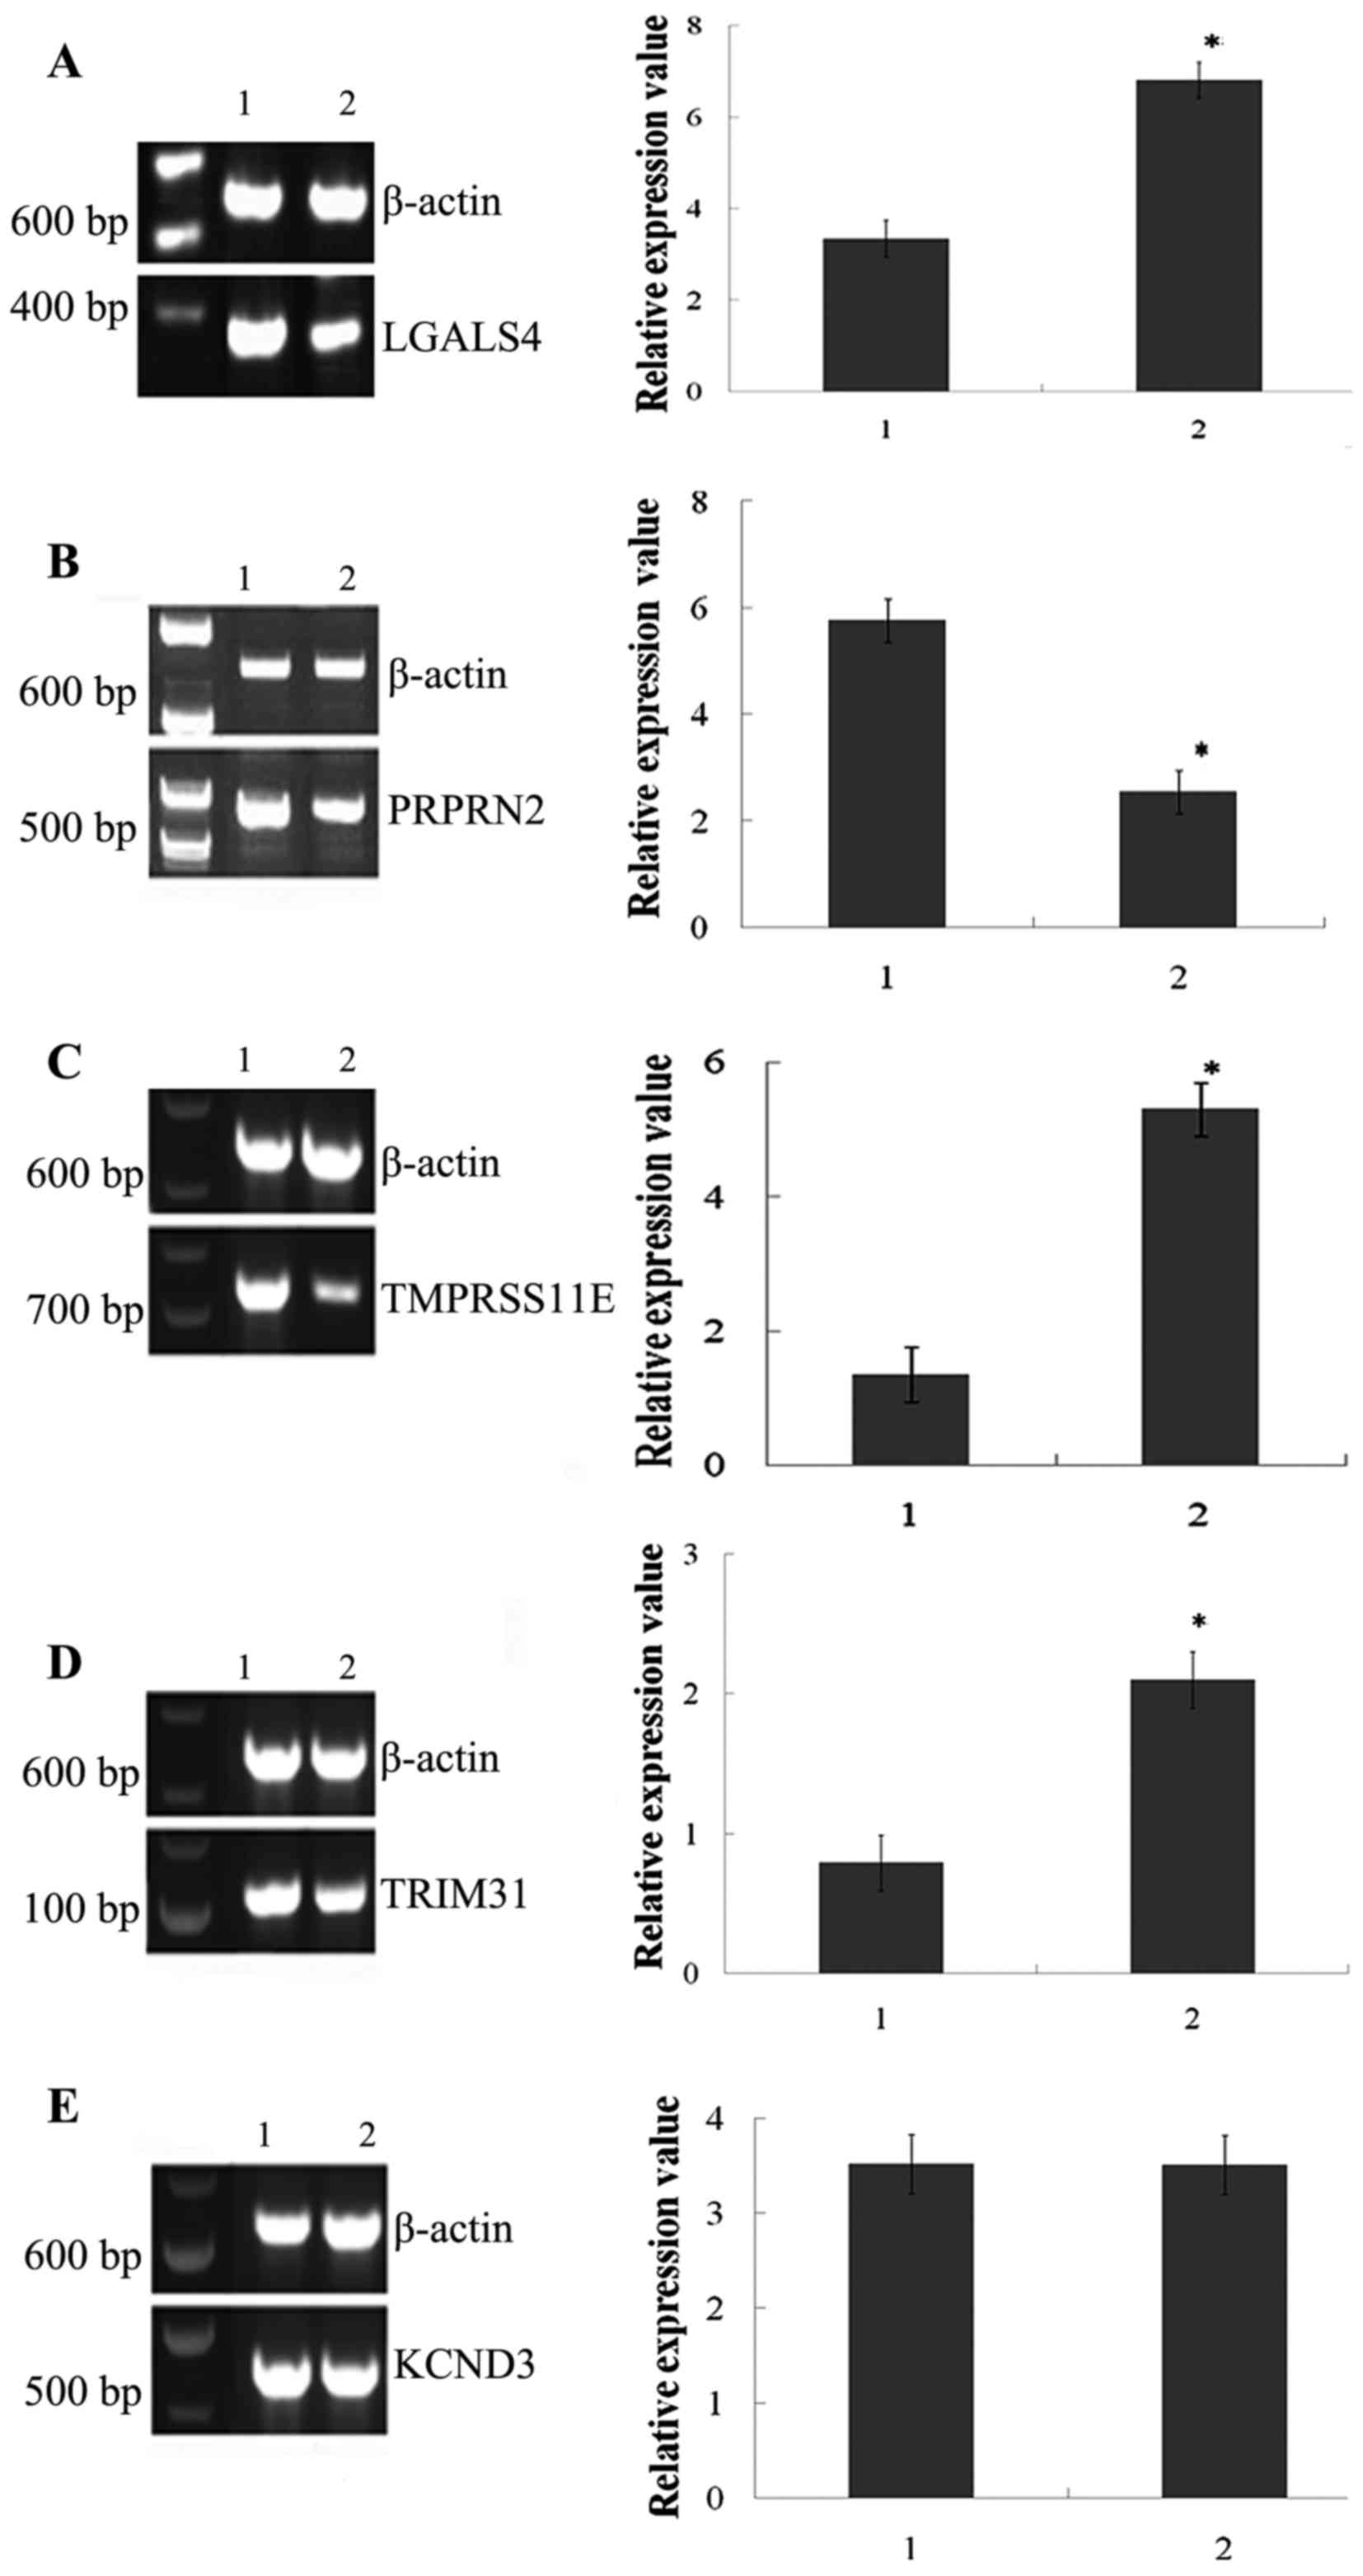 | Figure 3.Results of reverse
transcription-quantitative polymerase chain reaction analysis for 5
hub genes from the co-expression network. 1 represents the normal
control and 2 represents disease. The following genes were
investigated: (A) LGALS4, (B) PTPRN2, (C) TMPRSS11E, (D) TRIM31 and
(E) KCND3. *P<0.05. LGALS4, lectin, galactoside-binding,
soluble, 4; PTPRN2, protein tyrosine phosphatase, receptor
type N2; TMPRSS11E, transmembrane protease, serine 11E;
TRIM31, tripartite motif containing 31; KCND3,
potassium voltage-gated channel subfamily D member 3. |
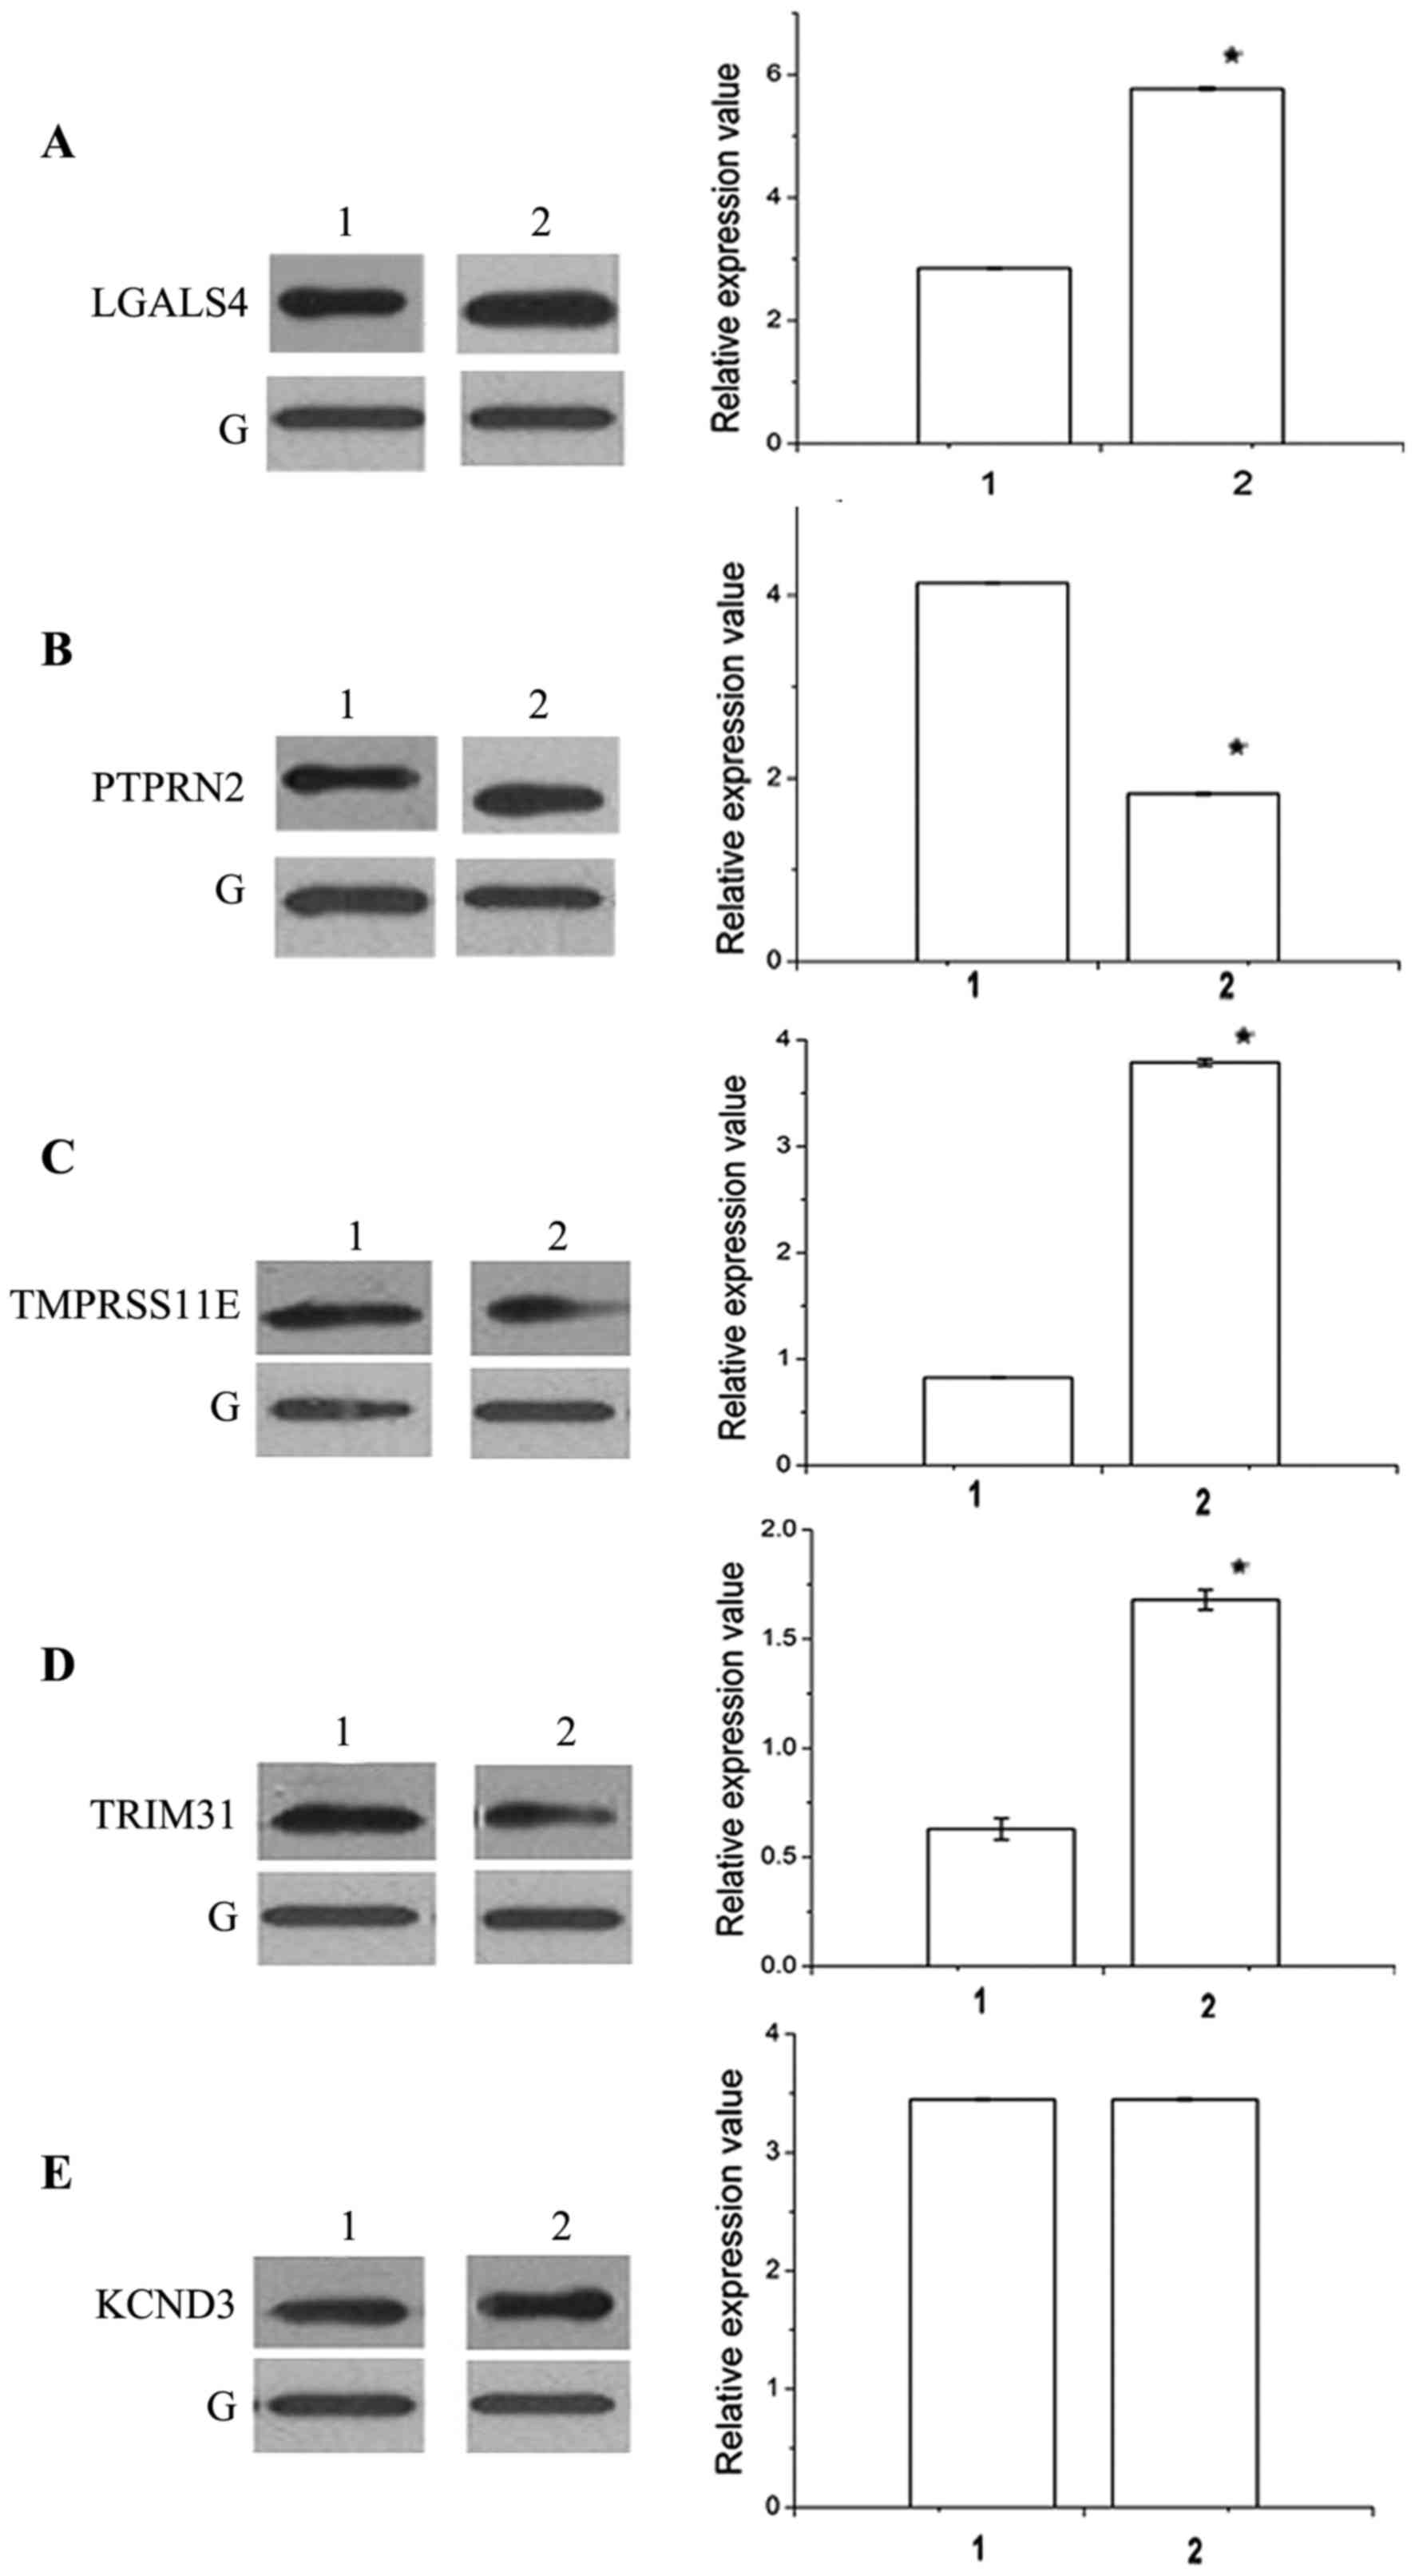 | Figure 4.Results of western blot analysis for
5 hub genes. G represents GAPDH, 1 represents normal control and 2
represents disease. The following genes were analyzed: (A) LGALS4,
(B) PTPRN2, (C) TMPRSS11E, (D) TRIM31 and (E) KCND3. *P<0.05.
LGALS4, lectin, galactoside-binding, soluble, 4;
PTPRN2, protein tyrosine phosphatase, receptor type N2;
TMPRSS11E, transmembrane protease, serine 11E;
TRIM31, tripartite motif containing 31; KCND3,
potassium voltage-gated channel subfamily D member 3. |
Discussion
BC is a heterogeneous disease, with 30% of cases
presenting as muscle-invasive disease associated with a high risk
of death from distant metastases, which may be managed with
transurethral resection (33).
However, BC has a notable tendency to recur (30–85%), therefore the
present study investigated an adequate method for investigating
biomarkers in BC, that may contribute to our understanding of the
pathogenesis and diagnoses of the disease, substantially reducing
the mortality associated with this disease.
In the present study, hub genes and pathways of BC
were identified based on degree centrality analysis of the
co-expression network and pathway enrichment analysis. A total of
18 hub genes were obtained, the top 5 of which were LGALS4,
PTPRN2, TMPRSS11E, TRIM31 and KCND3, by conducting
centrality analysis on the co-expression network. Furthermore, cell
cycle, DNA replication, oocyte meiosis, the p53 signaling pathway
and the PPAR signaling pathway were observed to be significant
pathways of BC. In addition, RT-qPCR and western blotting were
performed to verify network-based results and investigate
significant genes of BC.
RT-qPCR analysis revealed that 3 hub genes
(LGALS4, TMPRSS11E and TRIM31) were significantly
upregulated in BC patients when compared with normal subjects,
which was consistent with the bioinformatics analysis; however,
KCND3 was not significantly differentially expressed between
the conditions, and in contrast to the bioinformatics result, the
relative content of the upregulated PTPRN2 was significantly
reduced. This result was not entirely consistent with the network
analysis. The probable reason for this was variations of samples;
the microarray data was downloaded from the ArrayExpress database
and RT-qPCR and western blotting were performed on patient samples.
Therefore, it can be speculated that the 3 consistent hub genes
(LGALS4, TMPRSS11E and TRIM31) may be
potential markers of BC. LGALS4 has been identified as one
of the genes involved in numerous types of human tumor, including
sinonasal adenocarcinoma tumors (34), colorectal cancer (35) and breast cancer (36). There has also been a previous report
that compared expression changes at mRNA and protein levels in the
rat model and identified the gene exhibiting concordant changes
with LGALS4 levels in bladder tumors (37). TRIM family proteins are involved in
various cellular processes, including tumor development and
antiviral response (38). One of the
family proteins, TRIM31, was originally identified as a gene
induced by growth-suppressive retinoid (39). A previous study showed that
TRIM31 had the ability to regulate cell proliferation
negatively in gastric adenocarcinoma (40) and its expression was reduced in lung
cancer cell lines (41). However, the
expression level of TRIM31 was increased in BC patients in
the present study. Additional research is required to verify the
biological properties of TRIM31.
Pathway analysis revealed that several significantly
enriched signaling pathways included cell cycle, DNA replication,
oocyte meiosis, the p53 signaling pathway and the PPAR signaling
pathway. The cell cycle is the universal process through which
cells reproduce and grow in all living organisms, and is concerned
with the copying of the hereditary material, including replication
of the chromosomal DNA during mitosis (42). Previous studies have indicated that
several tumor suppressor candidates exert growth inhibitory effects
by inducing cell cycle arrest at G2/M phase in leukemia cells
(43), and exerted different tumor
suppressive effects (44). In
addition, Li et al (45)
indicated the effect of the cell cycle on the susceptibility of SAS
cells to sonodynamic therapy. p53 is a sequence-specific
DNA-binding protein that promotes cell-cycle arrest or apoptosis in
response to a variety of cellular stresses (46). The p53 signaling pathway had been
suggested as a cellular surveillance mechanism for cancer
prevention (47). Furthermore, drug
development programs are underway to target the p53 signaling
pathway (48).
In conclusion, the present study identified 5 hub
genes associated with BC, and 3 of these were verified via
molecular experiments, RT-qPCR and western blotting. The signaling
pathways associated with these genes were presented systematically.
These genes and pathways may be potential biomarkers for early
detection and therapy for BC.
Glossary
Abbreviations
Abbreviations:
|
BC
|
bladder cancer
|
|
DEGs
|
differentially expressed genes
|
|
DCGL
|
differentially co-expressed genes
|
|
KEGG
|
Kyoto encyclopedia of genes and
genomes
|
|
RT-qPCR
|
reverse transcription-quantitative
polymerase chain reaction
|
|
DCGs
|
differentially co-expressed genes
|
|
DCLs
|
differentially co-expressed links
|
|
DCEA
|
differential co-expression
analysis
|
|
DCp
|
differential co-expression profile
|
|
DCe
|
differential co-expression
enrichment
|
References
|
1
|
Rubio G, García-Mora B, Santamaria C and
Pontones JL: A flowgraph model for bladder carcinoma. Theor Biol
Med Model. 11 Suppl 1:S32014. View Article : Google Scholar : PubMed/NCBI
|
|
2
|
Siegel RL, Miller KD and Jemal A: Cancer
Statistics, 2017. CA Cancer J Clin. 67:7–30. 2017. View Article : Google Scholar : PubMed/NCBI
|
|
3
|
Chen WQ, Zeng HM, Zheng RS, Zhang SW and
He J: Cancer incidence and mortality in China, 2007. Chin J Cancer
Res. 24:1–8. 2012. View Article : Google Scholar : PubMed/NCBI
|
|
4
|
Sharma S, Ksheersagar P and Sharma P:
Diagnosis and treatment of bladder cancer. Am Fam Physician.
80:717–723. 2009.PubMed/NCBI
|
|
5
|
Burger M, Catto JW, Dalbagni G, Grossman
HB, Herr H, Karakiewicz P, Kassouf W, Kiemeney LA, La Vecchia C,
Shariat S and Lotan Y: Epidemiology and risk factors of urothelial
bladder cancer. Eur Urol. 63:234–241. 2013. View Article : Google Scholar : PubMed/NCBI
|
|
6
|
Wyszynski A, Tanyos SA, Rees JR, Marsit
CJ, Kelsey KT, Schned AR, Pendleton EM, Celaya MO, Zens MS, Karagas
MR and Andrew AS: Body mass and smoking are modifiable risk factors
for recurrent bladder cancer. Cancer. 120:408–414. 2014. View Article : Google Scholar : PubMed/NCBI
|
|
7
|
Letašiová S, Medve'ová A, Šovčíková A,
Dušinská M, Volkovová K, Mosoiu C and Bartonová A: Bladder cancer,
a review of the environmental risk factors. Environ Health. 11
Suppl 1:S112012. View Article : Google Scholar : PubMed/NCBI
|
|
8
|
Xue Y, Wu G, Wang X, Zou X, Zhang G, Xiao
R, Yuan Y, Long D, Yang J, Wu Y, et al: CIP2A is a predictor of
survival and a novel therapeutic target in bladder urothelial cell
carcinoma. Med Oncol. 30:4062013. View Article : Google Scholar : PubMed/NCBI
|
|
9
|
Tabata K, Matsumoto K, Minami S, Ishii D,
Nishi M, Fujita T, Saegusa M, Sato Y and Iwamura M: Nestin is an
independent predictor of cancer-specific survival after radical
cystectomy in patients with urothelial carcinoma of the bladder.
PLoS One. 9:e915482014. View Article : Google Scholar : PubMed/NCBI
|
|
10
|
Yan Y, Yang FQ, Zhang HM, Li J, Li W, Wang
GC, Che JP, Zheng JH and Liu M: Bromodomain 4 protein is a
predictor of survival for urothelial carcinoma of bladder. Int J
Clin Exp Pathol. 7:4231–4238. 2014.PubMed/NCBI
|
|
11
|
Dyrskjøt L, Kruhøffer M, Thykjaer T,
Marcussen N, Jensen JL, Møller K and Ørntoft TF: Gene expression in
the urinary bladder: A common carcinoma in situ gene expression
signature exists disregarding histopathological classification.
Cancer Res. 64:4040–4048. 2004. View Article : Google Scholar : PubMed/NCBI
|
|
12
|
Biton A, Bernard-Pierrot I, Lou Y, Krucker
C, Chapeaublanc E, Rubio-Pérez C, López-Bigas N, Kamoun A,
Neuzillet Y, Gestraud P, et al: Independent component analysis
uncovers the landscape of the bladder tumor transcriptome and
reveals insights into luminal and basal subtypes. Cell Rep.
9:1235–1245. 2014. View Article : Google Scholar : PubMed/NCBI
|
|
13
|
Nayak RR, Kearns M, Spielman RS and Cheung
VG: Coexpression network based on natural variation in human gene
expression reveals gene interactions and functions. Genome Res.
19:1953–1962. 2009. View Article : Google Scholar : PubMed/NCBI
|
|
14
|
Voineagu I, Wang X, Johnston P, Lowe JK,
Tian Y, Horvath S, Mill J, Cantor RM, Blencowe BJ and Geschwind DH:
Transcriptomic analysis of autistic brain reveals convergent
molecular pathology. Nature. 474:380–384. 2011. View Article : Google Scholar : PubMed/NCBI
|
|
15
|
Kristensen VN, Lingjærde OC, Russnes HG,
Vollan HK, Frigessi A and Børresen-Dale AL: Principles and methods
of integrative genomic analyses in cancer. Nat Rev Cancer.
14:299–313. 2014. View
Article : Google Scholar : PubMed/NCBI
|
|
16
|
Ma L, Robinson LN and Towle HC: ChREBP*Mlx
is the principal mediator of glucose-induced gene expression in the
liver. J Biol Chem. 281:28721–28730. 2006. View Article : Google Scholar : PubMed/NCBI
|
|
17
|
Rifai N and Ridker PM: Proposed
cardiovascular risk assessment algorithm using high-sensitivity
C-reactive protein and lipid screening. Clin Chem. 47:28–30.
2001.PubMed/NCBI
|
|
18
|
Pepper SD, Saunders EK, Edwards LE, Wilson
CL and Miller CJ: The utility of MAS5 expression summary and
detection call algorithms. BMC Bioinformatics. 8:2732007.
View Article : Google Scholar : PubMed/NCBI
|
|
19
|
Sims AH, Smethurst GJ, Hey Y, Okoniewski
MJ, Pepper SD, Howell A, Miller CJ and Clarke RB: The removal of
multiplicative, systematic bias allows integration of breast cancer
gene expression datasets - improving meta-analysis and prediction
of prognosis. BMC Med Genomics. 1:422008. View Article : Google Scholar : PubMed/NCBI
|
|
20
|
Taminau J, Taminau MJ, Meganck S and
BiocGenerics S: Package ‘inSilicoMerging’. 2013.https://bioc.ism.ac.jp/packages/3.1/bioc/html/inSilicoMerging.htmlFeb
06–2015
|
|
21
|
Smyth G, Thorne N and Wettenhall J: LIMMA:
Linear Models for Microarray Data User's Guide. 2003.http://www.
bioconductor.org2005Feb 08–2015
|
|
22
|
Datta S, Satten GA, Benos DJ, Xia J,
Heslin MJ and Datta S: An empirical bayes adjustment to increase
the sensitivity of detecting differentially expressed genes in
microarray experiments. Bioinformatics. 20:235–242. 2004.
View Article : Google Scholar : PubMed/NCBI
|
|
23
|
Reiner A, Yekutieli D and Benjamini Y:
Identifying differentially expressed genes using false discovery
rate controlling procedures. Bioinformatics. 19:368–375. 2003.
View Article : Google Scholar : PubMed/NCBI
|
|
24
|
Yang J, Yu H, Liu BH, Zhao Z, Liu L, Ma
LX, Li YX and Li YY: DCGL v2. 0: An R package for unveiling
differential regulation from differential co-expression. PLoS One.
8:e797292013. View Article : Google Scholar : PubMed/NCBI
|
|
25
|
Yu H, Liu BH, Ye ZQ, Li C, Li YX and Li
YY: Link-based quantitative methods to identify differentially
coexpressed genes and gene pairs. BMC Bioinformatics. 12:3152011.
View Article : Google Scholar : PubMed/NCBI
|
|
26
|
Liu BH, Yu H, Tu K, Li C, Li YX and Li YY:
DCGL: An R package for identifying differentially coexpressed genes
and links from gene expression microarray data. Bioinformatics.
26:2637–2638. 2010. View Article : Google Scholar : PubMed/NCBI
|
|
27
|
Scardoni G and Laudanna C: Centralities
based analysis of complex networksNew Frontiers in Graph Theory.
ISBN, 978-953-51-0115-4. INTECH Open Access Publisher; 2012,
http://www.intechopen.com/books/new-frontiers-in-graph-theory/centralities-based-analysis-of-networks
View Article : Google Scholar
|
|
28
|
Zotenko E, Mestre J, O'Leary DP and
Przytycka TM: Why do hubs in the yeast protein interaction network
tend to be essential: Reexamining the connection between the
network topology and essentiality. PLoS Comput Biol.
4:e10001402008. View Article : Google Scholar : PubMed/NCBI
|
|
29
|
Koschützki D and Schreiber F: Centrality
analysis methods for biological networks and their application to
gene regulatory networks. Gene Regul Syst Bio. 2:193–201.
2008.PubMed/NCBI
|
|
30
|
Huang DW, Sherman BT, Tan Q, Collins JR,
Alvord WG, Roayaei J, Stephens R, Baseler MW, Lane HC and Lempicki
RA: The DAVID gene functional classification tool: A novel
biological module-centric algorithm to functionally analyze large
gene lists. Genome Biol. 8:R1832007. View Article : Google Scholar : PubMed/NCBI
|
|
31
|
Hosack DA, Dennis G Jr, Sherman BT, Lane
HC and Lempicki RA: Identifying biological themes within lists of
genes with EASE. Genome Biol. 4:R702003. View Article : Google Scholar : PubMed/NCBI
|
|
32
|
Yoon H and Liu RH: Effect of 2
alpha-hydroxyursolic acid on NF-kappaB activation induced by
TNF-alpha in human breast cancer MCF-7 cells. J Agric Food Chem.
56:8412–8417. 2008. View Article : Google Scholar : PubMed/NCBI
|
|
33
|
Witjes JA, Compérat E, Cowan NC, De Santis
M, Gakis G, Lebret T, Ribal MJ, Van der Heijden AG and Sherif A:
European Association of Urology: EAU guidelines on muscle-invasive
and metastatic bladder cancer: Summary of the 2013 guidelines. Eur
Urol. 65:778–792. 2014. View Article : Google Scholar : PubMed/NCBI
|
|
34
|
Tripodi D, Quéméner S, Renaudin K, Ferron
C, Malard O, Guisle-Marsollier I, Sébille-Rivain V, Verger C,
Géraut C and Gratas-Rabbia-Ré C: Gene expression profiling in
sinonasal adenocarcinoma. BMC Med Genomics. 2:652009. View Article : Google Scholar : PubMed/NCBI
|
|
35
|
Selamat SA, Chung BS, Girard L, Zhang W,
Zhang Y, Campan M, Siegmund KD, Koss MN, Hagen JA, Lam WL, et al:
Genome-scale analysis of DNA methylation in lung adenocarcinoma and
integration with mRNA expression. Genome Res. 22:1197–1211. 2012.
View Article : Google Scholar : PubMed/NCBI
|
|
36
|
Miwa HE, Koba WR, Fine EJ, Giricz O, Kenny
PA and Stanley P: Bisected, complex N-glycans and galectins in
mouse mammary tumor progression and human breast cancer.
Glycobiology. 23:1477–1490. 2013. View Article : Google Scholar : PubMed/NCBI
|
|
37
|
Lu Y, Liu P, Wen W, Grubbs CJ, Townsend
RR, Malone JP, Lubet RA and You M: Cross-species comparison of
orthologous gene expression in human bladder cancer and
carcinogen-induced rodent models. Am J Transl Res. 3:8–27.
2010.PubMed/NCBI
|
|
38
|
Hatakeyama S: TRIM proteins and cancer.
Nat Rev Cancer. 11:792–804. 2011. View Article : Google Scholar : PubMed/NCBI
|
|
39
|
Dokmanovic M, Chang BD, Fang J and
Roninson IB: Retinoid-induced growth arrest of breast carcinoma
cells involves co-activation of multiple growth-inhibitory genes.
Cancer Biol Ther. 1:24–27. 2002. View Article : Google Scholar : PubMed/NCBI
|
|
40
|
Sugiura T and Miyamoto K: Characterization
of TRIM31, upregulated in gastric adenocarcinoma, as a novel RBCC
protein. J Cell Biochem. 105:1081–1091. 2008. View Article : Google Scholar : PubMed/NCBI
|
|
41
|
Li H, Zhang Y, Zhang Y, Bai X, Peng Y and
He P: TRIM31 is downregulated in non-small cell lung cancer and
serves as a potential tumor suppressor. Tumour Biol. 35:5747–5752.
2014. View Article : Google Scholar : PubMed/NCBI
|
|
42
|
Nurse P: A long twentieth century of the
cell cycle and beyond. Cell. 100:71–78. 2000. View Article : Google Scholar : PubMed/NCBI
|
|
43
|
Peng ZG, Yao YB, Yang J, Tang YL and Huang
X: Mangiferin induces cell cycle arrest at G2/M phase through
ATR-Chk1 pathway in HL-60 leukemia cells. Genet Mol Res.
14:4989–5002. 2015. View Article : Google Scholar : PubMed/NCBI
|
|
44
|
Andries V, Vandepoele K, Staes K, Berx G,
Bogaert P, van Isterdael G, Ginneberge D, Parthoens E,
Vandenbussche J, Gevaert K and van Roy F: NBPF1, a tumor suppressor
candidate in neuroblastoma, exerts growth inhibitory effects by
inducing a G1 cell cycle arrest. BMC Cancer. 15:3912015. View Article : Google Scholar : PubMed/NCBI
|
|
45
|
Li N, Sun M, Wang Y, Lv Y, Hu Z, Cao W,
Zheng J and Jiao X: Effect of cell cycle phase on the sensitivity
of SAS cells to sonodynamic therapy using low-intensity ultrasound
combined with 5-aminolevulinic acid in vitro. Mol Med Rep.
12:3177–3183. 2015.PubMed/NCBI
|
|
46
|
de Stanchina E, McCurrach ME, Zindy F,
Shieh SY, Ferbeyre G, Samuelson AV, Prives C, Roussel MF, Sherr CJ
and Lowe SW: E1A signaling to p53 involves the p19ARFtumor
suppressor. Genes Dev. 12:2434–2442. 1998. View Article : Google Scholar : PubMed/NCBI
|
|
47
|
Chakraborty A, Uechi T and Kenmochi N:
Guarding the ‘translation apparatus’: Defective ribosome biogenesis
and the p53 signaling pathway. Wiley Interdiscip Rev RNA.
2:507–522. 2011. View Article : Google Scholar : PubMed/NCBI
|
|
48
|
Stegh AH: Targeting the p53 signaling
pathway in cancer therapy - the promises, challenges and perils.
Expert Opin Ther Targets. 16:67–83. 2012. View Article : Google Scholar : PubMed/NCBI
|