Introduction
Digital pathology by whole slide imaging (WSI) has
been utilized for education, diagnosis and research purposes
(1). Recently, it was reported that
the concordance rate of diagnosis by light microscopy and WSI was
92.4%; therefore, the quality of WSI has been improved for the
utilization of routine pathological diagnosis (2). In addition, image analysis (IA) by
digital pathology has been used to perform quantification of liver
fibrosis (3), nuclear morphological
analysis of breast tumors (4) and
other purposes, whereas digital pathological analysis for
urothelial carcinoma has not been used in many previous studies. A
previous study used pattern recognition algorithms for the
diagnosis of urothelial carcinoma (5).
Nuclear findings are an important parameter in order
to classify and diagnose urothelial tumors. For example, in the
World Health Organization (WHO) Classification of Tumors of the
Urinary Systems and Male Genital Organs 4th edition published in
2016 (6), the most infiltrating
urothelial carcinoma (IUC) originated from noninvasive high-grade
urothelial carcinoma (NIHGUC) (6),
and the nuclear findings of IUC were described as ‘striking nuclear
pleomorphism with variably sized and shaped hyperchromatic nuclei’
(6). Nuclear features of NIHGUC
include size variation, irregular shape and apparent pleomorphic
nuclei (7). Therefore, the nuclear
findings between IUC and NIHGUC are similar. However, nuclear
features of low-grade papillary urothelial carcinoma (LGPUC)
include mild nuclear irregularity and evident pleomorphism
(7). Therefore, it was suggested that
LGPUC and IUC may be distinguished by nuclear irregularity and
nuclear pleomorphism. However, to the best of our knowledge, there
are no previous studies demonstrating that nuclear parameters may
be useful to distinguish IUC from LGPUC through using IA of WSI
samples. In addition, IA has been used to evaluate
immunohistochemistry (IHC) (8);
however, a number of studies still manually evaluate IHC (9,10).
Therefore, the present study aimed to utilize IA for
nuclear morphometric analysis and IHC evaluation of urothelial
carcinoma tissue samples obtained by transurethral resection of
bladder tumors (TUR-Bt).
Materials and methods
Samples and ethical review
The tissue samples used in the present study had
undergone a routine diagnostic process prior to submission of the
present study's protocol to the Ethical Review Board of the
University of the Ryukyus (Nakagami, Japan). All samples were
initially obtained for pathological diagnosis. In the process of
explaining to patients the use of sampling for pathological
diagnosis, secondary usage for research was simultaneously
explained by a clinician and written informed consent for secondary
usage was obtained from the patients. Subsequently, the present
study was initiated following approval from the Ethical Review
Board. A total of 49 cases of urothelial carcinoma were obtained by
TUR-Bt at the University of the Ryukyus Hospital between January
2011 and July 2015. For the present study, all tissue samples were
reviewed by two pathologists (both from the Department of Pathology
and Oncology, Graduate School of Medicine, University of the
Ryukyus, Nishihara, Japan) independently, and depth of invasion and
histological grade were evaluated, and classified based on the
criteria of WHO classification and tumor-node-metastasis
classification according to the Union for International Cancer
Control 7th edition (11). Following
individual evaluations, a consensus decision was made, and the
consensus data was utilized in the present study. The data is
summarized in Table I.
 | Table I.Clinicopathological parameters of the
49 patients with urothelial carcinoma. |
Table I.
Clinicopathological parameters of the
49 patients with urothelial carcinoma.
| Parameter | No. of cases (%) |
|---|
| All cases | 49 (100) |
| Age, years |
|
|
<60 | 12 (24) |
| ≥60 | 37 (76) |
| Sex |
|
| Male | 40 (82) |
|
Female | 9 (18) |
| pT status |
|
| pTa | 12 (24) |
| pT1 | 16 (33) |
| pT2 | 21 (43) |
| Histological
grade |
|
|
Infiltrating | 37 (76) |
| High | 1 (2) |
| Low | 11 (22) |
Hematoxylin and eosin (H&E),
Feulgen reaction and IHC staining
Buffered formalin-fixed paraffin embedded tissue
samples (10%) were cut into 3 µm serial sections for H&E
staining, nuclear staining by Feulgen reaction and IHC staining.
H&E staining was performed using a routine protocol. In brief,
deparaffinization and rehydration steps were performed using xylene
for 3 min twice, 100, 90 and 70% ethanol for 1 min each. Following
rinsing in running water once and de-ionized water (DW) thrice,
tissue samples were stained with hematoxylin solution for 15 min at
room temperature (R/T), followed by washing with running water for
10 min and rinsing with distilled water thrice. After soaking in
80% ethanol for 3 min, the samples were stained with eosin solution
for 3 min. at R/T. Subsequently, the dehydration step (100% ethanol
for 1 min 5 times) and penetration step (xylene for 4 min 4 times)
were performed, and the samples were mounted for observation and
analysis. For Feulgen reaction staining, deparaffinized tissue
samples were pretreated with DW for 5 min at 60°C. Subsequently,
the tissue samples were treated with 1 N HCl for 60 min at 60°C.
The tissue samples were washed once with Schiff's reagent (Muto
Pure Chemicals, Bunkyo-ward, Tokyo, Japan) and treated for 15 min
at R/T with Schiff's reagent. Subsequently, the tissue samples were
treated three times with sulfuric acid solution (Muto Pure
Chemicals) for 2 min at R/T. Following washing with running water
for 5 min, dehydration and penetration steps were performed, and
the samples were mounted for observation and analysis. For IHC
staining, deparaffinization, rehydration and antigen retrieval
steps were simultaneously performed using target retrieval solution
(pH 9.0) with PT Link equipment (Agilent Technologies, Inc., Santa
Clara, CA, USA) at 97°C for 20 min. Subsequently, the tissue
samples were placed on a DAKO Autostainer Link 48 (Agilent
Technologies, Inc.) for staining. An EnVision™ FLEX High pH kit
(K8000; Agilent Technologies, Inc.), containing 20X concentrated
washing buffer, blocking reagent to block internal peroxidase
activity, horseradish peroxidase labeled polymer conjugated
secondary antibody, 3,3′-diaminobenzidine (DAB), buffer for DAB and
hematoxylin solution, was used. In the autostainer, the following
steps were performed: Following rinsing with 1x washing buffer, the
samples were incubated with blocking reagent for 5 min at R/T.
After washing with washing buffer, the slides were incubated with
purified primary monoclonal antibodies against either Ki-67 (1:100
dilution; clone MIB-1; M7240), p53 (1:100 dilution; clone DO-7;
M7001) (both from Agilent Technologies, Inc.) or GATA-binding
protein 3 (GATA-3; 1:250 dilution; clone L50-823; ACR405A; Biocare
Medical, LLC, Paheco, CA, USA) for 20 min at R/T. Following rinsing
with washing buffer, the slides were washed with washing buffer for
5 min at R/T, visualization was performed following incubation with
DAB diluted in buffer for DAB for 10 min at R/T. After rinsing with
washing buffer, counterstaining was performed with hematoxylin
solution for 5 min at R/T followed by a DW rinse, washing buffer
for 5 min and a DW rinse. After this step, the slides were taken
from the autostainer and then the dehydration step (100% ethanol
for 1 min 5 times) and penetration step (xylene for 4 min 4 times)
were performed, and the samples were mounted for observation for
analysis.
WSI
WSI of all tissue samples was performed using a TOCO
240 Virtual slide scanner (Claro, Hirosaki, Aomori, Japan). For
H&E and Feulgen reaction stained tissue samples, a 40X
objective lens was used and a 20X objective lens was used for the
IHC tissue samples. The TOCO 240 specifications were as follows:
Camera pixels, 1,360×1,240; size of the pixel, 0.25 µm/pixel;
focus, autofocus; and source of lamination, super luminosity light
emitting diode.
Image analysis
For Feulgen reaction images, representative ×40
magnification digital images from three independent specimens were
captured and saved as TIFF images, ≥100 nuclei/sample were
analyzed. Feulgen reaction stained nuclear areas were analyzed
using Image-Pro Plus software (version 7.0.1.658; Japan Rover,
Tokyo, Japan) The following parameters were obtained and used for
statistical analysis: Average and standard deviation (SD) of size,
density, maximum density, maximum diameter and minimum diameter of
each separated Fuelgen reaction positive area. Subsequently, the
mean and SD of these parameters were used for statistical analysis.
DAB- and hematoxylin-stained nuclei from each tumor area were
respectively counted using Analista software (version 1.0.7.4;
Claro), and the positive ratio was determined.
Statistical analyses
For statistical analysis, JMP version 9.0.2 (SAS
Institute Japan, Tokyo, Japan) was used. For comparison of two
groups, if two groups were homoscedastic, Student's t-test (two
sample t-test) was performed, if not, two sample t-test with
Welch's correction was performed. For comparison of 3 groups,
Kruskal-Wallis test was performed. The evaluated statistics were
compared using χ2 distribution with the software and the
probability was determined. For non-parametric multiple comparison,
Steel-Dwass analysis was performed. In all analyses, P<0.05 was
considered to indicate a statistically significant difference. The
estimation of the area under the curve (AUC) value of a receiver
operating characteristic (ROC) curve was performed as follows: An
area >0.9 was considered to have high accuracy, whereas >0.7
and ≤0.9 indicated moderate accuracy, ≥0.5 and ≤0.7 for low
accuracy and <0.5 was a chance result (12). To determine the cutoff value of the
ROC curve, the Youden index was used (13). In brief, the ROC table that was
composed of each value with it's probability, including
1-specificity, sensitivity, sensitivity-(1-specificity), true
positive, true negative, false positive and false negative,
calculated by JMP version 9.0.2 software. The ROC curve was created
by plotting each 1-specificity and sensitivity of the ROC table.
The cutoff value was determined from the point on the ROC curve,
which had greatest value of [sensitivity-(1-specificity)]. In order
to determine the with the greatest value, the point on the ROC
curve, which gave the longest perpendicular line from the diagonal
line drawn from original point, was determined. The cutoff value
was the value in the ROC table with this point.
Results
IUC and LGPUC are distinguished by
nuclear parameters analyzed using IA
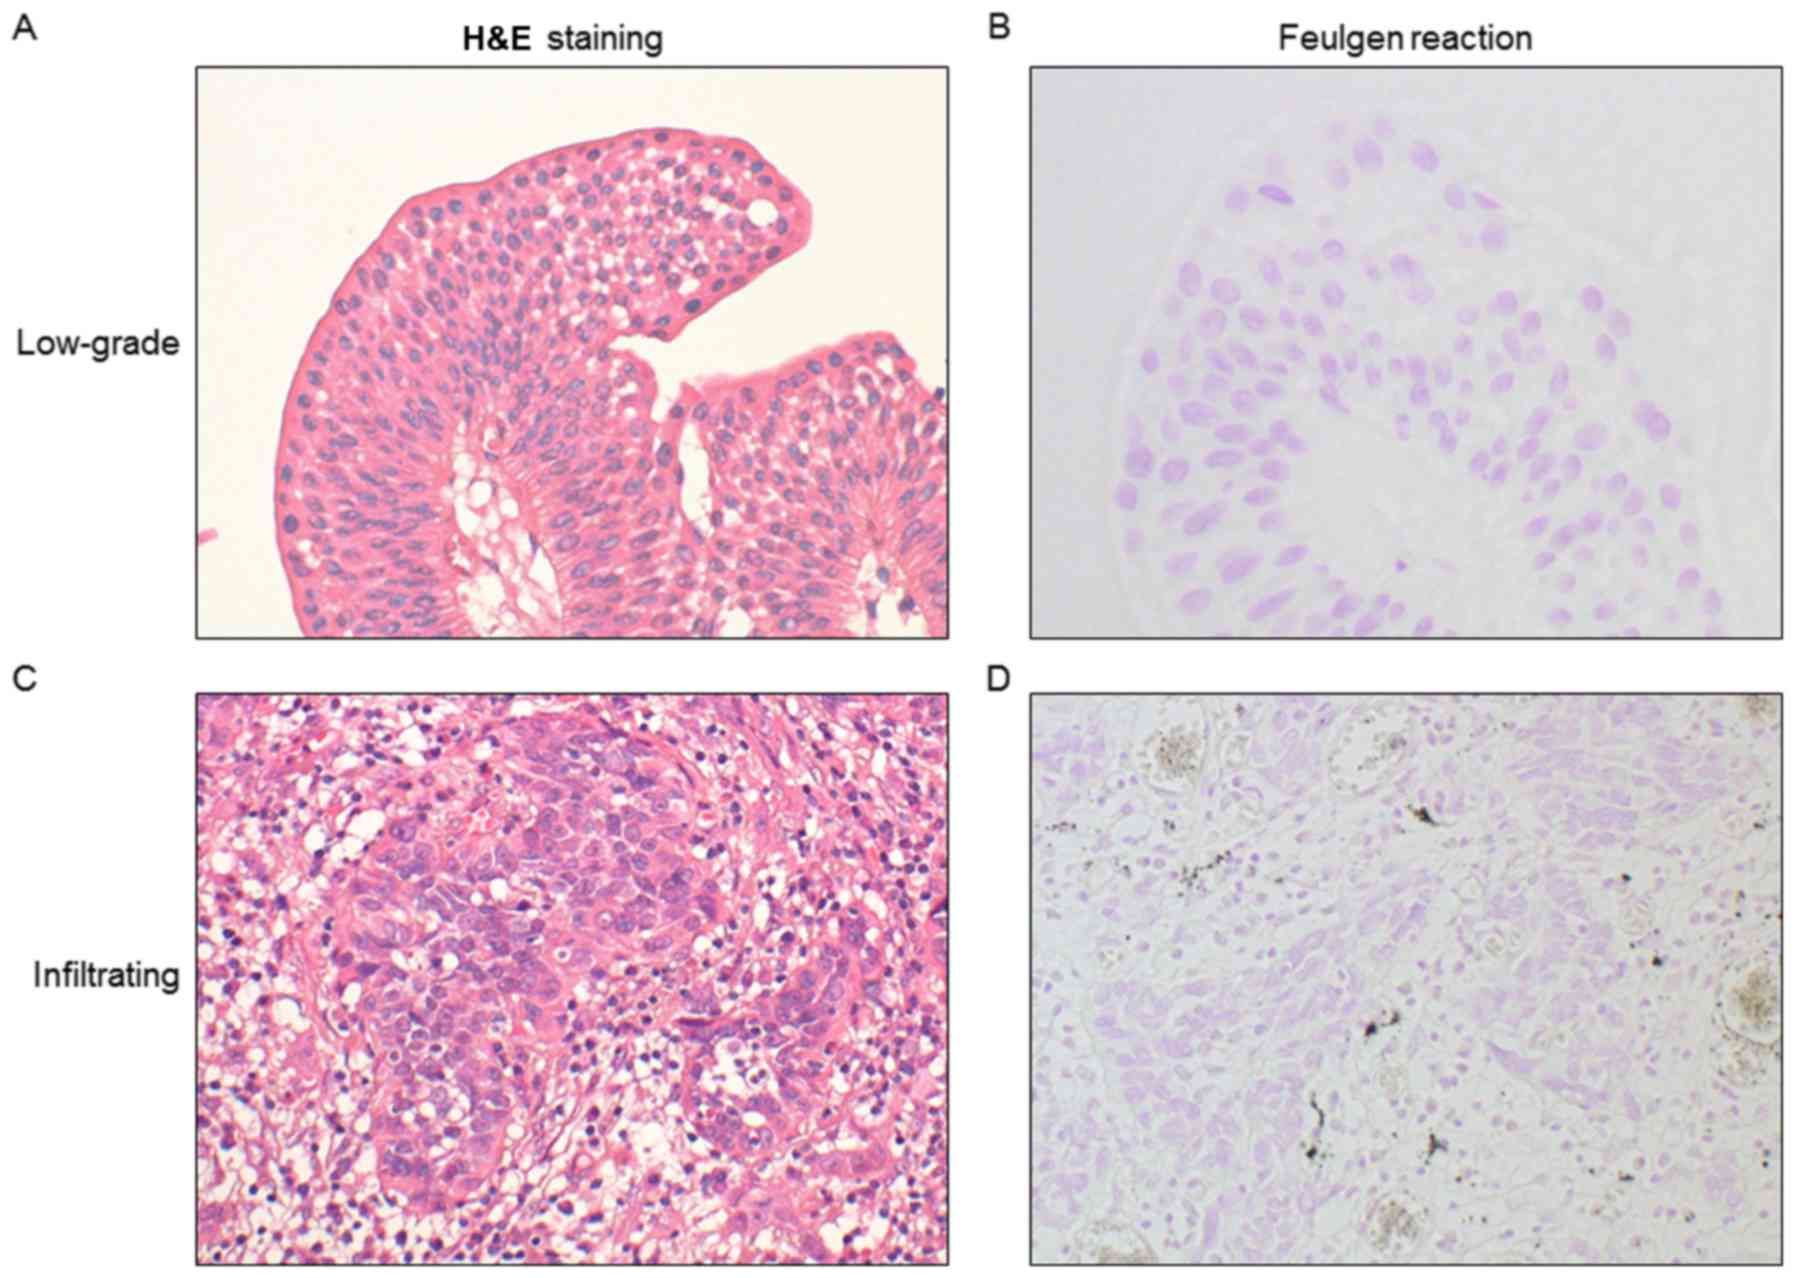
Since there was only one case (case no. 11) of
high-grade non-infiltrative papillary urothelial carcinoma, the
present study excluded this case from further analysis. Clear DNA
ploidy pattern is obtained by Feulgen reaction in comparison to
H&E or Papanicolaou staining (14), thus the present study utilized Feulgen
reaction for IA. First, the present study analyzed the nuclear area
from tissue samples stained with Feulgen reagent. Representative
staining of LGPUC and IUC tissue samples using H&E, and Feulgen
reagent are presented in Fig. 1.
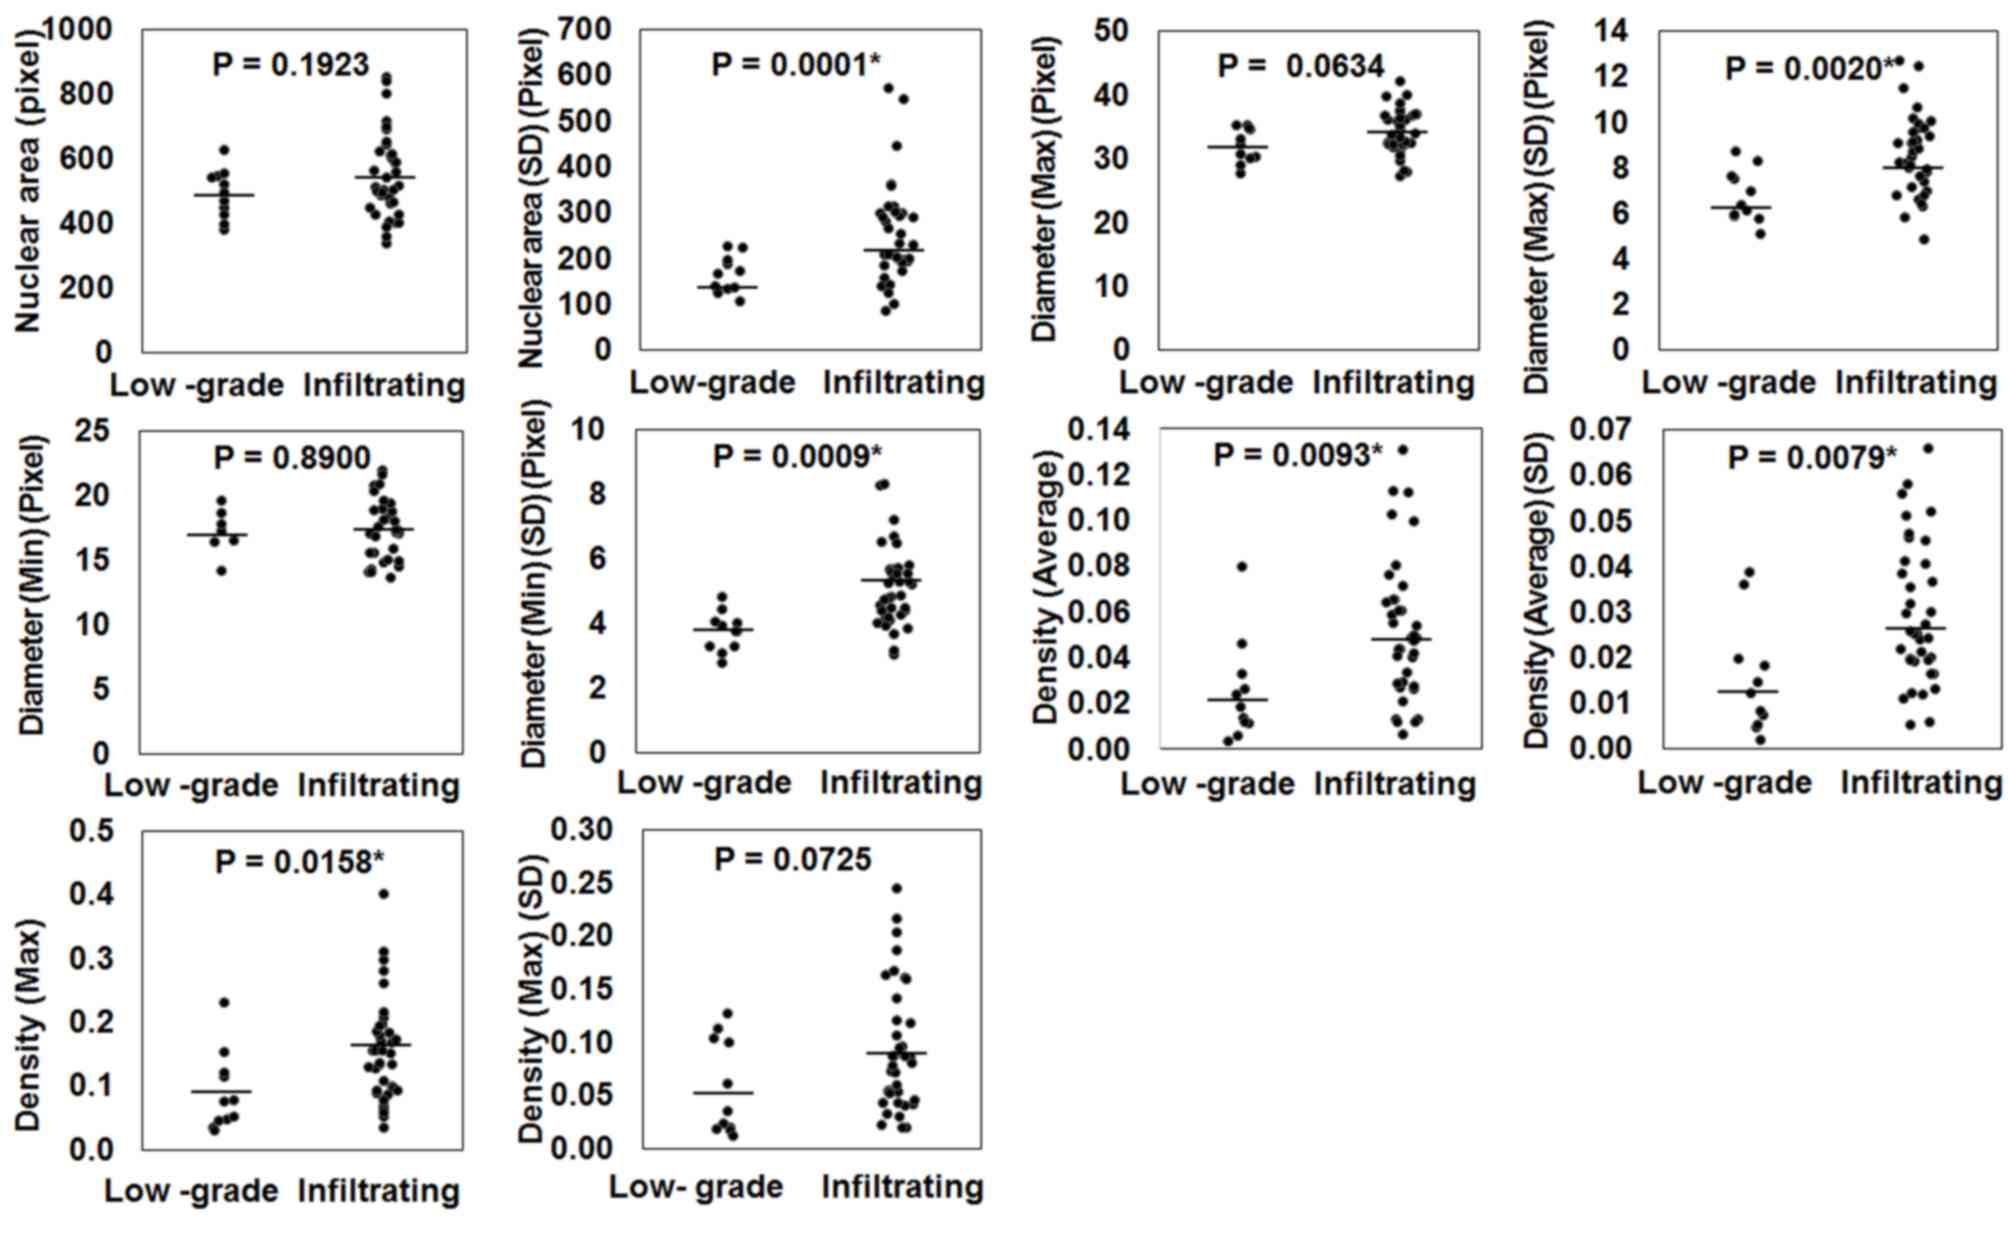
Following IA of Feulgen reaction specimens, the nuclear average
density (average density of all pixels in a nucleus), nuclear
maximum density (maximum density of pixels in a nucleus), SD of
nuclear area, SD of nuclear maximum diameter, SD of nuclear minimum
diameter, and SD of nuclear average density revealed statistically
significant differences between IUC and LGPUC (P=0.0093, P=0.0158,
P=0.0001, P=0.0020, P=0.0009 and P=0.0079, respectively; Fig. 2). However, the average nuclear area,
average nuclear maximum diameter, average nuclear minimum diameter
and SD of nuclear maximum density demonstrated no difference
(Fig. 2). These data suggest that the
average and the SD of each factor may be utilized to evaluate the
nuclear characteristics of tumors.
Ki-67 expression is associated with
carcinoma infiltration and GATA-3 downregulation was associated
with muscular invasion
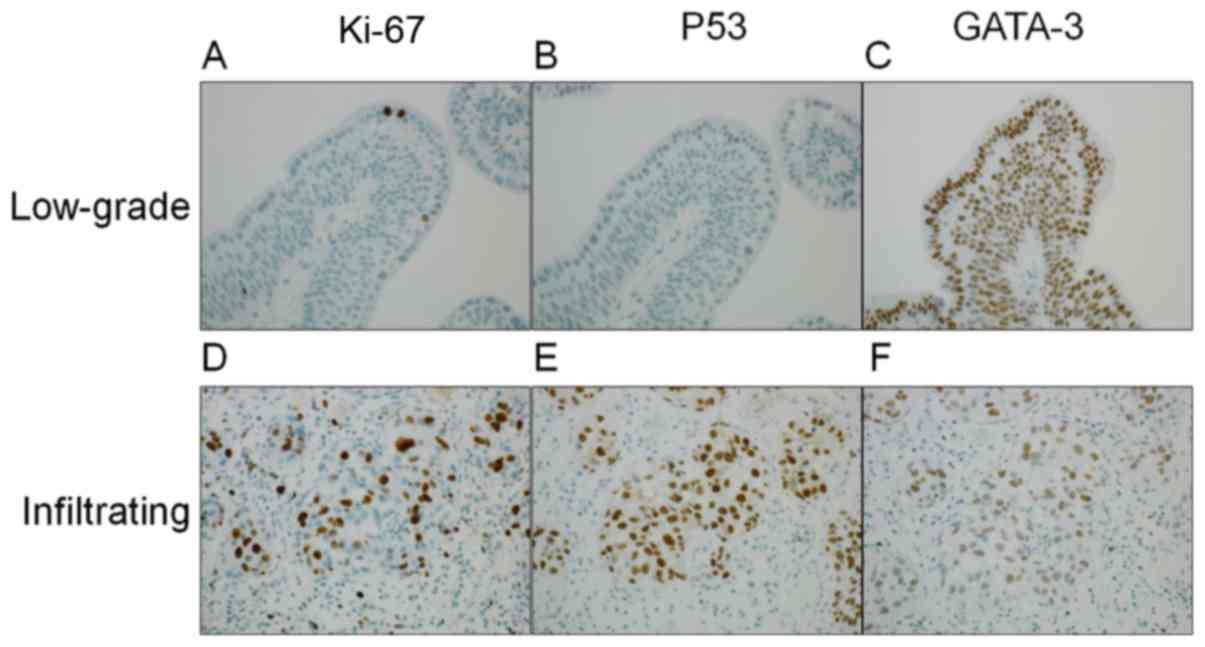
In the pathogenesis of urothelial carcinoma, p53
serves an important role for the development of IUC (15), whereas Ki-67 is associated with tumor
grade and stage (16) and GATA-3 is
downregulated during muscular invasion (17). The present study determined the
expression levels of p53, Ki-67 and GATA-3 by IHC and analyzed the
expression levels of each protein by IA. Representative staining
patterns are presented in Fig. 3, and
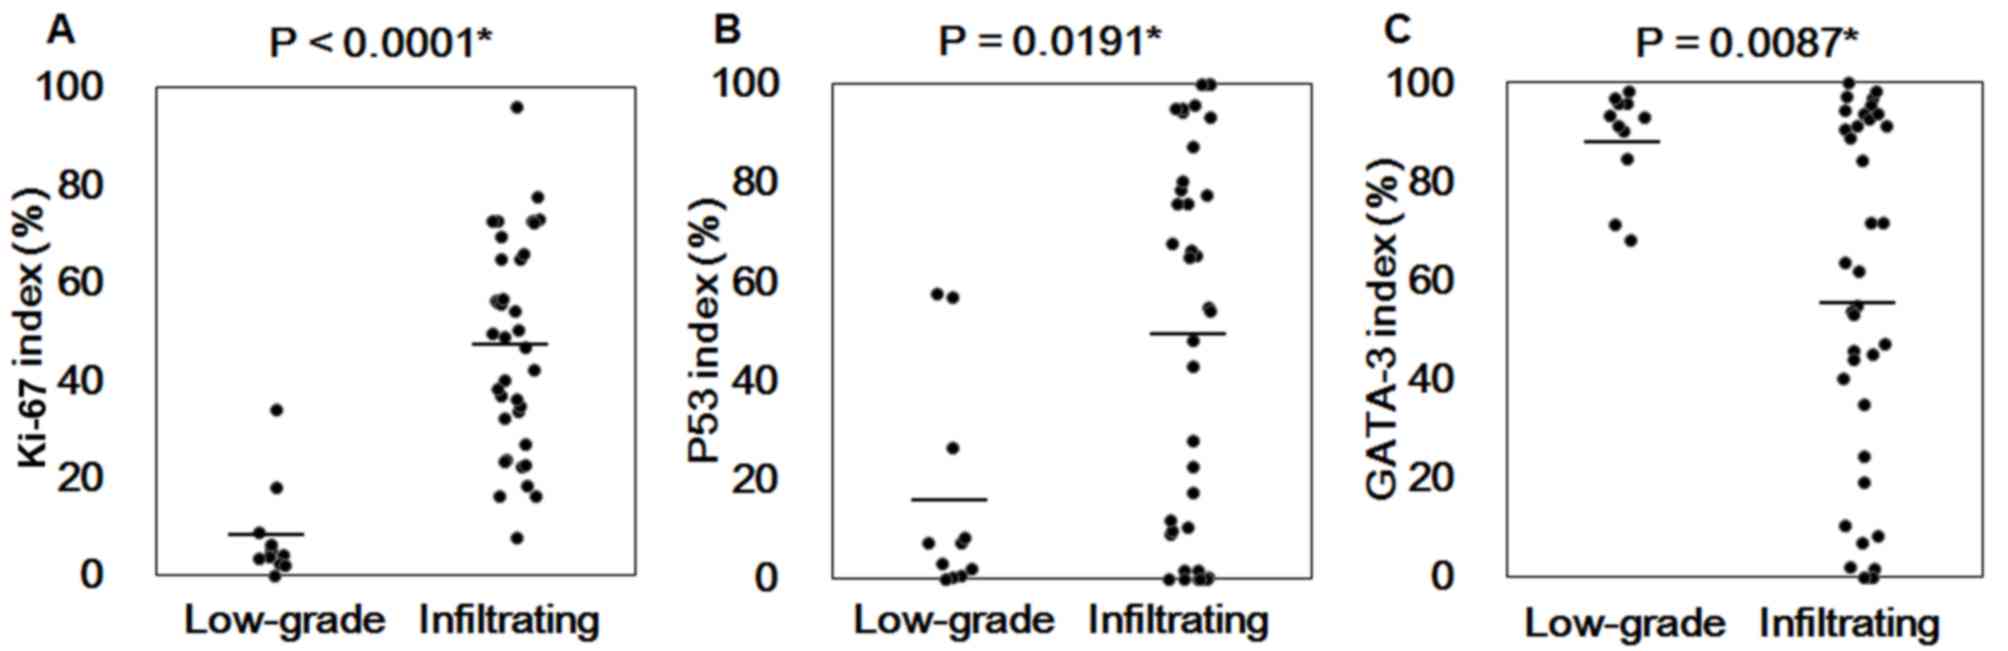
the positive ratio of Ki-67, p53 and GATA-3 stained cells in LGPUC
and IUC were compared. As presented in Fig. 4, Ki-67, p53 and GATA-3 analysis of
LGPUC and IUC tissues revealed significant differences between
LGPUC and IUC tissue samples stained with Ki-67 (P<0.0001), p53
(P=0.0191) and GATA-3 (P=0.0087). Comparison of positive ratio of
each protein among groups classified based on pathological T (pT)
factor (pTa: papillary tumor without invasion; pT1: invasion up to
submucosa; pT2: invasion to muscular layer) is summarized in
Tables II and III. The expression levels of each protein
were significantly different between 3 groups, as revealed by
Kruskal Wallis test (p53 P=0.0394; Ki-67 P=0.0004 and GATA-3
P<0.0001, respectively; Table
II). Therefore, additional statistical analysis was performed
by a Steel-Dwass analysis for multiple comparisons of each pT
factor. Ki-67 was significantly overexpressed in IUC cases, (pT1
and pT2 cases, P=0.0057 and P=0.0007, respectively); however, p53
was significantly overexpressed in pT1 compared with pTa cases
(P=0.0104), and pT2 cases demonstrated no significant differences
compared with pTa or pT1 (Table
III). Furthermore, GATA-3 expression level was significantly
downregulated in pT2 cases (P<0.0001 for pTa and P=0.0065 for
pT1). These results suggest that IUC may be distinguished from
LGPUC by utilizing Ki-67 and p53, and muscle invasion cases may be
identified from non-muscle invasion cases by GATA-3.
| Table II.Association between pT factor and
Ki-67, p53 or GATA-3 expression. |
Table II.
Association between pT factor and
Ki-67, p53 or GATA-3 expression.
| Index | pT | Number of cases | Rank sum | Expected value | Average of the
ranks | P-value |
|---|
| p53 | pTa | 15 | 284.5 | 375 | 18.97 | 0.0394a |
|
| pT1 | 13 | 425.0 | 325 | 32.69 |
|
|
| pT2 | 21 | 515.5 | 525 | 24.55 |
|
| Ki-67 | pTa | 15 | 193.0 | 375 | 12.87 | 0.0004a |
|
| pT1 | 13 | 376.0 | 325 | 28.92 |
|
|
| pT2 | 21 | 656.0 | 525 | 31.24 |
|
| GATA-3 | pTa | 15 | 536.5 | 375 | 35.77 |
<0.0001a |
|
| pT1 | 13 | 380.5 | 325 | 29.27 |
|
|
| pT2 | 21 | 308.0 | 525 | 14.67 |
|
| Table III.Non-parametric multiple comparison
for Ki-67, p53 and GATA-3. |
Table III.
Non-parametric multiple comparison
for Ki-67, p53 and GATA-3.
| Index | Compared
groups | P-value |
|---|
| p53 | pTa | pT2 | 0.6713 |
|
| pT2 | pT1 | 0.4084 |
|
| pTa | pT1 | 0.0104a |
| Ki-67 | pT2 | pT1 | 0.8376 |
|
| pTa | pT1 | 0.0057a |
|
| pTa | pT2 | 0.0007a |
| GATA-3 | pTa | pT2 |
<0.0001a |
|
| pTa | pT1 | 0.3382 |
|
| pT2 | pT1 | 0.0065a |
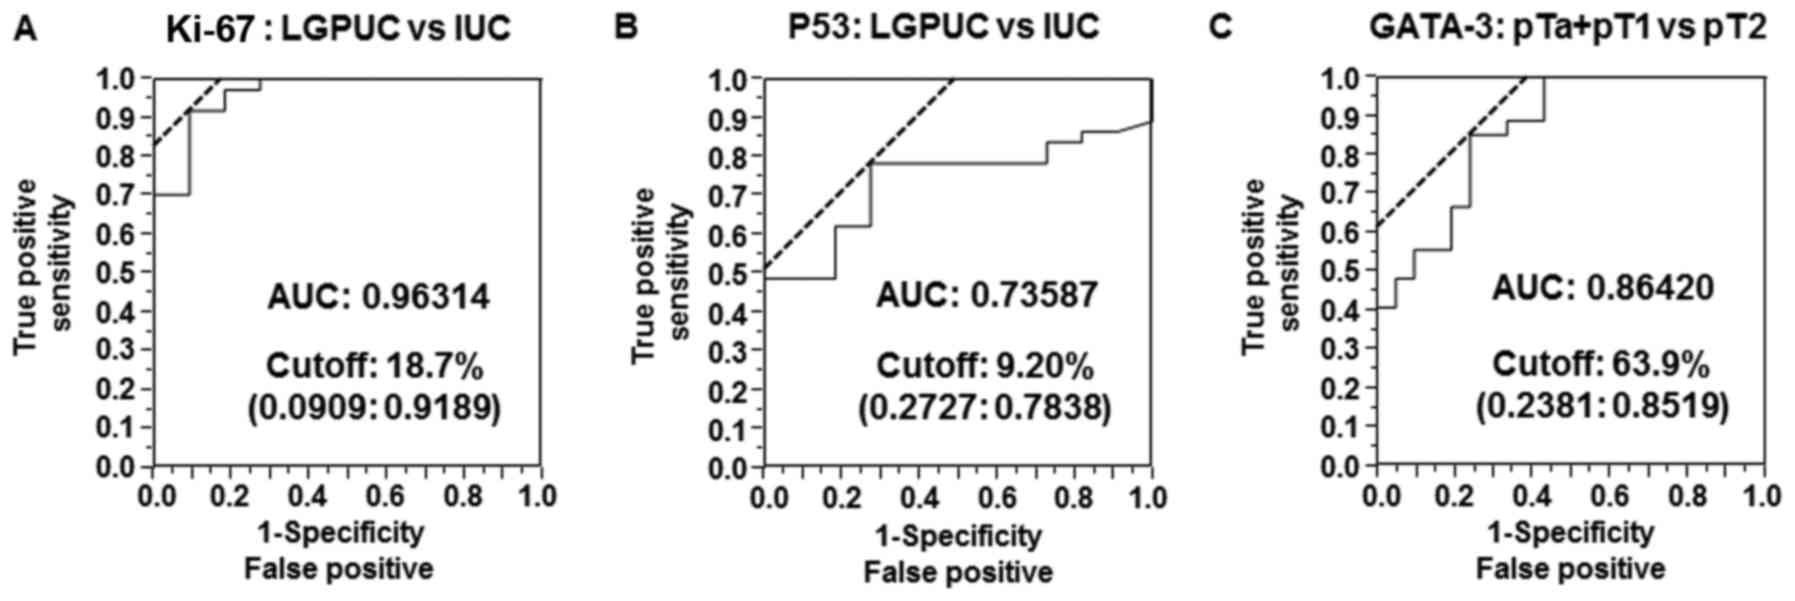
IUC and muscle invasion cases are
predicted by cutoff values of Ki-67, p53 and GATA-3 positive ratios
determined by image analysis
The present study aimed to determine the cutoff
values of Ki-67, p53 and GATA-3 positive ratios in order to
distinguish IUC from LGPUC using Ki-67 and p53 or muscular invasion
cases (pT2) from non-muscle invasion cases (pTa plus pT1), using
GATA-3 and utilizing ROC curves and Youden index analyses. As
presented in Fig. 5, the AUC for the
Ki-67 index (LGPUC vs. IUC) was 0.96314 and the cutoff value was
18.7%. The AUC for the p53 index (LGPUC vs. IUC) was 0.73587 and
the cutoff value was 9.2%. The AUC for the GATA-3 index (pT2 vs.
pTa + pT1) was 0.86420 and the cutoff value was 63.9%. Therefore,
these results suggest that the combination of p53, Ki-67 and GATA-3
expression levels may be used to distinguish LGPUC cases from IUC
cases and muscle invasion cases from non-muscle invasion cases.
Discussion
Previous studies using computer-aided
cytopathological or histological IA emerged in the early 1980 s
(18–21). At that time, the number of image
elements were small [880×680 pixels (21) or 512×625 pixels (20)] and the software was too simple to
clearly analyze nuclear morphology, or morphological structure in
comparison to the software currently available (22). However, the advancement of technology
has enabled us to analyze digital images captured by WSI, in which
the analyses provide novel information for morphological diagnosis.
For example, Caie et al (23)
revealed that a poorly differentiated area detected by digital IA
was associated with patient prognosis in colorectal cancer.
Additionally, Ali et al (24)
demonstrated that the median lymphocyte density of digital images
from breast cancer biopsy specimen analyzed using IA software was
associated with a pathological complete response to chemotherapy.
The present study utilized WSI and IA to clarify nuclear features
from urothelial carcinoma tissue samples as nuclear morphological
analysis of urothelial carcinoma had not been previously performed
in detail. However, certain studies have performed cell size
analysis through digital imaging in bladder tissue samples
(25), morphometric detection of
urothelial cancer cell nests using an algorithm (5) and quantitative assessment of bladder
carcinoma using an acid labile DNA assay (26). The results of the present study
revealed that the SD of nuclear maximum and minimum diameter, SD of
nuclear area (size), SD of nuclear average density, SD of nuclear
maximum density, nuclear average density and nuclear maximum
density were significantly higher in IUC compared with in LGPUC
samples. However, the average nuclear area, average nuclear maximum
diameter and average nuclear minimum diameter revealed no
significant differences in IUC compared with LGPUC. SD is a measure
of statistical variability of samples; therefore, SD was rephrased
as nuclear variability in the present study. The nuclear findings
of IUC have been previously described as ‘striking nuclear
pleomorphism with variably sized and shaped hyperchromatic nuclei’
(6). The present study confirmed that
nuclear pleomorphism with variable size and shape by SD of nuclear
size, SD of maximum nuclear diameter and SD of minimum nuclear
diameter. Furthermore, hyperchromatic nuclei were identified by an
average of nuclear density. In addition, the results of the present
suggest that SD of nuclear density represents the nuclear
variability of chromatin in each nucleus. Therefore, the term
‘hyperchromatic nuclei’ is not sufficient to express the status of
a nucleus in IUC. The IA results indicated that the nuclei in IUC
cases were globally hyperchromatic and variably hyperchromatic.
Krabbe et al (27) revealed that overexpression of Ki-67
using a 20% cutoff value was useful to predict recurrence-free
survival and cancer-specific survival of patients with high-grade
upper tract urothelial carcinoma. In the present study, the cutoff
value determined by the Youden index of the ROC curve for Ki-67 was
18.7, with a highly accurate AUC value (0.96314). The cutoff value
determined by positive ratio detection using a combination of IA
software and WSI was similar to the cutoff value used by Krabbe
et al (27). Thus, the cutoff
value used in the present study was reasonable, and IA in
combination with WSI is a useful tool to evaluate IHC staining.
Biomarkers, including p53, have previously been
intensively utilized for the investigation of urothelial carcinoma
(28–30). By utilizing p53 IHC, Kalantari and
Ahmadnia (31) reported positive
rates of p53 in 75% of LGPUC samples and 85% of IUC samples by
utilizing a 10% cutoff value. In the present study, the AUC for the
p53 index (LGPUC vs. IUC) was 0.73587 (moderate accuracy) and the
cutoff value was 9.2%. By using this p53 cutoff value, 29/37
(78.4%) IUC cases demonstrated overexpression of p53; thus, the
cutoff value determined by IA was reasonable. However, according to
a review article by Knowles and Hurst (15), the frequency of p53 overexpression is
30–50% in muscle invasion cases (15). Therefore, the estimation of p53
overexpression using a cutoff value is relatively variable.
Consequently, careful consideration should be taken when
interpreting p53 expression results following IHC.
GATA family transcription factors have previously
been investigated primarily in blood diseases (32). As a result, among the six GATA family
factors (GATA-1 to −6), GATA-1, −2 and −3 have been termed
‘hematopoietic GATA’, and GATA-4, −5 and −6 termed ‘endodermal
GATA’ (33). However, previous
studies revealed that hematopoietic GATA member, GATA-3, is
expressed in mammary glands (33,34) and
urothelium (35). As for GATA-3
expression in urothelial carcinoma, Miyamoto et al (17) reported that urothelial carcinoma with
muscular invasion demonstrated downregulation of GATA-3 expression
using a scoring system. The present study confirmed the
downregulation of GATA-3 expression in pT2 IUC cases by positive
rate calculated using IA software.
The present study determined the cutoff values of
Ki-67 and p53 indexes in LGPUC, and IUC samples, or GATA-3 index
between muscle invasion cases and non-muscle invasion cases. Our
results indicated that IA may be useful for evaluation of IHC in an
objective manner. Therefore, by utilizing WSI and IA software,
reproducibility was superior to that of a scoring system to
evaluate IHC results. Indeed, Papathomas et al (36) advocated that the current practices in
the scoring assessment of Ki-67 varied greatly and that
inter-observer variation set particular limitations to its clinical
utility, particularly around clinically relevant cutoff values. It
was concluded that novel digital microscopy-enabled methods may aid
in reducing variation, increasing reproducibility and improving
reliability in the clinical setting (36).
In conclusion, the present study revealed the
usefulness of WSI and IA to evaluate nuclear morphological features
and IHC results due to the objectivity of IA in comparison to
manual evaluation, including scoring.
Acknowledgements
The authors would like to thank Dr Reika Takamatsu
from the Department of Pathology and Oncology, Graduate School of
Medicine, University of the Ryukus (Nishihara, Japan) for her
expert technical assistance provided.
References
|
1
|
Pantanowitz L, Valenstein PN, Evans AJ,
Kaplan KJ, Pfeifer JD, Wilbur DC, Collins LC and Colgan TJ: Review
of the current state of whole slide imaging in pathology. J Pathol
Inform. 2:362011. View Article : Google Scholar : PubMed/NCBI
|
|
2
|
Goacher E, Randell R, Williams B and
Treanor D: The diagnostic concordance of whole slide imaging and
light microscopy: A systematic review. Arch Pathol Lab Med.
141:151–161. 2017. View Article : Google Scholar : PubMed/NCBI
|
|
3
|
Calvaruso V, Burroughs AK, Standish R,
Manousou P, Grillo F, Leandro G, Maimone S, Pleguezuelo M,
Xirouchakis I, Guerrini GP, et al: Computer-assisted image analysis
of liver collagen: Relationship to Ishak scoring and hepatic venous
pressure gradient. Hepatology. 49:1236–1244. 2009. View Article : Google Scholar : PubMed/NCBI
|
|
4
|
Yamada M, Saito A, Yamamoto Y, Cosatto E,
Kurata A, Nagao T, Tateishi A and Kuroda M: Quantitative nucleic
features are effective for discrimination of intraductal
proliferative lesions of the breast. J Pathol Inform. 7:12016.
View Article : Google Scholar : PubMed/NCBI
|
|
5
|
Hipp J, Smith SC, Cheng J, Tomlins SA,
Monaco J, Madabhushi A, Kunju LP and Balis UJ: Optimization of
complex cancer morphology detection using the SIVQ pattern
recognition algorithm. Anal Cell Pathol (Amst). 35:41–50. 2012.
View Article : Google Scholar : PubMed/NCBI
|
|
6
|
Grignon DJ, Al-Ahmadie H, Algaba F, et al:
Infiltrating urothelial carcinomaWHO Classification of Tumors of
the Urinary Systems and Male Genital Organs. Moch H, Humphrey PA,
Ulbright TM and Reuter VE: IARC; Lyon: pp. 81–98. 2016
|
|
7
|
Reuter VE, Algaba F, Amin MB, et al:
Non-invasive urothelial lesionsWHO Classification of Tumors of the
Urinary Systems and Male Genital Organs. Moch H, Humphrey PA,
Ulbright TM and Reuter VE: IARC; Lyon: pp. 99–107. 2016
|
|
8
|
Loghavi S, Al-Ibraheemi A, Zuo Z,
Garcia-Manero G, Yabe M, Wang SA, Kantarjian HM, Yin CC, Miranda
RN, Luthra R, et al: TP53 overexpression is an independent adverse
prognostic factor in de novo myelodysplastic syndromes with
fibrosis. Br J Haematol. 171:91–99. 2015. View Article : Google Scholar : PubMed/NCBI
|
|
9
|
Fang JC, Xia ZX, Wang CN and Li Z:
Clinicopathologic and immunophenotypic features of primary
intestinal extranodal NK/T-Cell Lymphoma, Nasal Type. Int J Surg
Pathol. 23:609–616. 2015. View Article : Google Scholar : PubMed/NCBI
|
|
10
|
Watanabe G, Ishida T, Furuta A, Takahashi
S, Watanabe M, Nakata H, Kato S, Ishioka C and Ohuchi N: Combined
immunohistochemistry of PLK1, p21, and p53 for predicting TP53
status: An independent prognostic factor of breast cancer. Am J
Surg Pathol. 39:1026–1034. 2015. View Article : Google Scholar : PubMed/NCBI
|
|
11
|
Sobin LH, Gospodarowicz MK and Wittekind
C: TNM Classification of Malignant Tumours. 7th. Wiley-Blackwell;
Hoboken, NJ: 2009
|
|
12
|
Akobeng AK: Understanding diagnostic tests
3: Receiver operating characteristic curves. Acta Paediatr.
96:644–647. 2007. View Article : Google Scholar : PubMed/NCBI
|
|
13
|
Perkins NJ and Schisterman EF: The
inconsistency of ‘optimal’ cutpoints obtained using two criteria
based on the receiver operating characteristic curve. Am J
Epidemiol. 163:670–675. 2006. View Article : Google Scholar : PubMed/NCBI
|
|
14
|
Biesterfeld S, Beckers S, Del Carmen Villa
Cadenas M and Schramm M: Feulgen staining remains the gold standard
for precise DNA image cytometry. Anticancer Res. 31:53–58.
2011.PubMed/NCBI
|
|
15
|
Knowles MA and Hurst CD: Molecular biology
of bladder cancer: New insights into pathogenesis and clinical
diversity. Nat Rev Cancer. 15:25–41. 2015. View Article : Google Scholar : PubMed/NCBI
|
|
16
|
Enache M, Simionescu C and Lascu LC: Ki67
and Bcl-2 immunoexpression in primitive urothelial bladder
carcinoma. Rom J Morphol Embryol. 53:521–525. 2012.PubMed/NCBI
|
|
17
|
Miyamoto H, Izumi K, Yao JL, Li Y, Yang Q,
McMahon LA, Gonzalez-Roibon N, Hicks DG, Tacha D and Netto GJ: GATA
binding protein 3 is down-regulated in bladder cancer yet strong
expression is an independent predictor of poor prognosis in
invasive tumor. Hum Pathol. 43:2033–2040. 2012. View Article : Google Scholar : PubMed/NCBI
|
|
18
|
Rosenthal DL, McLatchie C, Stern E, White
BS and Castleman KR: Endocervical columnar cell atypia coincident
with cervical neoplasia characterized by digital image analysis.
Acta Cytol. 26:115–120. 1982.PubMed/NCBI
|
|
19
|
Stern E, Rosenthal DL, McLatchie C, White
BS and Castleman KR: An expanded cervical cell classification
system validated by automated measurements. Anal Quant Cytol.
4:110–114. 1982.PubMed/NCBI
|
|
20
|
Kriete A, Romen W, Schäffer R, Harms H,
Haucke M, Gerlach B, Aus HM and ter Meulen V: Computer analysis of
chromatin arrangement and nuclear texture in follicular thyroid
tumours. Histochemistry. 78:227–230. 1983. View Article : Google Scholar : PubMed/NCBI
|
|
21
|
Komitowski D and Zinser G: Quantitative
description of chromatin structure during neoplasia by the method
of image processing. Anal Quant Cytol Histol. 7:178–182.
1985.PubMed/NCBI
|
|
22
|
Saito A, Numata Y, Hamada T, Horisawa T,
Cosatto E, Graf HP, Kuroda M and Yamamoto Y: A novel method for
morphological pleomorphism and heterogeneity quantitative
measurement: Named cell feature level co-occurrence matrix. J
Pathol Inform. 7:362016. View Article : Google Scholar : PubMed/NCBI
|
|
23
|
Caie PD, Zhou Y, Turnbull AK, Oniscu A and
Harrison DJ: Novel histopathologic feature identified through image
analysis augments stage II colorectal cancer clinical reporting.
Oncotarget. 7:44381–44394. 2016. View Article : Google Scholar : PubMed/NCBI
|
|
24
|
Ali HR, Dariush A, Provenzano E, Bardwell
H, Abraham JE, Iddawela M, Vallier AL, Hiller L, Dunn JA, Bowden
SJ, et al: Computational pathology of pre-treatment biopsies
identifies lymphocyte density as a predictor of response to
neoadjuvant chemotherapy in breast cancer. Breast Cancer Res.
18:212016. View Article : Google Scholar : PubMed/NCBI
|
|
25
|
Keshtkar A, Keshtkar A and Lawford P:
Cellular morphological parameters of the human urinary bladder
(malignant and normal). Int J Exp Pathol. 88:185–190. 2007.
View Article : Google Scholar : PubMed/NCBI
|
|
26
|
Gschwendtner A and Mairinger T:
Quantitative assessment of bladder carcinoma by acid labile DNA
assay. Cancer. 86:105–113. 1999. View Article : Google Scholar : PubMed/NCBI
|
|
27
|
Krabbe LM, Bagrodia A, Lotan Y, Gayed BA,
Darwish OM, Youssef RF, John G, Harrow B, Jacobs C, Gaitonde M, et
al: Prospective analysis of Ki-67 as an independent predictor of
oncologic outcomes in patients with high grade upper tract
urothelial carcinoma. J Urol. 191:28–34. 2014. View Article : Google Scholar : PubMed/NCBI
|
|
28
|
Shariat SF, Karakiewicz PI, Ashfaq R,
Lerner SP, Palapattu GS, Cote RJ, Sagalowsky AI and Lotan Y:
Multiple biomarkers improve prediction of bladder cancer recurrence
and mortality in patients undergoing cystectomy. Cancer.
112:315–325. 2008. View Article : Google Scholar : PubMed/NCBI
|
|
29
|
Shariat SF, Chade DC, Karakiewicz PI,
Ashfaq R, Isbarn H, Fradet Y, Bastian PJ, Nielsen ME, Capitanio U,
Jeldres C, et al: Combination of multiple molecular markers can
improve prognostication in patients with locally advanced and lymph
node positive bladder cancer. J Urol. 183:68–75. 2010. View Article : Google Scholar : PubMed/NCBI
|
|
30
|
Shariat SF, Ashfaq R, Sagalowsky AI and
Lotan Y: Predictive value of cell cycle biomarkers in nonmuscle
invasive bladder transitional cell carcinoma. J Urol. 177:481–487.
2007. View Article : Google Scholar : PubMed/NCBI
|
|
31
|
Kalantari MR and Ahmadnia H: P53
overexpression in bladder urothelial neoplasms: New aspect of World
Health Organization/International Society of Urological Pathology
classification. Urol J. 4:230–233. 2007.PubMed/NCBI
|
|
32
|
Gao J, Chen YH and Peterson LC: GATA
family transcriptional factors: Emerging suspects in hematologic
disorders. Exp Hematol Oncol. 4:282015. View Article : Google Scholar : PubMed/NCBI
|
|
33
|
Zheng R and Blobel GA: GATA transcription
factors and cancer. Genes Cancer. 1:1178–1188. 2010. View Article : Google Scholar : PubMed/NCBI
|
|
34
|
Asselin-Labat ML, Sutherland KD, Barker H,
Thomas R, Shackleton M, Forrest NC, Hartley L, Robb L, Grosveld FG,
van der Wees J, et al: Gata-3 is an essential regulator of
mammary-gland morphogenesis and luminal-cell differentiation. Nat
Cell Biol. 9:201–209. 2007. View
Article : Google Scholar : PubMed/NCBI
|
|
35
|
Liang Y, Heitzman J, Kamat AM, Dinney CP,
Czerniak B and Guo CC: Differential expression of GATA-3 in
urothelial carcinoma variants. Hum Pathol. 45:1466–1472. 2014.
View Article : Google Scholar : PubMed/NCBI
|
|
36
|
Papathomas TG, Pucci E, Giordano TJ, Lu H,
Duregon E, Volante M, Papotti M, Lloyd RV, Tischler AS, van
Nederveen FH, et al: An international Ki67 reproducibility study in
adrenal cortical carcinoma. Am J Surg Pathol. 40:569–576. 2016.
View Article : Google Scholar : PubMed/NCBI
|