Introduction
Osteosarcoma (OS) is the most common type of primary
bone malignancy in children and adolescents (1). It is a high-grade malignant tumor with a
poor prognosis, and ~20% of patients with OS present with
metastases at diagnosis (2,3). Treatment generally involves surgery and
adjuvant chemotherapy, and a positive response to chemotherapy is
considered to be a prognostic marker for OS, indicating a favorable
overall outcome (4,5). Although neoadjuvant chemotherapy has
improved the survival rate by a considerable amount, progress in
treatment regimens remains at a plateau.
At the molecular level, OS is characterized by gross
changes in gene expression and highly heterogeneous karyotypes with
variable genomic aberrations (6–8). DNA
methylation, particularly at cytosine-phosphate-guanine sites in
the promoter region of genes, is a crucial mechanism for the
downregulation of gene expression (9,10).
Expression levels of Ras association domain family member 1A have
been demonstrated to decrease due to promoter methylation in
primary OS cell lines (11,12). Hypermethylation of the hypermethylated
in cancer 1 promoter has been revealed to be present in 17% of
pediatric patients with OS (13). In
addition, genetic variations, particularly single nucleotide
polymorphisms, may contribute to cancer risk and progression
(14). Copy number variations across
the whole genome, including deletions, amplifications and
duplications, are associated with OS tumorigenesis (15). In addition, the mutation or loss of
gene expression of the tumor protein p53 tumor suppressor gene is
commonly associated with OS (16,17).
Despite these data, there is limited understanding of the molecular
pathogenesis of OS, and a lack of good diagnostic and prognostic
tools.
A number of previous studies have combined gene
expression data with DNA copy number data to screen for
tumor-associated genes in OS genetic variants (18,19). The
microarray data GSE36004 has been used in the integrative analysis
of mRNA expression, DNA methylation and DNA copy number in OS for
elucidating dependencies, and the association between genetic and
epigenetic alterations in OS (20).
In contrast to a previous study (20), the present study aimed to utilize an
integrative bioinformatics approach to map the genetic and
epigenetic changes in OS, and to identify key genes associated with
OS oncogenesis. Microarray data from 19 OS cell lines and normal
controls was used to screen differentially expressed genes (DEGs)
and differentially methylated regions (DMRs), and to perform copy
number analysis. Then, functional enrichment analysis was performed
and protein-protein interactions (PPI) were identified to
additionally screen for the key genes. The identification of
molecular targets that are specific for OS will be critical to the
development of novel targeted therapeutic strategies to improve
patient outcomes.
Materials and methods
Microarray data
The microarray data GSE36004, which was contributed
by Kresse et al (20), were
downloaded from the public repository Gene Expression Omnibus (GEO,
http://www.ncbi.nlm.nih.gov/geo/)
(21). It contained expression
profiling data, methylation profiling data and genome variation
single nucleotide polymorphism (SNP) profiling data, which were
respectively based on Illumina HumanMethylation27 BeadChip
(Illumina, Inc., San Diego, CA, USA), Affymetrix Genome-Wide Human
SNP 6.0 Array (Affymetrix, Inc., Santa Clara, CA, USA) and Illumina
human-6 v2.0 expression BeadChip (Illumina, Inc.) analyses. A total
of 25 samples, including 19 OS cell lines and 6 normal controls
(osteoblasts and bones), were applied to develop expression
profiling data and methylation profiling data, respectively, while
only the 19 OS cell lines were utilized to develop SNP profiling
data. All the raw data and annotation files were obtained for
subsequent analysis.
DEG screening
According to the expression profiling data of
GSE36004, DEGs in OS cell lines compared with normal controls were
identified using the Limma package (available at http://www.bioconductor.org/packages/release/bioc/html/limma.html)
(22) in Bioconductor package version
1.0.2 (23). Significant P-values
were adjusted for multiple testing using the Benjamini-Hochberg
method (24). A log fold-change (FC)
>1 and adjusted P<0.05 were considered to indicate a
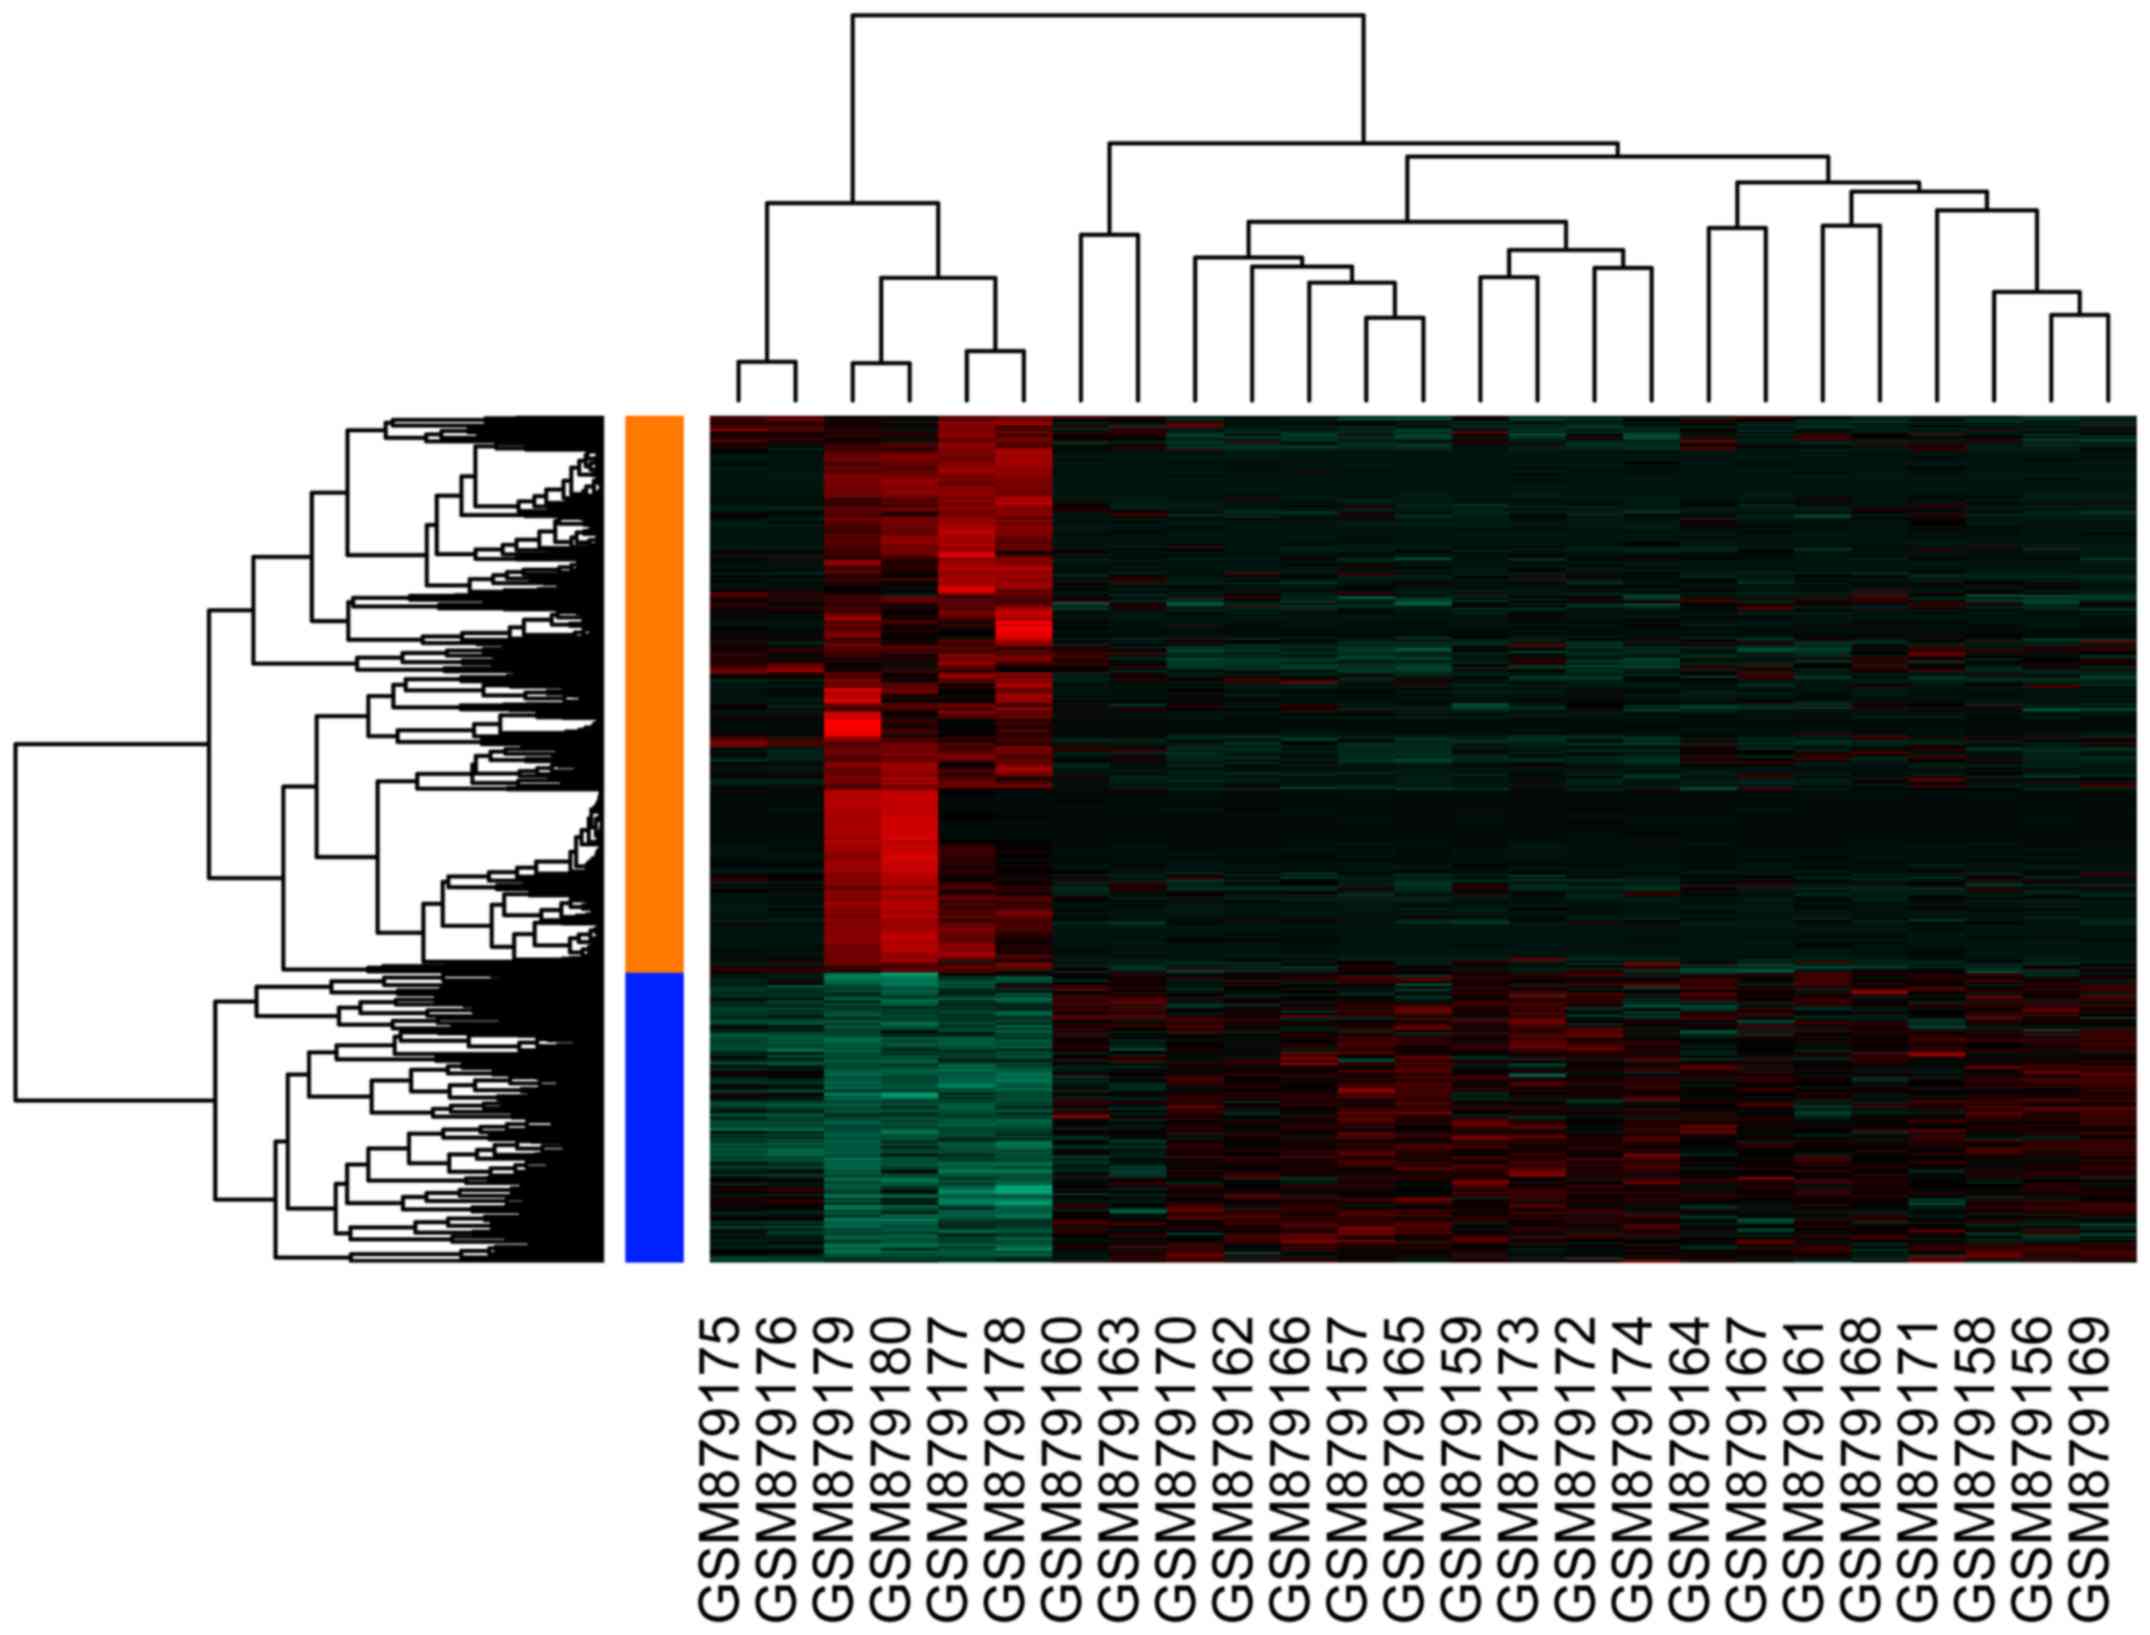
statistically significant difference. Unsupervised hierarchical
clustering of 25 samples was performed using the R package
(v2.13.0; R Project for Statistical Computing, Vienna, Austria)
(25) based on microarray data.
Analysis of methylated regions
Quantile normalization of the methylation profiling
data was first performed using the Lumi package (available at
http://www.bioconductor.org/packages/release/bioc/html/lumi.html)
(26) in Bioconductor package version
1.0.2, then DMRs were identified using methyAnalysis (27) with minimum P-values adjusted to
<0.01.
Copy number analysis
Copy number analysis of the raw data from the SNP
profiling data was performed using the crlmm package (http://www.Bioconductor.org/packages/release/bioc/html/crlmm.html)
(28) in Bioconductor package version
1.0.2. Then, genes with copy number gains/losses were additionally
screened using the DNAcopy (29) and
cghMCR package (http://www.bioconductor.org/packages/2.4/bioc/html/cghMCR.html).
Genes with copy number gains/losses (0.2 for gain, −0.2 for loss)
in >30% samples was the threshold value for the DNAcopy and
cghMCR packages.
Functional enrichment analysis of
DEGs
Gene Ontology (GO; http://www.geneontology.org) (30) is a tool for the unification of biology
functions based on gene annotation information, which primarily
consists of biological process (BP), molecular function (MF), and
cellular component (CC) analysis. The Kyoto Encyclopedia of Genes
and Genomes (KEGG; available at http://www.genome.ad.jp/kegg/) (31) is a pathway-associated database which
connects known information on molecular interaction networks. To
understand the biological significance of the identified DEGs, the
upregulated and downregulated genes were input into the Database
for Annotation Visualization and Integrated Discovery (DAVID;
http://david.abcc.ncifcrf.gov/)
(32) for GO BP terms and KEGG
pathway analyses. P<0.05 and gene counts >2 were considered
to indicate a statistically significant difference.
PPI network construction
The Search Tool for the Retrieval of Interacting
Genes database (STRING; http://www.bork.embl-heidelberg.de/STRING/) (33) provides comprehensive information on
the functional interactions between DEGs and other genes by
calculating their combined score. PPI pairs with a combined score
of >0.7 as a cutoff value were identified. PPI networks were
then constructed using Cytoscape software (version 2.6.3)
(available at http://cytoscapeweb.cytoscape.org/) (34) based on the PPI pairs.
Statistical analysis
The correlation between the expression levels and
the methylation levels of genes was analyzed by Pearson correlation
coefficient test (35) using SPSS
19.0 software (IBM Corp., Armonk, NY, USA). The correlation
coefficient takes a value between −1 and 1, where the value closer
to −1 (or 1) indicates a negative (or positive) high association
and closer to 0 indicates no association between the two
variables.
Results
DEG screening
A total of 663 DEGs with log FC>1 and adjusted
P<0.05 were screened using the Limma package of R, including 227
upregulated and 436 downregulated DEGs. The resultant heat map of
DEGs is depicted in Fig. 1.
Analysis of methylated regions
A total of 2,368 DMRs were identified using
methyAnalysis with minimum P-values adjusted to <0.01, and 1,093
hyper- and 162 hypo-methylated regions were located in the gene
promoter regions. Notably, there were 47 downregulated genes in the
1,093 hyper-methylated regions, while no genes were upregulated in
the 162 hypo-methylated regions. Pearson correlation coefficient
tests (35) was then used to
calculate the correlation between the gene expression levels and
the methylation levels of 47 downregulated genes. The correlation
results demonstrated that the median, minimum and maximum values of
the Pearson correlation coefficient were −0.4987, −0.7902 and
−0.1573, respectively. The genes with the strongest correlations
were intercellular adhesion molecule 3 (r=−0.7902), cytochrome c
oxidase subunit VIIa polypeptide 1 (r=−0.7743),
aminomethyltransferase (r=−0.7554), retinoic acid receptor
responder (tazarotene induced) 1 (r=−0.7517) and Fc fragment of
IgE, high affinity I, receptor for; gamma polypeptide
(FCER1G; r=−0.7366).
Copy number analysis
Based on the microarray data for SNP profiling,
2,838 genes exhibited copy number gains and 415 exhibited copy
number losses. Among them, 17 genes with copy number gains were
upregulated, while 5 genes with copy number losses were
downregulated. The genes with upregulated expression and copy
number gains were as follows: ATPase family, AAA domain containing
2 (ATAD2), small nuclear ribonucleoprotein polypeptide A',
ribosomal protein L7 (RPL7), cyclin-dependent kinase 4
(CDK4) and tubulin, α 1a (TUBA1A). The genes with
downregulated expression and copy number losses were Rho GTPase
activating protein 9 (ARHGAP9), chromosome 1 open reading
frame 54, leiomodin 3 (fetal), major histocompatibility complex,
class II, DO α (HLA-DOA) and Rh blood group, D antigen
(RHD).
Functional enrichment analysis of
DEGs
DAVID was used to perform functional enrichment
analysis of the DEGs. The over-represented GO BP terms and
significantly enriched KEGG pathways are summarized in Tables I and II, respectively. According to the
enrichment results, the upregulated genes were mainly associated
with carboxylic acid biosynthetic, organic acid biosynthetic and
L-serine metabolic processes (Table
I). In addition, the upregulated genes were significantly
enriched in 6 KEGG pathways, including glycine, serine and
threonine metabolism, ribosome and one carbon pool by folate
(Table II). Downregulated genes were
mainly associated with functions including the immune response,
defense response and gas transport (Table
I), and were significantly enriched in 20 KEGG pathways,
including asthma, viral myocarditis and intestinal immune network
for immunoglobulin (Ig) A production (Table II).
 | Table I.The top 10 GO terms enriched among
differentially expressed genes. |
Table I.
The top 10 GO terms enriched among
differentially expressed genes.
| GO ID | Description | Counts | P-value |
|---|
| Upregulated |
|
|
|
|
GO:0046394 | Carboxylic acid
biosynthetic process | 13 |
1.33×10⁻⁸ |
|
GO:0016053 | Organic acid
biosynthetic process | 13 |
1.33×10⁻⁸ |
|
GO:0006563 | L-serine metabolic
process | 5 |
4.15×10⁻⁷ |
|
GO:0008652 | Cellular amino acid
biosynthetic process | 7 |
5.86×10⁻⁶ |
|
GO:0006412 | Translation | 13 | 4.05
×10−5 |
|
GO:0009069 | Serine family amino
acid metabolic process | 5 |
7.82×10⁻⁵ |
|
GO:0009309 | Amine biosynthetic
process | 7 |
8.49×10⁻⁵ |
|
GO:0009070 | Serine family amino
acid biosynthetic process | 4 |
1.09×10⁻⁴ |
|
GO:0006564 | L-serine
biosynthetic process | 3 |
2.37×10⁻⁴ |
|
GO:0006633 | Fatty acid
biosynthetic process | 6 |
7.00×10⁻⁴ |
| Downregulated |
|
|
|
|
GO:0006955 | Immune
response | 68 |
9.91×10⁻²⁴ |
|
GO:0006952 | Defense
response | 52 |
3.80×10⁻¹⁵ |
|
GO:0015669 | Gas transport | 9 |
3.36×10⁻⁹ |
|
GO:0009611 | Response to
wounding | 38 |
4.05×10⁻⁹ |
|
GO:0032101 | Regulation of
response to external stimulus | 20 |
7.43×10⁻⁹ |
|
GO:0048584 | Positive regulation
of response to stimulus | 23 |
4.88×10⁻⁸ |
|
GO:0002504 | Antigen processing
and presentation of peptide or polysaccharide antigen via MHC class
II | 10 |
5.12×10⁻⁸ |
|
GO:0002684 | Positive regulation
of immune system process | 23 |
5.67×10⁻⁸ |
|
GO:0050727 | Regulation of
inflammatory response | 13 |
2.14×10⁻⁷ |
|
GO:0006954 | Inflammatory
response | 26 |
2.54×10⁻⁷ |
| Table II.The significant KEGG pathways
enriched by differentially expressed genes. |
Table II.
The significant KEGG pathways
enriched by differentially expressed genes.
| Description | Counts | % | P-value |
|---|
| Upregulated |
|
|
|
|
hsa00260: Glycine, serine and
threonine metabolism | 5 | 3.125 |
6.26×10−04 |
|
hsa03010: Ribosome | 6 | 3.75 | 0.005144 |
|
hsa00670: One carbon pool by
folate | 3 | 1.875 | 0.017709 |
|
hsa00100: Steroid
biosynthesis | 3 | 1.875 | 0.019904 |
|
hsa01040: Biosynthesis of
unsaturated fatty acids | 3 | 1.875 | 0.032434 |
|
hsa00450: Selenoamino acid
metabolism | 3 | 1.875 | 0.04415 |
| Downregulated |
|
|
|
|
hsa05310: Asthma | 11 | 2.820513 |
9.14×10−09 |
|
hsa05416: Viral
myocarditis | 13 | 3.333333 |
1.71×10−06 |
|
hsa04672: Intestinal immune
network for IgA production | 11 | 2.820513 |
2.17×10−06 |
|
hsa05330: Allograft
rejection | 9 | 2.307692 |
1.21×10−05 |
|
hsa04514: Cell adhesion
molecules (CAMs) | 16 | 4.102564 |
1.45×10−05 |
|
hsa05332: Graft-versus-host
disease | 9 | 2.307692 |
2.26×10−05 |
|
hsa04940: Type I diabetes
mellitus | 9 | 2.307692 |
4.00×10−05 |
|
hsa05322: Systemic lupus
erythematosus | 13 | 3.333333 |
5.72×10−05 |
|
hsa04640: Hematopoietic cell
lineage | 12 | 3.076923 |
7.14×10−05 |
|
hsa05320: Autoimmune thyroid
disease | 9 | 2.307692 |
1.69×10−04 |
Notably, the enrichment results demonstrated that 47
downregulated genes in the hyper-methylated regions were
significantly enriched in the ECM-receptor interaction pathway, and
were associated with the regulation of cytokine production,
regulation of tumor necrosis factor production and cell
adhesion.
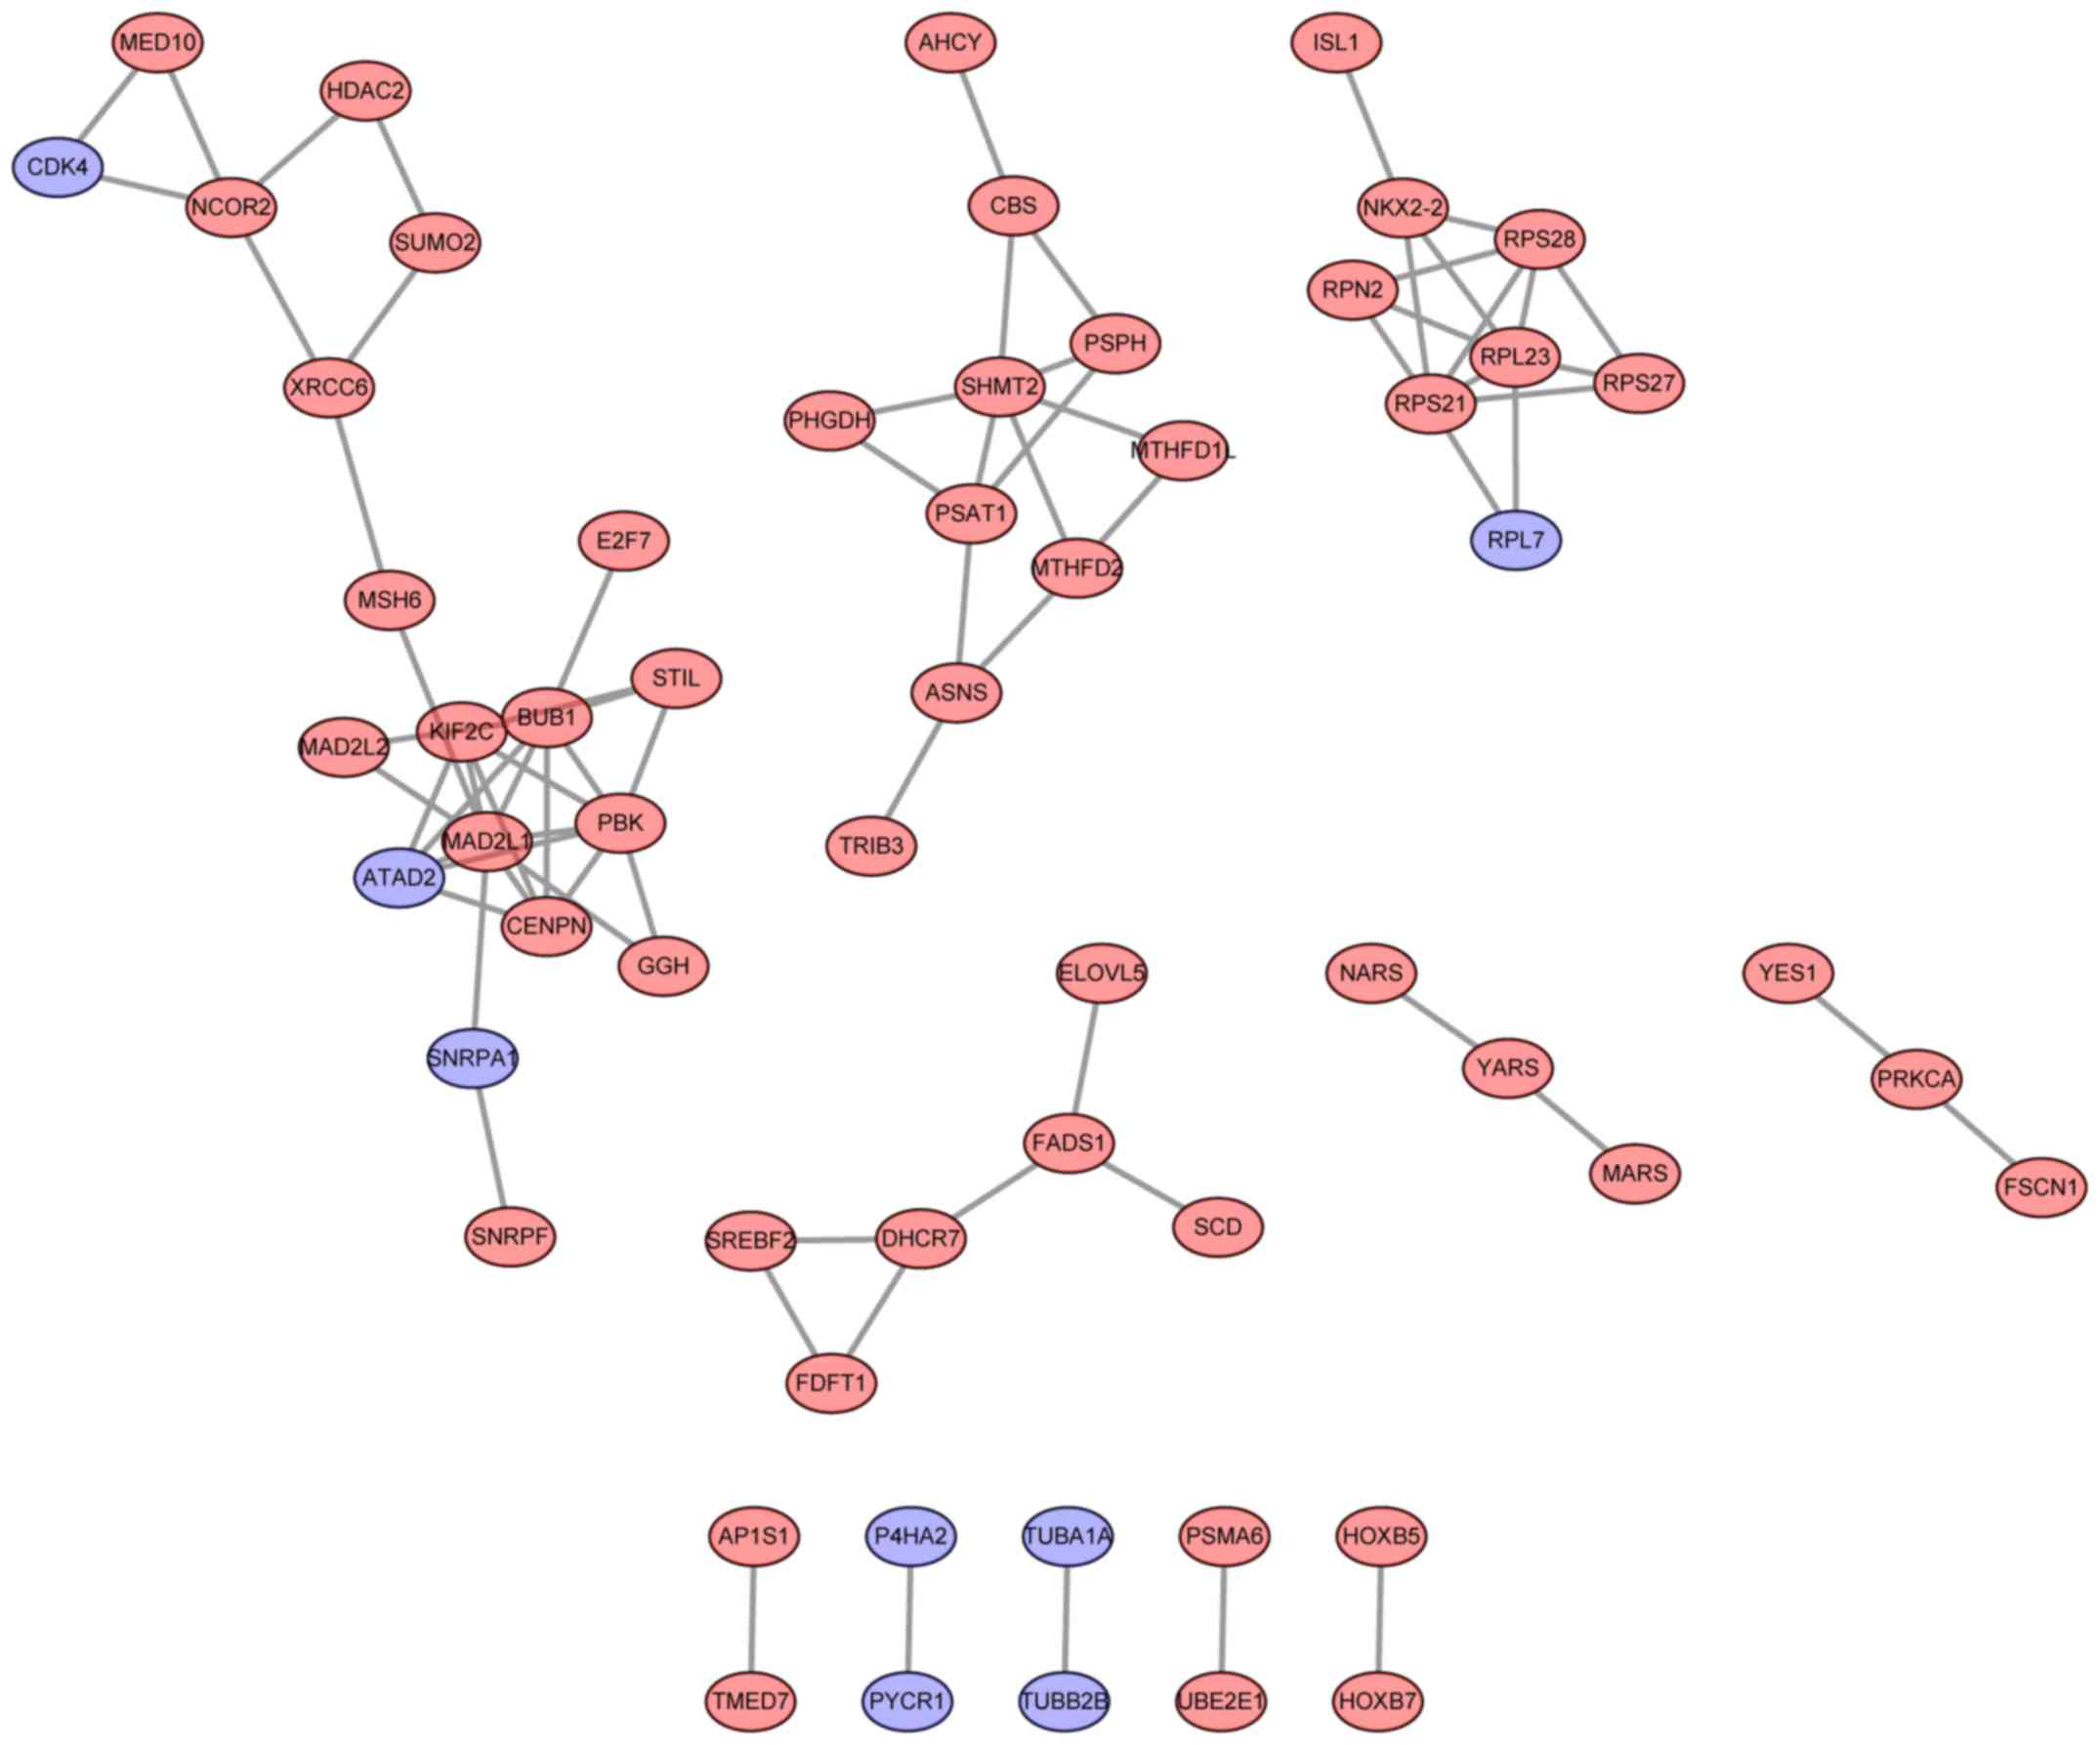
PPI network analysis
Based on the information from the STRING database,
PPI networks of upregulated and downregulated genes were
constructed. MAD2 mitotic arrest deficient-like 1 (degree=9), BUB1
mitotic checkpoint serine/threonine kinase (degree=8) and PDZ
binding kinase (degree=7) were selected as the hub nodes in the PPI
network of upregulated genes (Fig.
2). Notably, the upregulated genes, including ATAD2,
RPL7 and CDK4, exhibited copy number gains and may
interact with other upregulated genes (Fig. 2).
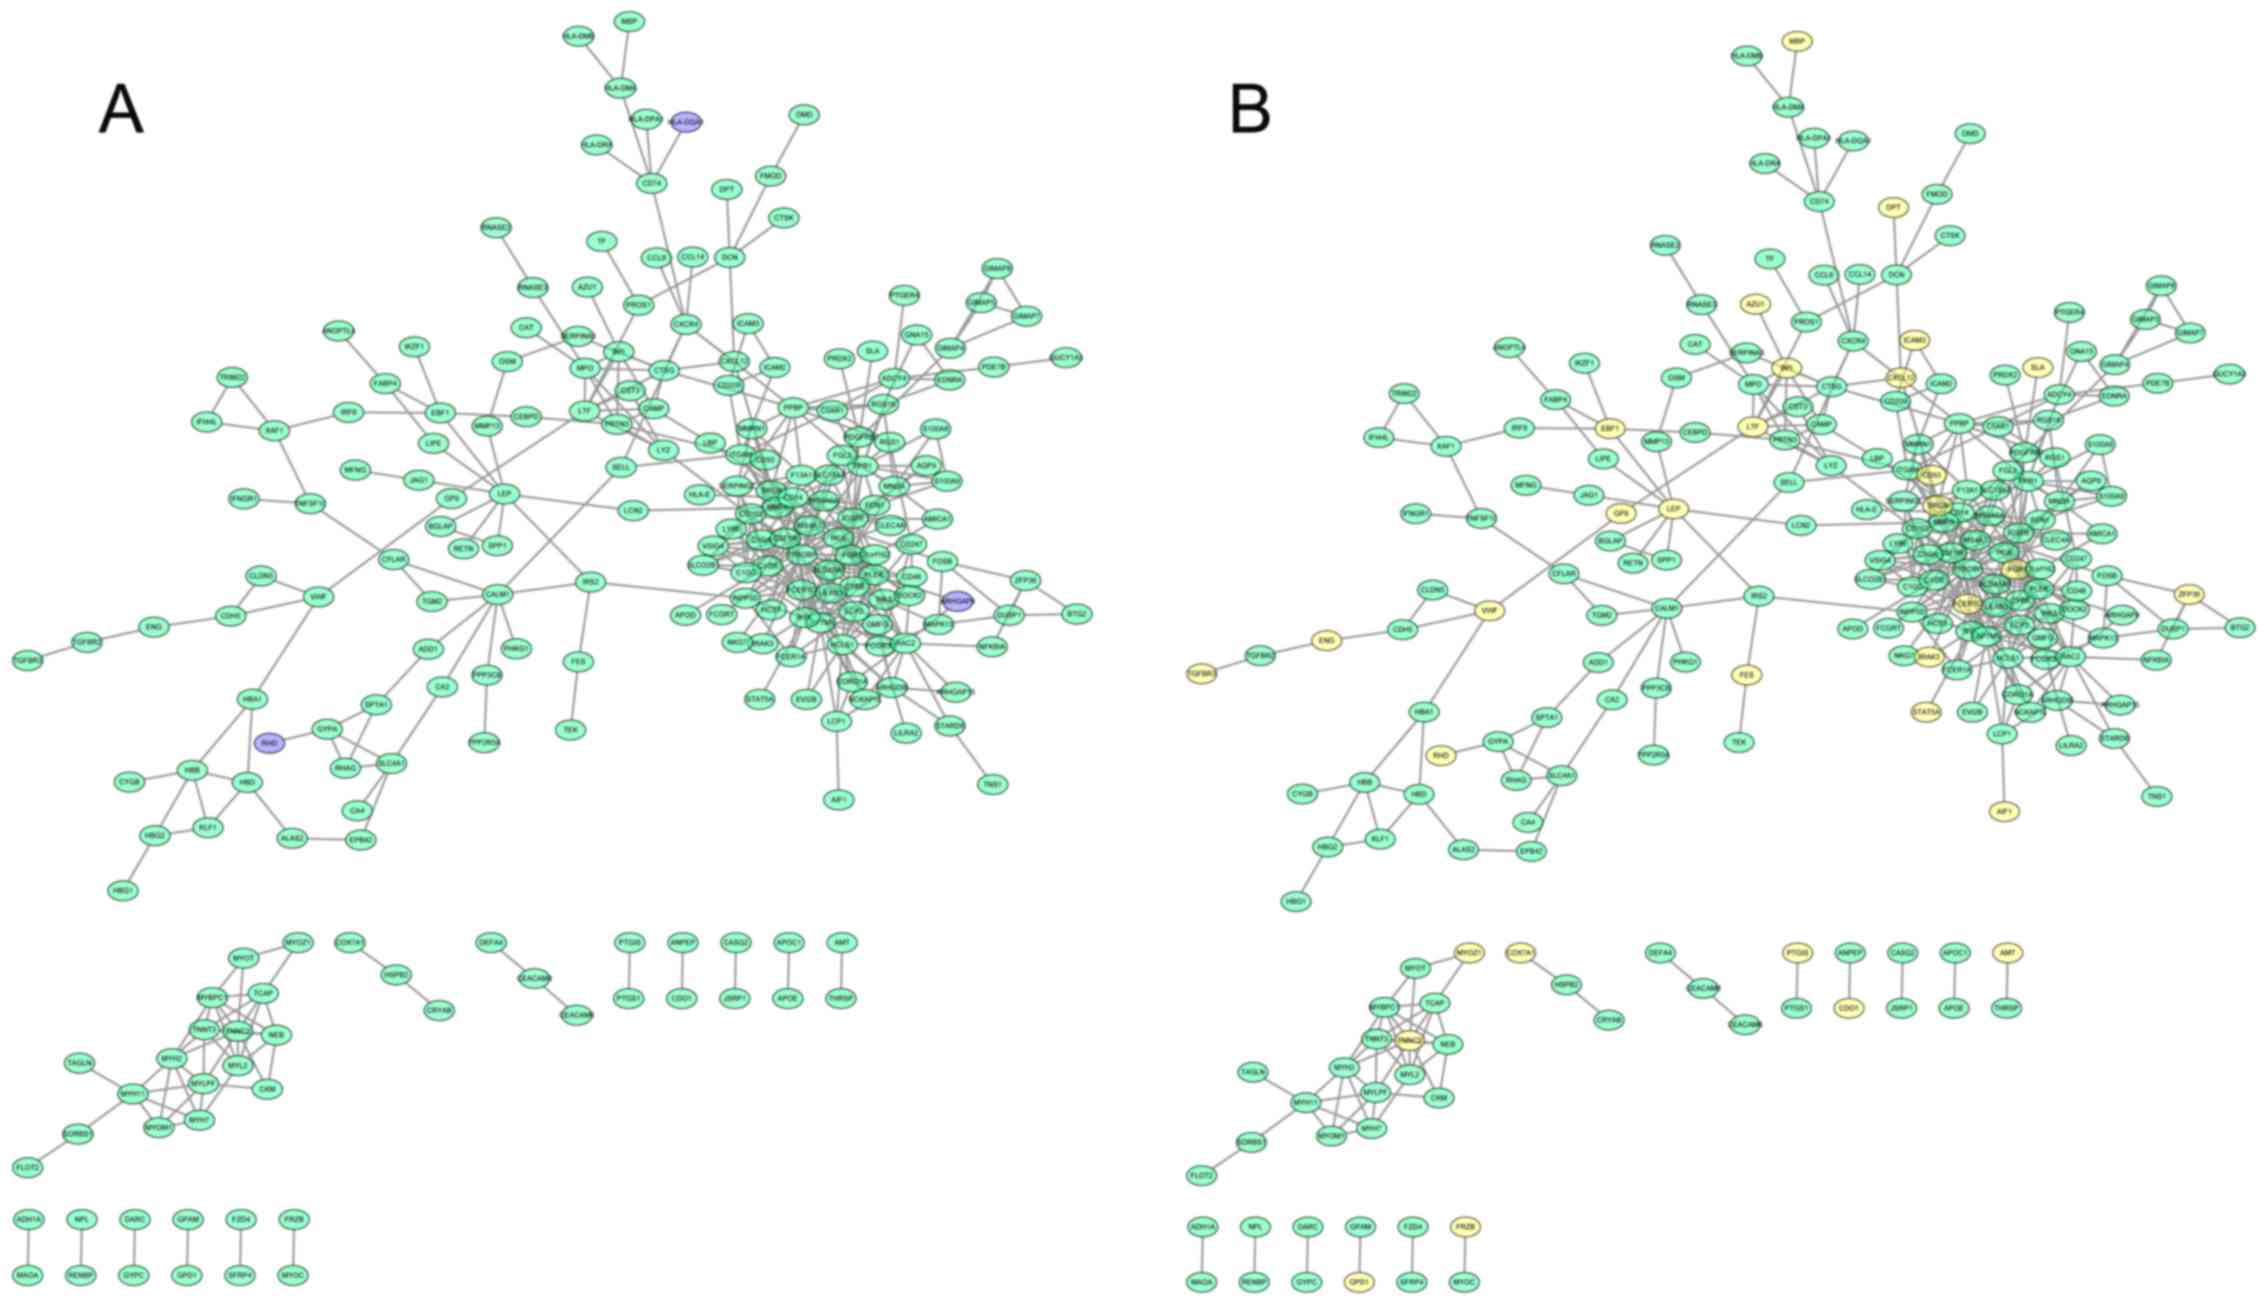
In the PPI network of downregulated genes, TYRO
protein tyrosine kinase binding protein (degree=37), immunoglobulin
superfamily, member 6 (degree=20) and lysosomal protein
transmembrane 5 (degree=19) with the highest degrees were hub nodes
(Fig. 3). In addition, the
hyper-methylated hub nodes were FCER1 G, leptin
(LEP), and feline Gardner-Rasheed sarcoma viral oncogene
homolog (FGR). Concurrently, ARHGAP9, HLA-DOA
and RHD exhibited copy number losses and may interact with
other downregulated genes.
Discussion
The cell line panel provides a valuable model system
for analysis of genetic and epigenetic aberrations in OS (36). In the present study, a comprehensive
bioinformatics approach was utilized for analysis of the effects of
genome-wide changes in gene expression, DNA methylation and DNA
copy number alterations in OS cell lines compared with the normal
controls. The results demonstrated that a total of 47 downregulated
genes were located in hyper-methylated regions, while no genes were
upregulated in hypo-methylated regions, including FCER1G,
FGR and LEP. In addition, downregulated genes
including ARHGAP9 and HLA-DOA, exhibited copy number
losses, and upregulated genes, including ATAD2 and
CDK4, exhibited copy number gains. All these genes may act a
key function in OS progression and merit additional discussion.
FCER1G, LEP and FGR were
hyper-methylated in the present study. FCER1G, the γ subunit gene
of the high-affinity receptor for IgE (FcεRI), is considered to
serve a crucial function in upregulating FcεRI on atopic
antigen-presenting cells (37).
Demethylation of the FCER1G promoter results in the
overexpression of FcεRI on monocytes of patients with atopic
dermatitis (38). Epigenetic
deregulation may serve an important function in cancer development
(39). LEP encodes the leptin
protein which is expressed in and secreted from mature primary
cultures of human osteoblasts, which is of importance for
osteoblastic cell growth and bone mineralization (40). LEP may increase bone mass by
stimulating OS cell proliferation via activation of the
phosphoinositide 3-kinase and mitogen-activated protein kinase
(MAPK) signaling pathways (41). The
FGR gene is a member of the Src family of protein tyrosine
kinases. This gene functions as a negative regulator of cell
migration and adhesion, and is triggered by the β-2 integrin signal
transduction pathway (42). The
chemokine receptor 4/stromal cell-derived factor 1 serves an
important function in OS tumor progression via the regulation of
cell migration and adhesion (43),
suggesting that FGR may be involved in OS development via
regulating cell migration and adhesion. In the present study, these
hyper-methylated genes were revealed to be downregulated, thus, it
was hypothesized that these genes may be involved in OS progression
via decreased expression following hyper-methylation. The results
may assist in understanding the epigenetic regulation of specific
genes in OS tumor development.
In addition, OS is a copy number alteration-rich
malignant bone tumor, and candidate genes with copy number changes
are being identified in OS (44). In
the present study, DEGs including ARHGAP9 and
HLA-DOA, exhibited copy number losses while ATAD2 and
CDK4 exhibited copy number gains. ARHGAP9, which is a novel
MAP kinase docking protein, interacts with mitogen-activated
protein kinase 1 (ERK2) and p38α (45). Silencing ERK2 in human U2OS cells may
inhibit the expression and function of glycoprotein 130, which
serves a pivotal function in cancer and inflammation (46). In addition, HLA-DOA is a key
molecule in the antigen processing and presentation pathway, and
this pathway has also been suggested to be involved in OS
progression via downregulated expression of HLA-DOA
(47,48). In addition, ATAD2 is highly
expressed and genetically amplified in several types of human
cancer (49). ATAD2 binds to
the v-Myc avian myelocytomatosis viral oncogene homolog
(c-Myc) oncogene and stimulates its transcriptional activity
(49). A previous study demonstrated
that overexpression of c-Myc may promote OS cell invasion
via the activation of the mitogen activated protein kinase
kinase-extracellular signal-regulated kinase pathway (50). ATAD2 is also confirmed to
exhibit prognostic significance in high-grade OS (51). The amplification and overexpression of
CDK4 tends to be associated with improved prognosis in
low-grade OS (52). 12q13-14 CDK4
amplicons are frequently observed in OS (53). CDK4 and other CDK inhibitors are
regarded as promising anticancer agents in cancer treatment
(54). Therefore, these DEGs may
serve important functions in the development and progression of OS.
The results of the present study are consistent with these data,
suggesting that copy number alterations of key genes may be
associated with OS.
In conclusion, hyper-methylation of FCER1G,
LEP and FGR is observed in OS, suggesting that
epigenetic alterations of these specific genes may act crucial
functions in OS development. In addition, copy number alterations
of these DEGs, including ARHGAP9, HLA-DOA,
ATAD2 and CDK4, may also contribute to OS
progression. These results indicate that genetic and epigenetic
alterations are important mechanisms involved in OS, and these DEGs
may serve as candidate targets for the diagnosis and treatment of
this disease. However, no experimental validation and the
relatively small sample size are the limitations of the present
study. The results require additional validation.
References
|
1
|
Ottaviani G and Jaffe N: The epidemiology
of osteosarcoma. In: Pediatric and Adolescent Osteosarcoma. Jaffe
N, Bruland OS and Bielack S: Springer; New York: pp. 3–13. 2010
|
|
2
|
Posthuma De, Boer J, Witlox MA, Kaspers GJ
and van Royen BJ: Molecular alterations as target for therapy in
metastatic osteosarcoma: A review of literature. Clin Exp
Metastasis. 28:493–503. 2011. View Article : Google Scholar : PubMed/NCBI
|
|
3
|
Aksnes LH, Hall KS, Folleraas G, Stenwig
AE, Bjerkehagen B, Taksdal I, Winderen M, Bruland OS and Saeter G:
Management of high-grade bone sarcomas over two decades: The
Norwegian Radium Hospital experience. Acta Oncol. 45:38–46. 2006.
View Article : Google Scholar : PubMed/NCBI
|
|
4
|
Sakamoto A and Iwamoto Y: Current status
and perspectives regarding the treatment of osteosarcoma:
Chemotherapy. Rev Recent Clin Trials. 3:228–231. 2008. View Article : Google Scholar : PubMed/NCBI
|
|
5
|
Sadikovic B, Thorner P, Chilton-MacNeill
S, Martin JW, Cervigne NK, Squire J and Zielenska M: Expression
analysis of genes associated with human osteosarcoma tumors shows
correlation of RUNX2 overexpression with poor response to
chemotherapy. Bmc Cancer. 10:2022010. View Article : Google Scholar : PubMed/NCBI
|
|
6
|
Smida J, Baumhoer D, Rosemann M, Walch A,
Bielack S, Poremba C, Remberger K, Korsching E, Scheurlen W,
Dierkes C, et al: Genomic alterations and allelic imbalances are
strong prognostic predictors in osteosarcoma. Clin Cancer Res.
16:4256–4267. 2010. View Article : Google Scholar : PubMed/NCBI
|
|
7
|
Squire JA, Pei J, Marrano P, Beheshti B,
Bayani J, Lim G, Moldovan L and Zielenska M: High-resolution
mapping of amplifications and deletions in pediatric osteosarcoma
by use of CGH analysis of cDNA microarrays. Genes Chromosomes
Cancer. 38:215–225. 2003. View Article : Google Scholar : PubMed/NCBI
|
|
8
|
Sandberg AA and Bridge JA: Updates on the
cytogenetics and molecular genetics of bone and soft tissue tumors:
Osteosarcoma and related tumors. Cancer Genet Cytogenet. 145:1–30.
2003. View Article : Google Scholar : PubMed/NCBI
|
|
9
|
Cui J, Wang W, Li Z, Zhang Z, Wu B and
Zeng L: Epigenetic changes in osteosarcoma. Bull Cancer.
98:E62–E68. 2011.PubMed/NCBI
|
|
10
|
Momparler RL and Bovenzi V: DNA
methylation and cancer. J Cell Physiol. 183:145–154. 2000.
View Article : Google Scholar : PubMed/NCBI
|
|
11
|
Hou P, Ji M, Yang B, Chen Z, Qiu J, Shi X
and Lu Z: Quantitative analysis of promoter hypermethylation in
multiple genes in osteosarcoma. Cancer. 106:1602–1609. 2006.
View Article : Google Scholar : PubMed/NCBI
|
|
12
|
Lim S, Yang MH, Park JH, Nojima T,
Hashimoto H, Unni KK and Park YK: Inactivation of the RASSF1A in
osteosarcoma. Oncol Rep. 10:897–901. 2003.PubMed/NCBI
|
|
13
|
Rathi A, Virmani AK, Harada K, Timmons CF,
Miyajima K, Hay RJ, Mastrangelo D, Maitra A, Tomlinson GE and
Gazdar AF: Aberrant methylation of the HIC1 promoter is a frequent
event in specific pediatric neoplasms. Clin Cancer Res.
9:3674–3678. 2003.PubMed/NCBI
|
|
14
|
Batra J, Srinivasan S and Clements J:
Single Nucleotide Polymorphisms (SNPs). In: Molecular Testing in
Cancer. Springer. Yousef GM and Jothy S: Springer Science and
Buisiness Media. (New York, NY). 55–80. 2014.
|
|
15
|
Gokgoz N, Wunder JS and Andrulis IL:
Abstract 5075: Genome-wide analysis of DNA copy number variations
in osteosarcoma. Cancer Res. 72:50752012. View Article : Google Scholar
|
|
16
|
Seidinger AL, Mastellaro MJ, Paschoal
Fortes F, Godoy Assumpção J, Aparecida Cardinalli I, Aparecida
Ganazza M, Correa Ribeiro R, Brandalise SR, Dos Santos Aguiar S and
Yunes JA: Association of the highly prevalent TP53 R337H mutation
with pediatric choroid plexus carcinoma and osteosarcoma in
southeast Brazil. Cancer. 117:2228–2235. 2011. View Article : Google Scholar : PubMed/NCBI
|
|
17
|
Fu HL, Shao L, Wang Q, Jia T, Li M and
Yang DP: A systematic review of p53 as a biomarker of survival in
patients with osteosarcoma. Tumour Biol. 34:3817–3821. 2013.
View Article : Google Scholar : PubMed/NCBI
|
|
18
|
Yen CC, Chen WM, Chen TH, Chen WY, Chen
PC, Chiou HJ, Hung GY, Wu HT, Wei CJ, Shiau CY, et al:
Identification of chromosomal aberrations associated with disease
progression and a novel 3q13.31 deletion involving LSAMP gene in
osteosarcoma. Int J Oncol. 35:775–788. 2009.PubMed/NCBI
|
|
19
|
Lockwood WW, Stack D, Morris T, Grehan D,
O'Keane C, Stewart GL, Cumiskey J, Lam WL, Squire JA, Thomas DM and
O'Sullivan MJ: Cyclin E1 is amplified and overexpressed in
osteosarcoma. J Mol Diagn. 13:289–296. 2011. View Article : Google Scholar : PubMed/NCBI
|
|
20
|
Kresse SH, Rydbeck H, Skårn M, Namløs HM,
Barragan-Polania AH, Cleton-Jansen AM, Serra M, Liestøl K,
Hogendoorn PC, Hovig E, et al: Integrative analysis reveals
relationships of genetic and epigenetic alterations in
osteosarcoma. PLoS One. 7:e482622012. View Article : Google Scholar : PubMed/NCBI
|
|
21
|
Barrett T, Wilhite SE, Ledoux P,
Evangelista C, Kim IF, Tomashevsky M, Marshall KA, Phillippy KH,
Sherman PM, Holko M, et al: NCBI GEO: Archive for functional
genomics data sets-update. Nucleic Acids Res. 41:D991–D995. 2013.
View Article : Google Scholar : PubMed/NCBI
|
|
22
|
Smyth GK: Limma: Linear models for
microarray data. Bioinformatics and Computational Biology Solutions
Using R and Bioconductor. Gentleman R, Vincent JC, Huber W,
Irizarry RA and Dudolt S: Springer; pp. 397–420. 2005, View Article : Google Scholar
|
|
23
|
Gentleman RC, Carey VJ, Bates DM, Bolstad
B, Dettling M, Dudoit S, Ellis B, Gautier L, Ge Y, Gentry J, et al:
Bioconductor: Open software development for computational biology
and bioinformatics. Genome Biol. 5:R802004. View Article : Google Scholar : PubMed/NCBI
|
|
24
|
Benjamini Y and Hochberg Y: Controlling
the false discovery rate: A practical and powerful approach to
multiple testing. J Royal Stat Soc. 57:289–300. 1995.
|
|
25
|
RC ore Team: R, . A language and
environment for statistical computing. R Foundation for Statistical
Computing (Vienna, Austria). 2013.
|
|
26
|
Du P, Kibbe WA and Lin SM: Lumi: A
pipeline for processing Illumina microarray. Bioinformatics.
24:1547–1548. 2008. View Article : Google Scholar : PubMed/NCBI
|
|
27
|
Du P and Bourgon R: methyAnalysis: An R
package for DNA methylation data analysis and visualization.
2013.
|
|
28
|
Scharpf RB, Irizarry RA, Ritchie ME,
Carvalho B and Ruczinski I: Using the R package crlmm for
genotyping and copy number estimation. J Stat Softw. 40:1–32. 2011.
View Article : Google Scholar : PubMed/NCBI
|
|
29
|
Venkatraman E and Seshan A: DNAcopy: DNA
copy number data analysis. R Package Version. 1:2010.
|
|
30
|
Ashburner M, Ball CA, Blake JA, Botstein
D, Butler H, Cherry JM, Davis AP, Dolinski K, Dwight SS, Eppig JT,
et al: Gene ontology: Tool for the unification of biology. The Gene
Ontology Consortium. Nat Genet. 25:25–29. 2000. View Article : Google Scholar : PubMed/NCBI
|
|
31
|
Kanehisa M and Goto S: KEGG: Kyoto
encyclopedia of genes and genomes. Nucleic Acids Res. 28:27–30.
2000. View Article : Google Scholar : PubMed/NCBI
|
|
32
|
Huang DW, Sherman BT, Tan Q, Collins JR,
Alvord WG, Roayaei J, Stephens R, Baseler MW, Lane HC and Lempicki
RA: The DAVID gene functional classification tool: A novel
biological module-centric algorithm to functionally analyze large
gene lists. Genome Biol. 8:R1832007. View Article : Google Scholar : PubMed/NCBI
|
|
33
|
Von Mering C, Huynen M, Jaeggi D, Schmidt
S, Bork P and Snel B: STRING: A database of predicted functional
associations between proteins. Nucleic Acids Res. 31:258–261. 2003.
View Article : Google Scholar : PubMed/NCBI
|
|
34
|
Kohl M, Wiese S and Warscheid B:
Cytoscape: Software for visualization and analysis of biological
networks. Methods Mol Biol. 696:291–303. 2011. View Article : Google Scholar : PubMed/NCBI
|
|
35
|
Rahman M and Zhang Q: Comparison among
pearson correlation coefficient tests. Far East J Math Sci (FJMS).
99:237–255. 2016. View Article : Google Scholar
|
|
36
|
Mohseny AB, Machado I, Cai Y, Schaefer KL,
Serra M, Hogendoorn PC, Llombart-Bosch A and Cleton-Jansen AM:
Functional characterization of osteosarcoma cell lines provides
representative models to study the human disease. Lab Invest.
91:1195–1205. 2011. View Article : Google Scholar : PubMed/NCBI
|
|
37
|
Novak N, Tepel C, Koch S, Brix K, Bieber T
and Kraft S: Evidence for a differential expression of the
FcepsilonRIgamma chain in dendritic cells of atopic and nonatopic
donors. J Clin Invest. 111:1047–1056. 2003. View Article : Google Scholar : PubMed/NCBI
|
|
38
|
Liang Y, Wang P, Zhao M, Liang G, Yin H,
Zhang G, Wen H and Lu Q: Demethylation of the FCER1G promoter leads
to FcεRI overexpression on monocytes of patients with atopic
dermatitis. Allergy. 67:424–430. 2012. View Article : Google Scholar : PubMed/NCBI
|
|
39
|
Ellis L, Atadja PW and Johnstone RW:
Epigenetics in cancer: Targeting chromatin modifications. Mol
Cancer Ther. 8:1409–1420. 2009. View Article : Google Scholar : PubMed/NCBI
|
|
40
|
Reseland JE, Syversen U, Bakke I, Qvigstad
G, Eide LG, Hjertner O, Gordeladze JO and Drevon CA: Leptin is
expressed in and secreted from primary cultures of human
osteoblasts and promotes bone mineralization. J Bone Miner Res.
16:1426–1433. 2001. View Article : Google Scholar : PubMed/NCBI
|
|
41
|
Burguera B, Brunetto A, Garcia-Ocana A,
Teijeiro R, Esplen J, Thomas T, Couce ME and Zhao A: Leptin
increases proliferation of human steosarcoma cells through
activation of PI(3)-K and MAPK pathways. Med Sci Monit.
12:BR341–BR349. 2006.PubMed/NCBI
|
|
42
|
Tronick SR, Popescu NC, Cheah MS, Swan DC,
Amsbaugh SC, Lengel CR, DiPaolo JA and Robbins KC: Isolation and
chromosomal localization of the human fgr protooncogene, a distinct
member of the tyrosine kinase gene family. Proc Natl Acad Sci USA.
82:6595–6599. 1985. View Article : Google Scholar : PubMed/NCBI
|
|
43
|
Perissinotto E, Cavalloni G, Leone F,
Fonsato V, Mitola S, Grignani G, Surrenti N, Sangiolo D, Bussolino
F, Piacibello W and Aglietta M: Involvement of chemokine receptor
4/stromal cell-derived factor 1 system during osteosarcoma tumor
progression. Clin Cancer Res. 11:490–497. 2005.PubMed/NCBI
|
|
44
|
Pasic I, Shlien A, Durbin AD, Stavropoulos
DJ, Baskin B, Ray PN, Novokmet A and Malkin D: Recurrent focal
copy-number changes and loss of heterozygosity implicate two
noncoding RNAs and one tumor suppressor gene at chromosome 3q13.31
in osteosarcoma. Cancer Res. 70:160–171. 2010. View Article : Google Scholar : PubMed/NCBI
|
|
45
|
Ang BK, Lim CY, Koh SS, Sivakumar N, Taib
S, Lim KB, Ahmed S, Rajagopal G and Ong SH: ArhGAP9, a novel MAP
kinase docking protein, inhibits Erk and p38 activation through WW
domain binding. J Mol Signal. 2:12007. View Article : Google Scholar : PubMed/NCBI
|
|
46
|
Bonito NA, Drechsler J, Stoecker S, Carmo
CR, Seckl MJ, Hermanns HM and Costa-Pereira AP: Control of gp130
expression by the mitogen-activated protein kinase ERK2. Oncogene.
33:2255–2263. 2014. View Article : Google Scholar : PubMed/NCBI
|
|
47
|
Luo Y, Deng Z and Chen J: Pivotal
regulatory network and genes in osteosarcoma. Arch Med Sci.
9:569–575. 2013. View Article : Google Scholar : PubMed/NCBI
|
|
48
|
Endo-Munoz L, Cumming A, Sommerville S,
Dickinson I and Saunders NA: Osteosarcoma is characterised by
reduced expression of markers of osteoclastogenesis and antigen
presentation compared with normal bone. Br J Cancer. 103:73–81.
2010. View Article : Google Scholar : PubMed/NCBI
|
|
49
|
Ciró M, Prosperini E, Quarto M, Grazini U,
Walfridsson J, McBlane F, Nucifero P, Pacchiana G, Capra M,
Christensen J and Helin K: ATAD2 is a novel cofactor for MYC,
overexpressed and amplified in aggressive tumors. Cancer Res.
69:8491–8498. 2009. View Article : Google Scholar : PubMed/NCBI
|
|
50
|
Swingler TE, Wheeler G, Carmont V, Elliott
HR, Barter MJ, Abu-Elmagd M, Donell ST, Boot-Handford RP,
Hajihosseini MK, Münsterberg A, et al: The expression and function
of microRNAs in chondrogenesis and osteoarthritis. Arthritis Rheum.
64:1909–1919. 2012. View Article : Google Scholar : PubMed/NCBI
|
|
51
|
Fellenberg J, Bernd L, Delling G, Witte D
and Zahlten-Hinguranage A: Prognostic significance of
drug-regulated genes in high-grade osteosarcoma. Mod Pathol.
20:1085–1094. 2007. View Article : Google Scholar : PubMed/NCBI
|
|
52
|
Kyriazoglou AI, Vieira J, Dimitriadis E,
Arnogiannaki N, Teixeira MR and Pandis N: 12q amplification defines
a subtype of extraskeletal osteosarcoma with good prognosis that is
the soft tissue homologue of parosteal osteosarcoma. Cancer Genet.
205:332–336. 2012. View Article : Google Scholar : PubMed/NCBI
|
|
53
|
Mejia-Guerrero S, Quejada M, Gokgoz N,
Gill M, Parkes RK, Wunder JS and Andrulis IL: Characterization of
the 12q15 MDM2 and 12q13-14 CDK4 amplicons and clinical
correlations in osteosarcoma. Genes Chromosomes Cancer. 49:518–525.
2010.PubMed/NCBI
|
|
54
|
Finn RS, Crown JP, Lang I, Boer K,
Bondarenko IM, Kulyk SO, Ettl J, Patel R, Pinter T, Schmidt M, et
al: Abstract S1-6: Results of a randomized phase 2 study of PD
0332991, a cyclin-dependent kinase (CDK) 4/6 inhibitor, in
combination with letrozole vs. letrozole alone for first-line
treatment of ER+/HER2-advanced breast cancer (BC). Cancer Res.
72:(24 Suppl). S1–S6. 2012. View Article : Google Scholar
|