Introduction
According to the stem cell theory of cancer, a small
number of tumors cells present in primary tumors and act as stem
cells with unlimited proliferative potential; these cells have a
crucial role in driving tumor formation, growth, relapse and
metastasis (1). Normal somatic stem
cells are naturally resistant to chemotherapeutic agents, as these
cells can pump out drugs through various multidrug resistance (MDR)
pumps and have a slow rate of cell turnover (chemotherapeutic
agents target rapidly replicating cells) (2).
Cancer stem cells (CSCs), which derive from normal
stem cells, also produce MDR proteins and therefore increase their
resistance towards chemotherapeutic agents (3). The CSCs that resist chemotherapy survive
and subsequently repopulate the cancerous area; consequently, this
causes a relapse. Therapies that selectively target CSCs enable the
treatment of patients with non-resectable aggressive tumors and may
therefore prevent metastases (3). It
has been suggested that when CSCs are eliminated, complete tumor
regression can be achieved with residual cells, which display a
differentiated phenotype and are susceptible to apoptosis (1). Therefore, CSCs-targeted therapy has been
proposed to be a promising cancer treatment approach, particularly
for certain types of cancer cases that occur in the uterus and
cervix.
Cancer stem cells from acute myeloid leukemia
(4), breast cancer (5), glioma (6)
and a number of other types of tumors have been successfully
isolated using cancer specific cell surface markers. However, due
to the lack of specific surface markers, CSCs have not been
isolated from many other types of cancer, particularly from solid
tumors including cervical cancer. In 1996, Goodell et al
(7) identified a subset of cells with
low Hoechst 33342 staining from murine bone marrow. It was
demonstrated that these cells exhibit hematopoietic stem cell
features and were able to be identified as a side population (SP)
in flow cytometric assays. Since then, SP cell sorting has been
used to isolate stem cells from tissues without the need for
specific stem cell surface markers. For example, Kondo et al
(8) isolated SP cells from the C6
tumor cell line and confirmed the multi-differentiation potencies
and the tumorigenicity of these SP cells. This suggests that SP
cell sorting may be applied to the isolation of CSCs from cancer
cell lines. Additionally, Patrawala et al (9) provided evidence for the presence of SP
cells in 9/30 tumors cell lines, including cell lines established
from melanoma and prostate, breast, colon, glioma, bladder,
ovarian, cervical and nasopharyngeal cancer. The percentage of SP
cells in these cell lines ranged between 0.04 and 0.2% of the
overall cell population. These results indicated that SP cells only
accounted for a small proportion of the total cell population and
may only be detected in a number of human tumor cell lines.
Additionally, two studies have reported the presence of ~1% SP
cells in the HeLa cell line (10,11).
To the best of our knowledge, the isolation and
characterization of SP cells from primary cervical cancer cell
cultures has not been reported. However, these well-established
cell lines may have gone through extensive genomic changes and
therefore may not represent in vivo tissues as closely as
primary cell cultures. In the present study, SP cells were
successfully isolated from a primary cervical cancer cell culture.
In vitro and in vivo assays validated the stem cell
features of these SP cells.
Materials and methods
Ethics
The present study was conducted in accordance with
international guidelines and approved by the Ethics Committee of
The First Hospital of Jilin University (Changchun, China). Written
informed consent was obtained from the patients. All efforts were
made to minimize suffering by conducting procedures according to
Animal Care Guidelines. The animal experiment was approved by the
Ethics Committee of The First Hospital of Jilin University
(Changchun, China).
Establishment of primary cervical
cancer cell culture
Between December 2011 and June 2012, the surgical
specimens were collected from 10 female patients with cervical
squamous cell carcinoma at stage IB2 according to the staging
system established by the International Federation of Gynecology
and Obstetrics in 2009 (12). The age
of patients ranged from 43–51 years. All patients were HPV positive
and did not undergo preoperative chemotherapy. Primary cells,
derived from 1 patient, were successfully cultured by explant
culture method. Purified cervical cancer cells were harvested
following repeated cycles of attachment and mechanical curettage
that gradually leads to the elimination of fibroblasts. Cells were
maintained in Dulbecco's modified Eagle's medium (DMEM),
supplemented with 10% fetal bovine serum (FBS) (Gibco; Thermo
Fisher Scientific, Inc., Waltham, MA, USA). Half of the culture
medium was changed every 3–4 days until the cells grew to 80%
confluence at which stage the culture was split for the first
passage. Following 10 passages, the cells were split every 6–8 days
(at a ratio of 1:3) by trypsinization. The nucleus-to-cytoplasm
ratio was determined by the following equation: The
nucleus-to-cytoplasm ratio = (The diameter of nucleus/The width of
cytosol) ×100%.
Animals
A total of 5 5-week-old female BALB/C nude mice
(weighing 16–20 g) and 15 5-week-old female non-obese
diabetic/severe combined immunodeficiency (NOD/SCID) mice (weighing
16–20 g) were purchased from Vital River Laboratories, Co., Ltd.
(Beijing, China). Animals were housed in a sterilized room with 12
h light/dark cycle, at a temperature of 22°C with 40–60% humidity.
Food and water were provided ad libitum.
Tumorigenicity assay for primary
cervical cancer cells
The primary cancer cells in the exponential growth
phase at passage 10 were harvested by trypsinization. The cells
(1×10⁶) were resuspended in a mixture of (200 µl)
DMEM/F12 (Gibco; Thermo Fisher Scientific, Inc.) and Matrigel
(Sigma-Aldrich; Merck KGaA, Darmstadt, Germany) with a ratio of
1:1. The cells were subsequently subcutaneously inoculated into
female BALB/C nude mice purchased from Vital River Laboratories,
Co., Ltd. (Beijing, China). The mice were examined daily, and the
time points of tumor appearance were recorded.
Sample preparation and histological
analysis
Mice were sacrificed 8 weeks following inoculation,
and the tumor tissues were collected, weighed and fixed in 10%
formalin for 3 days at room temperature. The tissues were sectioned
into 3 mm thickness. Sections were stained with hematoxylin for 5
min at room temperature. Subsequent to washing with tap water,
samples were stained with 0.5% eosin for 3 min at room temperature.
After washing with tap water, samples were examined under phase
contrast microscope (IX50; Olympus Corporation, Tokyo, Japan) for
histological analysis.
Immunohistochemical analysis of
transplantation tumors
Transplanted cervical carcinoma derived from nude
mice were fixed in 10% formalin for 3 days at room temperature. The
tissues were sliced into 3 mm-thick sections. Samples were
deparaffinized in xylene and dehydrated in an ethanol series,
followed by washing three times with PBS for 5 min. Samples were
then exposed to heating in citrate buffer and the peroxidase was
blocked for 15 min at room temperature. Subsequent to blocking in
nonimmunone animal serum (Maxim Biotech, Inc., Rockville, MD, USA)
for 30 min at room temperature, samples were stained with the
cervical cancer-specific antibody p63 (EPR5701; catalog no.,
ab124762; Abcam, Cambridge, MA, USA; dilution, 1:100) at 4°C
overnight. Subsequent to washing, samples were stained with
biotin-conjugated secondary antibody (cat. no., KIT-9730; dilution,
ready to use) for 30 min at room temperature, followed by 30 min
incubation at room temperature with streptavidin-peroxidase using
the UltraSensitive S-P kit according to the manufacturer's protocol
(Maxim Biotech, Inc.). Immunostaining was visualized by DAB reagent
(Maxim Biotech, Inc.). The nuclei were stained with hematoxylin and
samples were visualized under phase contrast microscope at
magnification, ×40 (IX50; Olympus Corporation, Tokyo, Japan). A
total of five non-overlapped fields were randomly selected and
images were analyzed by Image-Pro Plus 6.0 software (Media
Cybernetics, Inc., Rockville, MD, USA).
Detection, sorting, and culture from
primary cervical cancer cells by fluorescence-activated cell
sorting (FACS)
The primary cervical cancer cells in the exponential
growth phase were harvested and re-suspended in warm DMEM
containing 2% flow cytometry staining buffer (CycleTEST™ PLUS DNA
Reagent kit; BD Biosciences) at a density of 1×10⁶
cells/ml. The cell suspensions were stained with Hoechst 33342 (5
µg/ml) in the presence or absence of verapamil (ABC transporter
blocker, 50 µmol/l; Sigma-Aldrich; Merck KGaA) at 37°C for 90 min
with intermittent mixing. Following incubation, the cells were
washed once and re-suspended in ice-cold PBS containing 2% FBS (2%
FBS/PBS) (Gibco; Thermo Fisher Scientific, Inc., Waltham, MA, USA)
and 2 mM 4-(2-hydroxyethyl)-1-piperazineethanesulphonic acid
buffer. Following centrifugation at 380 × g for 6 min at 4°C,
supernatant was removed, and samples were washed and resuspended
with 2% FBS/PBS. Prior to analysis and sorting by flow cytometry
using FACS Influx (BD Biosciences, Franklin Lakes, NJ, USA), the
cells were filtered through a filter (pore size, 37-µm) and stained
with propidium iodide (PI, 2 µg/ml) for 15 min to determine cell
viability. Cells were rinsed with 2% FBS/PBS. Sorted SP and non-SP
(NSP) cells (1×10⁴ cells/ml), both of which were the two
main types of cells isolated by the flow cytometry, were suspended
in DMEM/F12 culture medium containing 10% FBS, 20 ng/ml hepatocyte
growth factor (Sigma-Aldrich; Merck KGaA), 5 µg/ml insulin
(Sigma-Aldrich; Merck KGaA), 10,00,000 U/l penicillin and
streptomycin, and seeded at a density of 1×10⁴ cells/ml.
The cultures were passaged after 3 days and harvested following a
further 3 days in culture followed by flow cytometric analysis to
detect the ratio of SP and NSP cells. BD FACSDiva version 6.1.1
software (BD Biosciences, Franklin Lakes, NJ, USA) was used for
analysis.
Cell cycle analysis
Cell cycle analysis was performed using a cell cycle
detection kit (Nanjing KeyGen Biotech Co., Ltd., Nanjing, China)
according to the manufacturer's protocol. Briefly, the cells were
washed with PBS once and centrifuged at 376 g at 4°C for 5 min. The
cells (1×10⁶ cells/ml) were fixed overnight in 70%
ethanol at 4°C followed by washes with PBS. The cells were treated
with 500 µl PBS containing 50 µg/ml PI, 100 µg/ml RNase A and 0.2%
Triton X-100 at 4°C for 30 min in dark. The stained cells were
loaded on a BD Influx cell sorter (BD Biosciences) and the cell
cycle was analyzed by BD FACSDiva version 6.1.1 software (BD
Biosciences).
Analysis of in vitro clonogenic
capacity by soft agar assay
The sorted SP and NSP cells were seeded at a density
of 100 cells/well in 24-well plates with soft agar. The upper agar
layer consisted of 0.35% agarose in DMEM supplemented with 10% FBS,
and the base layer was made up of 0.6% agarose. A total of 500 µl
fresh medium was added to the cells twice a week. After 3 weeks of
culture at 37°C, the colonies were stained with 0.5 ml 0.005%
crystal violet for 1 h. Colonies were examined under phase contrast
microscopy (IX50; Olympus Corporation, Tokyo, Japan). Colonies with
a diameter >75 µm or containing >50 cells were counted. The
colony formation rate was calculated as follows: Colony formation
rate (%)=number of colonies/number of seeded cells ×100.
Experiments were conducted in triplicate.
Tumorigenicity assay for SP and NSP
cells
The sorted SP and NSP cells were washed twice in
PBS. A total of 1×10³, 1×10⁴ and
1×10⁵ SP and NSP cells were resuspended in a mixture of
DMEM/F12 (total volume, 200 µl; ratio, 1:1) and Matrigel. NOD-SCID
mice were assigned into three groups (n=5 for each group) and
received subcutaneous injection of different number of cells. The
SP cells were injected into the right forelimb, and NSP cells were
injected into the left forelimb. The mice were examined daily, and
the time points at which tumors appeared were recorded. The tumor
formation rate was determined by the following equation: The tumor
formation rate=(The number of animals developed tumor/The overall
number of animals inoculated with tumor cells) ×100%. The mice were
sacrificed 12 weeks following inoculation and, the tumor tissues
were collected, weighed, fixed in 10% formalin for 3 days at room
temperature and sectioned (3-µm thick). Subsequently, hematoxylin
and eosin staining and histological analysis were performed.
For hematoxylin and eosin staining, the paraffin
sections were stained with alum haematoxylin, rinsed in running tap
water, differentiated with 0.3% acid alcohol and subsequently
rinsed in running tap water. The sections were stained with eosin
for 2 min, dehydrated, cleaned and mounted.
RNA preparation and reverse
transcription quantitative polymerase chain reaction (RT-qPCR)
analysis
Total RNA was extracted with RNeasy Mini kit (Qiagen
GmbH, Hilden, Germany) according to the manufacturer's protocol.
cDNA synthesis was performed with 500 ng RNA using First-Strand
cDNA Synthesis Supermix (TransGen, Beijing, China). Negative
controls were included, using distilled water instead of samples.
qPCR was performed using FastStart Universal SYBR Green Master
(Rox) kit (Roche Diagnostics GmbH, Mannheim, Germany) and run on a
StepOnePlus Real-Time PCR system (Applied Biosystems; Thermo Fisher
Scientific, Inc., Waltham, MA, USA). The specific primer sequences
for the human ABCG2 gene and an endogenous control β-actin
are as follows: ABCG2 forward, 5′-TTCGGCTTGCAACAACTATG-3′ and
reverse, 5′-TCCAGACACACCACGGATAA-3′; β-actin forward,
5′-ATGGTGGGTATGGGTCAGAA-3′ and reverse, 5′-CGGAGCTCGTTGTAGAAGGT-3′.
The PCR reactions included pre-incubation at 95°C for 5 min and 45
cycles of denaturation at 95°C for 15 sec, annealing at 60°C for 45
sec and extension at 72°C for 30 sec. Data were calculated and
normalized to the reference gene β-actin using the
2−∆∆Cq method (13).
Experiments were conducted in triplicate.
Statistical analyses
The SPSS software (version 18.0; SPSS, Inc.,
Chicago, IL, USA) was used for statistical analysis, and the
differences between groups were assessed by unpaired t-test.
P<0.05 was considered to indicate a statistically significant
difference.
Results
Establishment of primary cervical
cancer cell culture and tumorigenicity assay for the primary
cells
Primary cultures were initiated from multiple
cervical tissue specimens of G3 squamous cell carcinomas by explant
culture method. One primary culture was successfully established
from a poorly differentiated squamous carcinoma. The growth of the
primary cells was slow at the early stages. The cultured cells
reached 80% confluence in 8–10 days and 100% confluence in 10–15
days. Initially, the primary cultures were sub-cultured at 8–10
days. Following 8 passages, the cells appeared to be bigger and
grew actively with a passaging duration of 6–7 days. Thereafter,
these cultured primary cells maintained stable features through
subsequent passages although variable cell size and morphology
including polygonal, oval and mosaic-like cell appearance was
observed. These cells exhibited features including multi-layer
growth, nuclear atypia, large nucleus-to-cytoplasm ratio in the
majority of cells, strong nuclear staining and prominent
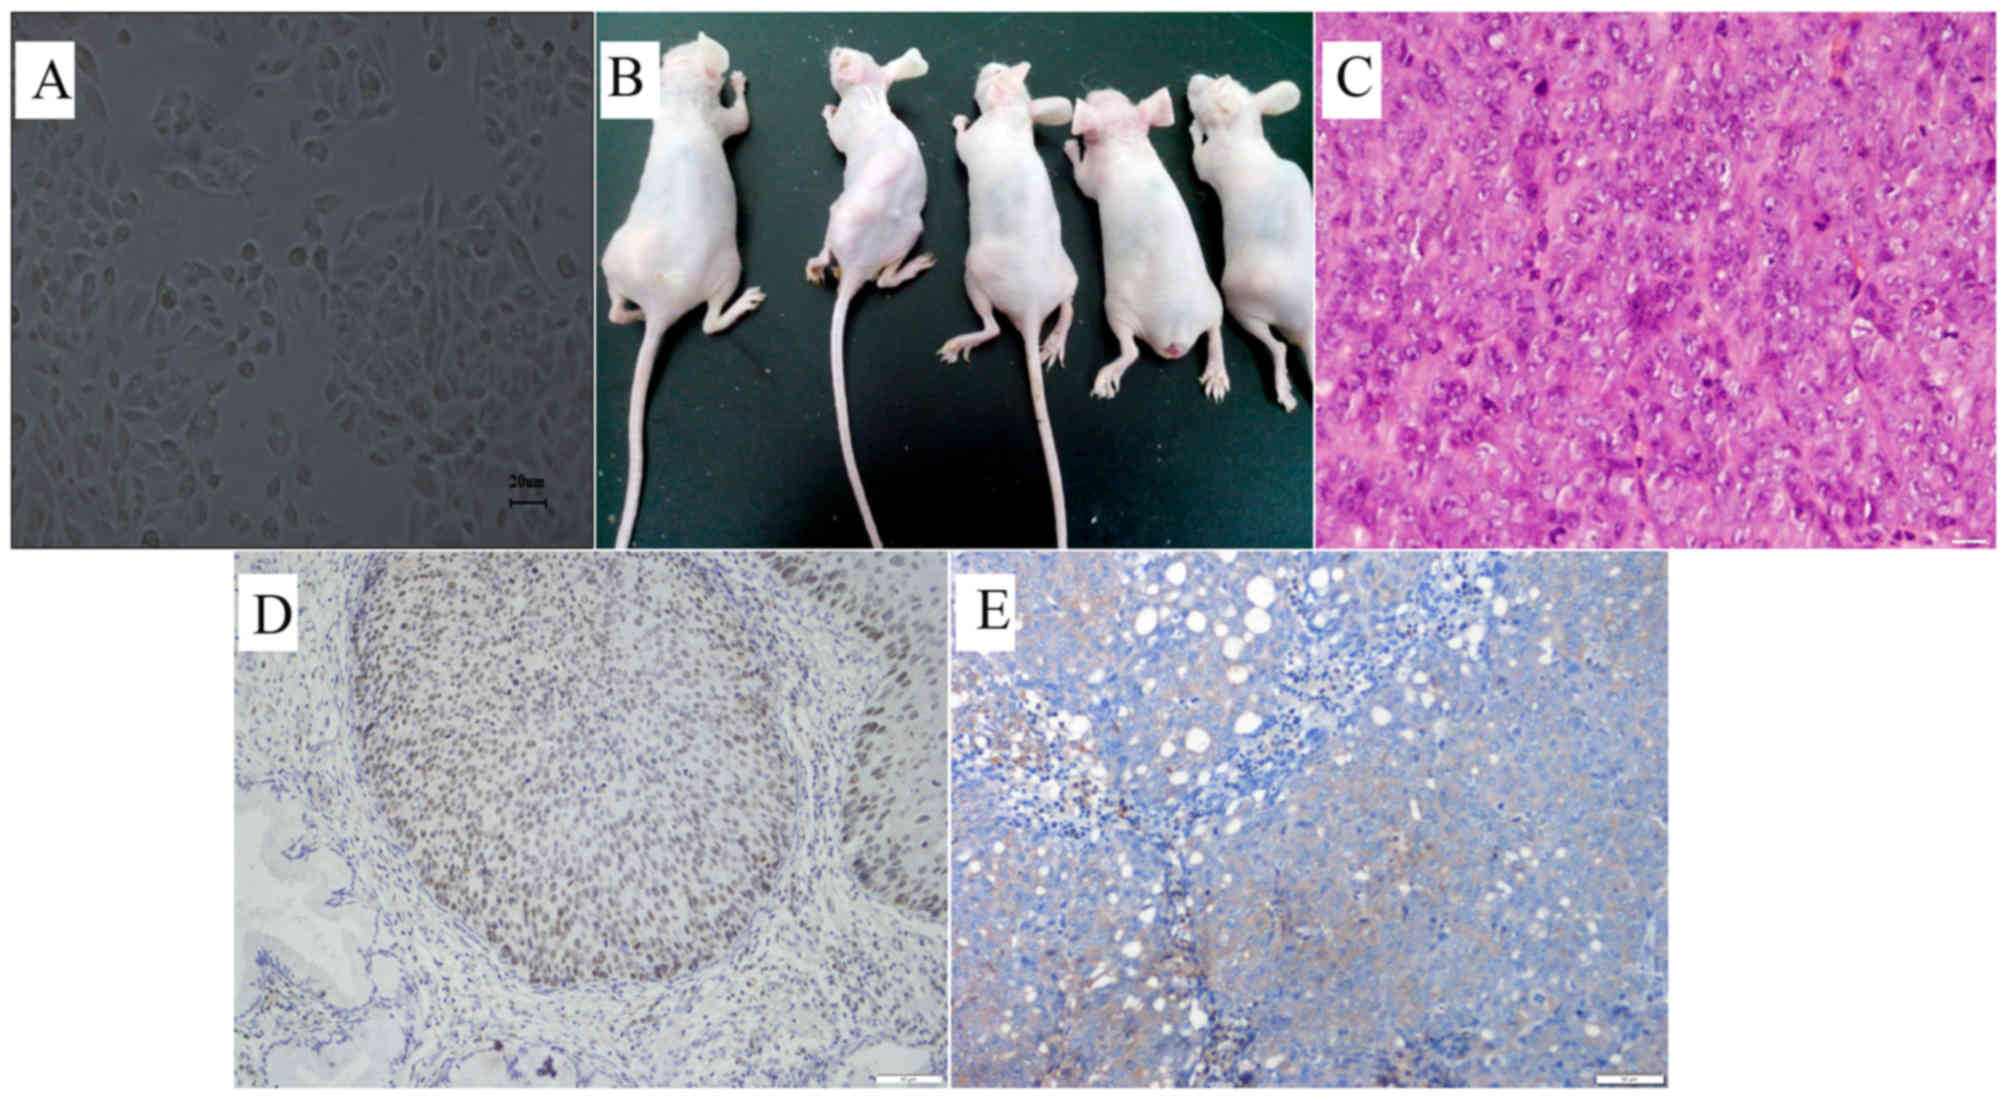
pathological mitosis (Fig. 1A).
Tumorigenicity assay indicated that lumps with a mean diameter of 4
mm were observed at injection sites in nude mice (n=5) 6 to 7 days
following subcutaneous inoculation of 1×10⁶ primary
cancer cells at passage 10. The lumps gradually increased in size
with time. The mice were sacrificed 8 weeks following inoculation,
and the mean weight of the tumors was 16.54 g (Fig. 1B, Table
I). Hematoxylin and eosin staining indicated that the tumors
are poorly differentiated squamous-cell carcinomas, which is
consistent with the cell pathology of the tumors from the original
patients (Fig. 1C). Similar to
primary tumors, these tumors also expressed the cervical cancer
specific marker, p63 (Fig. 1D and
E).
 | Table I.Cervical cancer tumor formation. |
Table I.
Cervical cancer tumor formation.
| Mouse no.
(n=5) | Tumor size, length
× width (cm) | Tumor weight
(g) |
|---|
| 1 | 4.1×2.9 | 17.2 |
| 2 | 4.7×2.8 | 18.3 |
| 3 | 3.9×3.3 | 15.1 |
| 4 | 3.5×2.7 | 15.2 |
| 5 | 4.7×2.5 | 16.9 |
Proportion of SP cells in primary
cervical cancer cell culture
Primary cancer cells at passage 10 were stained with
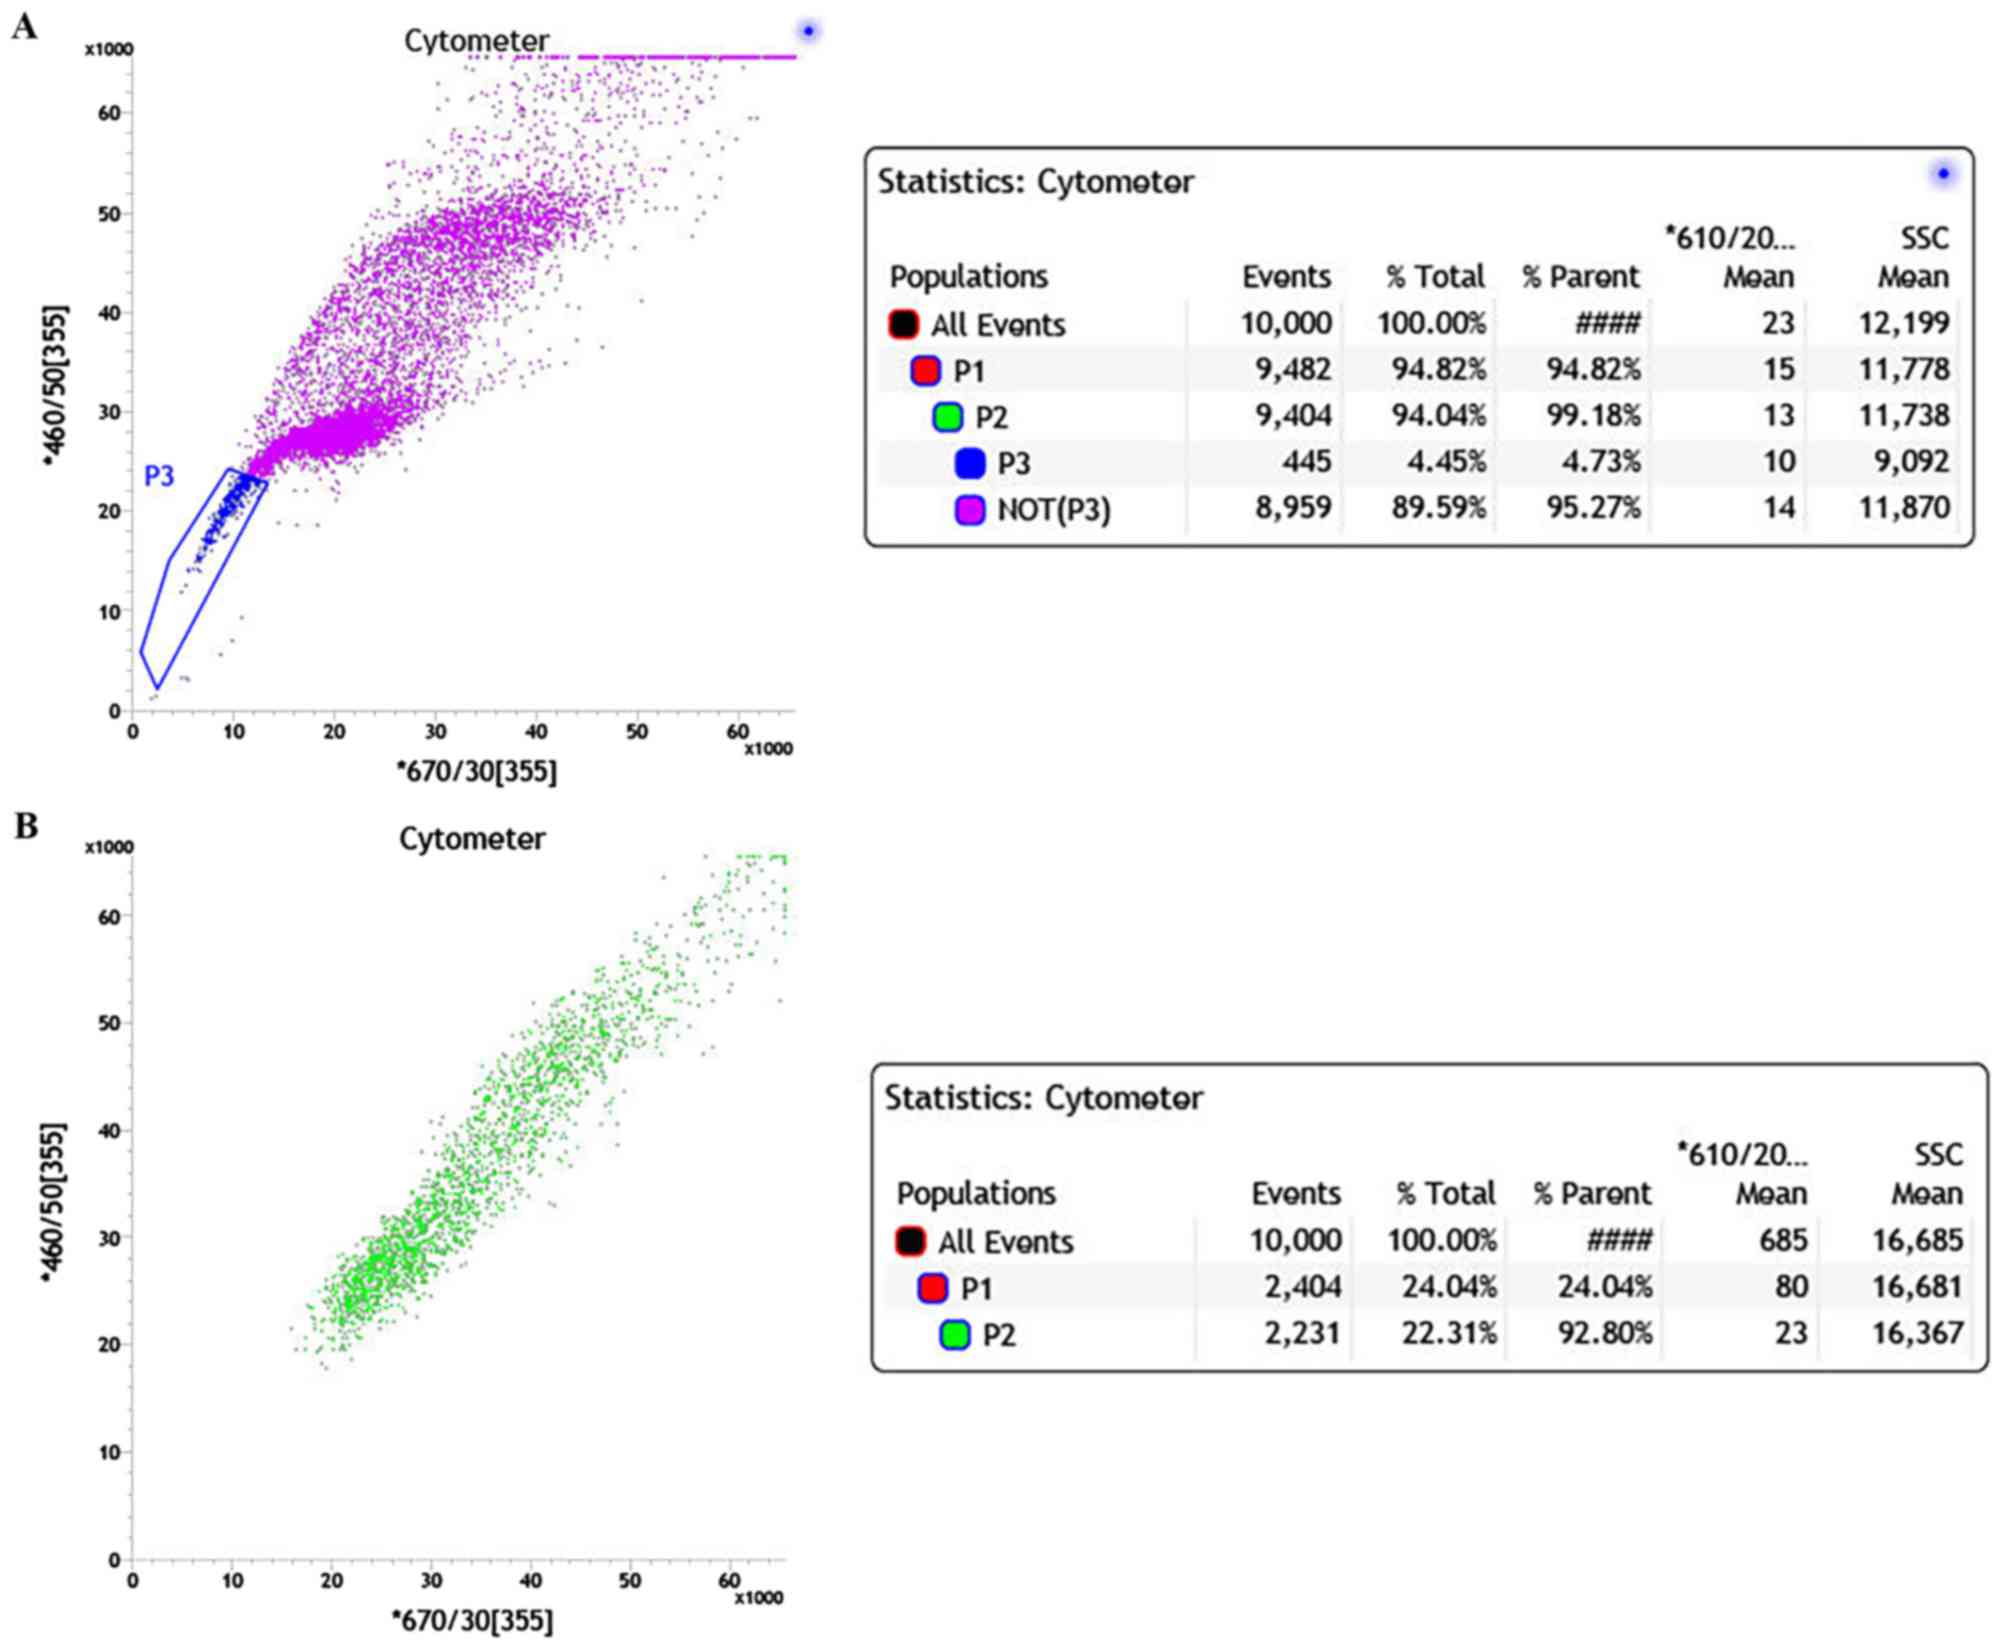
Hoechst 33342 and analyzed by FACS. The two-dimensional dot plot is
shown in Fig. 2 with Hoechst red
fluorescence plotted on the x-axis and Hoechst blue fluorescence
plotted on the y-axis. The majority of cells were positively
stained and gathered in the central and upper right area of the
plot (Fig. 2A). In the non-verapamil
treated group, a small portion of cells with low Hoechst staining
gathered in the lower left corner of the plot (blue), which
represented the SP cells. The SP cells show increased efflux of
Hoechst 33342 compared with NSP. The proportion of SP cells in the
primary cervical cancer culture was 4.73%. Therefore, the majority
of the cells that are positive for Hoechst 33342 staining were NSP
cells (Fig. 2A). When the ABC
transporter protein inhibitor verapamil was added, the proportion
of SP cells with low Hoechst staining was markedly decreased
(<1%) due to the block of Hoechst efflux (Fig. 2B). Consequently, the majority of the
cells were clustered in the upper right quadrant of the plot, which
is similar to Fig. 2A.
Cell cycle analyses of SP and NSP
cells
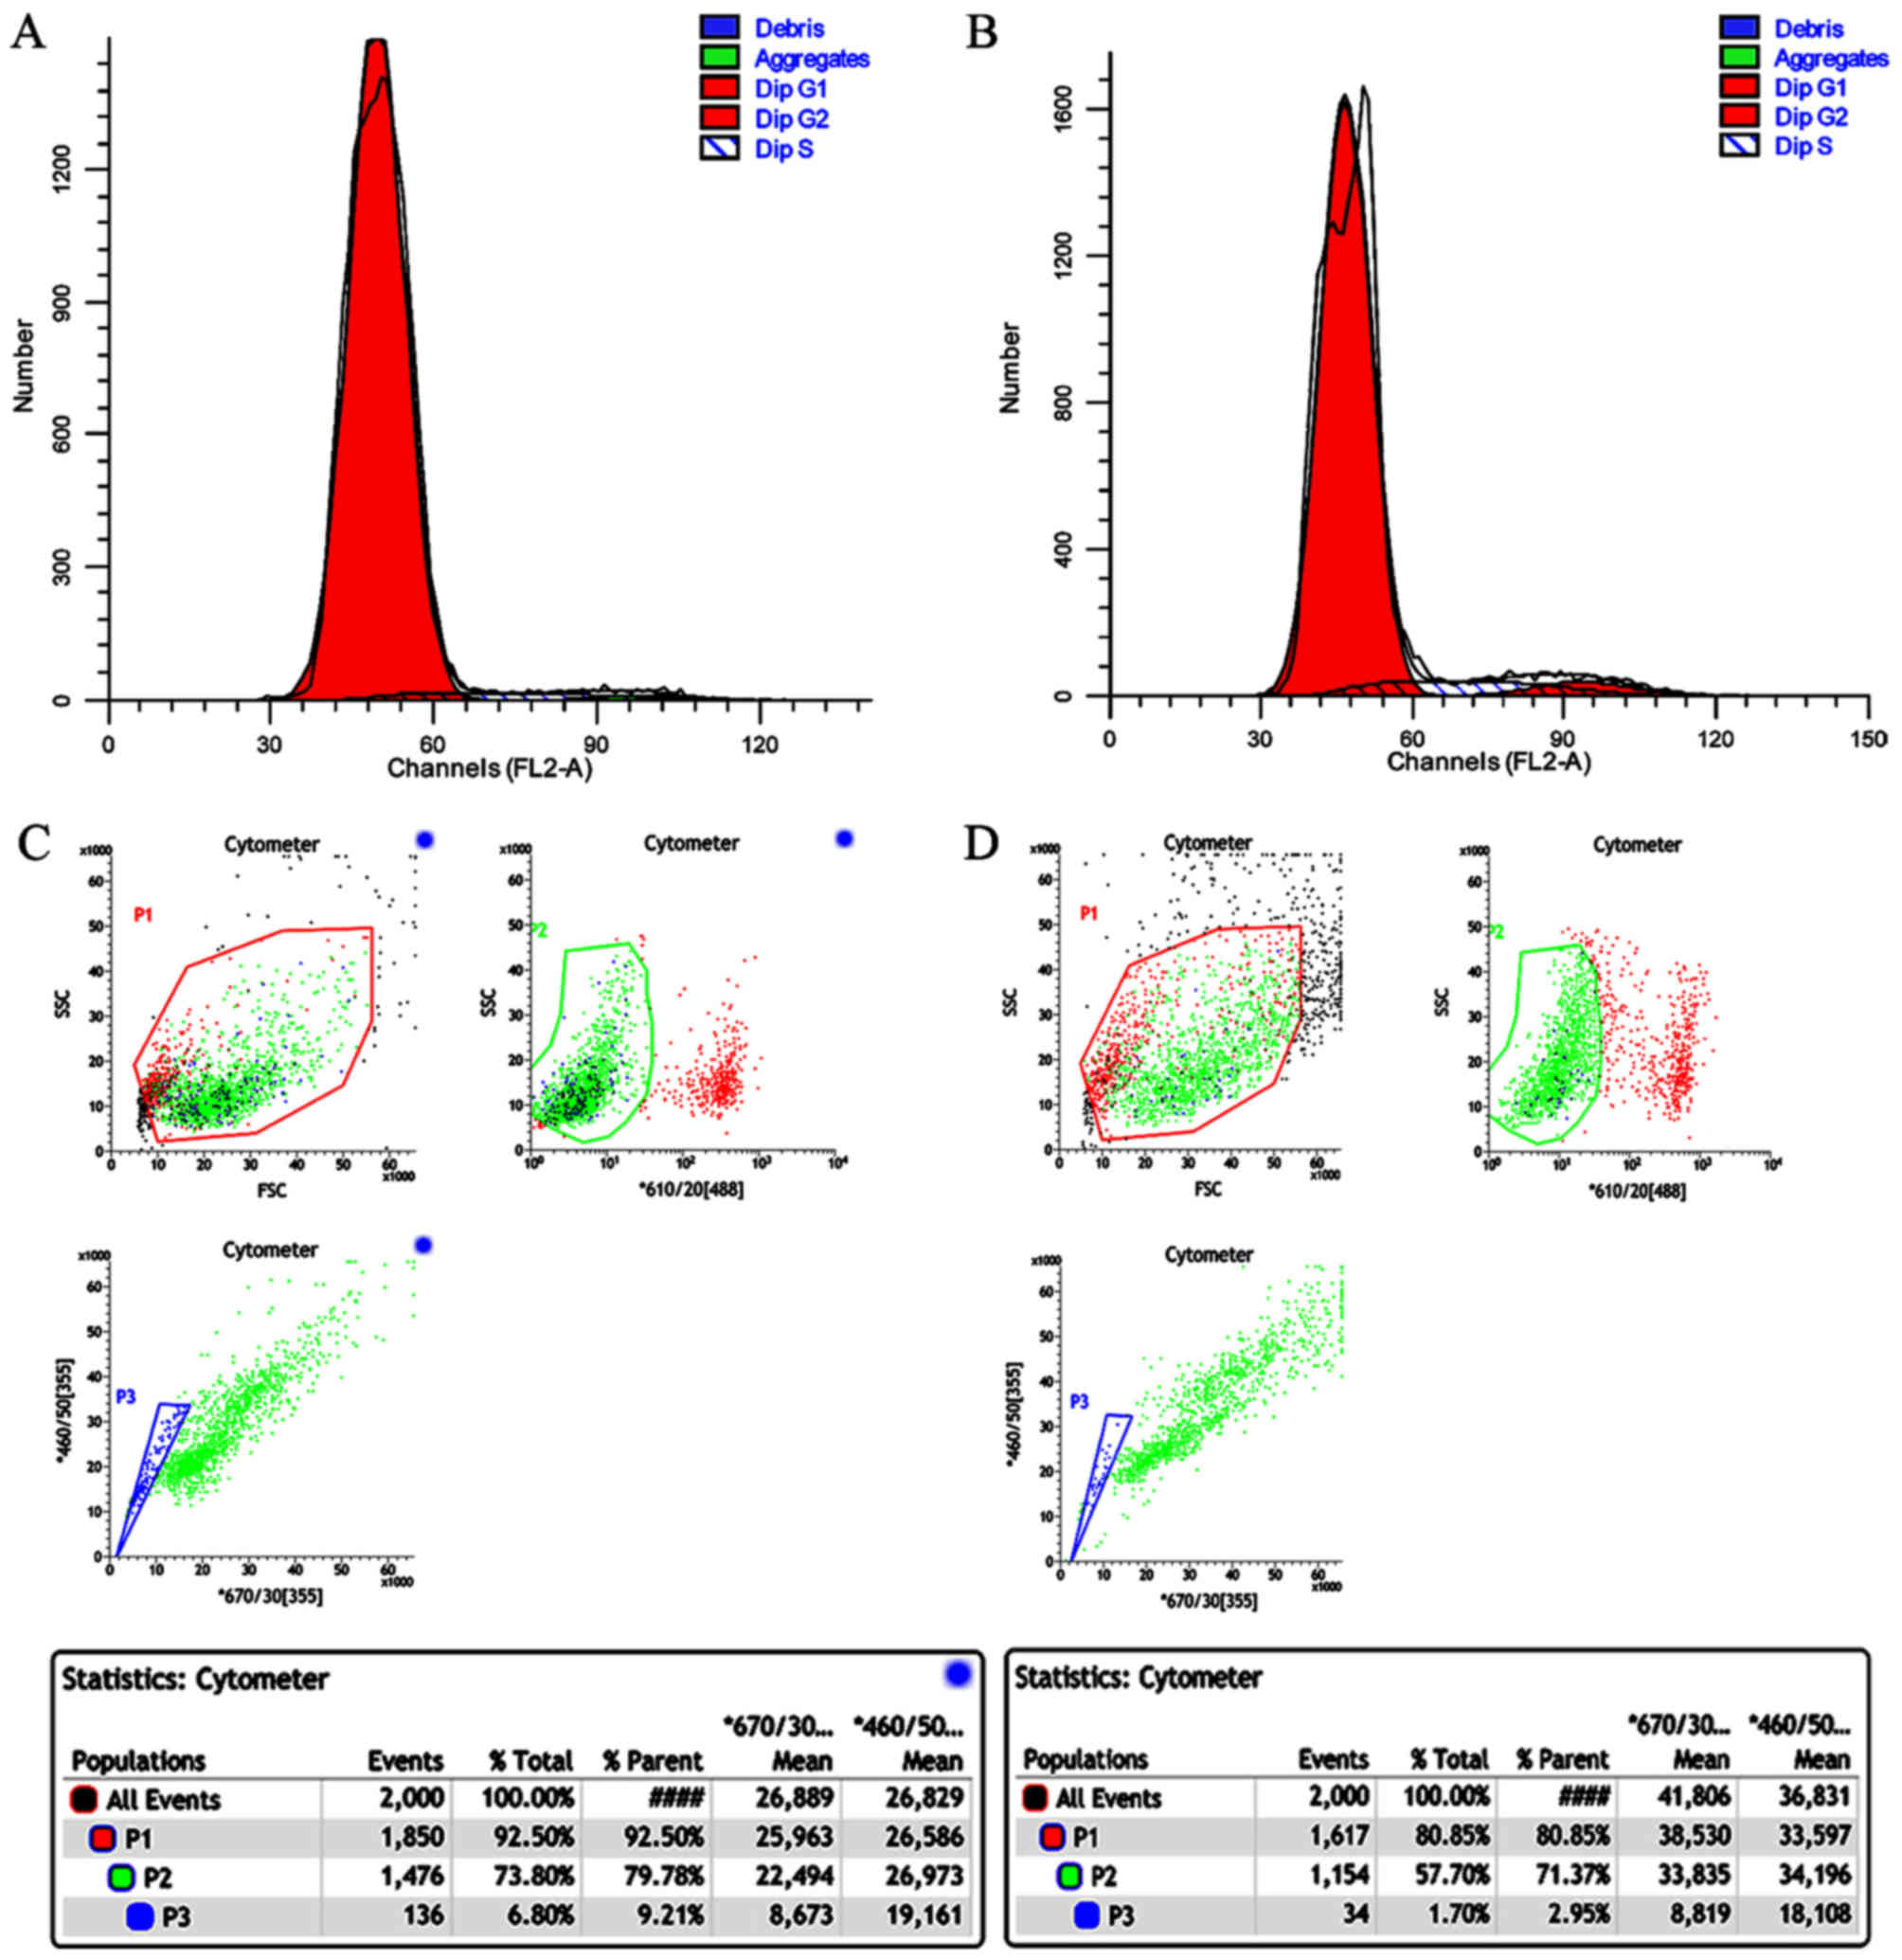
The cell cycle distribution patterns of SP and NSP
cells are shown in Fig. 3A, B and
Table II. 4.17% of the SP cells and
8.32% of the NSP cells were in S phase. 95.65% of the SP cells and
87.43% of the NSP cells were in G1. 0.18% of the SP cells and 4.24%
of the NSP cells were in G1. 0.18% of the SP cells and 4.25% of the
NSP cells were in G2.
| Table II.Cell cycle analysis of primary
cervical cancer cells, SP cells and NSP cells. |
Table II.
Cell cycle analysis of primary
cervical cancer cells, SP cells and NSP cells.
| Groups | G0/G1 (%) | G2 (%) | S (%) | G2 and S (%) |
|---|
| Primary cervical
cancer cell | 68.87 | 19.2 | 11.93 | 31.13 |
| SP | 95.65 | 0.18 | 4.17 | 4.25 |
| NSP | 87.43 | 4.25 | 8.32 | 12.57 |
Proliferation potency and self-renewal
capacity of SP and NSP cells
Flow cytometric analyses revealed that after 6 days
of culture, the proportion of SP cells in the SP cell culture was
6.8 and 1.7% in the NSP cell culture (Fig. 3C and D).
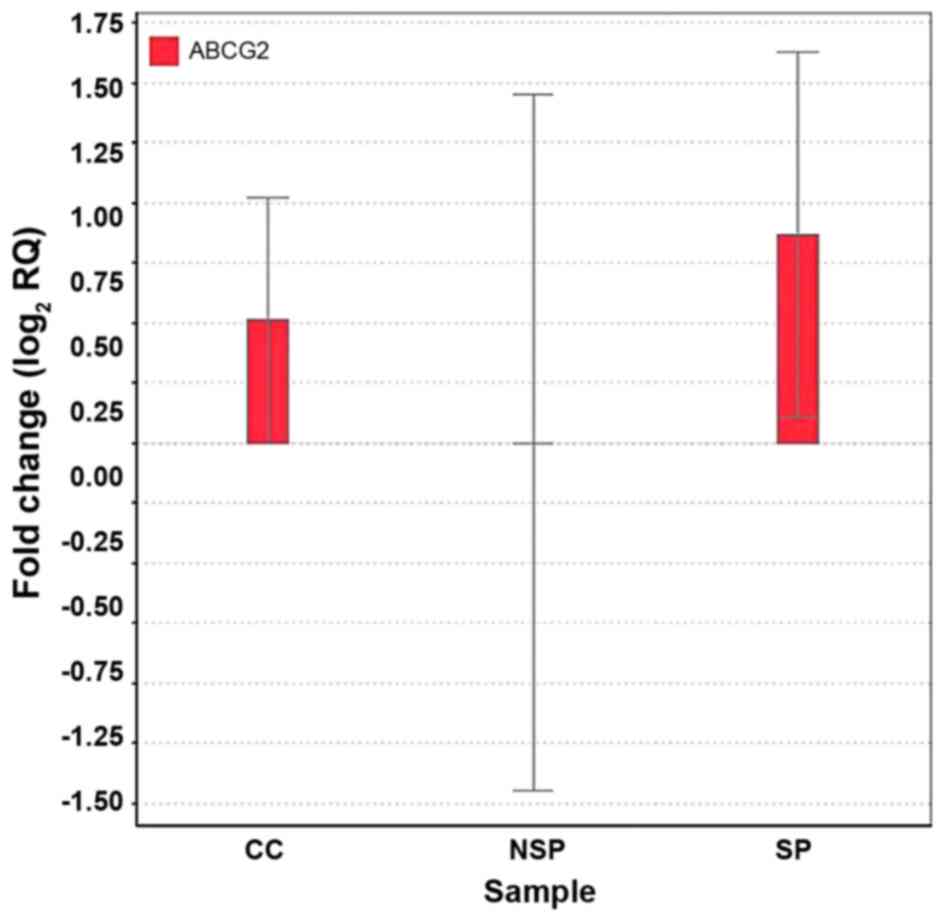
Differential expression of ABCG2 in SP
and NSP cells
ABCG2 encodes an ABC (ATP-binding cassette)
family transporter, which pumps out cytotoxic agents and
fluorescent dyes including Hoechst 33342 from cells (14). Marked expression of ABCG2 was
detected in the SP cells but not in the NSP cells by RT-qPCR
(Fig. 4).
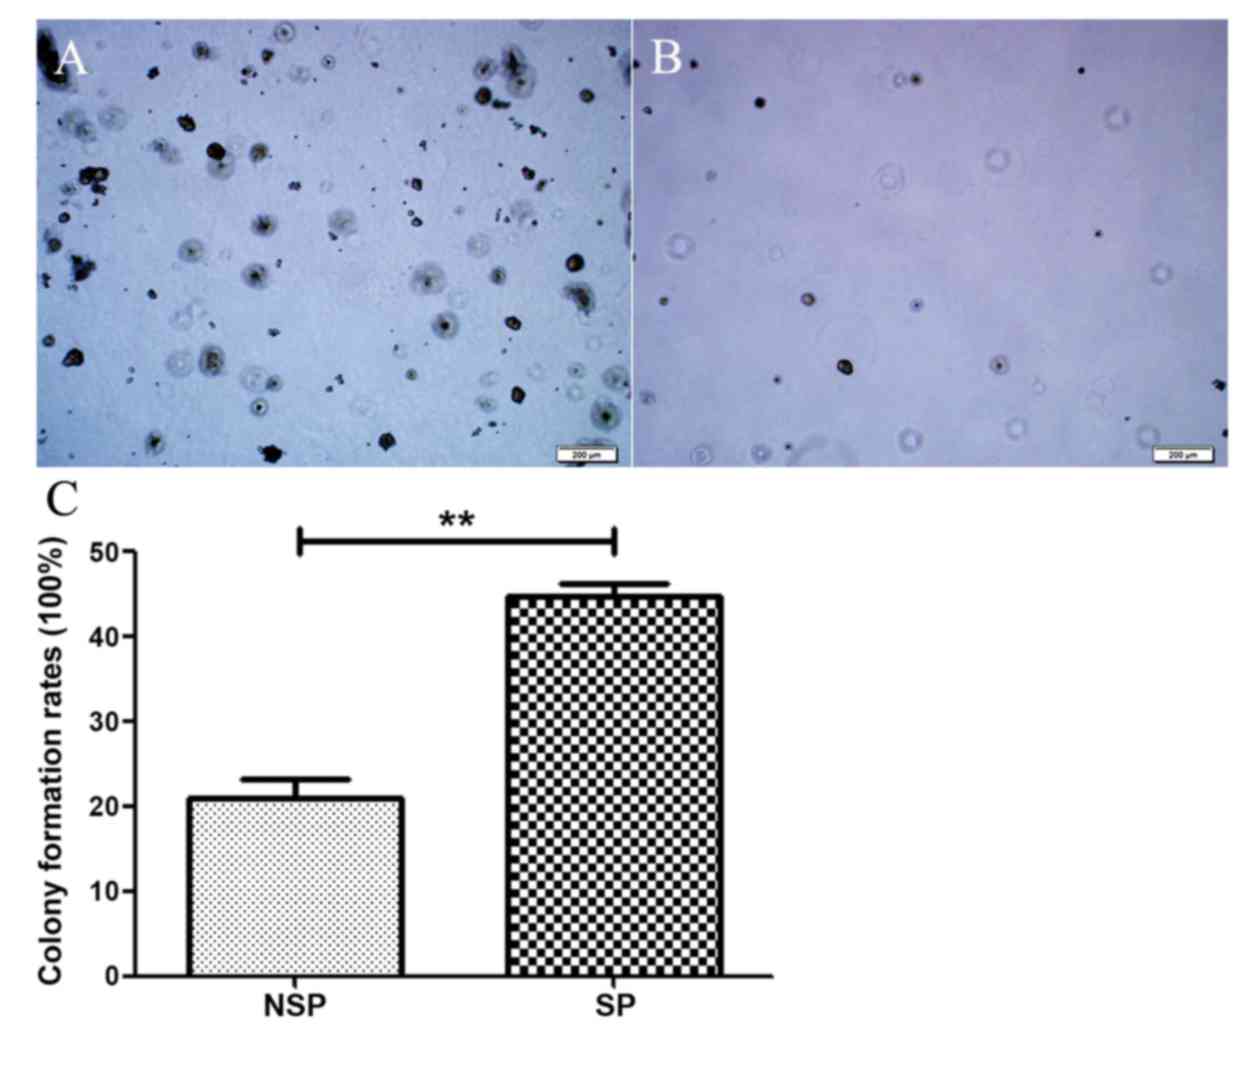
Clonogenic capacity of SP cells and
NSP cells from primary cervical cancer cells
The clonogenic capacity of SP cells and NSP cells
was assessed by soft agar assay with an inoculation density of 100
cells/well. Compared to the NSP cells, the SP cells formed an
increased number of colonies (>50 clones/well) with a greater
number of cells in each colony (>50 cells/clone) (Fig. 5A). The colony formation rate of SP
cells was 60%. By contrast, the NSP cells formed few colonies
(<20 clones/well) with a 20% clone formation rate (Fig. 5B). There was a statistically
significant difference between the clone formation rate of SP cells
and NSP cells (P<0.05).
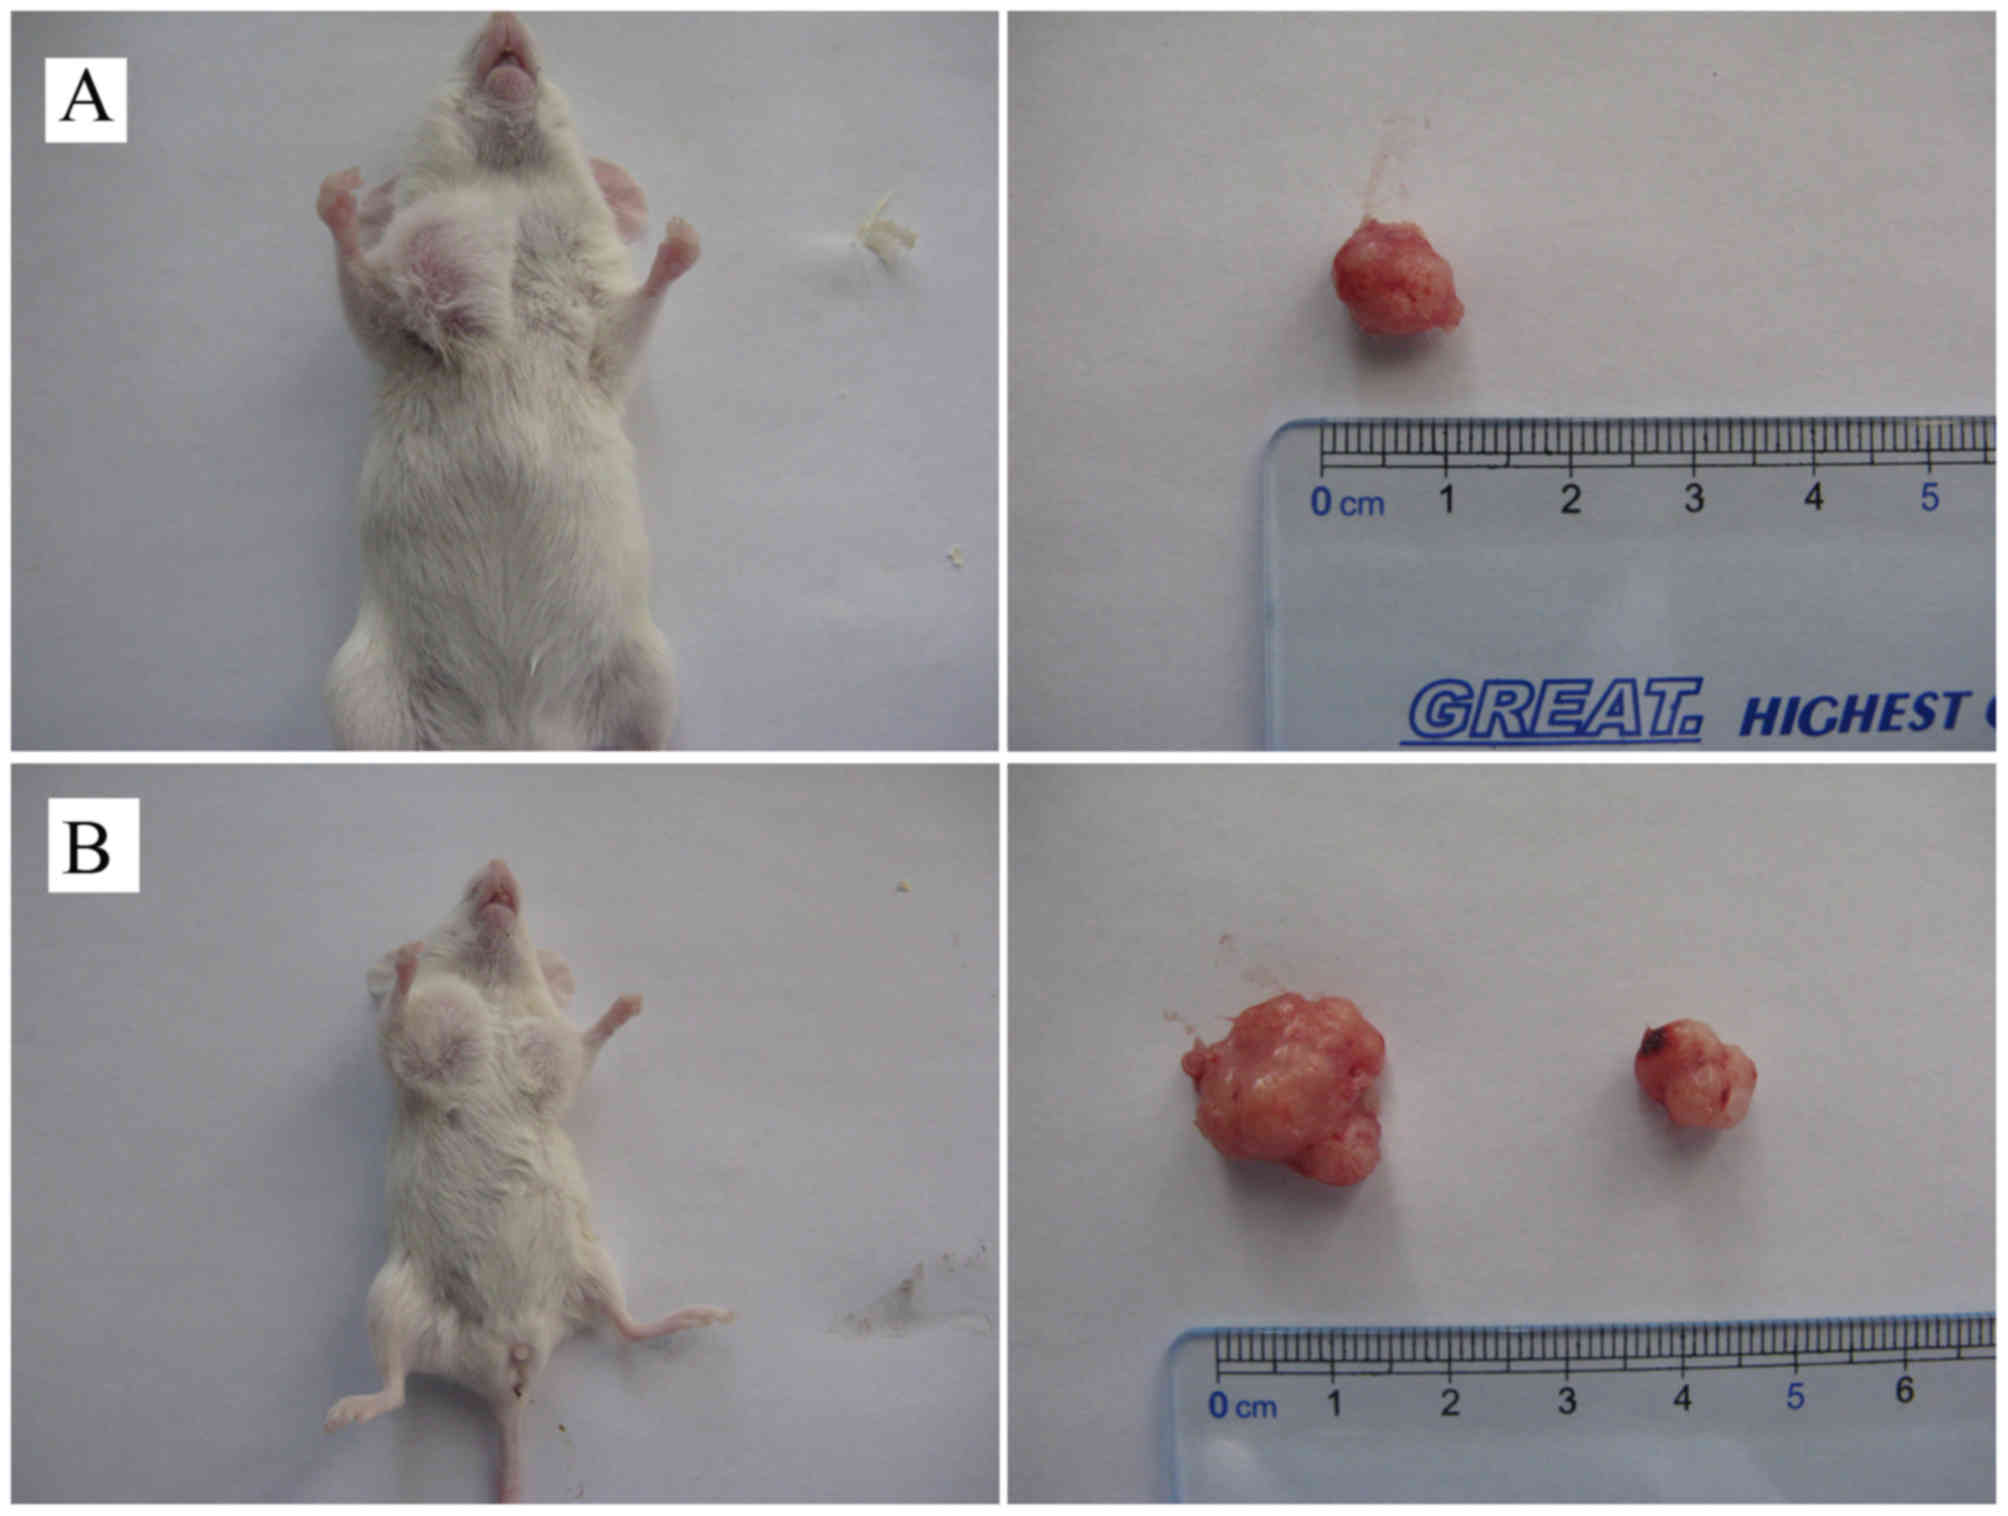
Tumorigenicity of SP and NSP cells
from primary cervical cancer cells
The tumorigenicity of SP and NSP cells was assessed
by subcutaneous inoculation of cells into NOD-SCID mice at
different cell numbers (1×10³, 1×10⁴ and
1×10⁵ cells/mouse). The results show that inoculation of
SP and NSP cells was able to induce transplantable tumors in
NOD-SCID mice, but the tumors formation rates and number of cells
required for tumors formation was significantly different for the
two cell types (Table III). SP
cells were able to induce tumors at all three cell numbers, with a
60% tumor formation rate at the 12th week for inoculation with
1×10³ cells (Fig. 6A). NSP
cells were only able to induce a low rate of tumor formation (20%
at the 12th week) when injected at a high cell number of
1×10⁵ cells (Fig. 6B).
Furthermore, tumor formation of NSP cells occurred markedly later
compared with SP cells. When inoculated with 1×10⁵
cells, tumor nodules appeared at the 4th week for SP cells and the
10th week for NSP cells. The size of tumors generated from SP cells
was markedly greater compared with the size of tumors from NSP
cells (Fig. 6B). These results
suggest that the tumorigenicity of SP cells is >100 times
compared with NSP cells. The tumorigenicity difference, evaluated
based on the number of cells injected and the size of the tumors
formed, between the two cell types was statistically significant
(P<0.05).
| Table III.Tumorigenicity of SP and NSP cells
from primary cervical cancer cells. |
Table III.
Tumorigenicity of SP and NSP cells
from primary cervical cancer cells.
|
| SP | NSP |
|---|
|
|
|
|
|---|
| Parameters |
1×10³ |
1×10⁴ |
1×10⁵ |
1×10³ |
1×10⁴ |
1×10⁵ |
|---|
| Tumor formation
rate | 3/5 | 4/5 | 5/5 | 0/5 | 0/5 | 1/5 |
| Average size
(cm3) | 1.16±0.12 | 1.69±0.17 | 2.13±0.22 | 0 | 0 | 1.81 |
Discussion
Compared with cultured cell lines, the cells
obtained from primary cultures are considered as better
experimental models as these cells undergo fewer biological changes
and more closely resemble the cells within the original in
vivo tissue (15). In the present
study, only one primary culture was successfully established from a
poorly differentiated carcinoma although cultures from multiple
cervical tissue specimens of G3 squamous cell carcinoma were
initiated. This indicates that choosing poorly differentiated
tissues may improve the success rate of primary culture
establishment.
SP cells were first identified by Goodell et
al (7) when the study of whole
bone marrow was conducted using Hoechst 33342 staining. Goodell
et al found that a small proportion of cells that had low or
negative Hoechst 33342 staining. These cells were called side
population because the cells appear in the lower left corner in
FACS dot plots (9–11,16,17). The
SP cells have low Hoechst 33342 staining as they have a stem
cell-like capability to pump out exogenous chemicals including
Hoechst 33342. Furthermore, the majority of SP cells have been
demonstrated to resemble stem cells in many other aspects in
addition to their ability to efflux Hoechst 33342 (18). Side population cells have been
observed in a number of tissues, including umbilical cord blood,
muscle, bone, lung, liver, pancreas, skin, forebrain, testes,
heart, kidney, cornea epithelium edge, prostate, salivary gland and
mammary gland (19–29). The proportion of SP cells is very
small, representing 0.01–5% of the total cells (30,31). One
study reported that SP cells were identified from well-established
cervical cancer cell lines, HeLa and SiHa, but not from Ca Ski and
C-4 I cell lines (32). The
proportion of SP cells was reported to be 1.1 and 0.7% in HeLa and
SiHa, respectively. Two other studies reported the isolation of a
similar proportion of SP cells from the HeLa cell line (10,11).
However, the isolation of SP cells from primary cervical cancer
cell cultures is rarely reported. In the present study, using FACS
with Hoechst 33342 staining, it was demonstrated that SP cells in
primary cervical cancer cells accounted for ~4.73% of total cells.
The number of SP cells markedly decreased to <1% by the addition
of verapamil, which suggests that the majority of SP cells detected
in the present study have a stem cell-like capacity to efflux
exogenous chemicals. To the best of our knowledge, this is the
first report of SP cells isolated from primary cervical cancer cell
cultures which may more closely resemble endogenous tissue compared
with well-established cancer cell lines including HeLa and
SiHa.
Flow cytometric analyses revealed that the
proportion of SP cells is relatively high in the primary cells and
in the SP culture compared with the proportion in the NSP culture
(Figs. 2 and 3). These results suggest that the SP cells
have the potency to differentiate into NSP cells, but the NSP cells
have negligible differentiation potency. These data also indicated
a strong potency for proliferation and self-renewal for SP cells
compared with NSP cells. In the present study, the cell cycle
analyses demonstrate that SP cells exhibit a lower percentage in
the G2 and S phases but a higher percentage in the
G0/G1 phase (Fig.
3A and B; Table II). These data
suggested that a larger proportion of SP cells were arrested at G1
checkpoint compared with NSP cells, which resembles the cell cycle
distribution of stem cells.
Marked expression of ABCG2 was detected in
the SP cells but not in the NSP cells by RT-qPCR (Fig. 4). These results suggested that the
ABCG2 may be used as a marker to sort SP cells from cervical cancer
cells and to distinguish between SP and NSP cells.
Soft agar assay is an important in vitro
method to measure colony formation rate for cancer cells and has
been widely used in cancer research for quantifying malignant
transformation of cells (33,34). This assay has also been used to screen
and investigate the biological properties of stem cells and
progenitor cells (35). It has been
previously shown that cells with better colony formation capacity
exhibit strong tumorigenicity and metastatic features when tested
in animal models and also resemble cancer stem cells in numerous
other features (36). In the present
study, soft agar assays indicated that the SP cells from primary
cervical cancer cell culture presented an increased colony
formation capacity compared with NSP cells from the same culture
(Fig. 5). These findings from in
vitro assays were validated in in vivo tumorigenicity
experiments (Fig. 6 and Table III).
As observed for cancer stem cells isolated from
acute myeloid leukemia, breast cancer, glioma and other types of
cancer, a characteristic feature of cancer stem cells is their
strong tumorigenicity (37,38). According to these and other studies,
the tumorigenic capacity of cancer stem cells was reported to be
50–1,000 times compared with non-CSC tumor cells. The general
method to determine the tumorigenicity of CSCs is to transplant the
purified cancer stem cells in immunodeficient mice followed by
assessing the timing of tumor formation and the size of tumors
developed. In the present study, the SP and NSP cells from the
primary cervical cancer cell culture were inoculated subcutaneously
in NOD-SCID mice. The results show that whilst SP and NSP cells
demonstrated tumorigenic ability, the minimal number of cells
required to generate tumors, the timing of tumor initiation, the
ratio of tumor formation and the tumor sizes were significantly
different between the two groups (Fig.
6 and Table III). The SP cells
were able to induce larger tumors with lower inoculation cell
densities at earlier time points compared with NSP cells. Overall,
the tumorigenicity of SP cells was estimated to be >100 times
compared with NSP cells. These assays support the hypothesis that
the SP cells isolated from primary cervical cancer cell cultures
are enriched in CSC-like cells with greater cloning capacity and
tumorigenicity when compared with NSP cells.
The results in the present study on the CSC-like
features of SP cells are consistent with observations from other
previous studies (39–41). Yu et al reported that the SP
cells were able to form spheroids, but the NSP cells failed to
generate the typical cell spheres (42). In the present study, the colony
formation ratios were 46.82 vs. 12.53% in the soft agar for SP and
NSP cells respectively. Furthermore, 103 SP cells were
sufficient to form tumors in NOD-SCID mice. By contrast,
104 NSP cells failed to form tumors. The stem cell
features of SP cells from primary cultured human laryngeal squamous
cell carcinoma have been previously verified by in vitro and
in vivo assays (31). These SP
cells also presented increased resistance to chemotherapy, greater
xenograft tumorigenicity and higher capacity for proliferation,
differentiation and spheroid formation.
To the best of our knowledge, the present study
reports the first case of successful isolation of SP cells from a
primary cervical cancer cell culture. The isolated SP cells
exhibited a greater proliferative and self-renewal potency and
increased expression of ABCG2 compared with the NSP cells
isolated from the same primary culture. In vitro and in
vivo assays demonstrated that these SP cells had markedly
increased capacity for colony formation and tumor formation
compared with the NSP cells. Although definite molecular stem cell
signatures for these SP cells require to be further verified, the
present study provides a proof of concept for applying the approach
of SP isolation from primary cultures to enrich CSC-like cells from
cervical cancer tissues.
Acknowledgments
The authors of the present study would like to thank
Professor Yishu Wang (Department of Pathophysiology, College of
Basic Medical Sciences, Jilin University, Changchun, China) for
helpful advice with experiments. The authors also would like to
acknowledge Professor Yulin Li (Department of Pathophysiology,
College of Basic Medical Sciences, Jilin University, Changchun,
China) for reading an earlier version of the paper and making
useful suggestions. Dr Chong Qi and Dr. Gong Peng (Institute of
Translational Medicine, The First Hospital of Jilin University,
Changchun, China) provided technical support for flow cytometry.
The present study was supported by the Project Development Plan of
Science and Technology Department of Jilin Province (grant no.
201215046), B Project of Bethune of Jilin University Hospital and
the National Natural Science Foundation of China (grant no.
81301884).
References
|
1
|
Reya T, Morrison SJ, Clarke MF and
Weissman IL: Stem cells, cancer, and cancer stem cells. Nature.
414:105–111. 2001. View
Article : Google Scholar : PubMed/NCBI
|
|
2
|
Gangemi R, Paleari L, Orengo AM, Cesario
A, Chessa L, Ferrini S and Russo P: Cancer stem cells: A new
paradigm for understanding tumor growth and progression and drug
resistance. Curr Med Chem. 16:1688–1703. 2009. View Article : Google Scholar : PubMed/NCBI
|
|
3
|
Valent P, Bonnet D, De Maria R, Lapidot T,
Copland M, Melo JV, Chomienne C, Ishikawa F, Schuringa JJ, Stassi
G, et al: Cancer stem cell definitions and terminology: The devil
is in the details. Nat Rev Cancer. 12:767–775. 2012. View Article : Google Scholar : PubMed/NCBI
|
|
4
|
Bonnet D and Dick JE: Human acute myeloid
leukemia is organized as a hierarchy that originates from a
primitive hematopoietic cell. Nat Med. 3:730–737. 1997. View Article : Google Scholar : PubMed/NCBI
|
|
5
|
Al-Hajj M, Wicha MS, Benito-Hernandez A,
Morrison SJ and Clarke MF: Prospective identification of
tumorigenic breast cancer cells. Proc Natl Acad Sci USA.
100:3983–3988. 2003. View Article : Google Scholar : PubMed/NCBI
|
|
6
|
Clarke RB, Anderson E, Howell A and Potten
CS: Regulation of human breast epithelial stem cells. Cell Prolif.
36:(Suppl 1). S45–S58. 2003. View Article : Google Scholar
|
|
7
|
Goodell MA, Brose K, Paradis G, Conner AS
and Mulligan RC: Isolation and functional properties of murine
hematopoietic stem cells that are replicating in vivo. J Exp Med.
183:1797–1806. 1996. View Article : Google Scholar : PubMed/NCBI
|
|
8
|
Kondo T, Setoguchi T and Taga T:
Persistence of a small subpopulation of cancer stem-like cells in
the C6 glioma cell line. Proc Natl Acad Sci USA. 101:781–786. 2004.
View Article : Google Scholar : PubMed/NCBI
|
|
9
|
Patrawala L, Calhoun T,
Schneider-Broussard R, Zhou J, Claypool K and Tang DG: Side
population is enriched in tumorigenic, stem-like cancer cells,
whereas ABCG2+ and ABCG2-cancer cells are similarly tumorigenic.
Cancer Res. 65:6207–6219. 2005. View Article : Google Scholar : PubMed/NCBI
|
|
10
|
Qi W, Zhao C, Zhao L, Liu N, Li X, Yu W
and Wei L: Sorting and identification of side population cells in
the human cervical cancer cell line HeLa. Cancer Cell Int.
14:32014. View Article : Google Scholar : PubMed/NCBI
|
|
11
|
Wang K, Zeng J, Luo L, Yang J, Chen J, Li
B and Shen K: Identification of a cancer stem cell-like side
population in the HeLa human cervical carcinoma cell line. Oncol
Lett. 6:1673–1680. 2013.PubMed/NCBI
|
|
12
|
Pecorelli S, Zigliani L and Odicino F:
Revised FIGO staging for carcinoma of the cervix. Int J Gynaecol
Obstet. 105:107–108. 2009. View Article : Google Scholar : PubMed/NCBI
|
|
13
|
Livak KJ and Schmittgen TD: Analysis of
relative gene expression data using real-time quantitative PCR and
the 2(−Delta Delta C(T)) method. Methods. 25:402–408. 2001.
View Article : Google Scholar : PubMed/NCBI
|
|
14
|
Aguilar-Gallardo C, Rutledge EC,
Martínez-Arroyo AM, Hidalgo JJ, Domingo S and Simón C: Overcoming
challenges of ovarian cancer stem cells: Novel therapeutic
approaches. Stem Cell Rev. 8:994–1010. 2012. View Article : Google Scholar : PubMed/NCBI
|
|
15
|
Donnell ORL, McCormick A, Mukhopadhyay A,
Woodhouse LC, Moat M, Grundy A, Dixon M, Kaufman A, Soohoo S,
Elattar A, et al: The use of ovarian cancer cells from patients
undergoing surgery to generate primary cultures capable of
undergoing functional analysis. PLoS One. 9:e906042014. View Article : Google Scholar : PubMed/NCBI
|
|
16
|
Bunting KD: ABC transporters as phenotypic
markers and functional regulators of stem cells. Stem Cells.
20:11–20. 2002. View Article : Google Scholar : PubMed/NCBI
|
|
17
|
Oates JE, Grey BR, Addla SK, Samuel JD,
Hart CA, Ramani VA, Brown MD and Clarke NW: Hoechst 33342 side
population identification is a conserved and unified mechanism in
urological cancers. Stem Cells Dev. 18:1515–1522. 2009. View Article : Google Scholar : PubMed/NCBI
|
|
18
|
Szotek PP, Pieretti-Vanmarcke R, Masiakos
PT, Dinulescu DM, Connolly D, Foster R, Dombkowski D, Preffer F,
Maclaughlin DT and Donahoe PK: Ovarian cancer side population
defines cells with stem cell-like characteristics and Mullerian
Inhibiting Substance responsiveness. Proc Natl Acad Sci USA.
103:11154–11159. 2006. View Article : Google Scholar : PubMed/NCBI
|
|
19
|
Addla SK, Brown MD, Hart CA, Ramani VA and
Clarke NW: Characterization of the Hoechst 33342 side population
from normal and malignant human renal epithelial cells. Am J
Physiol Renal Physiol. 295:F680–F687. 2008. View Article : Google Scholar : PubMed/NCBI
|
|
20
|
Brown MD, Gilmore PE, Hart CA, Samuel JD,
Ramani VA, George NJ and Clarke NW: Characterization of benign and
malignant prostate epithelial Hoechst 33342 side populations.
Prostate. 67:1384–1396. 2007. View Article : Google Scholar : PubMed/NCBI
|
|
21
|
Ergen AV, Jeong M, Lin KK, Challen GA and
Goodell MA: Isolation and characterization of mouse side population
cells. Methods Mol Biol. 946:151–162. 2013. View Article : Google Scholar : PubMed/NCBI
|
|
22
|
Foster BA, Gangavarapu KJ, Mathew G,
Azabdaftari G, Morrison CD, Miller A and Huss WJ: Human prostate
side population cells demonstrate stem cell properties in
recombination with urogenital sinus mesenchyme. PLoS One.
8:e550622013. View Article : Google Scholar : PubMed/NCBI
|
|
23
|
Habich A, Jurga M, Markiewicz I, Lukomska
B, Bany-Laszewicz U and Domanska-Janik K: Early appearance of
stem/progenitor cells with neural-like characteristics in human
cord blood mononuclear fraction cultured in vitro. Exp Hematol.
34:914–925. 2006. View Article : Google Scholar : PubMed/NCBI
|
|
24
|
Luth ES, Jun SJ, Wessen MK, Liadaki K,
Gussoni E and Kunkel LM: Bone marrow side population cells are
enriched for progenitors capable of myogenic differentiation. J
Cell Sci. 121:1426–1434. 2008. View Article : Google Scholar : PubMed/NCBI
|
|
25
|
Scaldaferri ML, Fera S, Grisanti L,
Sanchez M, Stefanini M, De Felici M and Vicini E: Identification of
side population cells in mouse primordial germ cells and prenatal
testis. Int J Dev Biol. 55:209–214. 2011. View Article : Google Scholar : PubMed/NCBI
|
|
26
|
Uezumi A, Ojima K, Fukada S, Ikemoto M,
Masuda S, Miyagoe-Suzuki Y and Takeda S: Functional heterogeneity
of side population cells in skeletal muscle. Biochem Biophys Res
Commun. 341:864–873. 2006. View Article : Google Scholar : PubMed/NCBI
|
|
27
|
Umemoto T, Yamato M, Nishida K, Kohno C,
Yang J, Tano Y and Okano T: Rat limbal epithelial side population
cells exhibit a distinct expression of stem cell markers that are
lacking in side population cells from the central cornea. FEBS
Lett. 579:6569–6574. 2005. View Article : Google Scholar : PubMed/NCBI
|
|
28
|
Yoon J, Choi SC, Park CY, Shim WJ and Lim
DS: Cardiac side population cells exhibit endothelial
differentiation potential. Exp Mol Med. 39:653–662. 2007.
View Article : Google Scholar : PubMed/NCBI
|
|
29
|
Zhang L, Hu J, Hong TP, Liu YN, Wu YH and
Li LS: Monoclonal side population progenitors isolated from human
fetal pancreas. Biochem Biophys Res Commun. 333:603–608. 2005.
View Article : Google Scholar : PubMed/NCBI
|
|
30
|
Petriz J: Flow cytometry of the side
population (SP). Curr Protoc Cytom Chapter. 9:Unit 9.23. 2007.
View Article : Google Scholar
|
|
31
|
Wu C, Wei Q, Utomo V, Nadesan P, Whetstone
H, Kandel R, Wunder JS and Alman BA: Side population cells isolated
from mesenchymal neoplasms have tumor initiating potential. Cancer
Res. 67:8216–8222. 2007. View Article : Google Scholar : PubMed/NCBI
|
|
32
|
López J, Poitevin A, Mendoza-Martinez V,
Pérez-Plasencia C and Garcia-Carranca A: Cancer-initiating cells
derived from established cervical cell lines exhibit stem-cell
markers and increased radioresistance. BMC Cancer. 12:482012.
View Article : Google Scholar : PubMed/NCBI
|
|
33
|
Horman SR, To J and Orth AP: An
HTS-compatible 3D colony formation assay to identify tumor-specific
chemotherapeutics. J Biomol Screen. 18:1298–1308. 2013. View Article : Google Scholar : PubMed/NCBI
|
|
34
|
Jeng KS, Sheen IS, Jeng WJ, Yu MC, Hsiau
HI, Chang FY and Tsai HH: Activation of the sonic hedgehog
signaling pathway occurs in the CD133 positive cells of mouse liver
cancer Hepa 1–6 cells. Onco Targets Ther. 6:1047–1055. 2013.
View Article : Google Scholar : PubMed/NCBI
|
|
35
|
Zheng X, Chopp M, Lu Y, Buller B and Jiang
F: MiR-15b and miR-152 reduce glioma cell invasion and angiogenesis
via NRP-2 and MMP-3. Cancer Lett. 329:146–154. 2013. View Article : Google Scholar : PubMed/NCBI
|
|
36
|
Weinberg RA: The biology of cancer.
Garland Science; New York, NY: 2007
|
|
37
|
Kassem NM: Review article: Cancer stem
cells: From identification to eradication. J Egypt Natl Canc Inst.
20:209–215. 2008.PubMed/NCBI
|
|
38
|
Ponti D, Costa A, Zaffaroni N, Pratesi G,
Petrangolini G, Coradini D, Pilotti S, Pierotti MA and Daidone MG:
Isolation and in vitro propagation of tumorigenic breast cancer
cells with stem/progenitor cell properties. Cancer Res.
65:5506–5511. 2005. View Article : Google Scholar : PubMed/NCBI
|
|
39
|
Hirschmann-Jax C, Foster AE, Wulf GG,
Nuchtern JG, Jax TW, Gobel U, Goodell MA and Brenner MK: A distinct
‘side population’ of cells with high drug efflux capacity in human
tumor cells. Proc Natl Acad Sci USA. 101:14228–14233. 2004.
View Article : Google Scholar : PubMed/NCBI
|
|
40
|
Moserle L, Ghisi M, Amadori A and
Indraccolo S: Side population and cancer stem cells: Therapeutic
implications. Cancer Lett. 288:1–9. 2010. View Article : Google Scholar : PubMed/NCBI
|
|
41
|
Shaharuddin B, Ahmad S, Ali S and Meeson
A: Limbal side population cells: A future treatment for limbal stem
cell deficiency. Regen Med. 8:319–331. 2013. View Article : Google Scholar : PubMed/NCBI
|
|
42
|
Yu D, Jin C, Liu Y, Yang J, Zhao Y, Wang
H, Zhao X, Cheng J, Liu X and Liu C: Clinical implications of
cancer stem cell-like side population cells in human laryngeal
cancer. Tumour Biol. 34:3603–3610. 2013. View Article : Google Scholar : PubMed/NCBI
|