Introduction
Gliomas are primary tumors that originate in the
brain or spinal cord, and account for ~80% of all malignant brain
tumors (1,2). Gliomas occur mostly in childhood, with
symptoms including visual loss, pain, nausea, vomiting, weakness in
the extremities, headaches and seizures (3,4). Glioma
patients have a low survival rate, and of 10,000 Americans
diagnosed with malignant gliomas each year, ~50% survive one year
following diagnosis, and 25% two years later (5). Therefore, it is essential to explore the
molecular mechanisms of glioma and develop effective methods for
its treatment.
The methods used to treat gliomas at present are
typically a combination of surgery, radiotherapy and chemotherapy,
however, the median survival duration of patients with gliomas is
only 9–12 months (6). Understanding
the molecular mechanisms which underlie this disease is crucial for
the development of more effective methods for its treatment
(7). Previous studies revealed that
methylation of CpG islands within or near promoters were associated
with increased gene expression, and may contribute to tumor
formation and progression (8–10). Costello et al (11) demonstrated that methylation of the
pl6/CDKN2 tumor suppressor gene was detected in gliomas.
Other studies reported that methylation of the promoter in the DNA
repair gene O-6-methylguanine-DNA methyltransferase, contributed to
the progression of gliomas (12,13). Chen
et al (14) demonstrated that
the methylation of the excision repair cross-complementation group
1 promoter promoted the development of gliomas. Although previous
studies have made advances in the field, the exact mechanisms of
methylation-driven gliomas have not been fully elucidated.
The present study aimed to identify
methylation-associated genes from differentially expressed genes
between patients with glioma and normal controls, in relation to
associated pathways of gliomas, to elucidate the underlying
molecular mechanisms. Methylation associated genes were identified
from differentially expressed genes (DEGs) by methylation analysis.
Significant genes and pathways were selected from the
transcriptional regulatory network and sub-pathway enrichment
analysis. Through the identification of key genes and pathways, the
potential underlying molecular mechanisms and the potential
biomarkers of gliomas were explored.
Materials and methods
Affymetrix microarray data
The gene expression profile data GSE50021 was
downloaded from the Gene Expression Omnibus database (GEO,
http://www.ncbi.nlm.nih.gov/geo/)
(15). Gene expression profiling was
based on the GPL13938 platform using the Illumina HumanHT-12
WG-DASL V4.0 expression BeadChip (Illumina Inc., San Diego, CA,
USA). The array consists of 29,377 probe-sets, which it is possible
to use to detect the transcription level of 20,817 human genes. A
total of 45 samples, including 10 specimens of normal brain tissues
and 35 specimens of glioma tissues from children with a mean age of
1.008±1.910 years were available for the expression array.
The dual channel methylation microarray data
GSE50022, was downloaded from the GEO database (http://www.ncbi.nlm.nih.gov/geo/) (15). Gene expression profiling was based on
the platform of GPL16304 using the Illumina HumanMethylation450
BeadChip (UBC enhanced annotation v1.0; Illumina, Inc.). The array
consisted of 485,512 probe-sets, which detect >485,000
methylation sites per sample at single-nucleotide resolution.
Methylation data of 28 samples from patients with glioma (mean age,
0.943±0.782 years) were analyzed in the present study. The
methylation index matrix was processed with GenomeStudio v2011
software (Illumina, Inc.) which indicated the methylation ratios of
the probes.
Identification of differentially
expressed genes
The raw expression profile data were initially
preprocessed using the impute package in R (16). The processed data were normalized
using the preprocess Core in R (17).
DEGs, between normal brain tissues and glioma tissues were analyzed
by limma package in R (18). The fold
change (FC) of the expression of individual genes was also
calculated for differential expression test. All genes with a
P-value <0.05 and log2 FC >1 were considered
significant and selected as DEGs.
Screening of key methylation
sites
The raw methylation index matrix were initially
preprocessed using the impute package in R (16). The methylation sites located around
the DEGs were screened according to the methylation chip annotation
information. Methylation sites which had a methylation index
>0.8 in >80% of samples were selected. Key methylation sites
which were located 50 kb upstream and/or downstream of the
transcription start site were screened.
Transcriptional regulatory network
construction
The selected key methylation sites were mapped to
the transcription factor binding site data predicted by the
University of California Santa Cruz (UCSC) genome browser (19), and the methylation information in the
transcription factor binding site was obtained. The transcriptional
regulatory network was constructed using Cytoscape software
(version 3.2.0; Institute for Systems Biology, Seattle, WA, USA)
(20).
Survival analysis of key methylation
sites
Survival analysis of methylation sites was performed
based on the methylation index. The samples were divided into two
parts according to the mean of the methylation index: One part had
high methylation index (>0.87); another part had lower
methylation index (≤0.87). A Kaplan-Meier curve based on the
survival time of the two parts was constructed, and the log-rank
test was used to test for a significant difference between the
groups with P<0.05 considered to indicate a statistically
significant difference.
Analysis of risk sub-pathway
Gene Ontology (GO) analysis is a commonly used
method for functional studies of large-scale genomic or
transcriptomic data (21). Kyoto
Encyclopedia of Genes and Genomes (KEGG) (22) is a primary information-based database
which stores information concerning how molecules and genes are
networked. The Database for Annotation Visualization and Integrated
Discovery (DAVID) (23) was used to
systematically extract biological meaning from large gene or
protein lists. GO function and KEGG pathways of downregulated DEGs,
regulated by transcription factors were analyzed using DAVID 6.7,
with a false discovery rate <0.05.
With in metabolic pathways, the closer the proximity
of components in the network, the greater the potential for
similarity of the biological functions. Therefore, identification
of the sub-pathway of diseases is critical. The K-clique was used
to divide the metabolic pathway into sub-pathways through the
iSubpathwayMiner package in R (24).
Sub-pathways with P<0.05 were considered significant.
Results
Identification of differentially
expressed genes
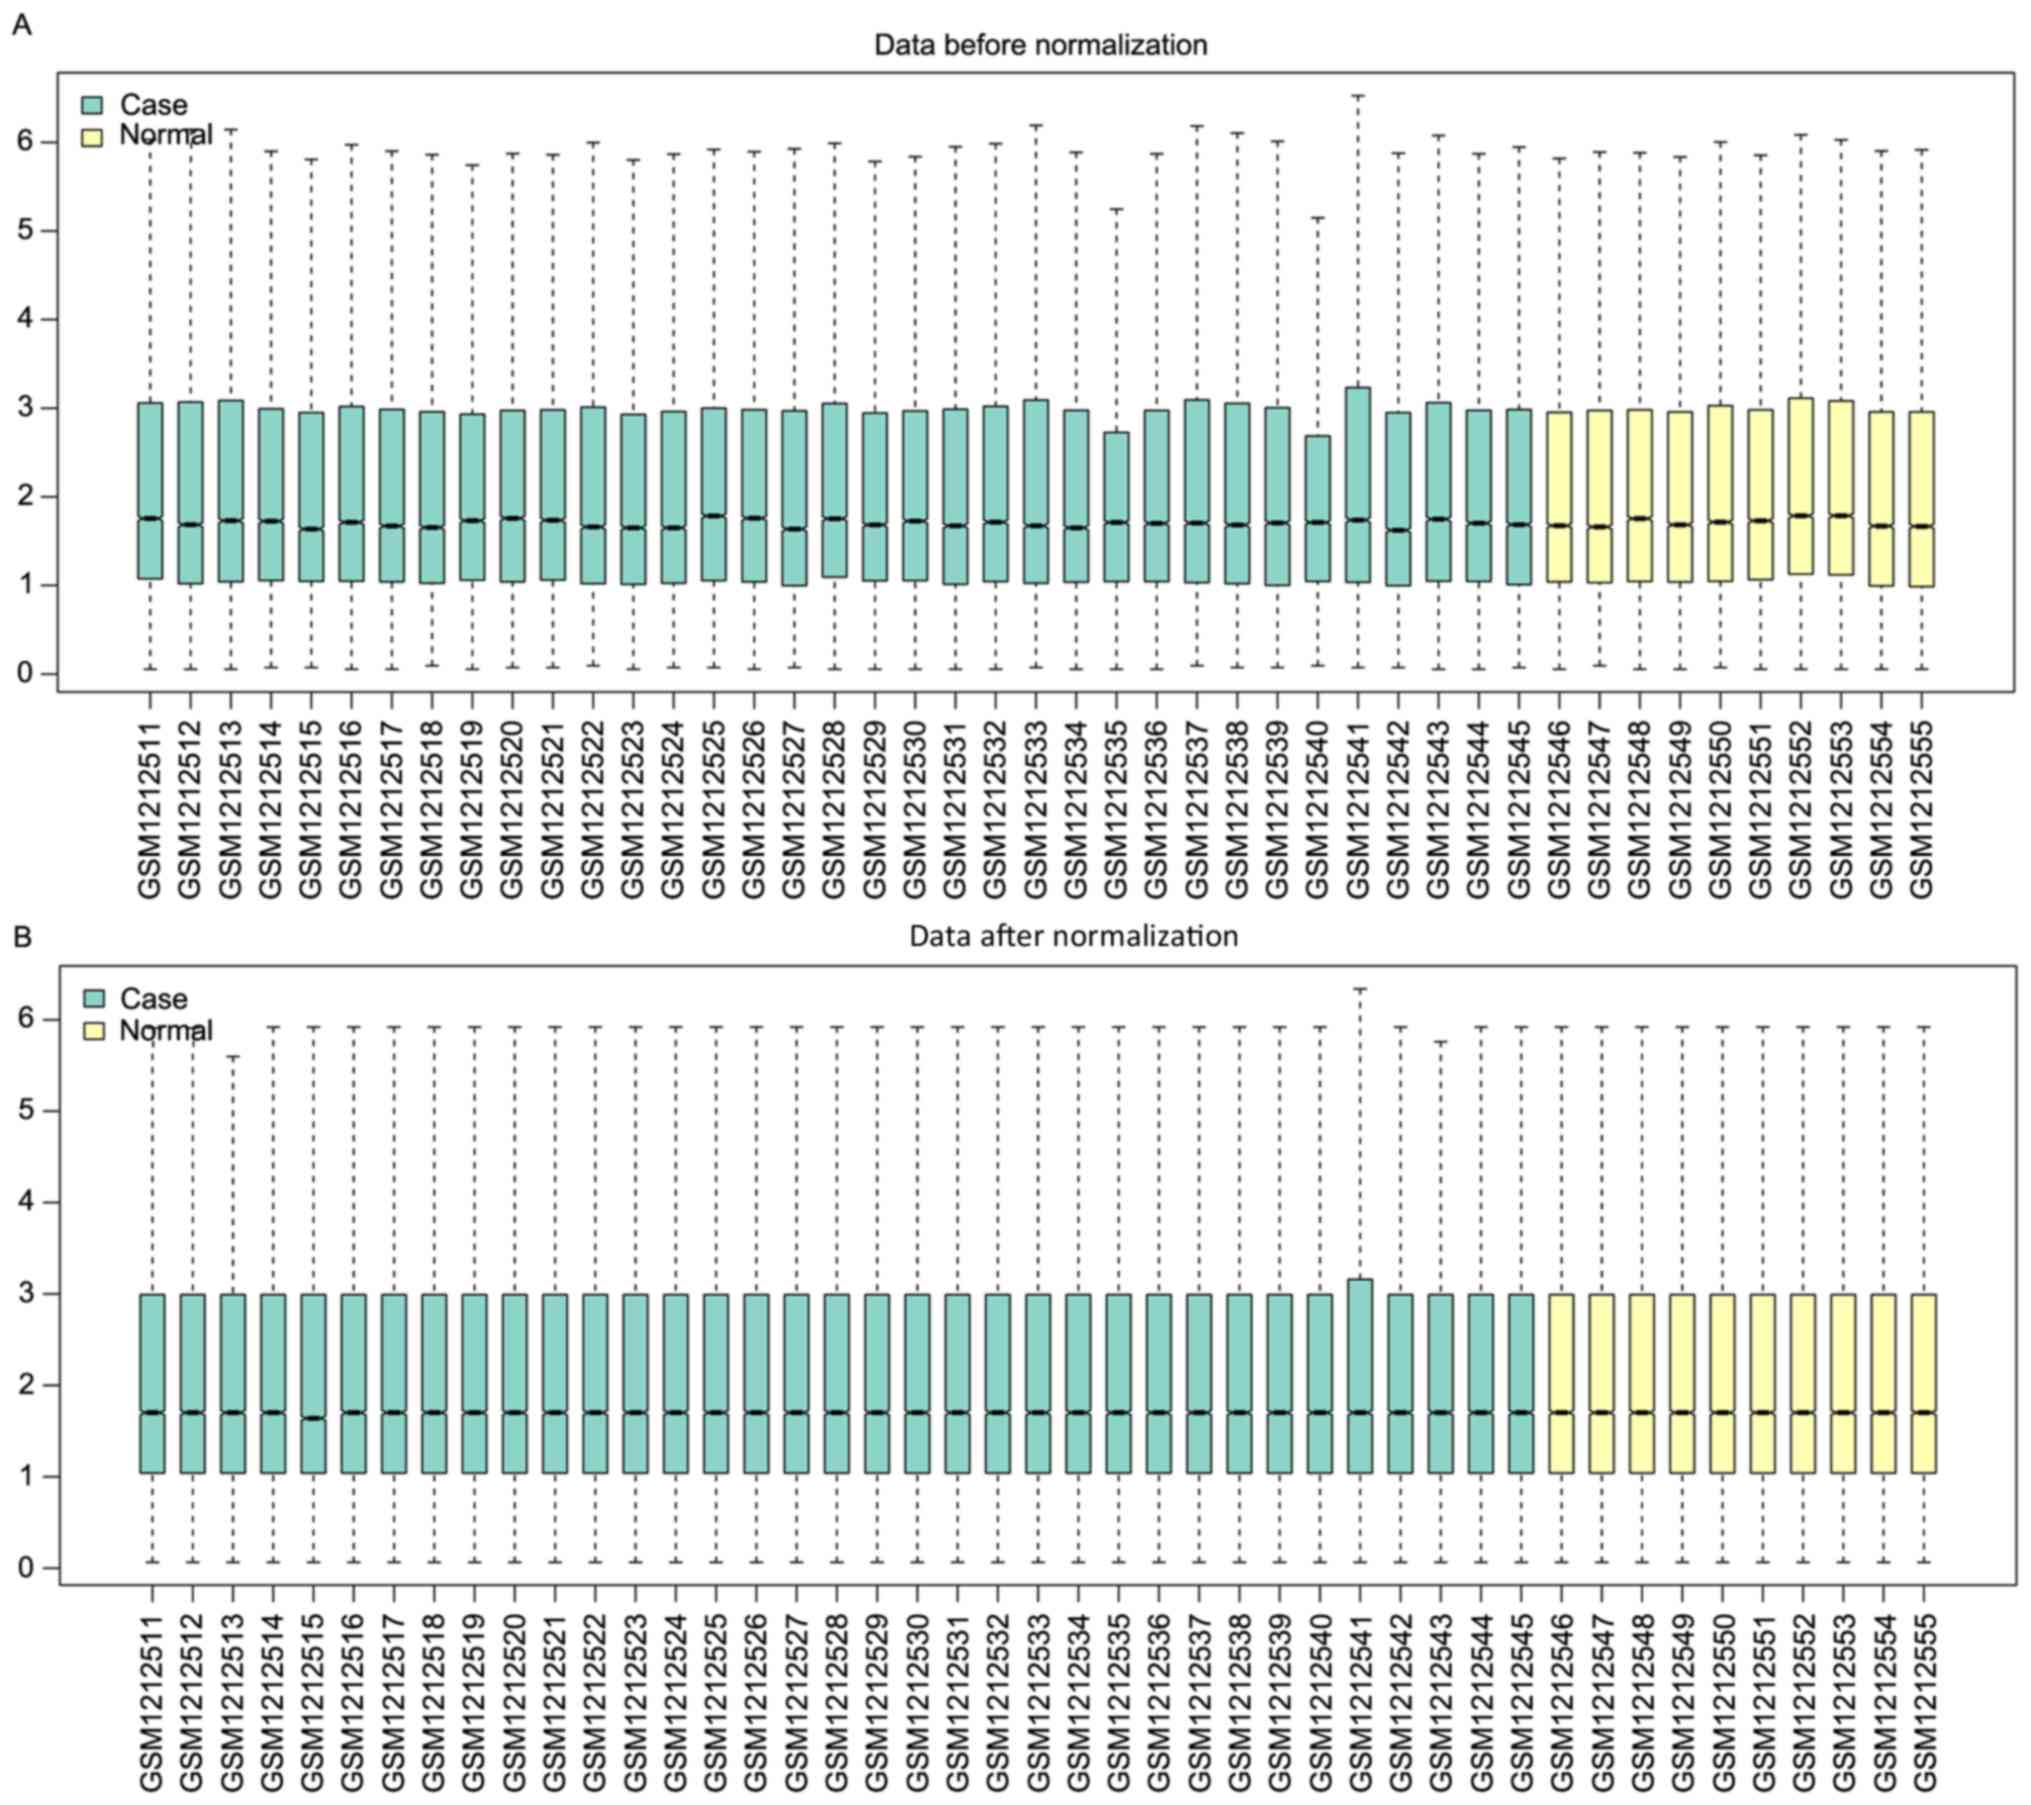
Following analysis of the expression profile data,
the expression information of 20,727 genes in 45 samples was
obtained. The normalized results revealed that the expression
median following normalization was a straight line (Fig. 1). From all the genes recorded, 79
significantly downregulated DEGs were selected. However, no
upregulated DEGs were identified.
Screening of key methylation
sites
Following preprocessing of the methylation index
matrix, 382,049 methylation sites in 28 samples were detected. A
total of 79 significantly downregulated DEGs overlapped with the
methylation data, and 1,474 methylation sites associated with DEGs
were identified. The methylation signals of 1,187 methylation sites
were detected in the methylation chip. A total of 204 methylation
sites, which had a methylation index >0.8 in >80% of samples
were selected. A total of 179 key methylation sites in 65 genes,
which were located 50 kb upstream or downstream of the
transcription start site, were selected.
Analysis of the transcriptional
regulatory network
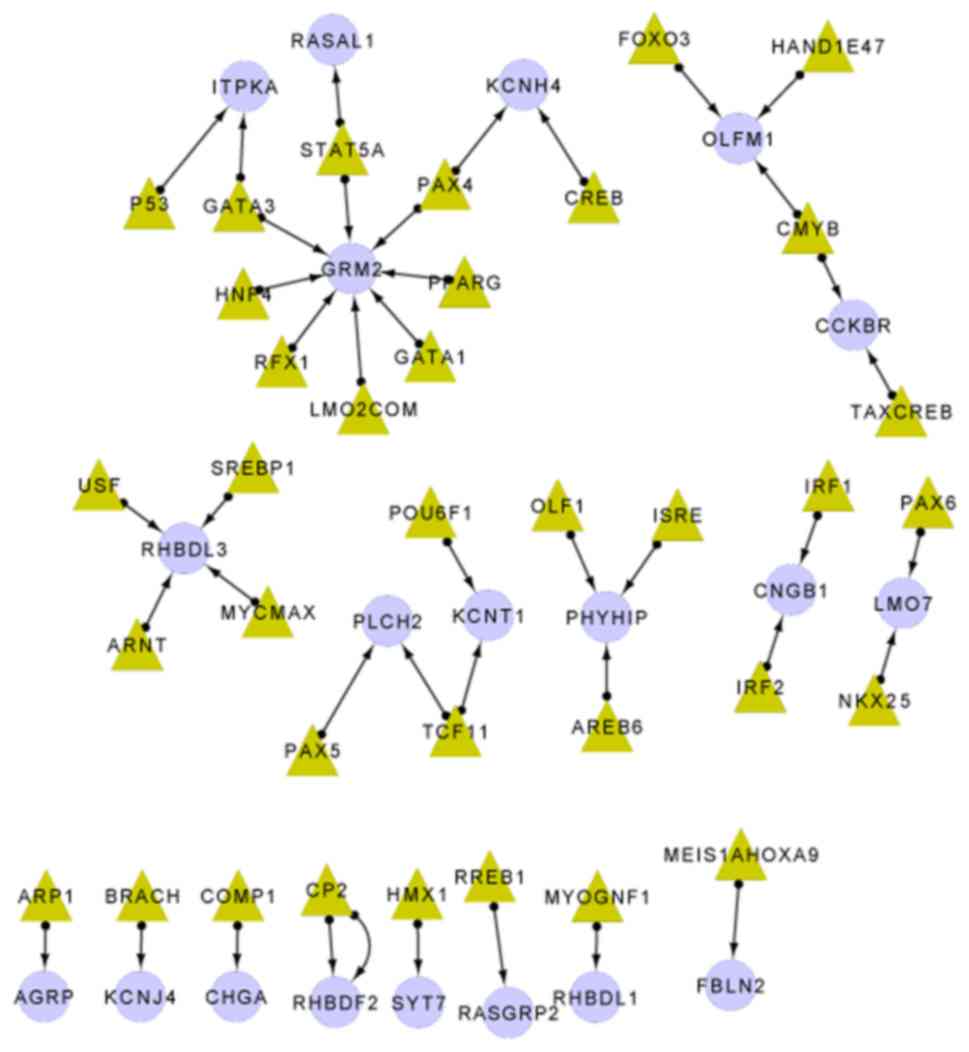
According to the UCSC genome browser (19), 26 methylation sites were revealed to
be located in 42 transcription factor binding sites (Table I). A total of 20 target genes and 36
transcription factors were included in the transcriptional
regulatory network (Fig. 2). Based on
this, the glutamate metabotropic receptor 2 (GRM2) gene was
regulated by 8 transcription factors; the rhomboid-like 3
(RHBDL3) gene was regulated by 4 transcription factors and
rhomboid 5 homolog 2 (RHBDF2) had 2 methylation sites in the
transcription factor binding sites.
 | Table I.Key methylation site information. |
Table I.
Key methylation site information.
| ID | Chromosome | MAPINFO | tfbs_start | tfbs_end | tf |
Distance_closest_TSS |
Closest_TSS_gene_name |
|---|
| cg06191091 | chr17 | 30583855 | 30583848 | 30583862 | USF | −9339 | RHBDL3 |
| cg02629157 | chr9 | 138670609 | 138670546 | 138670568 | TCF11 | 25013 | KCNT1 |
| cg11709150 | chr1 | 2440438 | 2440431 | 2440444 | TCF11 | 10256 | PLCH2 |
| cg04585209 | chr11 | 6292311 | 6292257 | 6292272 | TAXCREB | 306 | CCKBR |
| cg07125541 | chr12 | 113534668 | 113534663 | 113534687 | STAT5A | 38736 | RASAL1 |
| cg10707626 | chr3 | 51747098 | 51747027 | 51747051 | STAT5A | 6018 | GRM2 |
| cg06191091 | chr17 | 30583855 | 30583849 | 30583860 | SREBP1 | −9339 | RHBDL3 |
| cg12603173 | chr11 | 64508421 | 64508409 | 64508423 | RREB1 | −66 | RASGRP2 |
| cg11025960 | chr3 | 51749188 | 51749177 | 51749195 | RFX1 | 8108 | GRM2 |
| cg10692302 | chr3 | 51747227 | 51747224 | 51747245 | PPARG | 6147 | GRM2 |
| cg02629157 | chr9 | 138670609 | 138670558 | 138670569 | POU6F1 | 25013 | KCNT1 |
| cg11014582 | chr6 | 76333727 | 76333675 | 76333696 | PAX6 | −852 | LMO7 |
| cg04341461 | chr1 | 2410006 | 2409978 | 2410006 | PAX5 | −1616 | PLCH2 |
| cg05289873 | chr17 | 40321636 | 40321576 | 40321597 | PAX4 | 11660 | KCNH4 |
| cg10692302 | chr3 | 51747227 | 51747222 | 51747252 | PAX4 | 6147 | GRM2 |
| cg04625615 | chr15 | 41788368 | 41788310 | 41788330 | P53 | 2313 | ITPKA |
| cg07200386 | chr8 | 22079169 | 22079113 | 22079135 | OLF1 | 10682 | PHYHIP |
| cg11014582 | chr6 | 76333727 | 76333676 | 76333683 | NKX25 | −852 | LMO7 |
| cg09864712 | chr16 | 726786 | 726720 | 726749 | MYOGNF1 | 712 | RHBDL1 |
| cg06191091 | chr17 | 30583855 | 30583848 | 30583862 | MYCMAX | −9339 | RHBDL3 |
| cg00810908 | chr3 | 13612319 | 13612306 | 13612320 |
MEIS1AHOXA9 | 2080 | FBLN2 |
| cg11025960 | chr3 | 51749188 | 51749181 | 51749190 | LMO2COM | 8108 | GRM2 |
| cg03358506 | chr8 | 22058702 | 22058688 | 22058703 | ISRE | 31149 | PHYHIP |
| cg07776629 | chr16 | 57989122 | 57989116 | 57989129 | IRF2 | 15898 | CNGB1 |
| cg07776629 | chr16 | 57989122 | 57989116 | 57989129 | IRF1 | 15898 | CNGB1 |
| cg10692302 | chr3 | 51747227 | 51747225 | 51747244 | HNF4 | 6147 | GRM2 |
| cg06632557 | chr11 | 61313548 | 61313495 | 61313505 | HMX1 | −3678 | SYT7 |
| cg00155846 | chr9 | 138011566 | 138011506 | 138011522 |
HAND1E47 | 14081 | OLFM1 |
| cg11025960 | chr3 | 51749188 | 51749181 | 51749190 | GATA3 | 8108 | GRM2 |
| cg11025960 | chr3 | 51749188 | 51749179 | 51749193 | GATA1 | 8108 | GRM2 |
| cg04625615 | chr15 | 41788368 | 41788310 | 41788321 | GATA3 | 2313 | ITPKA |
| cg05392169 | chr9 | 138011814 | 138011802 | 138011816 | FOXO3 | 14329 | OLFM1 |
| cg05289873 | chr17 | 40321636 | 40321585 | 40321597 | CREB | 11660 | KCNH4 |
| cg12309456 | chr17 | 74475402 | 74475346 | 74475357 | CP2 | 2225 | RHBDF2 |
| cg12163800 | chr17 | 74475355 | 74475346 | 74475357 | CP2 | 2272 | RHBDF2 |
| cg07012189 | chr14 | 93408043 | 93408038 | 93408062 | COMP1 | 18599 | CHGA |
| cg04585209 | chr11 | 6292311 | 6292251 | 6292269 | CMYB | 306 | CCKBR |
| cg05392169 | chr9 | 138011814 | 138011806 | 138011824 | CMYB | 14329 | OLFM1 |
| cg05934090 | chr22 | 38823188 | 38823137 | 38823161 | BRACH | 949 | KCNJ4 |
| cg10368536 | chr16 | 67518179 | 67518168 | 67518184 | ARP1 | −463 | AGRP |
| cg06191091 | chr17 | 30583855 | 30583847 | 30583863 | ARNT | −9339 | RHBDL3 |
| cg03358506 | chr8 | 22058702 | 22058694 | 22058703 | AREB6 | 31149 | PHYHIP |
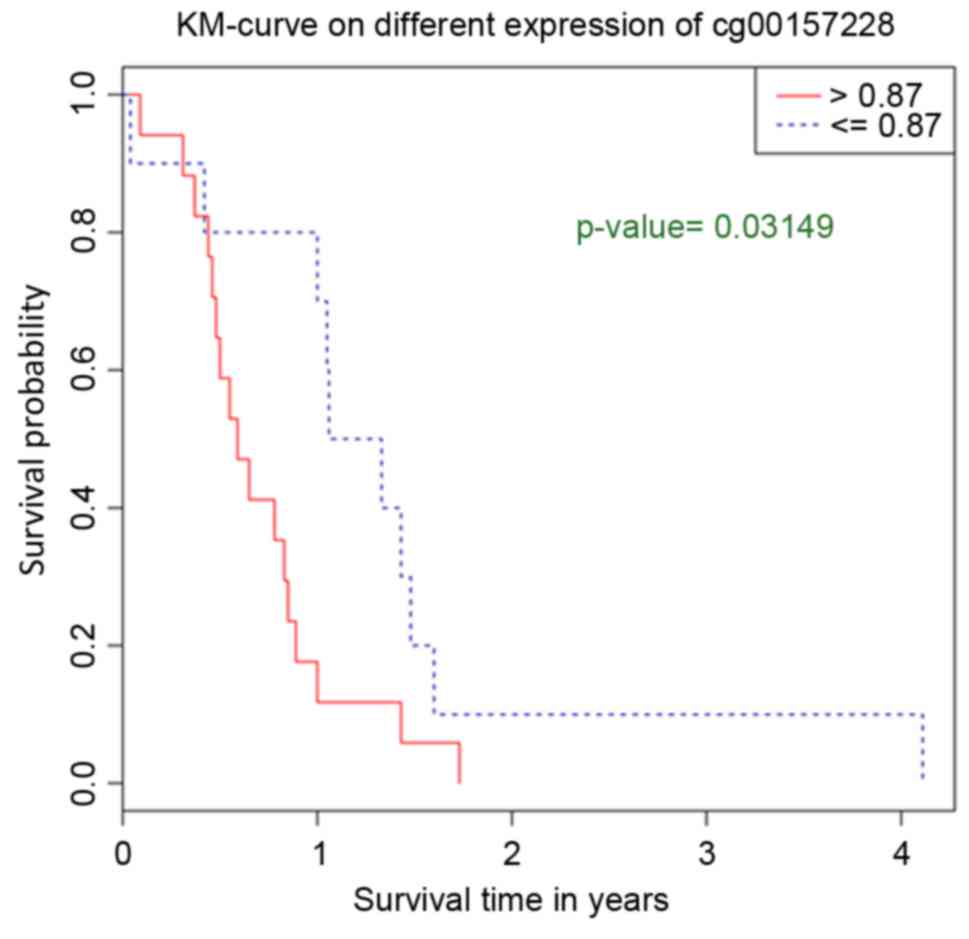
Survival analysis of key methylation
sites
Survival analysis of the 204 methylation sites
demonstrated that cg00157228 significantly affected the survival
time of patients. The survival time of patients with lower
methylation levels in cg00157228 was increased compared with
patients with higher methylation levels in cg00157228 (Fig. 3). Inositol-triphosphate 3 kinase A
(ITPKA) was the gene located closest to cg00157228.
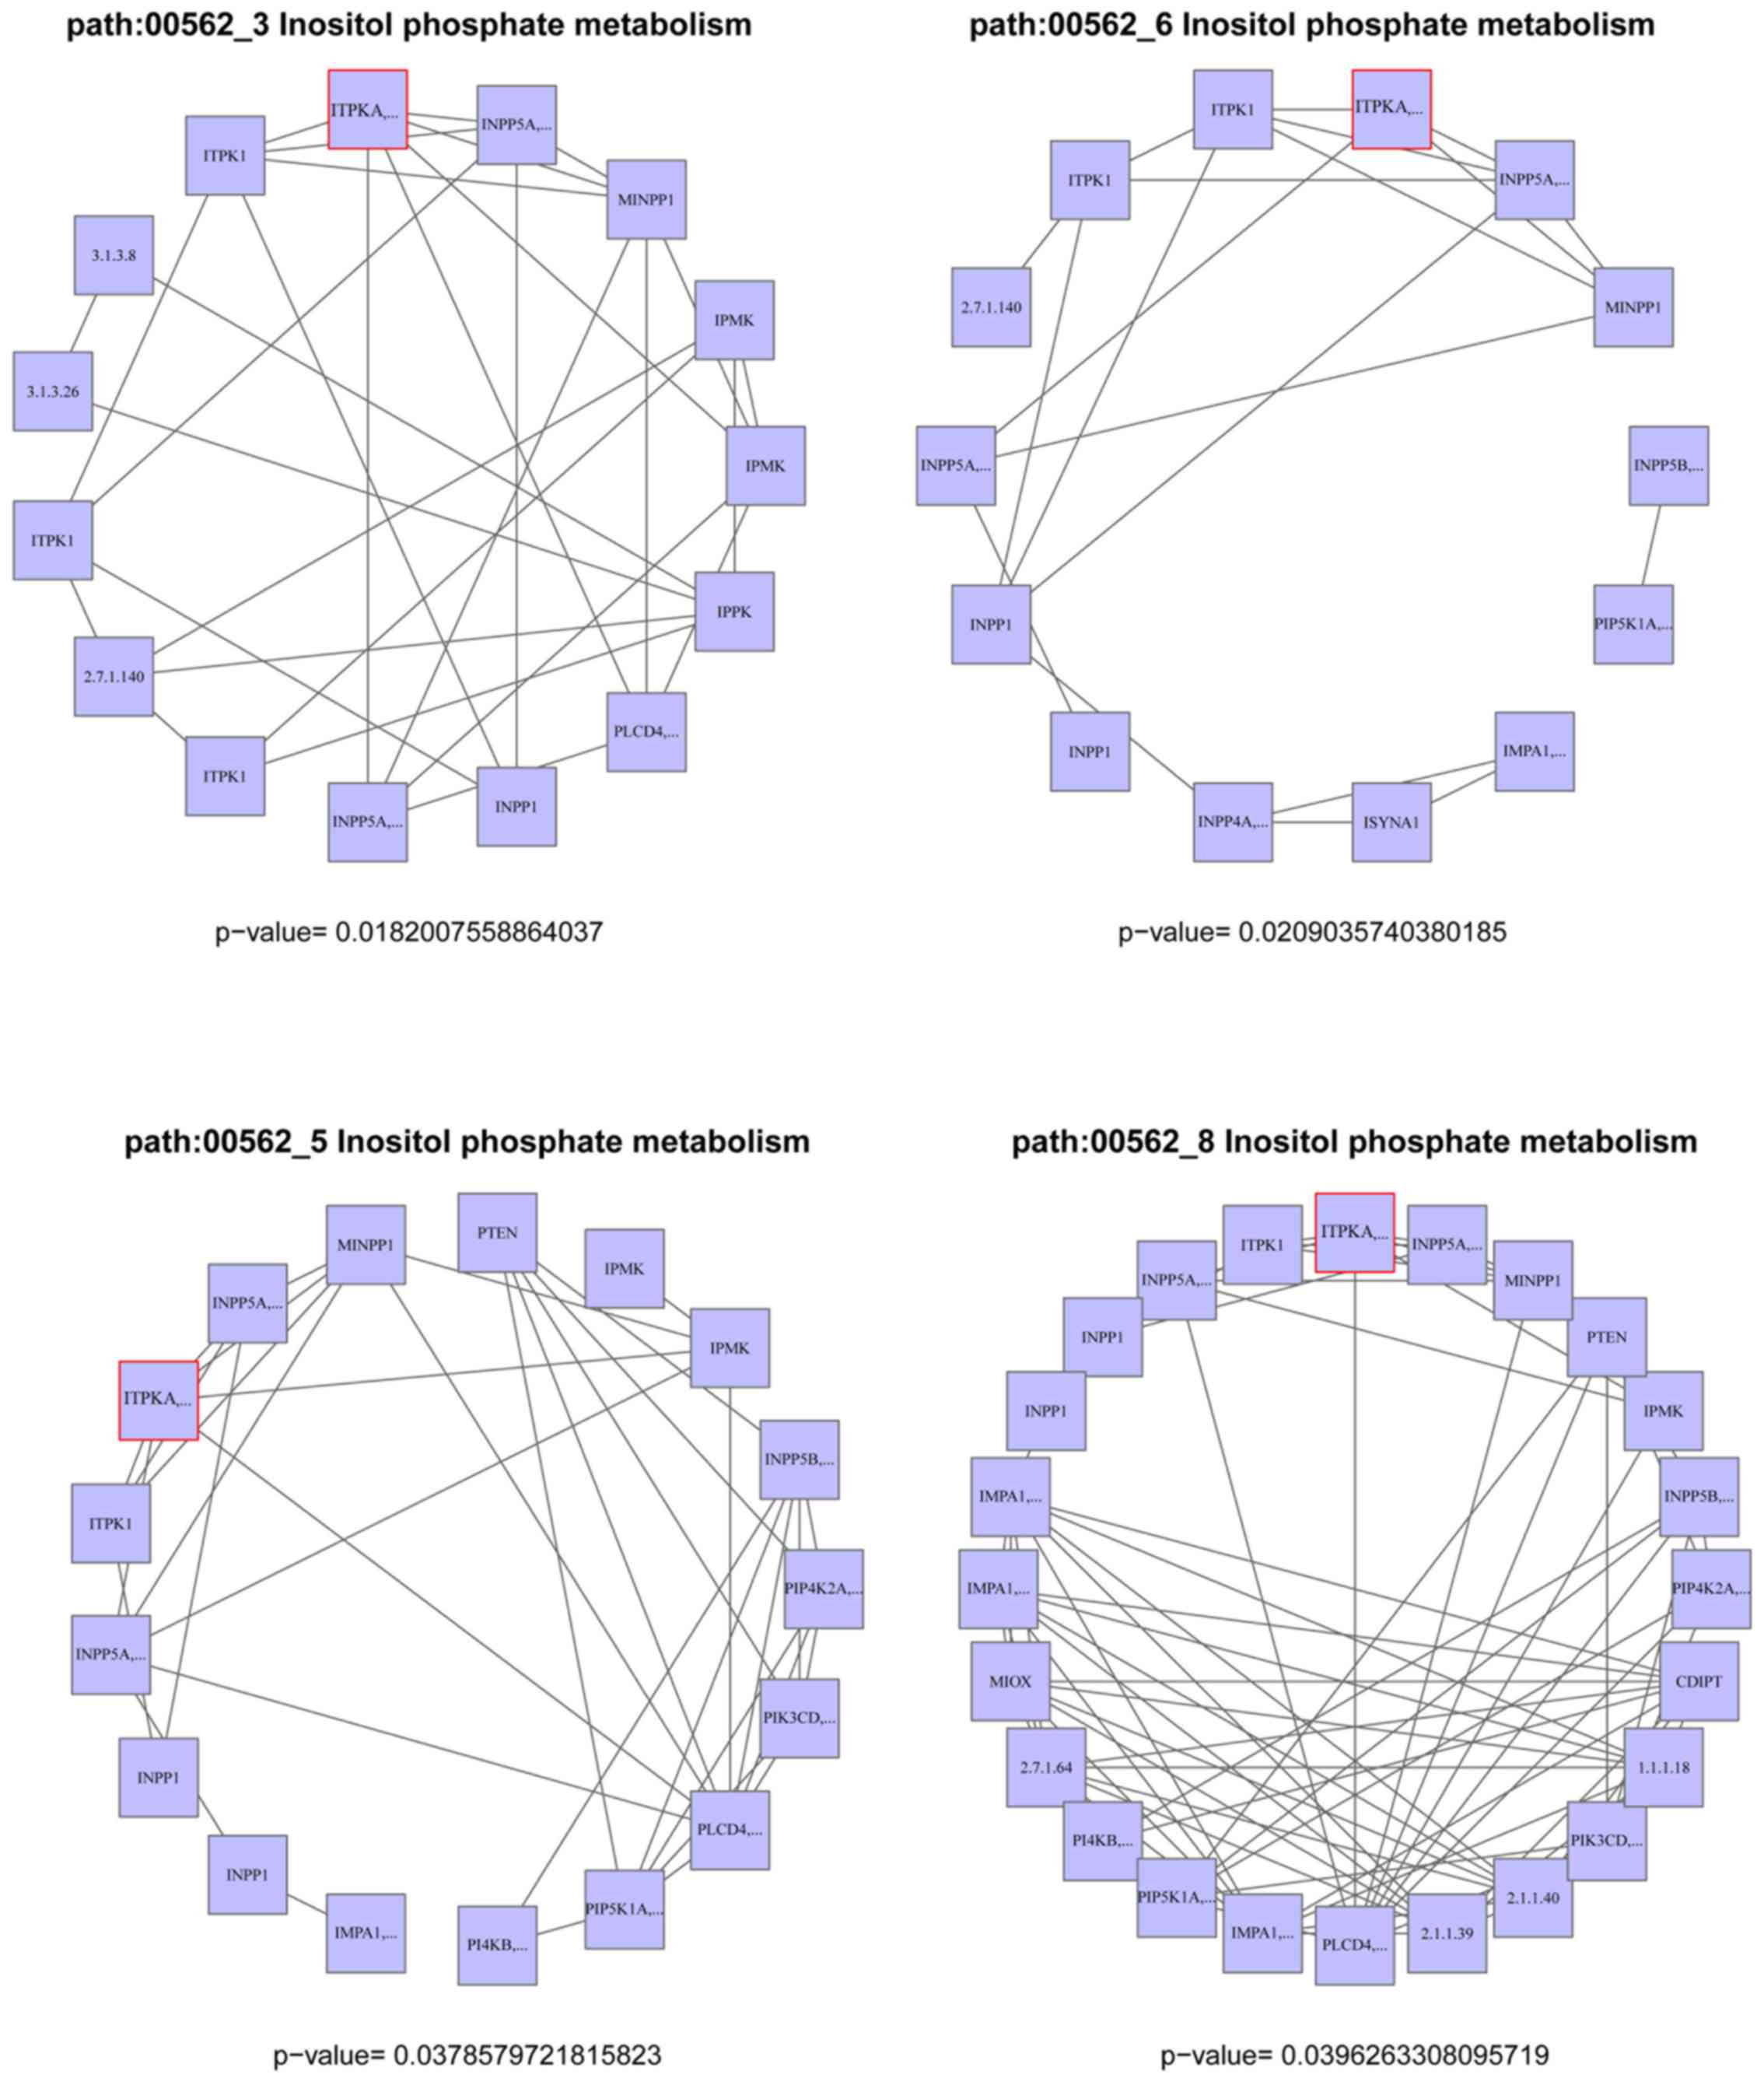
Analysis of risk sub-pathways
GO analysis of 20 target genes confirmed that
specific DEGs were significantly enriched in different GO
categories, which were associated with biological processes
including potassium ion transport, monovalent inorganic cation
transport and ion transport (Table
II). However, the 20 target genes were not significantly
enriched in any pathways. A total of 8 glioma related sub-pathways
were mined from the inositol phosphate metabolism pathway.
ITPKA was the DEG enriched in these 8 sub-pathways (Fig. 4).
| Table II.GO analysis of the differentially
expressed genes. |
Table II.
GO analysis of the differentially
expressed genes.
| Category | Term | Count | P-value | FDR |
|---|
| GOTERM_BP_FAT |
GO:0006813-potassium ion transport | 3 | 0.013 | 14.588 |
| GOTERM_BP_FAT |
GO:0007242-intracellular signaling
cascade | 5 | 0.044 | 41.371 |
| GOTERM_BP_FAT |
GO:0015672-monovalent inorganic cation
transport | 3 | 0.047 | 43.728 |
| GOTERM_BP_FAT | GO:0006811-ion
transport | 4 | 0.050 | 45.428 |
| GOTERM_CC_FAT | GO:0034703-cation
channel complex | 3 | 0.012 | 10.880 |
| GOTERM_CC_FAT | GO:0044459-plasma
membrane part | 8 | 0.012 | 11.321 |
| GOTERM_CC_FAT | GO:0005886-plasma
membrane | 10 | 0.023 | 20.748 |
| GOTERM_CC_FAT | GO:0034702-ion
channel complex | 3 | 0.026 | 23.371 |
| GOTERM_MF_FAT | GO:0005509-calcium
ion binding | 7 | <0.001 | 0.864 |
| GOTERM_MF_FAT | GO:0005261-cation
channel activity | 4 | 0.005 | 5.578 |
| GOTERM_MF_FAT | GO:0022836-gated
channel activity | 4 | 0.007 | 7.698 |
| GOTERM_MF_FAT | GO:0046873-metal
ion transmembrane transporter activity | 4 | 0.008 | 8.936 |
| GOTERM_MF_FAT |
GO:0030955-potassium ion binding | 3 | 0.012 | 12.513 |
| GOTERM_MF_FAT |
GO:0005267-potassium channel activity | 3 | 0.013 | 13.401 |
| GOTERM_MF_FAT | GO:0005216-ion
channel activity | 4 | 0.013 | 13.593 |
| GOTERM_MF_FAT |
GO:0022838-substrate specific channel
activity | 4 | 0.014 | 14.678 |
| GOTERM_MF_FAT | GO:0015267-channel
activity | 4 | 0.015 | 15.992 |
| GOTERM_MF_FAT | GO:0022803-passive
transmembrane transporter activity | 4 | 0.016 | 16.088 |
| GOTERM_MF_FAT | GO:0046872-metal
ion binding | 11 | 0.020 | 20.008 |
| GOTERM_MF_FAT | GO:0043169-cation
binding | 11 | 0.021 | 21.264 |
| GOTERM_MF_FAT | GO:0043167-ion
binding | 11 | 0.024 | 23.361 |
| GOTERM_MF_FAT |
GO:0004435-phosphoinositide phospholipase
C activity | 2 | 0.032 | 30.645 |
| GOTERM_MF_FAT | GO:0031420-alkali
metal ion binding | 3 | 0.035 | 32.899 |
| GOTERM_MF_FAT |
GO:0004629-phospholipase C activity | 2 | 0.040 | 36.483 |
Discussion
Gliomas are the most common malignant tumors of the
brain, but the molecular mechanisms underlying the progression of
gliomas remain unclear (25). In the
present study, a bioinformatics approach was used to predict
potential therapeutic targets and explore the possible molecular
mechanisms involved. A total of 79 DEGs associated with caspase
inhibition were identified. By constructing a transcriptional
regulatory network and performing analysis of risk sub-pathways and
survival analysis of key methylation sites, we identified key genes
and pathways were identified, including GRM2, ITPKA
and inositol phosphate metabolism.
GRM2 is a protein-coupled receptor, and is
associated with diseases that include schizophrenia (26). GRM2 is expressed in the foetal
and the adult brain, and is associated with inhibition of the
cyclic adenosine monophosphate pathway (27). Meldrum et al (28) demonstrated that L-glutamate activates
metabotropic glutamate receptors and functions as the main
excitatory neurotransmitter in the central nervous system. Ullian
et al (29) revealed that
glutamate receptors may be involved in synaptogenesis or synaptic
stabilization. Glutamatergic neurotransmission has been reported to
participate in the majority of normal brain functions (30). Furthermore, previous studies have
demonstrated that glioma is a primary central nervous system
associated cancer (31,32). According to a previous study, the
downregulation of GRM2 may be caused by methylation in the
promoter, and GRM2 downregulation may promote the
progression of gliomas (33). In the
present study, GRM2 was downregulated in glioma cells, and 8
methylation sites were identified in the promoter region of
GRM2. Transcriptional regulatory networks revealed that
methylation in the promoter of GRM2 may influence the
binding of 8 transcription factors. Furthermore, GRM2 may be
a potential therapeutic target in the treatment of gliomas. Arcella
et al (34) revealed that
pharmacological blockade of group II metabotropic glutamate
receptors reduced the growth of glioma cells in vivo.
Inositol phosphate metabolism was the selected
sub-pathway in the present study. Tilly et al (35) demonstrated that stimulation of human
epidermoid carcinoma cells using bradykinin, results in very rapid
release of inositol phosphates. Lee et al (36) revealed that changes in inositol
phosphate metabolism are associated with neoplasia in mouse
keratinocytes. Mishra et al (37) demonstrated that inositol phosphates
trigger numerous cellular processes by regulating calcium release
from internal stores. Another previous study revealed that calcium
imbalance is associated with gastric cancer (38). The results of the present study
provide evidence that inositol phosphate metabolism was the
enriched pathway associated with methylation-induced gene
silencing. Thus, inositol phosphate metabolism may be a potential
candidate pathway for the treatment of gliomas.
ITPKA is responsible for regulating a large
number of inositol polyphosphates that are important in cellular
signaling (39). Kato et al
(39) indicated that ITPKA was
downregulated in oral squamous cell carcinoma, and may be a
potential novel molecular target. Windhorst et al (40) demonstrated that ITPKA was a
novel cell motility-promoting protein that increased the metastatic
potential of tumor cells. In the present study, ITPKA was
downregulated and was enriched in the inositol phosphate metabolism
pathway. Survival analysis revealed the survival time of patients
with lower methylation levels in cg00157228 was longer than
patients with higher methylation levels in cg00157228. ITPKA
was the nearest gene to cg00157228. Taken together, these results
indicated that downregulation of ITPKA due to methylation in
cg00157228 may be a potential molecular mechanism involved in the
development of gliomas, and may be a potential therapeutic target
for novel treatments.
In conclusion, GRM2, ITPKA and
inositol phosphate metabolism may contribute to the progression of
gliomas. Furthermore, the present study provides an additional
mechanism underlying methylation-induced gliomas, which is that
methylation results in the dysregulation of specific transcripts.
However, further experiments are required to confirm these
results.
References
|
1
|
Mamelak AN and Jacoby DB: Targeted
delivery of antitumoral therapy to glioma and other malignancies
with synthetic chlorotoxin (TM-601). Expert Opin Drug Deliv.
4:175–186. 2007. View Article : Google Scholar : PubMed/NCBI
|
|
2
|
Goodenberger ML and Jenkins RB: Genetics
of adult glioma. Cancer Genet. 205:613–621. 2012. View Article : Google Scholar : PubMed/NCBI
|
|
3
|
Osoba D, Brada M, Prados MD and Yung WK:
Effect of disease burden on health-related quality of life in
patients with malignant gliomas. Neuro Oncol. 2:221–228. 2000.
View Article : Google Scholar : PubMed/NCBI
|
|
4
|
Tym R: Piloid gliomas of the anterior
optic pathways. Br J Surg. 49:322–331. 1961. View Article : Google Scholar : PubMed/NCBI
|
|
5
|
Gutin PH, Phillips TL, Wara WM, Leibel SA,
Hosobuchi Y, Levin VA, Weaver KA and Lamb S: Brachytherapy of
recurrent malignant brain tumors with removable high-activity
iodine-125 sources. J Neurosurg. 60:61–68. 1984. View Article : Google Scholar : PubMed/NCBI
|
|
6
|
Yung WK, Kyritsis AP, Gleason MJ and Levin
VA: Treatment of recurrent malignant gliomas with high-dose
13-cis-retinoic acid. Clin Cancer Res. 2:1931–1935.
1996.PubMed/NCBI
|
|
7
|
Furnari FB, Fenton T, Bachoo RM, Mukasa A,
Stommel JM, Stegh A, Hahn WC, Ligon KL, Louis DN, Brennan C, et al:
Malignant astrocytic glioma: Genetics, biology, and paths to
treatment. Genes Dev. 21:2683–2710. 2007. View Article : Google Scholar : PubMed/NCBI
|
|
8
|
Herman JG, Latif F, Weng Y, Lerman MI,
Zbar B, Liu S, Samid D, Duan DS, Gnarra JR, Linehan WM, et al:
Silencing of the VHL tumor-suppressor gene by DNA methylation in
renal carcinoma. Proc Natl Acad Sci USA. 91:9700–9704. 1994.
View Article : Google Scholar : PubMed/NCBI
|
|
9
|
Antequera F and Bird A: Number of CpG
islands and genes in human and mouse. Proc Natl Acad Sci USA.
90:11995–11999. 1993. View Article : Google Scholar : PubMed/NCBI
|
|
10
|
Jones PA and Buckley JD: The role of DNA
methylation in cancer. Adv Cancer Res. 54:1–23. 1990. View Article : Google Scholar : PubMed/NCBI
|
|
11
|
Costello JF, Berger MS, Huang HS and
Cavenee WK: Silencing of p16/CDKN2 expression in human gliomas by
methylation and chromatin condensation. Cancer Res. 56:2405–2410.
1996.PubMed/NCBI
|
|
12
|
Skiriute D, Vaitkiene P, Saferis V,
Asmoniene V, Skauminas K, Deltuva VP and Tamasauskas A: MGMT,
GATA6, CD81, DR4 and CASP8 gene promoter methylation in
glioblastoma. BMC Cancer. 12:2182012. View Article : Google Scholar : PubMed/NCBI
|
|
13
|
Spiegl-Kreinecker S, Pirker C, Filipits M,
Lötsch D, Buchroithner J, Pichler J, Silye R, Weis S, Micksche M,
Fischer J and Berger W: O6-Methylguanine DNA methyltransferase
protein expression in tumor cells predicts outcome of temozolomide
therapy in glioblastoma patients. Neuro Oncol. 12:28–36. 2010.
View Article : Google Scholar : PubMed/NCBI
|
|
14
|
Chen HY, Shao CJ, Chen FR, Kwan AL and
Chen ZP: Role of ERCC1 promoter hypermethylation in drug resistance
to cisplatin in human gliomas. Int J Cancer. 126:1944–1954.
2010.PubMed/NCBI
|
|
15
|
Barrett T, Troup DB, Wilhite SE, Ledoux P,
Evangelista C, Kim IF, Tomashevsky M, Marshall KA, Phillippy KH,
Sherman PM, et al: NCBI GEO: Archive for functional genomics data
sets-10 years on. Nucleic Acids Res. 39:(Database Issue).
D1005–D1010. 2011. View Article : Google Scholar : PubMed/NCBI
|
|
16
|
Crookston NL and Finley AO: Yaimpute: An r
package for knn imputation. J Statistical Software. 23:1–16. 2008.
View Article : Google Scholar
|
|
17
|
Bolstad BM and Bolstad MBM: Package
‘preprocessCore’. 2013.
|
|
18
|
Smyth GK: Limma: Linear models for
microarray dataStatistics for Biology and Health: Bioinformatics
and Computational Biology Solutions using R and Bioconductor.
Gentleman R, Carey V, Huber W, Irizarry R and Dudoit S: Springer;
New York: pp. 397–420. 2005, View Article : Google Scholar
|
|
19
|
Karolchik D, Barber GP, Casper J, Clawson
H, Cline MS, Diekhans M, Dreszer TR, Fujita PA, Guruvadoo L,
Haeussler M, et al: The UCSC genome browser database: 2014 Update.
Nucleic Acids Res. 42:(Database Issue). D764–D770. 2014. View Article : Google Scholar : PubMed/NCBI
|
|
20
|
Shannon P, Markiel A, Ozier O, Baliga NS,
Wang JT, Ramage D, Amin N, Schwikowski B and Ideker T: Cytoscape: A
software environment for integrated models of biomolecular
interaction networks. Genome Res. 13:2498–2504. 2003. View Article : Google Scholar : PubMed/NCBI
|
|
21
|
Hulsegge I, Kommadath A and Smits MA:
Globaltest and GOEAST: Two different approaches for Gene Ontology
analysis. BMC Proc. 3 Suppl 4:S102009. View Article : Google Scholar : PubMed/NCBI
|
|
22
|
Ogata H, Goto S, Sato K, Fujibuchi W, Bono
H and Kanehisa M: KEGG: Kyoto encyclopedia of genes and genomes.
Nucleic Acids Res. 27:29–34. 1999. View Article : Google Scholar : PubMed/NCBI
|
|
23
|
Dennis G Jr, Sherman BT, Hosack DA, Yang
J, Gao W, Lane HC and Lempicki RA: DAVID: Database for annotation,
visualization and integrated discovery. Genome Biol. 4:P32003.
View Article : Google Scholar : PubMed/NCBI
|
|
24
|
Li C and Li MC: Package ‘iSubpathway
Miner’. 2013.
|
|
25
|
Chakravarti A, Zhai GG, Zhang M, Malhotra
R, Latham DE, Delaney MA, Robe P, Nestler U, Song Q and Loeffler J:
Survivin enhances radiation resistance in primary human
glioblastoma cells via caspase-independent mechanisms. Oncogene.
23:7494–7506. 2004. View Article : Google Scholar : PubMed/NCBI
|
|
26
|
Joo A, Shibata H, Ninomiya H, Kawasaki H,
Tashiro N and Fukumaki Y: Structure and polymorphisms of the human
metabotropic glutamate receptor type 2 gene (GRM2): Analysis of
association with schizophrenia. Mol Psychiatry. 6:186–192. 2001.
View Article : Google Scholar : PubMed/NCBI
|
|
27
|
Flor PJ, Lindauer K, Püttner I, Rüegg D,
Lukic S, Knöpfel T and Kuhn R: Molecular cloning, functional
expression and pharmacological characterization of the human
metabotropic glutamate receptor type 2. Eur J Neurosci. 7:622–629.
1995. View Article : Google Scholar : PubMed/NCBI
|
|
28
|
Meldrum BS: Glutamate as a
neurotransmitter in the brain: Review of physiology and pathology.
J Nutr. 130 4S Suppl:1007S–1015S. 2000.PubMed/NCBI
|
|
29
|
Ullian EM, Christopherson KS and Barres
BA: Role for glia in synaptogenesis. Glia. 47:209–216. 2004.
View Article : Google Scholar : PubMed/NCBI
|
|
30
|
Bezzi P and Volterra A: A neuron-glia
signalling network in the active brain. Curr Opin Neurobiol.
11:387–394. 2001. View Article : Google Scholar : PubMed/NCBI
|
|
31
|
Giese A and Westphal M: Glioma invasion in
the central nervous system. Neurosurgery. 39:235–250. 1996.
View Article : Google Scholar : PubMed/NCBI
|
|
32
|
Longo AM and Penhoet EE: Nerve growth
factor in rat glioma cells. Proceedings of the National Academy of
Sciences. 71:2347–2349. 1974. View Article : Google Scholar
|
|
33
|
Kordi-Tamandani DM, Dahmardeh N and
Torkamanzehi A: Evaluation of hypermethylation and expression
pattern of GMR2, GMR5, GMR8 and GRIA3 in patients with
schizophrenia. Gene. 515:163–166. 2013. View Article : Google Scholar : PubMed/NCBI
|
|
34
|
Arcella A, Carpinelli G, Battaglia G,
D'Onofrio M, Santoro F, Ngomba RT, Bruno V, Casolini P, Giangaspero
F and Nicoletti F: Pharmacological blockade of group II
metabotropic glutamate receptorsreduces the growth of glioma cells
in vivo. Neuro Oncol. 7:236–245. 2005. View Article : Google Scholar : PubMed/NCBI
|
|
35
|
Tilly BC, van Paridon PA, Verlaan I, Wirtz
KW, de Laat SW and Moolenaar WH: Inositol phosphate metabolism in
bradykinin-stimulated human A431 carcinoma cells. Relationship to
calcium signalling. Biochem J. 244:129–135. 1987. View Article : Google Scholar : PubMed/NCBI
|
|
36
|
Lee E and Yuspa SH: Changes in inositol
phosphate metabolism are associated with terminal differentiation
and neoplasia in mouse keratinocytes. Carcinogenesis. 12:1651–1658.
1991. View Article : Google Scholar : PubMed/NCBI
|
|
37
|
Mishra J and Bhalla US: Simulations of
inositol phosphate metabolism and its interaction with
InsP3-mediated calcium release. Biophys J. 83:1298–1316. 2002.
View Article : Google Scholar : PubMed/NCBI
|
|
38
|
El-Rifai W, Moskaluk CA, Abdrabbo MK,
Harper J, Yoshida C, Riggins GJ, Frierson HF Jr and Powell SM:
Gastric cancers overexpress S100A calcium-binding proteins. Cancer
Res. 62:6823–6826. 2002.PubMed/NCBI
|
|
39
|
Kato H, Uzawa K, Onda T, Kato Y, Saito K,
Nakashima D, Ogawara K, Bukawa H, Yokoe H and Tanzawa H:
Down-regulation of 1D-myo-inositol 1,4,5-trisphosphate 3-kinase A
protein expression in oral squamous cell carcinoma. Int J Oncol.
28:873–881. 2006.PubMed/NCBI
|
|
40
|
Windhorst S, Fliegert R, Blechner C,
Möllmann K, Hosseini Z, Günther T, Eiben M, Chang L, Lin HY, Fanick
W, et al: Inositol 1,4,5-trisphosphate 3-kinase-A is a new cell
motility-promoting protein that increases the metastatic potential
of tumor cells by two functional activities. J Biol Chem.
285:5541–5554. 2010. View Article : Google Scholar : PubMed/NCBI
|