Introduction
Primary liver cancer is a relatively common
malignant tumor. Intrahepatic cholangiocarcinoma and hepatocellular
carcinoma are the most frequent types. They are characterized by
insidious onset, rapid progression, low surgical resection rate,
high degree of malignancy, and high recurrence rate (1,2). Primary
liver cancer has an excessively poor prognosis, the mortality rate
of which ranks third among malignant tumors. If untreated, the
survival time of patients is generally about three months. Once the
symptoms of liver cancer appear, it often has already reached the
advanced stage. Therefore, early diagnosis and timely treatment are
key for prolonging the survival time of patients (3,4). In recent
years, imaging techniques have continuously developed. Imaging
plays important roles in the diagnosis and treatment as well as
follow-up of primary liver cancer. CT perfusion examination is a
technique that is combined with traditional morphological imaging,
which can determine the scope and size of the focus as well as
changes in the surrounding organs. It can also measure tissue blood
perfusion and capillary permeability (5). The changes of local and whole blood flow
(BF) of the liver can be accurately observed by MRI perfusion
imaging techniques, which can perform scans from multiple angles,
with high sensitivity and no radiation damage (6). In this study, 63 patients with liver
cancer were examined by CT and MRI, and the application values of
CT perfusion imaging and MRI for the diagnosis of primary liver
cancer were investigated. The details are below.
Patients and methods
Patients
Sixty-three patients with primary liver cancer who
were admitted to the Affiliated Hospital of Weifang Medical
University from February 2015 to May 2016 were randomly included.
Inclusion criteria: i) patients who were diagnosed with primary
liver cancer by surgery and pathology, ii) patients who had not
undergone related antitumor therapies before CT and MRI
examinations, including radiofrequency ablation, interventional
embolization, chemotherapy, and radiotherapy, iii) patients who
underwent CT and MRI examinations and iv) patients who signed the
informed consent. Exclusion criteria: i) patients who had
contraindications of CT and MRI scans, ii) patients who had
intrahepatic and extrahepatic metastases and iii) patients who were
complicated with mental, neurological, or other disorders. The
general parameters of patients are shown in Table I. This study was approved by the
Ethics Committee of the Affiliated Hospital of Weifang Medical
University. Signed written informed consents were obtained from all
participants before the study.
 | Table I.Basic parameters of patients. |
Table I.
Basic parameters of patients.
| Parameter | Subject (n=63) |
|---|
| Mean age (years) | 61.78±6.54 |
| Sex
(male/female) | 38/25 |
| Mean diameter of foci
(cm) | 5.76±2.48 |
| Multiple tumors (n,
%) | 17 (26.98) |
| Single tumor (n,
%) | 46 (73.02) |
| Education degree (n,
%) |
|
| Junior
middle school and below | 9
(14.28) |
| Senior
middle school and technical secondary school | 32 (50.79) |
| Junior
college and above | 22 (34.92) |
Preparation before examination
Patients were required to fast for 6 h before CT
examination, and they were then informed of matters related to the
examination. Breathing training (uniform, calm, shallow, and slow
breathing) was provided for patients to avoid changes in the
frequency of breathing resulting in poor image quality. The 18G
intravenous detaining needle was embedded in advance, and patients
were guided to drink 600 ml of warm water at 30 min before scanning
to fill the gastrointestinal tract.
CT examination
Patients were instructed to remove metallic foreign
bodies, and maintain the supine position with hands raised on both
sides of the headrest. A dual-source CT scanner (Siemens, München,
Germany) was adopted to perform liver plain scan (tube voltage, 12
kV; tube current, 150 mAs; matrix, 512×512; alignment, 128×0.6 mm;
and rotation time, 0.5 sec). After the scan was completed, the
extent of foci and the plane that could display the largest lesions
were determined. Perfusion examination was taken on the focus
center layer which was selected as the targeted plane. An
appropriate amount of water was provided for subjects to hydrate
the injected contrast agent. Patients then took the same position
as previously described, and were bound with compression by the
abdominal belt of the instrument. Patients were told to maintain
thoracic breathing, followed by injection with contrast agent using
a high pressure automatic injector [50 ml (300 mg/ml) iohexol (GE
Healthcare, Dublin, Ireland; Approval No. Import Drug Registration
Certificate No. H20090811)], with injection velocity of 5 ml/sec.
The perfusion scan was conducted at 6 sec after injection. Before
the beginning of the scan, patients were required to deeply inhale,
followed by holding their breath for 30 sec, and the scan was taken
once per second, for a total of 30 times. Body PCT model was
selected for the equipment (tube current, 110 mAs; matrix, 512×512;
alignment, 2×32×1.2 mm; rotation time, 0.28 sec; and tube voltage,
80 kV). Image analysis and processing: the scanned images were
transmitted to the processing workstation, and the perfusion plane
that was clear and with minimal motion artifact was selected for
analysis, followed by processing using the related software. The
BF, blood volume (BV), permeability surface (PS), mean transit time
(MTT), and hepatic arterial fraction (HAF) were calculated.
MRI examination
Patients were instructed to take supine position.
First, an MR 3.0T HDX TwinSp Scanner (GE Healthcare, Little
Chalfont, Buckinghamshire, UK) was used for routine scans. Scan
extent: scanning of the whole liver, from the upper edge to the
inferior edge of the liver. Routine sequence scan for the pelvic
cavity was performed: i) conventional cross-section T1WI (TR, 106
msec; TE, 4.8 msec; matrix, 134×256; FOV, 35×35 cm; layer distance,
2.4 mm; slice thickness, 8 mm; layer no. 20), imaging time, 28 sec;
ii) sagittal plane T2WI (TR, 4,000 msec; TE, 100 msec; matrix,
230×256; FOV, 20×20 cm; layer distance, 0.6 mm; slice thickness,
3.0 mm; layer no. 19), imaging time, 3 min 42 sec; iii)
high-resolution cross-section T2WI (TR, 6,620 msec; TE, 124 msec;
matrix, 246×512; FOV, 20×20 cm; layer distance, 0.8 mm; slice
thickness, 4.0 mm; layer no. 19), imaging time, 4 min 6 sec and iv)
coronal T2WI (TR, 6,410 msec; TE, 124 msec; matrix, 246×512; FOV,
20×20 cm; layer distance, 0.8 mm; slice thickness, 4.0 mm; layer
no. 19), imaging time, 5 min 16 sec. Perfusion-weighted imaging
(PWI) was conducted after the routine scan. By adopting a nuclear
magnetic resonance double-tube high-pressure injector, 0.2 mmol/kg
gadolinium-diethylenetriamine pentaacetic acid (Gd-DTPA; GE
Healthcare; Approval No. Import Drug Registration Certificate No.
H20100008) was injected with 2 ml/sec flow velocity in the first
tube, while 20 ml of normal saline was injected in the second tube.
Fat-suppressed FLASH sequence was adopted for scanning coronal and
cross sections: i) related parameters of PWI fat-suppressed FLASH
(TR, 210 msec; TE, 1.2 msec; matrix, 256×208; FOV, 28×21 cm; layer
distance, 4.0 mm; slice thickness; 8.0 mm; flip angle, 20°; layer
no. 4; imaging time, 20 sec and ii) technique parameters of
perfusion imaging (TR, 107 msec; TE, 4.8 msec; matrix, 512×384;
FOV, 36×27 cm; layer distance, 4.0 mm; slice thickness, 8.0 mm;
layer no. 20; imaging time, 40 sec).
Evaluation indexes
Images were jointly read by two senior imaging
physicians using a double-blinded method. Diagnostic accuracy rates
were compared among different examination methods. Diagnostic
accuracy rate = detection number from diagnosis/final diagnosis
number ×100%. The parameters of dual-source CT perfusion included:
i) BF volume passing through vascular structure and a certain
amount of tissues per unit time; ii) BV in vascular structure and a
certain amount of tissues; iii) PS, unidirectional transmission of
contrast agent from capillary endothelium to intercellular space;
iv) MTT, time of contrast agent flowing through vascular structure;
and v) HAF of blood supply.
Processing of MRI data
The images were treated by processing software. The
single layer with the largest number of tumor foci was selected, in
which locations of enhancement areas containing mass, aorta,
spleen, and necrotic tissue were measured, respectively, and portal
venous perfusion (PVP), hepatic perfusion index (HPI), hepatic
arterial perfusion (HAP), and total liver perfusion (TLP) were
obtained.
Statistical analysis
SPSS19.0 (SPSS, Inc., Chicago, IL, USA) software was
used for data analysis. Numerical data are presented as mean ±
standard deviation and compared by t-test; CT, MRI, and combination
of the two diagnostic methods were analyzed by ROC curves.
P<0.05 was considered statistically significant.
Results
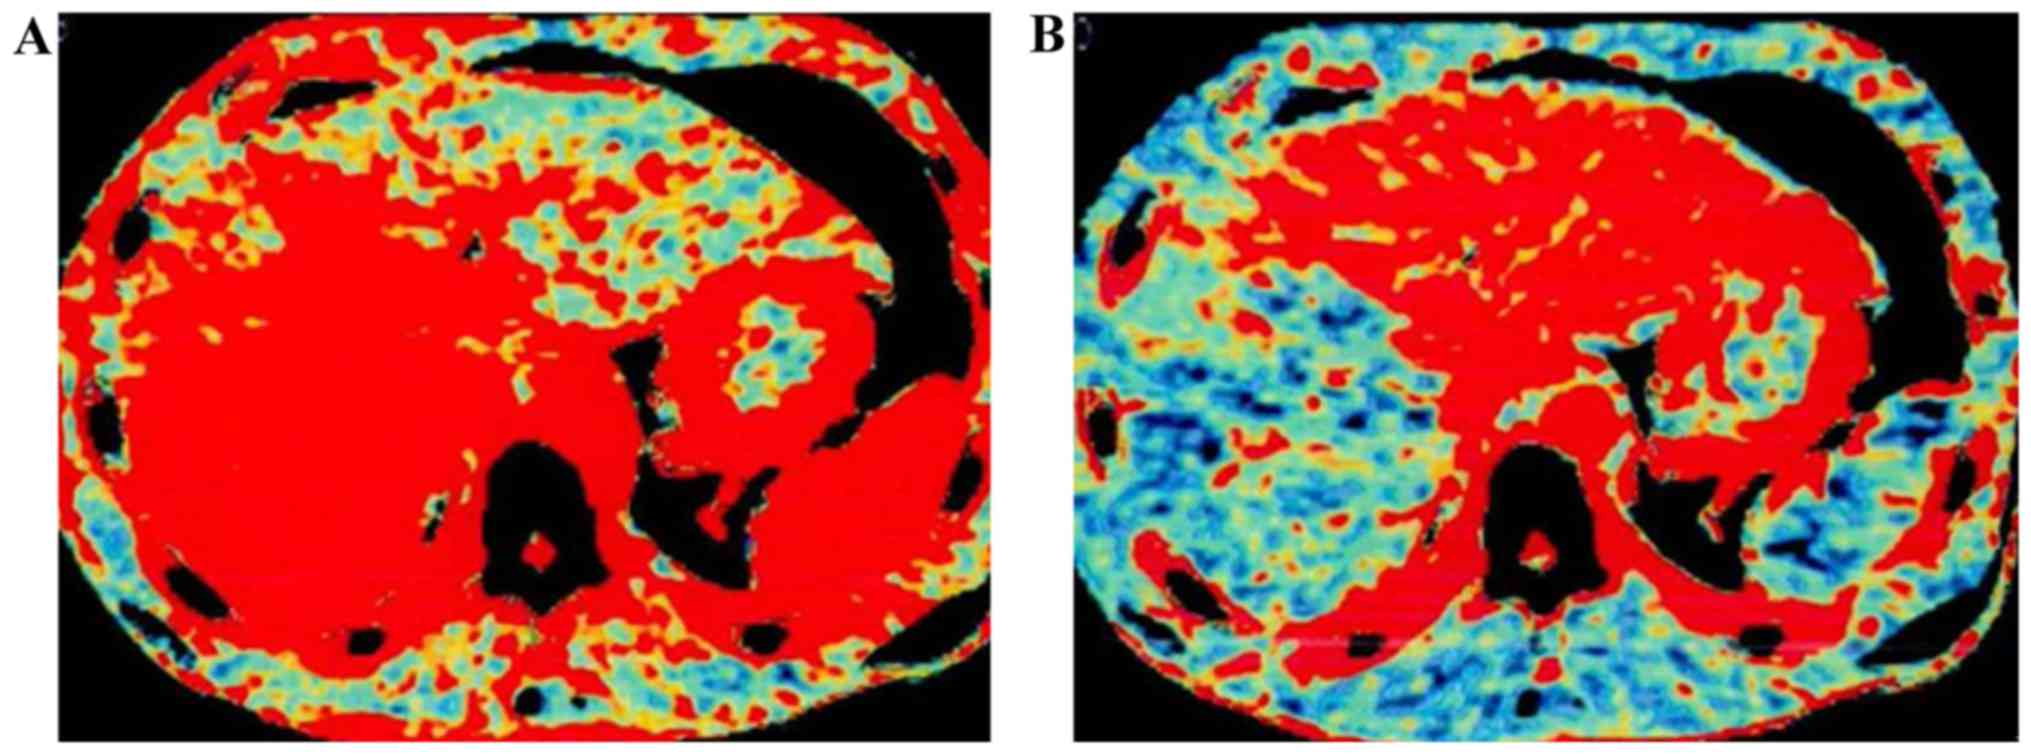
Analysis of CT perfusion images
The CT perfusion images via level assignment
revealed that the hyperchromatic degree of the focus center was
significantly higher than that of normal liver parenchyma in the
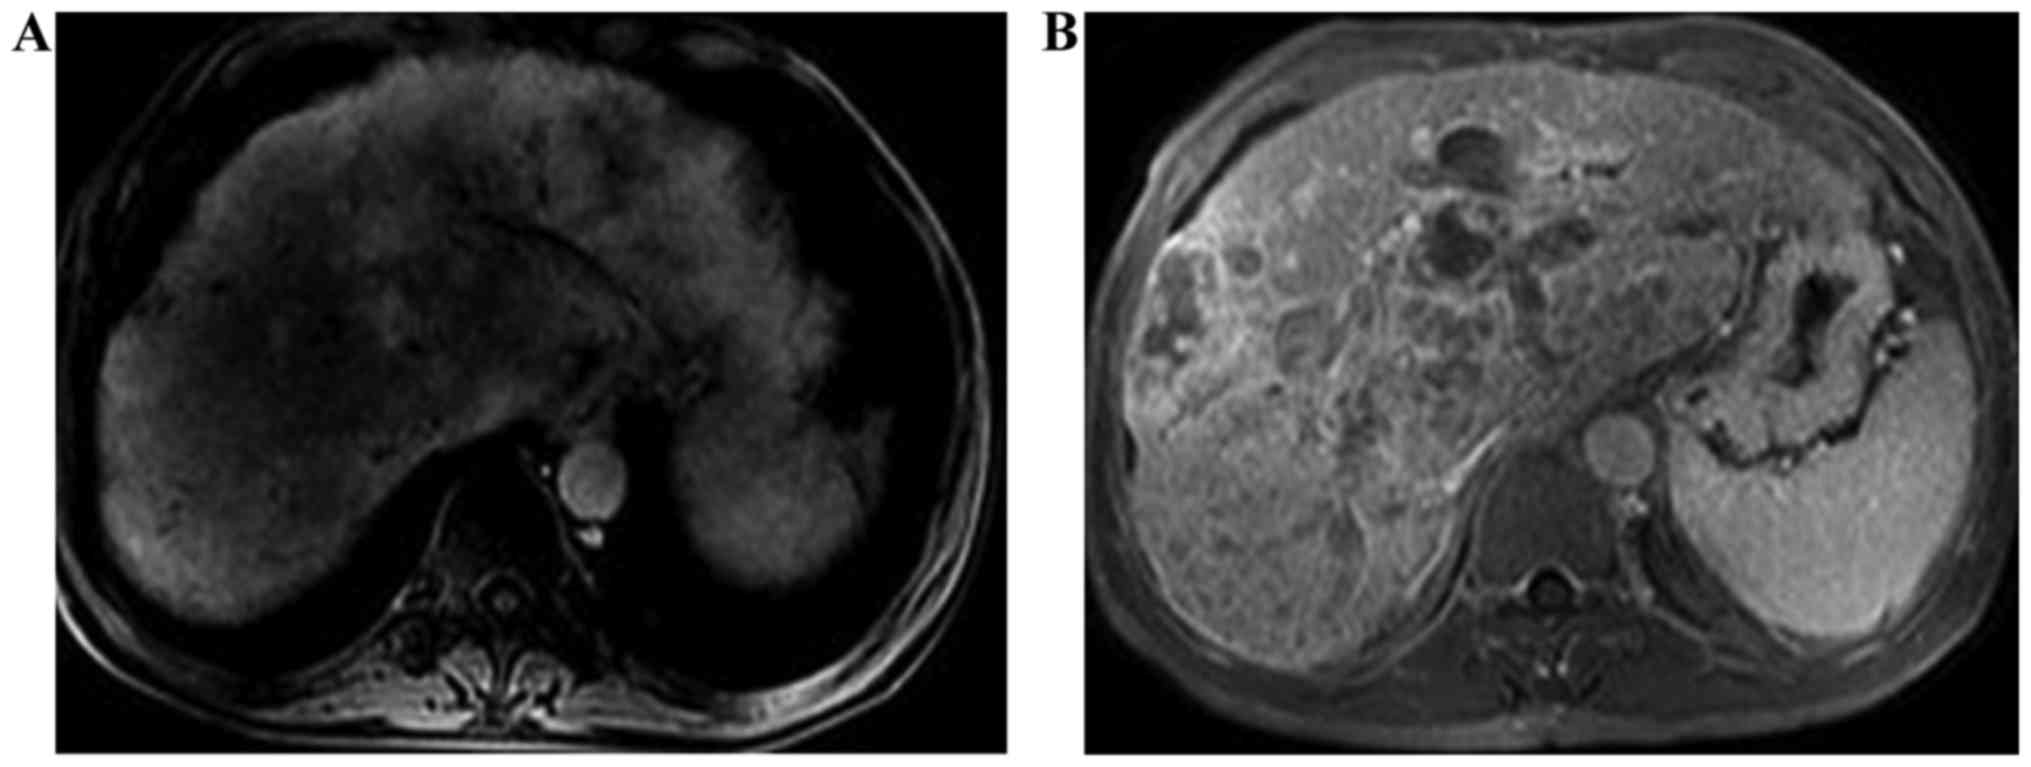
distance (Fig. 1); PVP images of
liver cancer of MRI perfusion showed that the perfusion of the
focus was reduced and there was no clear boundary between the focus
and surrounding liver parenchyma (Fig.
2A); HAP of liver cancer of MRI perfusion showed that
hyperperfusion was observable in tumors (Fig. 2B).
Analysis of parameters after
dual-source CT perfusion scanning
There were no significant differences in PS and MTT
between the focus center and normal liver parenchyma (P>0.05);
BF, BV, and HAF of the focus center were significantly higher than
those of normal liver parenchyma (P<0.05; Table II).
| Table II.Comparisons of CT perfusion parameters
in patients between the two groups. |
Table II.
Comparisons of CT perfusion parameters
in patients between the two groups.
| Group | Case | BF (ml/100
ml/min) | BV (ml/l) | MTT (sec) | HAF | PS (0.5 ml/100
ml/min) |
|---|
| Focus center | 63 | 121.65±21.43 | 175.68±33.26 | 143.29±13.27 | 0.35±0.07 | 112.62±14.53 |
| Normal liver
parenchyma | 63 | 79.48±9.37 | 113.45±13.63 | 145.15±12.34 | 0.13±0.04 | 113.49±14.47 |
| t-test |
| 14.311 | 13.742 | 0.815 | 24.905 | 0.337 |
| P-value |
| <0.0001 | <0.0001 | 0.4168 | <0.0001 | 0.7369 |
Comparisons of MRI perfusion
parameters in patients between the two groups
The results of MRI examination showed that HAP and
HPI of the focus center were significantly higher than those of
normal liver parenchyma; PVP of the focus center was significantly
lower than that of normal liver parenchyma (P<0.05); the
difference in TLP between the focus center and normal liver
parenchyma was not significant (P>0.05; Table III).
| Table III.Comparisons of MRI perfusion
parameters in patients between the two groups. |
Table III.
Comparisons of MRI perfusion
parameters in patients between the two groups.
| Group | Case | PVP (ml/100
ml/min) | HAP (ml/100
ml/min) | HPI (%) | TLP (ml/100
ml/min) |
|---|
| Focus center | 63 | 8.63±2.42 | 45.64±7.25 | 84.26±3.23 | 58.52±8.43 |
| Normal liver
parenchyma | 63 | 23.43±8.34 | 33.47±6.62 | 58.18±2.37 | 60.69±8.48 |
| t-test |
| 13.527 | 9.839 | 51.671 | 1.440 |
| P-value |
| <0.0001 | <0.0001 | <0.0001 | 0.1523 |
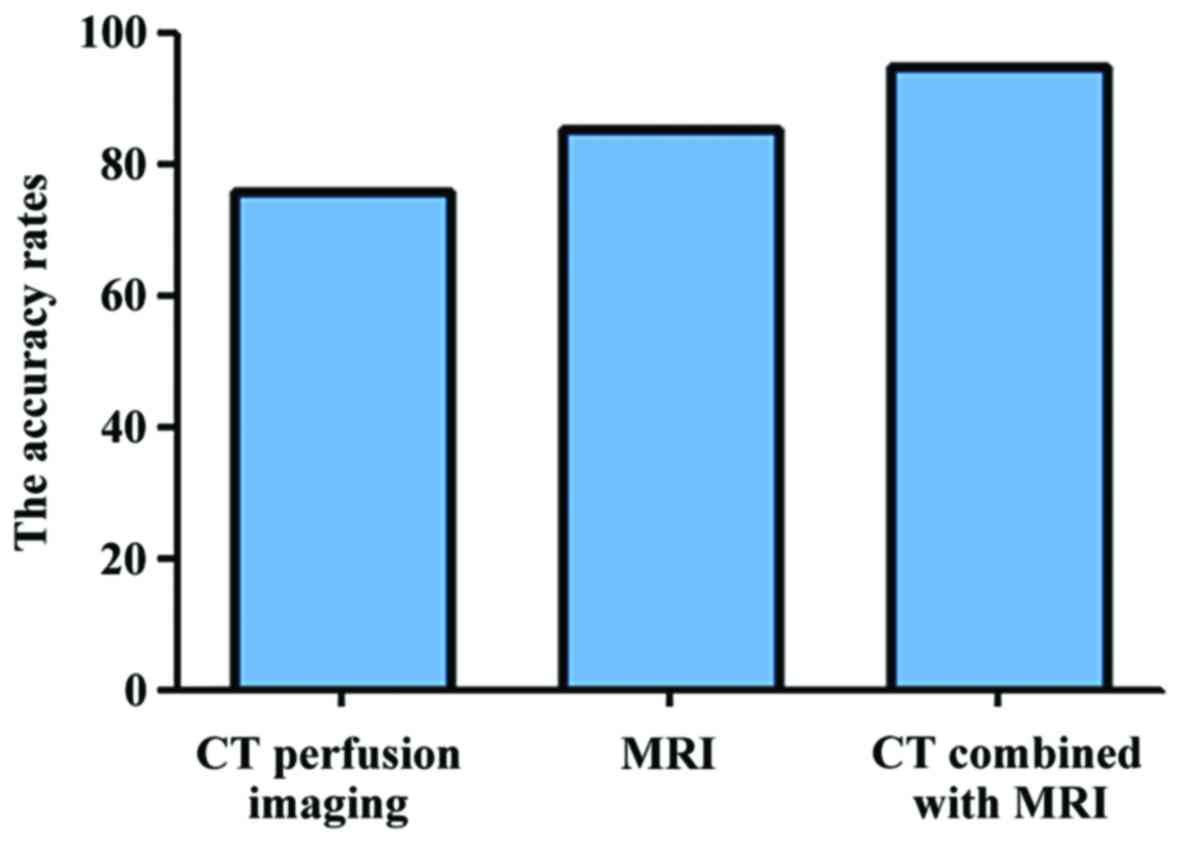
Comparisons of accuracy rates of
different detection methods for primary liver cancer
The accuracy rates of dual-source CT perfusion
imaging, MRI examination, and combined examination of CT and MRI
for primary liver cancer were 76.19% (48/63), 85.71% (54/63) and
95.24% (60/63), respectively; the differences were statistically
significant (P<0.05; Fig. 3).
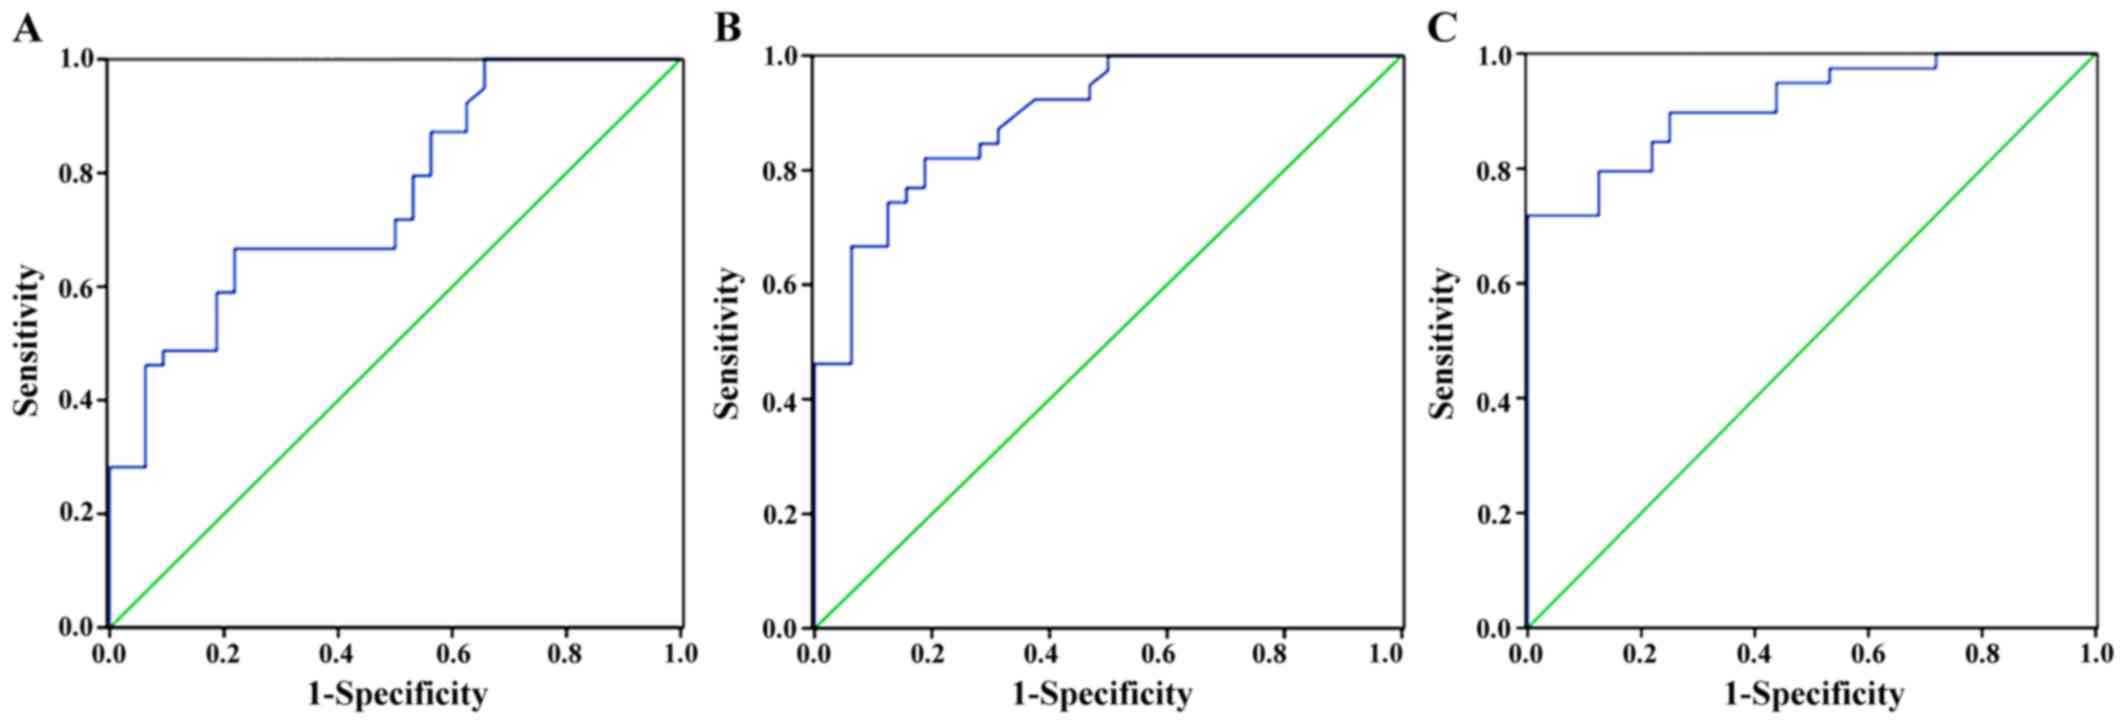
Diagnosis of primary liver cancer
The area under the curve of CT perfusion imaging
examination was 0.753 (P<0.05), the sensitivity was 79.2%, and
the specificity was 74.7%; the area under the curve of MRI was
0.846 (P<0.05), the sensitivity was 84.6%, and the specificity
was 80.5%; the area under the curve of CT combined with MRI was
0.947 (P<0.05), the sensitivity was 94.6%, and the specificity
was 86.5% (Fig. 4).
Discussion
Primary liver cancer is a tumor with enrichment of
blood vessels, which generally manifests as liver pain, anorexia,
ascites, fatigue, weight loss, jaundice, and other clinical
symptoms. In severe cases, coma and systemic failure can occur
(7). The liver is a unique organ
whose blood can be doubly supplied by the portal vein and hepatic
artery. The portal vein is the main blood supply pathway in the
normal state, while blood supply from the hepatic artery plays an
important role in angiogenesis during the occurrence and
progression of primary liver cancer (8). A large number of proangiogenic growth
factors can be secreted by liver tumor tissue, which leads to
intrastromal blood sinus formation with gradual vascularization,
and shows uncontrolled growth, thereby causing the gradual increase
of hepatic artery blood supply and the gradual decrease of portal
blood supply, ultimately resulting in high arterial blood supply
(9). The diagnosis of primary liver
cancer is usually performed by direct and rapid imaging
examinations in clinical practice, including color Doppler
ultrasonography, CT, and MRI (10).
Ultrasonography has the advantages of no trauma, no pain, quick and
simple inspection, and repeatability. However, it also has
disadvantages, such as low resolution, and sensitivity to the
effects of the heartbeat or intestinal gas (the left half of the
liver is greatly affected). In addition, ultrasonography is not
sensitive to lesions with low blood-flow perfusion or lack of blood
supply. Therefore, examinations using CT and MRI for diagnosis are
mainly adopted in clinical practice (11).
Perfusion refers to oxygen and nutrients being
transported to tissues and cells by BF through capillary networks,
and can reflect the hemodynamics and functions of organs and
tissues (12). The earliest
investigations involving nuclear medicine were aimed at local
tissue perfusion imaging. CT perfusion imaging was first proposed
in the 1990s. It involves intravenous bolus injection of a contrast
agent, and single-level dynamic scanning of the selected layers to
obtain time-density curves (TDC) that reflect BF characteristics;
BF, BV, MTT, PS. Other perfusion parameters are calculated by
related professional software according to TDC, followed by level
assignment to form perfusion images, which can observe the border
and essence of the focus, and directly and comprehensively
determine whether there is necrosis and other aspects of the focus.
In addition, it can determine vascular characteristics and BF
perfusion characteristics (13).
Perfusion imaging techniques have been continuously developed in
recent years. Scanning speed, imaging coverage area, and scanning
methods have changed greatly (14).
By adopting a second-generation dual-source CT scanner (Siemens) to
conduct perfusion imaging and scans in this study, we showed that
the hyperchromatic degree of the focus center was significantly
higher than that of normal liver parenchyma in the distance.
Through analysis of perfusion parameters, the BF and BV values were
121.65±21.43 ml/100 ml/min and 175.68±33.26 ml/l, respectively in
the focus center, and 79.48±9.37 ml/100 ml/min and 113.45±13.63
ml/l, respectively, in normal liver parenchyma. The values of the
two parameters in the focus center were significantly higher than
those in normal liver parenchyma, which was because of incomplete
basement membranes of new vessels with irregular morphology, high
vascular permeability, small vascular resistance, and large BF.
Therefore, when contrast agent passes through new tumor vessels,
the amount and flow rate of contrast agent per unit volume will
elevate simultaneously, thereby increasing BF and BV (15). The MTT and PS values in the focus
center were 143.29±13.27 sec and 112.62±14.53, 0.5 ml/100 ml/min,
respectively. The MTT and PS values of the normal liver parenchyma
were 145.15±12.34 sec and 113.49±14.47, 0.5 ml/100 ml/min,
respectively. The differences with these two parameters were not
significant (P>0.05). During CT perfusion examination, because
of the often inadequate cooperation of breathing in patients, the
drift phenomenon of images occurs easily, sometimes resulting in
the images being unable to be processed. Although the demand for
radiation dose is decreasing with the continuous improvement of CT
techniques, it remains the biggest drawback, which may cause
increased risk of tumors induced by radiation in patients (16).
MRI has been applied for the diagnosis of liver
cancer since the 1980, and has the advantages of multi-parameter
imaging and high resolution of soft tissue, with no iodine allergy
and radiation hazards (17). Lesions
can primarily be observed by MRI plain scan, which provides related
information for MRI perfusion; the distribution and change of
microcirculation in tissue as well as the difference in BF
perfusion between local abnormal tissue and normal tissue can be
determined by MRI perfusion examination. Therefore, the activity
and function of local lesions can be evaluated (18). After intravenous bolus injection of
the paramagnetic contrast agent, Gd-DTPA, gradient echo signals
acquired by reverse switching of the coil is read through PWI
fat-suppressed FLASH sequences followed by excitation via a small
angle. The perfusion map shows that high perfusion can be observed
when contrast agent passes through the capillaries of tissues,
which are short T1 short T2 signals; moreover, the T2 value is
shortened more significantly (19).
The results of this study revealed that there was no significant
difference in TLP between the focus center and normal liver
parenchyma (P>0.05). HAP and HPI of the focus center were
significantly higher than those of normal liver parenchyma, but PVP
of the focus center was significantly lower than that of normal
liver parenchyma (P<0.05), which was because the blood of foci
in primary liver cancer is mainly supplied by the hepatic artery
with especially fast flow velocity, thereby increasing the
pressure. It is therefore difficult for the BF of the portal vein
to enter the focus center. Blood supplied by the portal vein is
minimal, which is the opposite to that seen in normal liver tissue.
Therefore, perfusion imaging shows relatively little perfusion in
the portal vein of the focus center, while there is more perfusion
in the hepatic artery. The HAP index is therefore higher. There are
few factors that can interfere with MRI examination, while its
image quality is only affected by breathing. Inadequate cooperation
of breathing in patients easily causes failure of examination
(20).
At present, the clinical diagnosis of primary liver
cancer is often affected by many factors, such as scanning
technique and the patients themselves, which causes atypical
imaging performance, thereby limiting diagnosis. Therefore, the
combined examination of CT and MRI is generally selected to improve
the diagnostic rate of primary liver cancer in clinical practice.
In this study, there were 60 patients confirmedly diagnosed with
primary liver cancer by the combined examination of CT and MRI,
with accuracy rate of 95.24%. The area under the curve of CT
combined with MRI was 0.947, which was significantly higher than
0.753 of CT perfusion imaging and 0.846 of MRI examination
(P<0.05). The combined examination of CT and MRI, which is
conducive to the early diagnosis and clinical staging diagnosis of
primary liver cancer, is a sensitive diagnostic method that can
promote the use of perfusion imaging in clinical practice, and no
longer only in scientific research.
In conclusion, the combined examination of CT and
MRI is superior to single CT perfusion imaging or MRI examination
for the diagnosis of primary liver cancer. It has a high clinical
application value and is worthy of wider use and application.
References
|
1
|
Younossi ZM, Otgonsuren M, Henry L,
Venkatesan C, Mishra A, Erario M and Hunt S: Association of
nonalcoholic fatty liver disease (NAFLD) with hepatocellular
carcinoma (HCC) in the United States from 2004 to 2009. Hepatology.
62:1723–1730. 2015. View Article : Google Scholar : PubMed/NCBI
|
|
2
|
Lee JM, Park JW and Choi BI: 2014
KLCSG-NCC Korea Practice Guidelines for the management of
hepatocellular carcinoma: HCC diagnostic algorithm. Dig Dis.
32:764–777. 2014. View Article : Google Scholar : PubMed/NCBI
|
|
3
|
Jemal A, Bray F, Center MM, Ferlay J, Ward
E and Forman D: Global cancer statistics. CA Cancer J Clin.
61:69–90. 2011. View Article : Google Scholar : PubMed/NCBI
|
|
4
|
Hann HW, Coben R, Brown D, Needleman L,
Rosato E, Min A, Hann RS, Park KB, Dunn S and DiMarino AJ: A
long-term study of the effects of antiviral therapy on survival of
patients with HBV-associated hepatocellular carcinoma (HCC)
following local tumor ablation. Cancer Med. 3:390–396. 2014.
View Article : Google Scholar : PubMed/NCBI
|
|
5
|
Kanda T, Yoshikawa T, Ohno Y, Fujisawa Y,
Kanata N, Yamaguchi M, Seo Y, Yano Y, Koyama H, Kitajima K, et al:
Perfusion measurement of the whole upper abdomen of patients with
and without liver diseases: Initial experience with 320-detector
row CT. Eur J Radiol. 81:2470–2475. 2012. View Article : Google Scholar : PubMed/NCBI
|
|
6
|
Vardal J, Salo RA, Larsson C, Dale AM,
Holland D, Groote IR and Bjørnerud A: Correction of B0-distortions
in echo-planar-imaging-based perfusion-weighted MRI. J Magn Reson
Imaging. 39:722–728. 2014. View Article : Google Scholar : PubMed/NCBI
|
|
7
|
Wang W, Cheng J, Qin JJ, Voruganti S, Nag
S, Fan J, Gao Q and Zhang R: RYBP expression is associated with
better survival of patients with hepatocellular carcinoma (HCC) and
responsiveness to chemotherapy of HCC cells in vitro and in vivo.
Oncotarget. 5:11604–11619. 2014. View Article : Google Scholar : PubMed/NCBI
|
|
8
|
Kim KW, Lee JM, Kim JH, Klotz E, Kim HC,
Han JK and Choi BI: CT color mapping of the arterial enhancement
fraction of VX2 carcinoma implanted in rabbit liver: comparison
with perfusion CT. AJR Am J Roentgenol. 196:102–108. 2011.
View Article : Google Scholar : PubMed/NCBI
|
|
9
|
Watanabe K and Yamamoto T, Sugimoto H and
Yamamoto T: A study on blood flow characteristics of hepatic
vein6th World Congress on Biomechanics (WCB 2010). 1–6–August.
2010, Singapore: Goh Cho, Hong J and Lim CT: 31. 1st. Springer
Berlin-Heidelberg, Berlin: pp. 1475–1478, 2010.
|
|
10
|
Hong YM, Yoon KT, Cho M, Heo J, Woo HY and
Lim W: A case of small hepatocellular carcinoma with an extensive
lymph node metastasis at diagnosis. Clin Mol Hepatol. 20:310–312.
2014. View Article : Google Scholar : PubMed/NCBI
|
|
11
|
Zha Y, Zhou M, Hari A, Jacobsen B,
Mitragotri N, Rivas B, Ventura OG, Boughton J and Fox JC:
Ultrasound diagnosis of malaria: examination of the spleen, liver,
and optic nerve sheath diameter. World J Emerg Med. 6:10–15. 2015.
View Article : Google Scholar : PubMed/NCBI
|
|
12
|
George RT, Mehra VC, Chen MY, Kitagawa K,
Arbab-Zadeh A, Miller JM, Matheson MB, Vavere AL, Kofoed KF,
Rochitte CE, et al: Myocardial CT perfusion imaging and SPECT for
the diagnosis of coronary artery disease: a head-to-head comparison
from the CORE320 multicenter diagnostic performance study.
Radiology. 272:407–416. 2014. View Article : Google Scholar : PubMed/NCBI
|
|
13
|
Kanda T, Yoshikawa T, Ohno Y, Kanata N,
Koyama H, Takenaka D and Sugimura K: CT hepatic perfusion
measurement: comparison of three analytic methods. Eur J Radiol.
81:2075–2079. 2012. View Article : Google Scholar : PubMed/NCBI
|
|
14
|
Wang R, Yu S, Alger JR, Zuo Z, Chen J,
Wang R, An J, Wang B, Zhao J, Xue R, et al: Multi-delay arterial
spin labeling perfusion MRI in moyamoya disease - comparison with
CT perfusion imaging. Eur Radiol. 24:1135–1144. 2014. View Article : Google Scholar : PubMed/NCBI
|
|
15
|
Wang Q, Shi G, Wang L, Liu X and Wu R:
Early prediction of response of sorafenib on hepatocellular
carcinoma by CT perfusion imaging: an animal study. Br J Radiol.
87:20130695. 2014. View Article : Google Scholar : PubMed/NCBI
|
|
16
|
Sahinarslan A, Erbas G, Kocaman SA, Bas D,
Akyel A, Karaer D, Ergun MA, Arac M and Boyaci B: Comparison of
radiation-induced damage between CT angiography and conventional
coronary angiography. Acta Cardiol. 68:291–297. 2013. View Article : Google Scholar : PubMed/NCBI
|
|
17
|
Ganten MK, Schuessler M, Bäuerle T,
Muenter M, Schlemmer HP, Jensen A, Brand K, Dueck M, Dinkel J,
Kopp-Schneider A, et al: The role of perfusion effects in
monitoring of chemoradiotherapy of rectal carcinoma using
diffusion-weighted imaging. Cancer Imaging. 13:548–556. 2013.
View Article : Google Scholar : PubMed/NCBI
|
|
18
|
Simonsen CZ, Madsen MH, Schmitz ML,
Mikkelsen IK, Fisher M and Andersen G: Sensitivity of diffusion-
and perfusion-weighted imaging for diagnosing acute ischemic stroke
is 97.5%. Stroke. 46:98–101. 2015. View Article : Google Scholar : PubMed/NCBI
|
|
19
|
Asayama Y, Tajima T, Nishie A, Ishigami K,
Kakihara D, Nakayama T, Okamoto D, Fujita N, Aishima S, Shirabe K,
et al: Uptake of Gd-EOB-DTPA by hepatocellular carcinoma:
radiologic-pathologic correlation with special reference to bile
production. Eur J Radiol. 80:e243–e248. 2011. View Article : Google Scholar : PubMed/NCBI
|
|
20
|
Garrett R: Solid liver masses: approach to
management from the standpoint of a radiologist. Curr Gastroenterol
Rep. 15:359. 2013. View Article : Google Scholar : PubMed/NCBI
|