Introduction
Disease-free survival in patients with breast cancer
has significantly improved since the 1990s, owing to the
combination of early breast cancer screening and a greater number
of treatment approaches, including adjuvant chemotherapy, hormonal
treatment and targeted therapy (1–3). However,
there are certain patients who are only treated with maintenance
therapy who receive an initial diagnosis of advanced-stage breast
cancer or multidrug resistance (4).
Breast cancer is the most commonly diagnosed cancer in women all
over the world, and is the first and the second cause of
cancer-associated mortality in women in developing and developed
countries, respectively (5).
Therefore, it is necessary to identify candidate biomarkers that
are associated with the development of breast cancer and
investigate therapeutic targets to provide patients with breast
cancer with treatment options.
G-protein regulating factors negatively regulate the
recycling of G-protein-coupled receptors; these factors accelerate
GTP hydrolysis by binding to the α-subunit of a heterotrimeric G
protein to deactivate G-protein signaling (6,7). With
regard to malignant tumors, regulator of G-protein signaling 2
(RGS2) is one of the most well-characterized RGS genes. RGS2 can
also inhibit the translation of mRNA into protein by binding to the
ε-subunit of eukaryotic initiation factor 2B (8). Alteration of RGS2 expression is
associated with a number of types of cancer, including prostate
cancer (9), ovarian cancer (10), mantle cell lymphoma (11), acute myeloid leukemia (12) and fibrolamellar hepatocellular
carcinoma (13). However, the
association between RGS2 and breast cancer remains obscure. On the
one hand, a large-sample study revealed that RGS2 is upregulated in
breast cancer (14); on the other
hand, another more recent study demonstrated that low expression of
RGS2 is associated with breast cancer using MCF7 and MCF10A cells
(15). The aim of the present study
was to assess the association of RGS2 with breast cancer.
Furthermore, according to the World Health Organization
Classification of Tumors of the Breast (16), breast invasive carcinoma of no special
type (BIC-NST) is the largest group among the different
classifications of breast cancer. Thus, given the considerable
heterogeneity of breast cancer, the present study focused on
BIC-NST.
Materials and methods
Patients and samples
Paraffin-embedded breast cancer samples from
patients who had undergone radical mastectomy were obtained from
the archives of the Department of Pathology at the First Affiliated
Hospital of Chongqing Medical University (CQMU) (Chongqing, China)
between January and December 2011. Two pathologists screened 196
BIC-NST samples according to the criterion of 2012 WHO
Classification of Tumors of the Breast and reached a consensus on
the diagnosis. The patients enrolled in the present study were
followed up every other year, and the last follow-up was in June
2016. All protocols in this study were approved by the Ethics
Committee of the First Affiliated Hospital of CQMU, and each
patient enrolled provided written informed consent.
RGS2 gene expression data in breast cancer and
relevant clinical information were downloaded from The Cancer
Genome Atlas (TCGA) (https://cancergenome.nih.gov). Data from 513 patients
with breast cancer were analyzed, following the exclusion of all
male patients and those female patients without BIC-NST, or those
lacking complete information. Of the 513 patients, there were 93
paired datasets that included cancer tissue and adjacent
tissue.
Immunohistochemistry (IHC)
experimental procedures
RGS2 protein expression in 4-µm sections of 196
BIC-NST samples was detected by IHC. The polyclonal RGS2 antibody
(cat. no. ab36561; dilution, 1:200) was purchased from Abcam
(Cambridge, UK). Briefly, slides were deparaffinized using xylene,
and rehydrating using a gradient ethanol series. Microwave antigen
retrieval was performed using sodium citrate solution (10 mmol/l,
pH 6.0) for 4 min in high heat (~100°C) and 10 min in low heat
(~35°C), and the slides were cooled for 30 min. Slides were
incubated with 3% hydrogen peroxide for 10 min at room temperature
to block endogenous peroxidase activity. Samples were incubated
with RGS2 antibody for 1 h at room temperature. Following
incubation with Polymer Helper reagent and a poly-horseradish
peroxidase-conjugated anti-mouse/rabbit IgG secondary antibody
(cat. no. PV-9000; dilution ready-to-use; OriGene Technologies,
Inc., Beijing, China) twice, for 20 min at room temperature each
time, the sections were visualized using 3,3′-diaminobenzidine
solution (Dako; Agilent Technologies, Inc., Santa Clara, CA, USA)
and were counterstained with hematoxylin for 20 sec at room
temperature. Image acquisition was performed using a light
microscope (Olympus BX45; Olympus Corporation, Tokyo, Japan), and
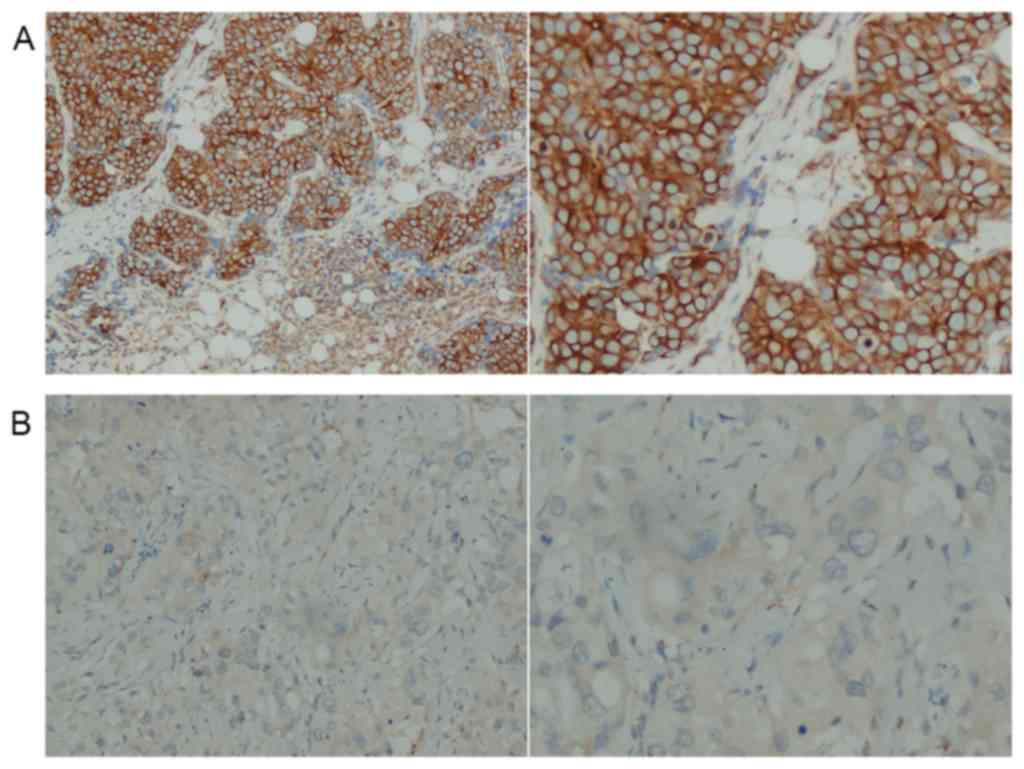
images were captured at magnification, ×200 and ×400.
IHC evaluation
The slides were independently reviewed by two
pathologists who were blinded to any information on the clinical
characteristics and follow-up data. RGS2 expression level scores
were calculated according to the sum of IHC intensity (0, negative;
1, weak staining; 2, moderate staining; and 3, strong staining) and
the rate of positive staining (0, 0%; 1, 1–50%; and 2, 51–100%).
Differences in scoring were resolved by reaching a consensus. The
total cumulative scores of 0–3 and 4–5 were defined as the low- and
high-expression groups, respectively. Representative IHC staining
images are shown in Fig. 1.
Gene set enrichment analysis
(GSEA)
GSEA was used to assess different enriched gene sets
corresponding to each gene from microarray data. Every enriched
gene set is sorted according to a common biological function. Thus,
the association between the targeted gene and biological function
could be indirectly shown by GSEA. GSEA software version 2.2.2 was
downloaded from the Molecular Signatures Database, Broad Institute
(http://software.broadinstitute.org/gsea/) (17). The enrichment of the C2 curated gene
sets and the C5 Gene Ontology (GO) gene sets were analyzed by
comparing low-expression and high-expression RGS2 subtypes. The
number of permutations was set at 1,000.
Statistical analysis
Differences in expression between cancer tissue and
adjacent tissue from the 93 paired TCGA datasets was analyzed by
paired Student's t-test. The association between RGS2 expression
and clinical pathological parameters was evaluated by the
χ2 test. The association between RGS2 expression and
overall survival was assessed using Kaplan-Meier method with
log-rank test, and univariate and multivariate Cox regression
analyses. P<0.05 was considered to indicate a statistically
significant difference. Statistical analysis was conducted using
SPSS version 19.0.0 (IBM Corp., Armonk, NY, USA) and statistical
drawing was performed using GraphPad Prism version 6.01 (GraphPad
Software Inc., La Jolla, CA, USA).
Results
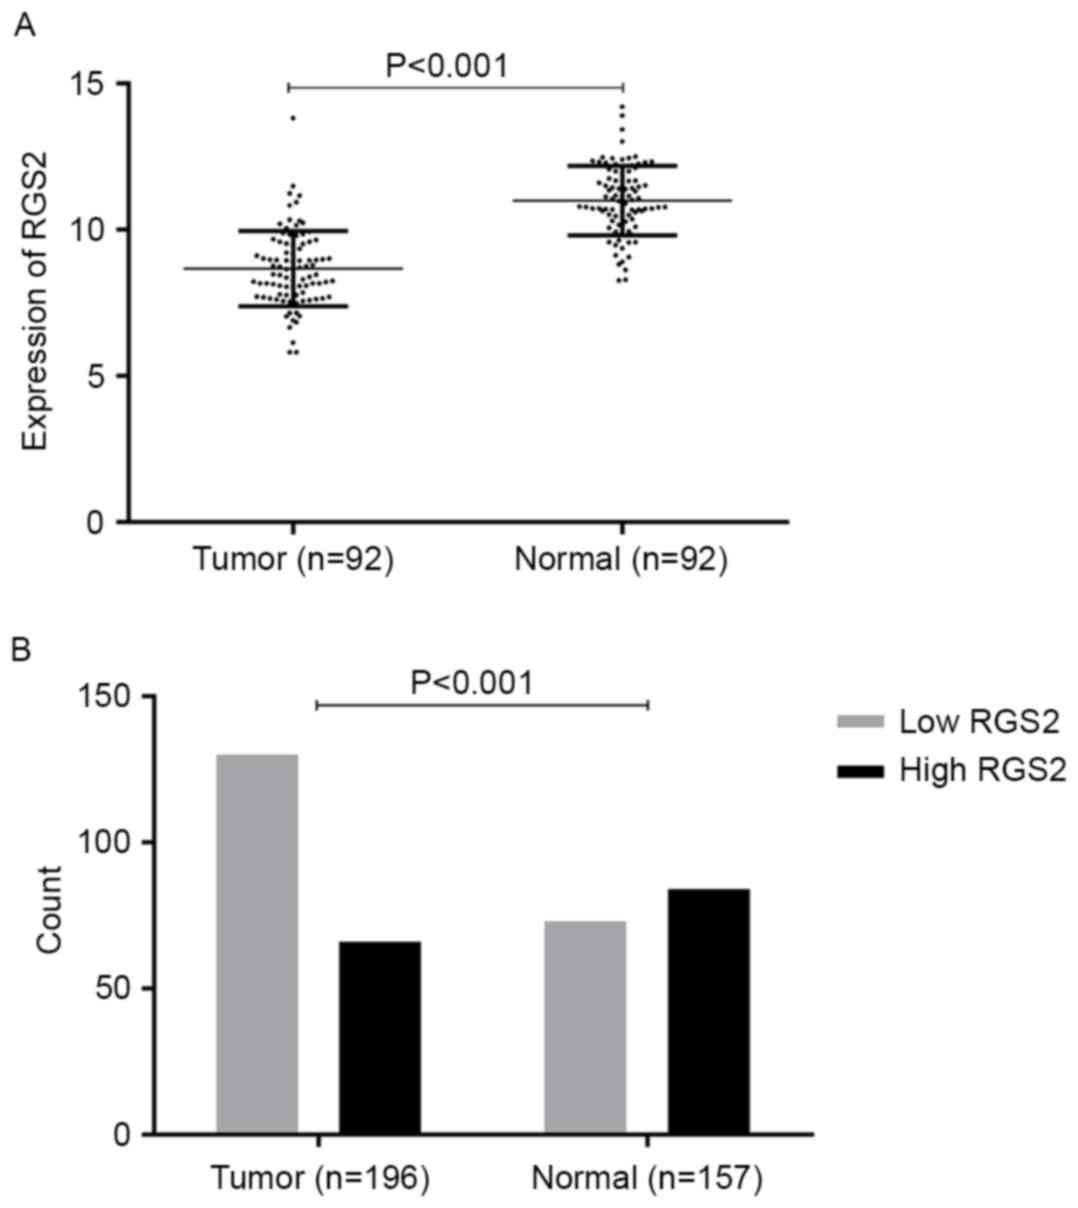
mRNA and protein RGS2 expression is
downregulated in BIC-NST
The expression of RGS2 mRNA and protein in tumor and
adjacent normal breast tissue was detected by analysis of the TCGA
datasets and IHC analysis of tissue samples. As shown in Fig. 2, the expression level of RGS2 mRNA in
breast cancer tissue was significantly lower than that in adjacent
normal breast tissue (P<0.001), as was the protein expression
level of RGS2 (P<0.001).
Association between RGS2 expression
and clinical characteristics
Following IHC analysis, the relevant
clinicopathological analysis of the 196 BIC-NST samples was
performed (Table I). HER2 status is
primarily determined by immunohistochemistry (IHC) and fluorescence
in situ hybridization (FISH) on formalin-fixed and
paraffin-embedded samples. Definition of HER status is performed as
follows: When the tumor is classified as 3+ by IHC staining, HER2
status considered positive. When the tumor is classified as 0 or 1+
by IHC staining, HER2 status is considered negative. If the tumor
is classified as 2+ by IHC staining, HER2 status requires
additional confirmation using FISH (18). In the present study, there were 14
cases of breast cancer which were classified as 2+ by IHC staining,
but these samples were not examined using FISH as this protocol was
not performed. Consequently, these cases were defined as
‘uncertain’ (Table I).
 | Table I.Association between patient
characteristics and expression status of RGS2 in the Chongqing
Medical University cohort. |
Table I.
Association between patient
characteristics and expression status of RGS2 in the Chongqing
Medical University cohort.
| Characteristic | Low RGS2, n (%) | High RGS2, n (%) | χ2 | P-value |
|---|
| Age, years |
|
| 3.300 | 0.069 |
|
<60 | 112 (86.2) | 50 (75.8) |
|
|
| ≥60 | 18 (13.8) | 16 (24.2) |
|
|
| Histological
gradea |
|
| 10.332 | 0.006 |
| Grade
1 | 30 (23.1) | 30 (45.5) |
|
|
| Grade
2 | 60 (46.2) | 22 (33.3) |
|
|
| Grade
3 | 40 (30.7) | 14 (21.2) |
|
|
| ER status |
|
| 8.790 | 0.003 |
|
Negative | 32 (24.6) | 30 (45.5) |
|
|
|
Positive | 98 (75.4) | 36 (54.5) |
|
|
| PR status |
|
| 5.085 | 0.024 |
|
Negative | 38 (29.2) | 30 (45.5) |
|
|
|
Positive | 92 (70.8) | 36 (54.5) |
|
|
| HER-2 status |
|
| 2.454 | 0.293 |
|
Negative | 80 (61.5) | 48 (72.7) |
|
|
|
Positive | 40 (30.8) | 14 (21.2) |
|
|
|
Uncertainb | 10 (7.7) | 4 (6.1) |
|
|
| Ki-67, % |
|
| 1.807 | 0.179 |
|
<14 | 50 (38.5) | 32 (48.5) |
|
|
|
≥14 | 80 (61.5) | 34 (51.5) |
|
|
| Distant
metastasis |
|
| 3.142 | 0.076 |
| No | 124 (95.4) | 66 (100.0) |
|
|
|
Yes | 6 (4.6) | 0 (0.0) |
|
|
| Tumor size, cm |
|
| 9.771 | 0.002 |
| ≤2 | 60 (46.2) | 46 (69.7) |
|
|
|
>2 | 70 (53.8) | 20 (30.3) |
|
|
| Lymph node
metastasis |
|
| 2.274 | 0.132 |
| No | 64 (49.2) | 40 (60.6) |
|
|
|
Yes | 66 (50.8) | 26 (39.4) |
|
|
| Clinical stage |
|
| 1.143 | 0.285 |
|
I–II | 102 (78.5) | 56 (84.8) |
|
|
|
III–IV | 28 (21.5) | 10 (15.2) |
|
|
RGS2 protein expression was significantly negatively
associated with the following clinical pathological
characteristics: Histological grade (P=0.006), estrogen receptor
(ER) status (P=0.003), progesterone receptor (PR) status (P=0.024)
and tumor size (P=0.002). The TCGA BIC-NST sample was divided into
two groups according to the expression of RGS2: The low-expression
group (n=204, the lowest 35%), and the over-expression group
(n=123, the highest 35%). As shown in Table II, age (P=0.002), ER status
(P<0.001), PR status (P<0.001) and lymph node metastasis
(P=0.002) were significantly negatively associated with RGS2 mRNA
expression.
| Table II.Association between patient
characteristics and expression status of RGS2 in The Cancer Genome
Atlas cohort. |
Table II.
Association between patient
characteristics and expression status of RGS2 in The Cancer Genome
Atlas cohort.
| Characteristic | Low RGS2, n
(%) | High RGS2, n
(%) | χ2 | P-value |
|---|
| Age, years |
|
| 9.307 | 0.002 |
|
<60 | 99 (48.5) | 81 (65.9) |
|
|
|
≥60 | 105 (51.5) | 42 (34.1) |
|
|
| ER status |
|
| 27.172 | <0.001 |
|
Negative | 33 (16.2) | 52 (42.3) |
|
|
|
Positive | 171 (83.8) | 71 (57.7) |
|
|
| PR status |
|
| 22.132 | <0.001 |
|
Negative | 55 (27.0) | 65 (52.8) |
|
|
|
Positive | 149 (73.0) | 58 (47.2) |
|
|
| HER-2 status |
|
| 0.163 | 0.687 |
|
Negative | 169 (82.8) | 104 (84.6) |
|
|
|
Positive | 35 (17.2) | 19 (15.4) |
|
|
| Distant
metastasis |
|
| 0.556 | 0.456 |
| No | 198 (97.1) | 121 (98.4) |
|
|
|
Yes | 6 (2.9) | 2 (1.6) |
|
|
| Tumor size, cm |
|
| 0.029 | 0.866 |
| ≤2 | 53 (26.0) | 33 (26.8) |
|
|
|
>2 | 151 (74.0) | 90 (73.2) |
|
|
| Lymph node
metastasis |
|
| 9.469 | 0.002 |
| No | 82 (40.2) | 71 (57.7) |
|
|
|
Yes | 122 (59.8) | 52 (42.3) |
|
|
| Clinical stage |
|
| 5.381 | 0.020 |
|
I–II | 154 (75.5) | 106 (86.2) |
|
|
|
III–IV | 50 (24.5) | 17 (13.8) |
|
|
Low expression levels of RGS2 are
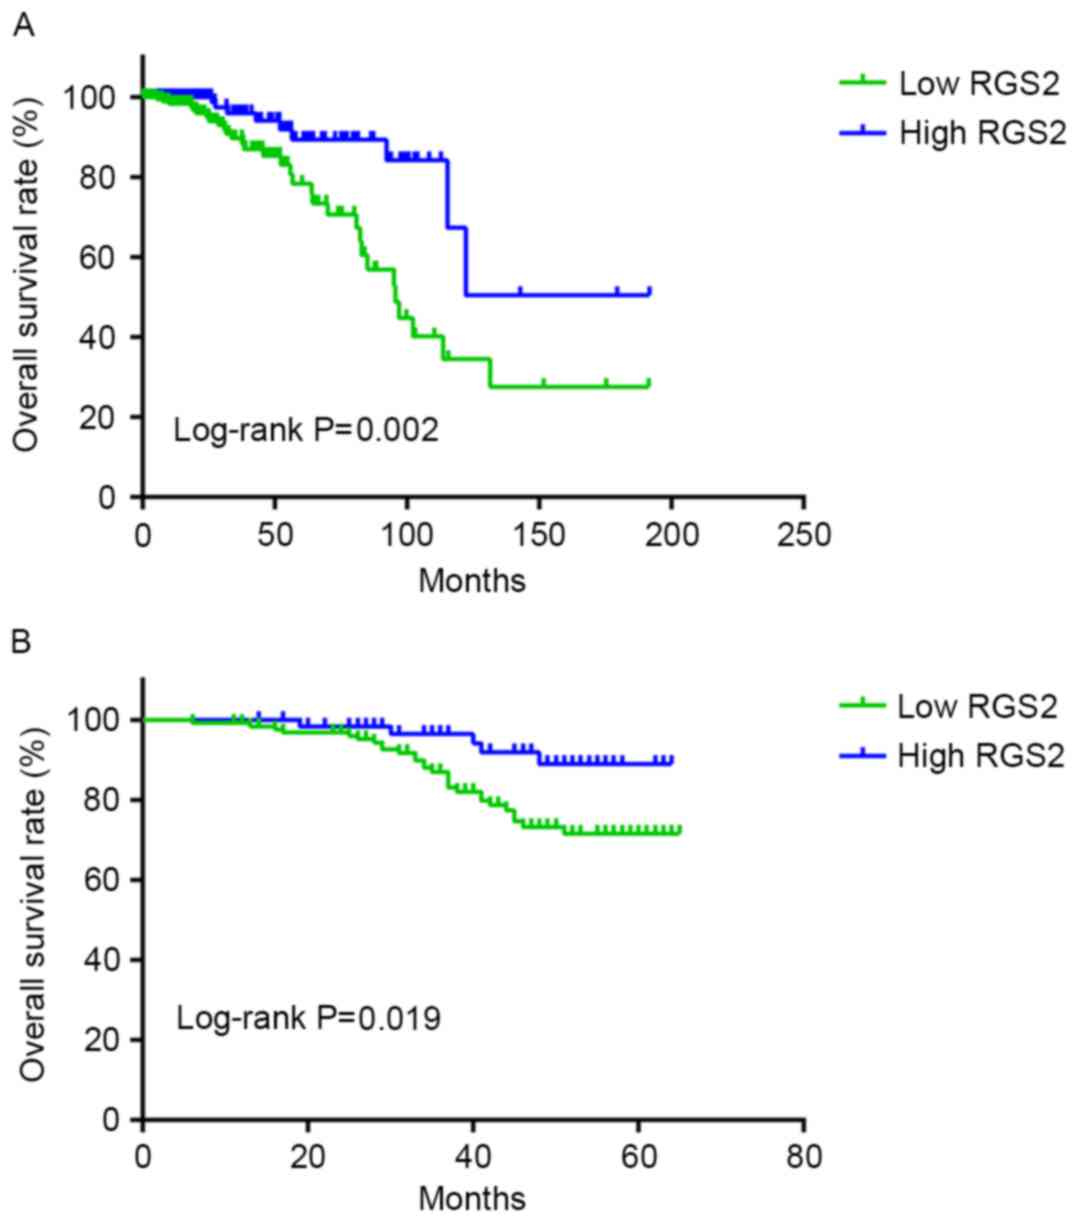
associated with poor survival rate in BIC-NST patients
Follow-up data from the TCGA cohort and the CQMU
cohort were assessed, and the association between the RGS2
expression level and overall survival rate were analyzed using the
Kaplan-Meier method and log-rank test. The median follow-up time in
the TCGA and CQMU cohorts was 27 months (range, 0–238 months) and
44 months (range, 6–65 months), respectively. As shown in Fig. 3, the group with low expression of RGS2
mRNA had a significantly lower overall survival rate (P=0.002), as
did the group with low expression of RGS2 protein (P=0.019). The
results of univariate analysis in the TCGA and CQMU cohorts are
presented in Tables III and
IV, respectively. To evaluate the
prognostic value of RGS2, the two groups of data were analyzed
independently using multivariate Cox regression analysis. In the
TCGA cohort, as demonstrated in Table
V, the low expression of RGS2 [hazard ratio (HR), 0.435; 95%
confidence interval (CI), 0.196–0.965; P=0.041], age (>60 years)
(HR, 2.073; 95% CI, 1.013–4.243; P=0.046) and advanced disease
stage (III–IV) (HR, 2.938; 95% CI, 1.390–6.208; P=0.005) were
significantly associated with unfavorable survival in BIC-NST
independently. In the CQMU cohort, as shown in Table VI, the low expression of RGS2 (HR,
4.602; 95% CI, 1.467–14.432; P=0.009), age (>60 years) (HR,
5.832; 95% CI, 2.149–15.830; P=0.001), advanced stage (III–IV) (HR,
5.021; 95% CI, 2.201–11.454; P<0.001) and lymph node metastasis
(HR, 3.993; 95% CI, 1.406–11.340; P=0.009) were significantly
independently associated with poor patient outcome in BIC-NST.
| Table III.Univariate analysis for RGS2 and
clinical characteristics in The Cancer Genome Atlas cohort. |
Table III.
Univariate analysis for RGS2 and
clinical characteristics in The Cancer Genome Atlas cohort.
| Characteristic | HR | 95% CI | P-value |
|---|
| RGS2 expression
(low vs. high) | 0.324 | 0.154–0.683 | 0.003 |
| Age (≥60 vs. <60
years) | 2.014 | 1.213–3.342 | 0.007 |
| ER status (positive
vs. negative) | 1.017 | 0.567–1.825 | 0.954 |
| PR status (positive
vs. negative) | 0.799 | 0.477–1.338 | 0.393 |
| HER-2 status
(positive vs. negative vs. uncertain) | 0.517 | 0.207–1.295 | 0.159 |
| Distant metastasis
(presence vs. absence) | 3.642 | 1.770–7.495 | <0.001 |
| Tumor size (>2
vs. ≤2 cm) | 1.736 | 0.876–3.439 | 0.114 |
| Lymph node
metastasis (presence vs. absence) | 1.676 | 0.970–2.894 | 0.064 |
| Stage (III–IV vs.
I–II) | 2.277 | 1.363–3.803 | 0.002 |
| Table IV.Univariate analysis for RGS2 and
clinical characteristics in the Chongqing Medical University
cohort. |
Table IV.
Univariate analysis for RGS2 and
clinical characteristics in the Chongqing Medical University
cohort.
| Characteristic | HR | 95% CI | P-value |
|---|
| RGS2 expression
(low vs. high) |
0.337 | 0.130–0.874 |
0.025 |
| Age (≥60 vs. <60
years) |
4.036 | 1.777–9.169 |
0.001 |
| Histological
gradea (grade 3 vs. 2
vs. 1) |
0.816 | 0.521–1.278 |
0.375 |
| ER status (positive
vs. negative) |
0.989 | 0.470–2.080 |
0.977 |
| PR status (positive
vs. negative) |
0.944 | 0.457–1.949 |
0.877 |
| HER-2 status
(positive vs. negative vs. uncertain) |
0.835 | 0.464–1.503 |
0.547 |
| Ki-67 (≥14 vs.
<14 %) |
0.544 | 0.274–1.080 |
0.082 |
| Distant metastasis
(presence vs. absence) | 56.107 | 8.760–359.364 | <0.001 |
| Tumor size (>2
vs. ≤2 cm) |
2.276 | 1.119–4.629 |
0.023 |
| Lymph node
metastasis (presence vs. absence) |
5.898 | 2.427–14.332 | <0.001 |
| Stage (III–IV vs.
I–II) |
8.547 | 4.123–17.718 | <0.001 |
| Table V.Multivariate Cox regression analysis
for RGS2 and clinical characteristics in The Cancer Genome Atlas
cohort. |
Table V.
Multivariate Cox regression analysis
for RGS2 and clinical characteristics in The Cancer Genome Atlas
cohort.
| Characteristic | HR | 95% CI | P-value |
|---|
| Age (≥60 vs. <60
years) | 2.073 | 1.013–4.243 | 0.046 |
| RGS2 expression
(low vs. high) | 0.435 | 0.196–0.965 | 0.041 |
| Stage (III–IV vs.
I–II) | 2.938 | 1.390–6.208 | 0.005 |
| Distant metastasis
(presence vs. absence) | 0.831 | 0.266–2.597 | 0.750 |
| Table VI.Multivariable Cox regression analysis
for RGS2 and clinical characteristics in the Chongqing Medical
University cohort. |
Table VI.
Multivariable Cox regression analysis
for RGS2 and clinical characteristics in the Chongqing Medical
University cohort.
| Characteristic | HR | 95% CI | P-value |
|---|
| Age (≥60 vs. <60
years) | 5.832 | 2.149–15.830 | 0.001 |
| RGS2 expression
(low vs. high) | 4.602 | 1.467–14.432 | 0.009 |
| Lymph node
metastasis (presence vs. absence) | 3.993 | 1.406–11.340 | 0.009 |
| Stage (III–IV vs.
I–II) | 5.021 | 2.201–11.454 | <0.001 |
| Distant metastasis
(presence vs. absence) | 7.517 | 0.773–73.114 | 0.082 |
| Tumor size (>2
vs. ≤2 cm) | 1.495 | 0.686–3.261 | 0.312 |
GSEA of RGS2 mRNA expression in TCGA
microarray
To investigate the biological function of RGS2, TCGA
microarray data was analyzed using GSEA software. The C2 curated
gene set results indicated that the significant gene set enrichment
in the RGS2 low expression group contained ‘VANTVEER BREAST CANCER
ESR1 UP’ (enrichment score, 1.8211; nominal P=0.002; false
discovery rate, 0.1435; Fig. 4A) and
‘SMID BREAST CANCER LUMINAL B UP’ (enrichment score, 1.8208;
nominal P<0.001; false discovery rate, 0.1295; Fig. 4B). C5 GO gene set results demonstrated
that the significant gene set enrichment in the RGS2 overexpression
group included ‘NEGATIVE REGULATION OF CELL PROLIFERATION’
(enrichment score, −1.8292; nominal P<0.001; false discovery
rate, 0.2224; Fig. 4C) and ‘NEGATIVE
REGULATION OF DEVELOPMENTAL PROCESS’ (enrichment score, −1.8096;
nominal P<0.001; false discovery rate, 0.2326; Fig. 4D).
Discussion
The present study was a large-sample comprehensive
investigation into protein and mRNA levels, laboratory experiments
and data mining; its workflow may become a trend of large-sample
retrospective studies. The present study demonstrated that the RGS2
expression level was significantly downregulated in tumor tissues
of BIC-NST compared with adjacent normal tissues. Although Smalley
et al (14) revealed that RGS2
is overexpressed in the majority of breast cancer cases, no
comparison was made with normal tissues. Additionally, the
aforementioned study also demonstrated that RGS2 expression was
lower in the breast cancer cell line compared with that in the
normal cells. The results of the in vitro aspect of this
study validated the results of the present study. Lyu et al
(15) demonstrated that RGS2
expression was downregulated in breast cancer MCF-7 cells compared
with normal mammary epithelium MCF-10A cells. The results of the
present study were consistent with the results of Lyu et al
(15) on the one hand; on the other
hand, the present study expands these results from the cellular
level to the level of human tissue, promoting the translation of
the study from the laboratory bench to the clinic.
At the mRNA and protein levels, different results
were obtained regarding the association between the
clinicopathological features and RGS2 expression. There are a
number of processes involved in the translation of mRNA to protein,
including splicing, cleavage and modification. Thus, the expression
of the gene is not always entirely consistent with that of the
protein. However, RGS2 mRNA and protein expression was
significantly downregulated in the ER-positive and PR-positive
groups. GSEA revealed that the gene set enrichment in the RGS2
low-expression group was associated with estrogen receptor 1 and
the luminal B subtype of breast cancer (19). According to the PAM50 Gene Expression
Assay (20), the luminal B subtype of
breast cancer is an ER-positive breast cancer. Therefore, the
results of GSEA supported the results of the present study with
regards to biological function. ER acts as a nuclear transcription
factor when activated by estrogenic hormones and promotes the
growth of the normal mammary epithelium (21). ER-positive cells in invasive breast
cancer are frequently over-proliferative, resulting in harm to
patients (22). The expression of PR
is regulated by ER, so PR expression status is used to assess
whether the estrogen-ER pathway is intact and functional (21). We hypothesize that the low expression
of RGS2 may be a potential factor in the development of BIC-NST. To
the best of our knowledge, the present study is the first to reveal
that the low expression of RGS2 is associated with the positive
status of hormone receptors in BIC-NST.
The Kaplan-Meier survival curve and Cox regression
analysis demonstrated that low expression of RGS2 was significantly
associated with the poor prognosis of patients with BIC-NST, and
that it represents an independent risk factor. Through GSEA, the
overexpression of RGS2 was found to be associated with the negative
regulation of a number of biological processes. In the present
study, the expression of RGS2 was negatively associated with
pathological grade. Previous research revealed that there is an
association between high pathological grade and poor survival
outcome in patients with BIC-NST (23,24); this
indirectly indicates that the low expression of RGS2 was associated
with unfavorable prognosis in patients with BIC-NST. However, as
TCGA data does not contain information regarding pathological
grade, there was no way to validate the association between the
expression of RGS2 mRNA and pathological grade in patients with
BIC-NST. Taken together, these results indicate that RGS2 serves a
role in the suppression of oncogene expression. To the best of our
knowledge, the present study is also the first to report that low
RGS2 expression was associated with poor outcome in patients with
BIC-NST.
There are several limitations to the present study.
The mechanism that underlies the association between the expression
of RGS2 and the hormone receptors remains unknown. The subject of
the present study focused solely on BIC-NST, among the various
types of invasive breast cancer. This is the largest group and is
thus the most likely to be experienced by patients; however, other
types of invasive breast cancer exhibit different pathological
features and gene profiles (25–29). Thus,
the effect of RGS2 in invasive breast cancer requires further
investigation.
In summary, the expression of RGS2 is
under-regulated in patients with BIC-NST, and its low expression is
closely associated with positive hormone receptor status. The low
expression of RGS2 is predictive of poor prognosis in patients with
BIC-NST, and is an independent risk factor. The results of the
present study indicate that RGS2 may be a tumor suppressor gene in
BIC-NST. Further study is required to investigate the precise
mechanistic pathway underlying the effect of RGS2 in BIC-NST and to
expand the study of RGS2 to other subtypes of invasive breast
cancer.
Acknowledgements
The present study was funded by the Key Project of
Chongqing Municipal Health Bureau, China (grant no. 2012-1-79).
Glossary
Abbreviations
Abbreviations:
|
RGS2
|
regulator of G protein signaling 2
|
|
BIC-NST
|
breast invasive carcinoma of no
special type
|
|
IHC
|
immunohistochemistry
|
|
GSEA
|
gene set enrichment analysis
|
References
|
1
|
Early Breast Cancer Trialists'
Collaborative Group (EBCTCG), . Effects of chemotherapy and
hormonal therapy for early breast cancer on recurrence and 15-year
survival: An overview of the randomised trials. Lancet.
365:1687–1717. 2005. View Article : Google Scholar : PubMed/NCBI
|
|
2
|
Gianni L, Pienkowski T, Im YH, Tseng LM,
Liu MC, Lluch A, Starosławska E, de la Haba-Rodriguez J, Im SA,
Pedrini JL, et al: 5-year analysis of neoadjuvant pertuzumab and
trastuzumab in patients with locally advanced, inflammatory, or
early-stage HER2-positive breast cancer (NeoSphere): A multicentre,
open-label, phase 2 randomised trial. Lancet Oncol. 17:791–800.
2016. View Article : Google Scholar : PubMed/NCBI
|
|
3
|
Baum M: Modern concepts of the natural
history of breast cancer: A guide to the design and publication of
trials of the treatment of breast cancer. Eur J Cancer. 49:60–64.
2013. View Article : Google Scholar : PubMed/NCBI
|
|
4
|
Clarke R, Leonessa F and Trock B:
Multidrug resistance/P-glycoprotein and breast cancer: Review and
meta-analysis. Semin Oncol. 32 Suppl 7:S9–S15. 2005. View Article : Google Scholar : PubMed/NCBI
|
|
5
|
Ferlay J, Soerjomataram I, Dikshit R, Eser
S, Mathers C, Rebelo M, Parkin DM, Forman D and Bray F: Cancer
incidence and mortality worldwide: Sources, methods and major
patterns in GLOBOCAN 2012. Int J Cancer. 136:E359–E386. 2015.
View Article : Google Scholar : PubMed/NCBI
|
|
6
|
Heximer SP, Lim H, Bernard JL and Blumer
KJ: Mechanisms governing subcellular localization and function of
human RGS2. J Biol Chem. 276:14195–14203. 2001. View Article : Google Scholar : PubMed/NCBI
|
|
7
|
Bosch DE, Zielinski T, Lowery RG and
Siderovski DP: Evaluating modulators of ‘regulator of G-protein
signaling’ (RGS) proteins. Curr Protoc Pharmacol: Chapter. 2:Unit
2.82012.
|
|
8
|
Nguyen CH, Ming H, Zhao P, Hugendubler L,
Gros R, Kimball SR and Chidiac P: Translational control by RGS2. J
Cell Biol. 186:755–765. 2009. View Article : Google Scholar : PubMed/NCBI
|
|
9
|
Cao X, Qin J, Xie Y, Khan O, Dowd F,
Scofield M, Lin MF and Tu Y: Regulator of G-protein signaling 2
(RGS2) inhibits androgen-independent activation of androgen
receptor in prostate cancer cells. Oncogene. 25:3719–3734. 2006.
View Article : Google Scholar : PubMed/NCBI
|
|
10
|
Hurst JH, Mendpara N and Hooks SB:
Regulator of G-protein signalling expression and function in
ovarian cancer cell lines. Cell Mol Biol Lett. 14:153–174. 2009.
View Article : Google Scholar : PubMed/NCBI
|
|
11
|
Zhu Y, Hollmen J, Räty R, Aalto Y, Nagy B,
Elonen E, Kere J, Mannila H, Franssila K and Knuutila S:
Investigatory and analytical approaches to differential gene
expression profiling in mantle cell lymphoma. Br J Haematol.
119:905–915. 2002. View Article : Google Scholar : PubMed/NCBI
|
|
12
|
Schwable J, Choudhary C, Thiede C,
Tickenbrock L, Sargin B, Steur C, Rehage M, Rudat A, Brandts C,
Berdel WE, et al: RGS2 is an important target gene of Flt3-ITD
mutations in AML and functions in myeloid differentiation and
leukemic transformation. Blood. 105:2107–2114. 2005. View Article : Google Scholar : PubMed/NCBI
|
|
13
|
Kannangai R, Vivekanandan P,
Martinez-Murillo F, Choti M and Torbenson M: Fibrolamellar
carcinomas show overexpression of genes in the RAS, MAPK, PIK3 and
xenobiotic degradation pathways. Hum Pathol. 38:639–644. 2007.
View Article : Google Scholar : PubMed/NCBI
|
|
14
|
Smalley MJ, Iravani M, Leao M, Grigoriadis
A, Kendrick H, Dexter T, Fenwick K, Regan JL, Britt K, McDonald S,
et al: Regulator of G-protein signalling 2 mRNA is differentially
expressed in mammary epithelial subpopulations and over-expressed
in the majority of breast cancers. Breast Cancer Res. 9:R852007.
View Article : Google Scholar : PubMed/NCBI
|
|
15
|
Lyu JH, Park DW, Huang B, Kang SH, Lee SJ,
Lee C, Bae YS, Lee JG and Baek SH: RGS2 suppresses breast cancer
cell growth via a MCPIP1-dependent pathway. J Cell Biochem.
116:260–267. 2015. View Article : Google Scholar : PubMed/NCBI
|
|
16
|
Ellis IO, Collins L, Ichihara S, et al:
Invasive carcinoma of no special typeLakhani SR, Ellis IO, Schnitt
SJ, Tan PH and van de Vijver MJ: WHO classification of tumours of
the breast. Fourth. IARC 34; Lyon: 2012
|
|
17
|
Subramanian A, Tamayo P, Mootha VK,
Mukherjee S, Ebert BL, Gillette MA, Paulovich A, Pomeroy SL, Golub
TR, Lander ES and Mesirov JP: Gene set enrichment analysis: A
knowledge-based approach for interpreting genome-wide expression
profiles. Proc Natl Acad Sci USA. 102:pp. 15545–15550. 2005;
View Article : Google Scholar : PubMed/NCBI
|
|
18
|
Colditz G and Chia KS: Invasive breast
carcinoma: Introduction and general featuresWHO classification of
tumours of the breast. Fourth. IARC 23; Lyon: 2012
|
|
19
|
Spoerke JM, Gendreau S, Walter K, Qiu J,
Wilson TR, Savage H, Aimi J, Derynck MK, Chen M, Chan IT, et al:
Heterogeneity and clinical significance of ESR1 mutations in
ER-positive metastatic breast cancer patients receiving
fulvestrant. Nat Commun. 7:115792016. View Article : Google Scholar : PubMed/NCBI
|
|
20
|
Parker JS, Mullins M, Cheang MC, Leung S,
Voduc D, Vickery T, Davies S, Fauron C, He X, Hu Z, et al:
Supervised risk predictor of breast cancer based on intrinsic
subtypes. J Clin Oncol. 27:1160–1167. 2009. View Article : Google Scholar : PubMed/NCBI
|
|
21
|
Clarke RB: Steroid receptors and
proliferation in the human breast. Steroids. 68:789–794. 2003.
View Article : Google Scholar : PubMed/NCBI
|
|
22
|
Schiff R, Osborne CK and Fuqua SAW:
Clinical aspects of estrogen and prog-esterone receptors. Wolters
Kluwer Lippincott Williams & Wilkins; Philadelphia: 2010
|
|
23
|
Rakha EA, El-Sayed ME, Lee AH, Elston CW,
Grainge MJ, Hodi Z, Blamey RW and Ellis IO: Prognostic significance
of Nottingham histologic grade in invasive breast carcinoma. J Clin
Oncol. 26:3153–3158. 2008. View Article : Google Scholar : PubMed/NCBI
|
|
24
|
Rakha EA, Reis-Filho JS, Baehner F, Dabbs
DJ, Decker T, Eusebi V, Fox SB, Ichihara S, Jacquemier J, Lakhani
SR, et al: Breast cancer prognostic classification in the molecular
era: The role of histological grade. Breast Cancer Res. 12:2072010.
View Article : Google Scholar : PubMed/NCBI
|
|
25
|
Cleton-Jansen AM: E-cadherin and loss of
heterozygosity at chromosome 16 in breast carcinogenesis: Different
genetic pathways in ductal and lobular breast cancer? Breast Cancer
Res. 4:5–8. 2002. View
Article : Google Scholar : PubMed/NCBI
|
|
26
|
Lacroix-Triki M, Suarez PH, MacKay A,
Lambros MB, Natrajan R, Savage K, Geyer FC, Weigelt B, Ashworth A
and Reis-Filho JS: Mucinous carcinoma of the breast is genomically
distinct from invasive ductal carcinomas of no special type. J
Pathol. 222:282–298. 2010. View Article : Google Scholar : PubMed/NCBI
|
|
27
|
Marchiò C, Iravani M, Natrajan R, Lambros
MB, Geyer FC, Savage K, Parry S, Tamber N, Fenwick K, Mackay A, et
al: Mixed micropapillary-ductal carcinomas of the breast: A genomic
and immunohistochemical analysis of morphologically distinct
components. J Pathol. 218:301–315. 2009. View Article : Google Scholar : PubMed/NCBI
|
|
28
|
Persson M, Andrén Y, Mark J, Horlings HM,
Persson F and Stenman G: Recurrent fusion of MYB and NFIB
transcription factor genes in carcinomas of the breast and head and
neck. Proc Natl Acad Sci USA. 106:pp. 18740–18744. 2009; View Article : Google Scholar : PubMed/NCBI
|
|
29
|
Tognon C, Knezevich SR, Huntsman D,
Roskelley CD, Melnyk N, Mathers JA, Becker L, Carneiro F,
MacPherson N, Horsman D, et al: Expression of the ETV6-NTRK3 gene
fusion as a primary event in human secretory breast carcinoma.
Cancer cell. 2:367–376. 2002. View Article : Google Scholar : PubMed/NCBI
|