Introduction
Mammary duct ectasia (MDE) is a type of
non-puerperal and non-specific inflammation (1). Occasionally, MDE presents with similar
clinical features to those of breast cancer (2). For example, MDE often presents with an
atypical and insidious mass without inflammation (3), rendering it difficult to diagnose and
differentiate from breast cancer (4).
Furthermore, breast cancer may be confused with benign lesion in
imaging, particularly inflammatory cancer, which had an incidence
rate of between 1 and 6% in the United States between 1988 and 2000
(5) and resembles MDE and breast
abscess (5). Therefore, it is
important to differentiate between MDE and breast cancer for timely
diagnosis and subsequent treatment.
Breast cancer may be diagnosed using ultrasound (US)
and magnetic resonance imaging (MRI) technology (6–8). However,
to the best of our knowledge, there is no report on the detailed
parameter comparisons between US and MRI in the differential
diagnosis of MDE and breast cancer. For example, the diagnostic
value of dynamic contrast-enhanced MRI (DCE-MRI) for MDE has been
seldom discussed (9). Therefore, in
the present study, patients with suspected MDE and breast cancer
were recruited. The diagnostic values of US and MRI were
evaluated.
Materials and methods
Patients
Patients with suspected MDE and breast cancer were
recruited between May 2012 and December 2015 in The Second Hospital
of Shandong University (Jinan, China). All patients were examined
using US and MRI. Mammotome biopsy or resection was performed a
week after the imaging examinations. The final diagnosis was made
by pathological analysis (H&E staining).
Patients were included if they were: i) female; ii)
clinically suspected of presenting with MDE or breast cancer by
physical examination; and iii) consented to participate in the
present study. Patients were excluded if they: i) declined to join
in the research; ii) declined to be examined by US and MRI; iii)
were unable to be examined using MRI due to implanted metal; iv)
had been treated with neoadjuvant chemotherapy and/or needle
biopsy; v) refused mammotome biopsy or resection; or vi) presented
with other types of malignancy. The Medical Ethics Board of The
Second Hospital of Shandong University approved the present study.
Written informed consent was obtained from all patients or their
families.
H&E staining
H&E staining was performed according to routine
procedure. Briefly, tissues were fixed with 10% neutral formalin at
room temperature for 24 h, embedded in paraffin and cut into 4 µm
sections. Then tissue sections were dewaxed in xylene and
rehydrated in graded alcohols at room temperature. Following
washing with running water and distilled water, sections were
stained with hematoxylin for 3–5 min at room temperature. Following
washing again with running water, sections were differentiated with
1% HCl in 70% alcohol for 5–10 sec at room temperature. Then
sections were stained with eosin for 1–4 min at room temperature
following washing with running water. Subsequent to dehydration and
differentiation in alcohol at room temperature, sections were
mounted and observed under light microscopy (OLYMPUS BX45; Olympus
Corporation, Tokyo, Japan). The magnification was 400×.
US
US examination was performed using LOGIQ E9
ultrasound instrument (GE Healthcare Life Sciences, Little
Chalfont, UK). Patients were fully exposed in a supine position
with the arms raised above the head. A 9–14 MHz high-frequency
probe was used to bilaterally scan the breasts and axillaries of
the patients. US elastography (UE) was performed following routine
US.
Routine US features (10) were classified into four types:
Mammary-duct dilation (type I), cyst-and-solid mass (type II),
solid mass (type III) and abscess (type IV). A five-point scale was
determined based on the color of nodules, which was assessed by
eye, in UE (11,12): Primarily green scored 1 point; blue
center and predominantly green surrounding scored 2 points; equal
amount of green and blue scored 3 points; predominately blue or
mixed with small proportion of green scored 4 points; surrounding
tissues of mostly blue scored 5 points. A lesion with scores of 1
to 3 points was considered benign, otherwise was malignant.
Two-dimensional images, color Doppler flow imaging
(CDFI) and elastography were also recorded and analyzed according
to Breast Imaging-Reporting and Data System (BI-RADS) lexicon of
the American College of Radiology (ACR) (13). All data were collected and analyzed by
two US specialists (Department of Radiology, Division of
Ultrasound, the Second Hospital of Shandong University) who were
blinded to the final pathological results. Disagreement was settled
either by consensus or a third reviewer (Department of Radiology,
Division of Ultrasound, the Second Hospital of Shandong University)
blinded to the final pathological results.
MRI
MRI examination was performed using a Signa HD ×3.0T
TWINSP MR system (GE Healthcare Life Sciences). Patients were in a
prone position. MRI plain scanning was performed from the direction
of the feet using the parameters of Ax short tau inversion recovery
(STIR; TR 8200/TE 36, Matrix 512×512, NEX 2.00), Ax T1 fast spin
echo (FSE; TR 40/TE 7.9, NEX 2.00, Matrix 512×512), bilateral sag
(TR3600/TE110, Matrix 512×512, NEX 2.00) and diffusion-weighted
imaging (b=0, 1,000; TR6000/TE70, Matrix 512×512, NEX 4.00).
DCE-MRI scanning was performed by injecting the contrast medium
Gadolinium (Gd)-diethylene triamine pentacetate acid (Beilu
Pharmaceutical Co., Ltd., Beijing, China) at a dosage of 0.2
mmol/kg in 20 ml saline and a speed of 1.5 ml/sec into the dorsum
manus vein, followed by another 20 ml saline. A scanning mask was
obtained prior to contrast medium injection. The 3-dimensional
vibrant-axial scanning was performed simultaneously with the
injection of the contrast medium (parameters: TR 4.3/TE 2.1, Matrix
512×512, NEX 0.7) for eight phases. Subsequently, 3-dimensional
vibrant-sagittal scanning was performed (parameters: TR 4.3/TE 1.8,
Matrix 512×512, NEX 0.7). Liquefied and necrotic areas were avoided
and, in the region of interest (ROI) of apparent diffusion
coefficient (ADC), the solid part was identified and measured 3
times. The area of the ROI was ≥2 mm2.
All data were processed offline on an AW Volume
shared by 2 workstations (GE Healthcare Life Sciences) and
independently interpreted by two senior MRI experts (Department of
Radiology, Division of MRI, the Second Hospital of Shandong
University) blinded to the final pathological results. The
morphological features of the lesions were analyzed according to
BI-RADS lexicon of the ACR (13).
The measurement parameters included early-stage
enhancement ratio (EER), peak-of-enhancement ratio (PER), time peak
(T peak) and time-signal intensity curve (TIC). The formula for EER
calculation was:
EER=S1-S0/S0×100%; S1
is the signal intensity obtained 1 min after contrast medium
injection and S0 is the signal intensity obtained prior
to injection. The formula for PER calculation was:
PER=Speak-S0/S0×100%;
Speak represented the peak signal intensity obtained
prior to or following contrast medium injection; S0
represented the signal intensity obtained prior to injection. T
peak represented the time between contrast medium injection and the
highest signal intensity. TIC was classified into 3 types (14): Persistently enhancing (type I),
plateau (type II) and washout (type III).
Statistical analysis
All data were analyzed using SPSS software (version
17.0; SPSS, Inc., Chicago, IL, USA). Measurement data were
presented as the mean ± standard deviation. Quantitative data are
presented as percentages. The difference between MDE and breast
cancer was compared using Chi-square test and analysis of the
sensitivity, specificity, accuracy, positive and negative
predictive value. P<0.05 was considered to indicate a
statistically significant difference.
Results
Clinical features
A total of 35 cases of MDE and 105 cases of breast
cancer were diagnosed by pathology. All patients were female.
Clinical features differed between the MDE and breast cancer groups
(Table I). The mean age was
33.58±8.81 (range, 23–55) years for patients with MDE and was
44.97±11.04 (range, 17–78) years for patients with breast cancer.
For the 35 patients with MDE, the duration of symptoms prior to
diagnosis ranged from 4 days to 2 years. Local masses with and
without tenderness in the breast were the major clinical
manifestations and were identified in 31 (88.6%) patients.
Tenderness without masses was identified in 4 (11.4%) patients.
Skin swelling was observed in 8 (22.9%) patients, 7 (20%) patients
exhibited skin ulceration with sinus formation, 10 (28.6%) patients
exhibited nipple inversion (bilateral in 1 patient) and 12 (34.3%)
patients experienced nipple discharge. A number of patients
experienced multiple symptoms. A total of 31 (88.6%) patients were
married with a history of childbirth and 4 (11.4%) patients had no
history of marriage or childbirth. Normal menstruation was observed
in 33 (94.3%) patients and 2 (5.7%) patients were menopausal. No
patients had a history of smoking, hepatitis, diabetes,
tuberculosis or a family history of breast cancer.
 | Table I.Clinical features of included
patients. |
Table I.
Clinical features of included
patients.
| Variables | Age, years | Local masses | Number of
masses | Skin swelling | Skin
ulceration | Nipple
inversion | Nipple
discharge | Menstruation | Menopause |
|---|
| MDE | 33.58±8.81 | 31 (88.6%) | 4 (11.4%) | 8 (22.9%) | 7 (20%) | 10 (28.6%) | 12 (34.3%) | 33 (94.3%) | 2 (5.7%) |
| Breast cancer | 44.97±11.04 | 99 (94.3%) | 6
(5.7%) | 4 (3.8%) | 10 (9.5%) | 14 (13.3%) | 0 | 75 (71.4%) | 30 (28.6%) |
For the 105 patients with breast cancer, the
duration of symptoms prior to diagnosis ranged from 2 days to 6
months. Local masses with and without tenderness in the breast were
the major clinical manifestations, observed in 99 (94.3%) patients.
Tenderness without masses was identified in 6 (5.7%) patients. Skin
swelling was observed in 4 (3.8%) patients, 10 (9.5%) patients
exhibited skin ulceration with sinus formation (1 patient exhibited
skin ulceration without sinus formation) and 14 (13.3%) patients
exhibited nipple inversion. No patients exhibited nipple discharge.
A total of 104 patients had married and only 1 patient had no
history of marriage. Normal menstruation was observed in 75 (71.4%)
patients and 30 (28.6%) patients were in menopause. No patients had
a history of smoking. A total of 4 patients had a history of
hepatitis, 4 patients had diabetes and 10 patients had a family
history of breast cancer.
The mean age of patients with breast cancer was
increased compared with that of patients with MDE. However, there
were no observable differences of local mass with or without
tenderness between the two groups by chi-square test (P=0.259).
Analysis of MDE and breast cancer with
US
US was performed to compare the difference between
MDE and breast cancer. The morphological features of MDE and breast
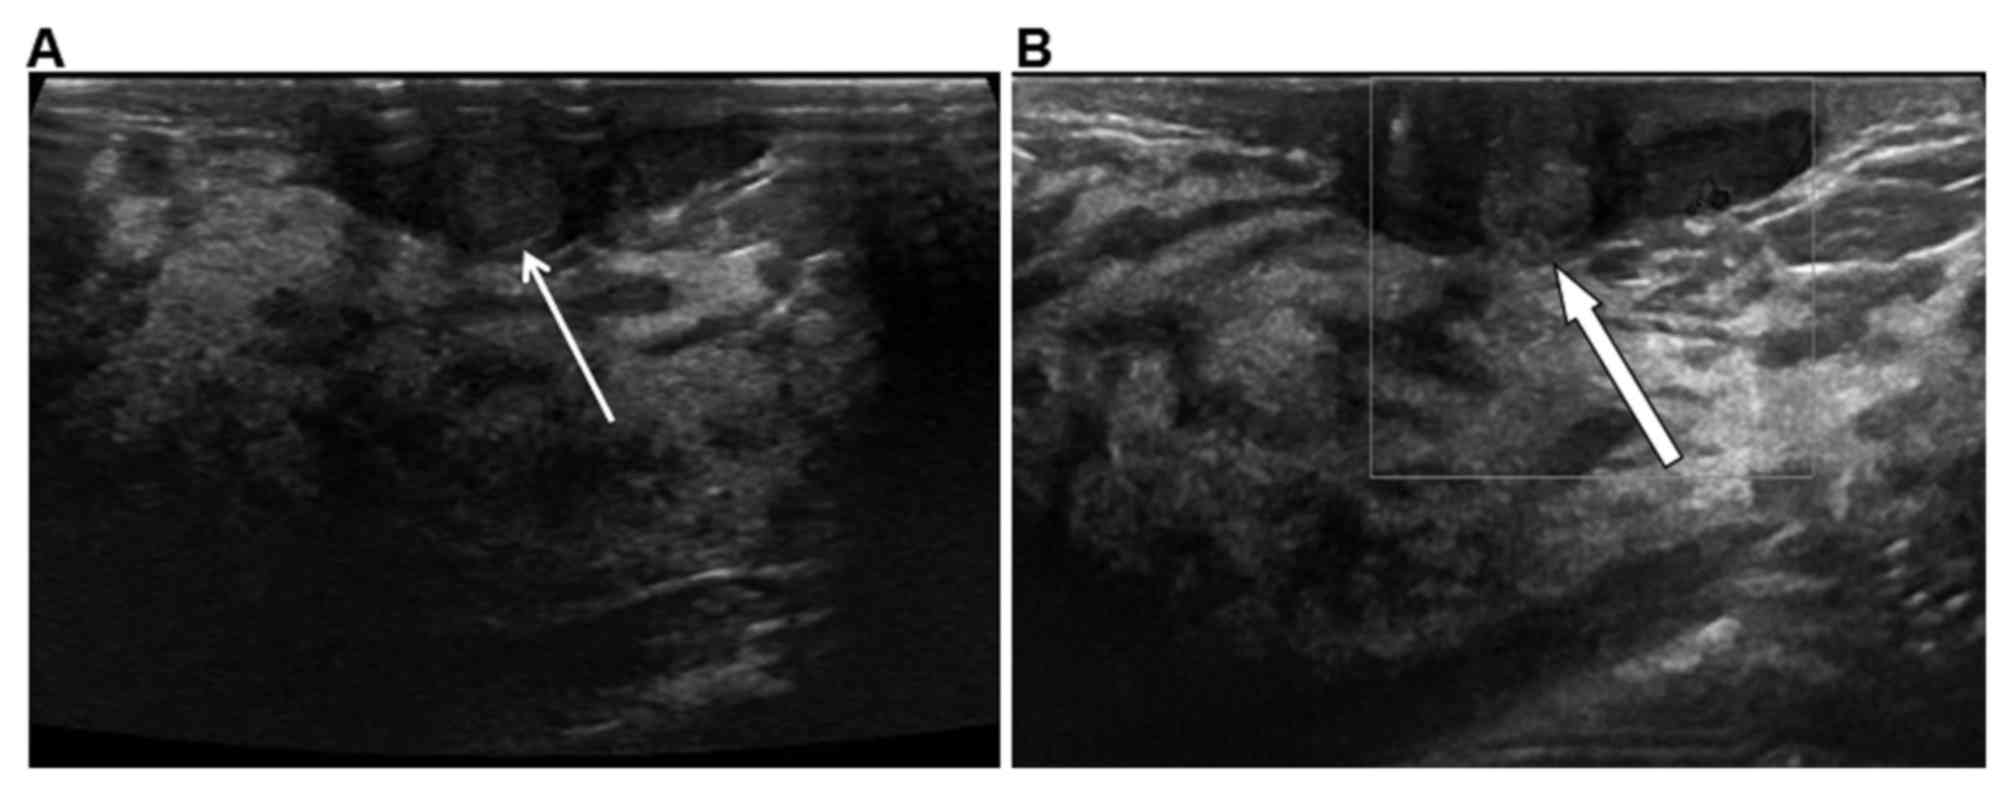
cancer were analyzed and summarized in Table II. Of the 35 cases of MDE, 19 (54.3%)
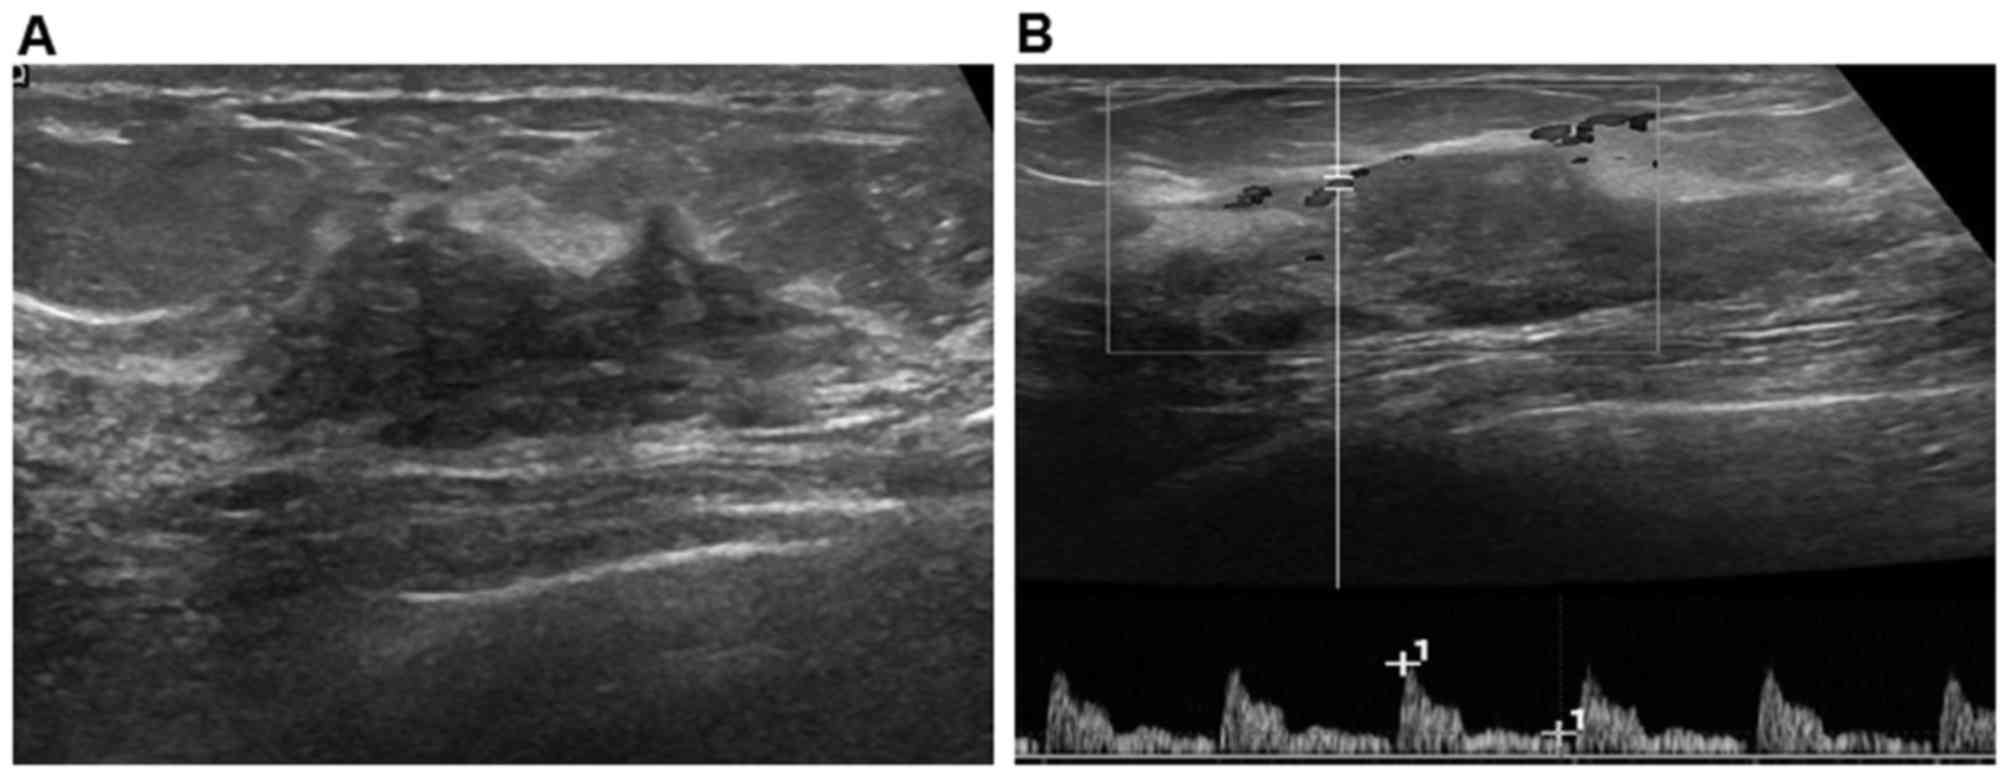
presented with a clear border (Fig.
1A) and weak blood signals (Fig.
1B) and 16 (45.7%) with an obscured border. Morphology was
regular in 22 cases (62.9%) and irregular in 13 (37.1%). There was
no aspect ratio >1 or calcification. The 105 cases of breast
cancer exhibited an aspect ratio >1 with or without posterior
attenuation in 31 cases (29.5%), obscure boundary (including
spicule sign, sharp corner sign and crab claws sign) in 97 cases
(92.4%), clear border in 8 (7.6%) cases, irregular morphology in
100 cases (95.2%), regular morphology in 5 (4.8%) cases, and
microcalcification/clustered calcification in 48 (45.7%) cases. The
difference in morphological features on US between MDE and breast
cancer was significant (P<0.05).
| Table II.Comparisons of morphological features
on US between MDE and breast cancer. |
Table II.
Comparisons of morphological features
on US between MDE and breast cancer.
|
| Ratio | Border | Morphology |
Microcalcification |
|---|
|
|
|
|
|
|
|---|
| Variables | >1 | <1 | Clear | Unclear | Regular | Irregular | Present | Absent |
|---|
| MDE (no.
cases) | 0 | 35 | 19 | 16 | 22 | 13 | 0 | 35 |
| Breast cancer (no.
cases) | 31 | 74 | 97 | 8 | 5 | 100 | 48 | 57 |
| χ2
value | 13.27 |
| 36.72 |
| 56.91 |
| 24.35 |
|
| P-value |
<0.001 |
|
<0.001 |
|
<0.001 |
|
<0.001 |
|
Among the 35 MDE cases, 28 were classified as CDFI
0–1 grading and 7 as CDFI 2–3 grading (Table III). Among breast cancer cases,
74/105 were classified as CDFI 0–1 grading and 31/105 were
classified as CDFI 2–3 grading. There was no statistical difference
observed between the two groups in CDFI grading by chi-square test
(χ2=1.20, P=0.273).
| Table III.Comparisons of CDFI grading, RI and
UE between MDE and breast cancer. |
Table III.
Comparisons of CDFI grading, RI and
UE between MDE and breast cancer.
|
| CDFI grading | RI | UE |
|---|
|
|
|
|
|
|---|
| Variables | 0–1 | 2–3 | >0.7 | ≤0.7 | 1–3 | 4–5 |
|---|
| MDE (no.
cases) | 28 | 7 | 9 | 26 | 33 | 2 |
| Breast cancer (no.
cases) | 74 | 31 | 54 | 51 | 15 | 90 |
| χ2 | 1.20 |
| 7.013 |
| 74.56 |
|
| P-value |
0.273 |
| 0.008 |
|
<0.001 |
|
In 35 cases of MDE, resistance index (RI) was
0.52–0.86 (mean, 0.593±0.042), including 26 cases of RI ≤0.7 and 9
cases >0.7. In 105 cases of breast cancer, RI was 0.48–0.89
(mean, 0.688±0.086), including 51 cases of RI ≤0.7 and 54 cases
>0.7. There was a statistically significant difference between
the two groups in RI by chi-square test (χ2=7.013,
P=0.008, P<0.05).
In 35 MDE cases, 33 had a UE score of 1–3 and 2 had
a score of 4 and 5. The mean UE score for a patient with MDE was
2.31±0.83. In 105 breast cancer cases, 15 had a UE score of 1–3 and
90 had a score of 4 and 5. The mean UE score for patients with
breast cancer was 3.80±0.69. There was a statistical difference
between the two groups of UE by chi-square test (P<0.001), which
indicated that UE was useful to distinguish between MDE and breast
cancer.
Analysis of MDE and breast cancer with
MRI
MRI was performed to compare MDE and breast cancer.
MDE and breast cancer exhibited heterogeneous high signal in STIR
sequence and homogeneous or heterogeneous high, low, mixed signal
in T1FSE sequence on plain scan with MRI. Diffusion weighted
imaging sequencing identified heterogeneous high signal. The
morphology of lesions was irregular with clear or unclear boundary.
The features of plain scan of MRI and morphology were
unspecific.
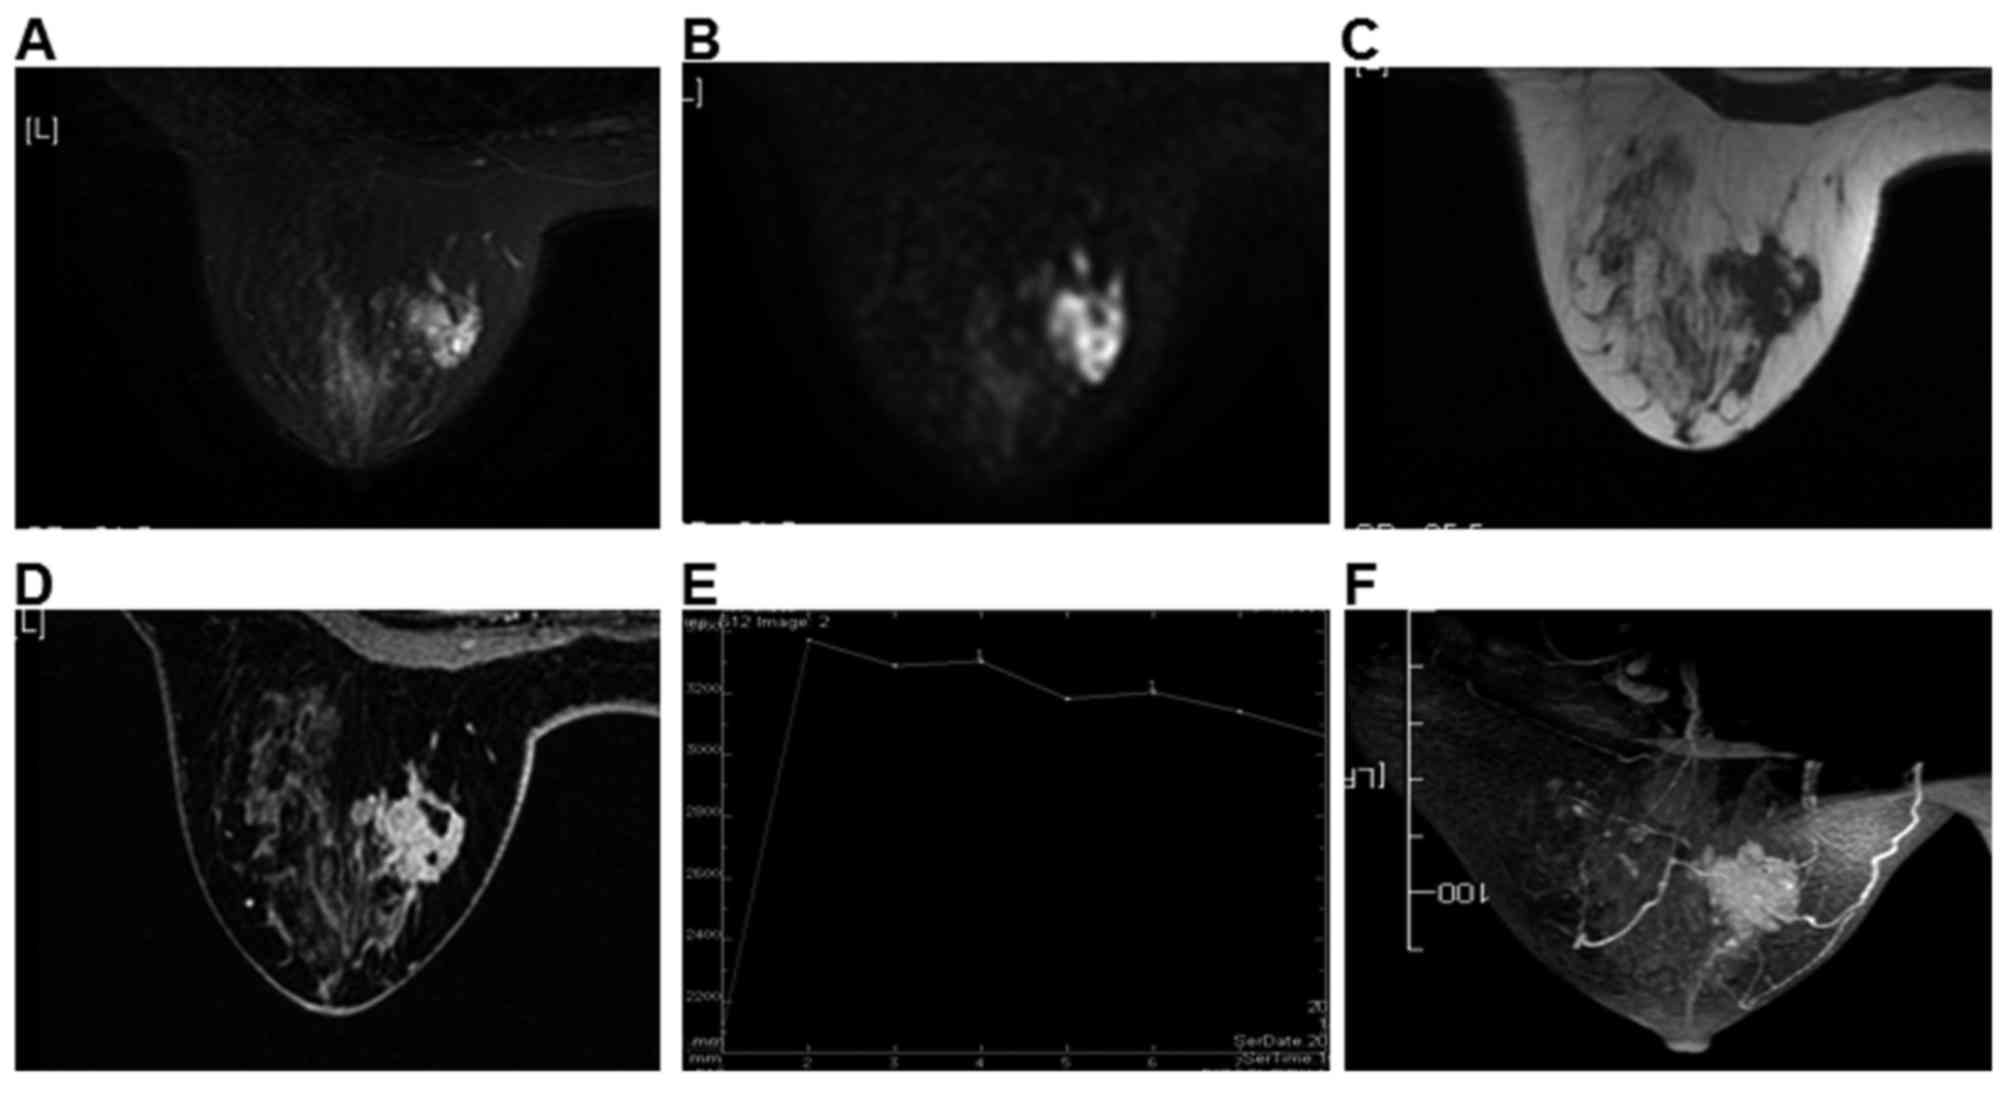
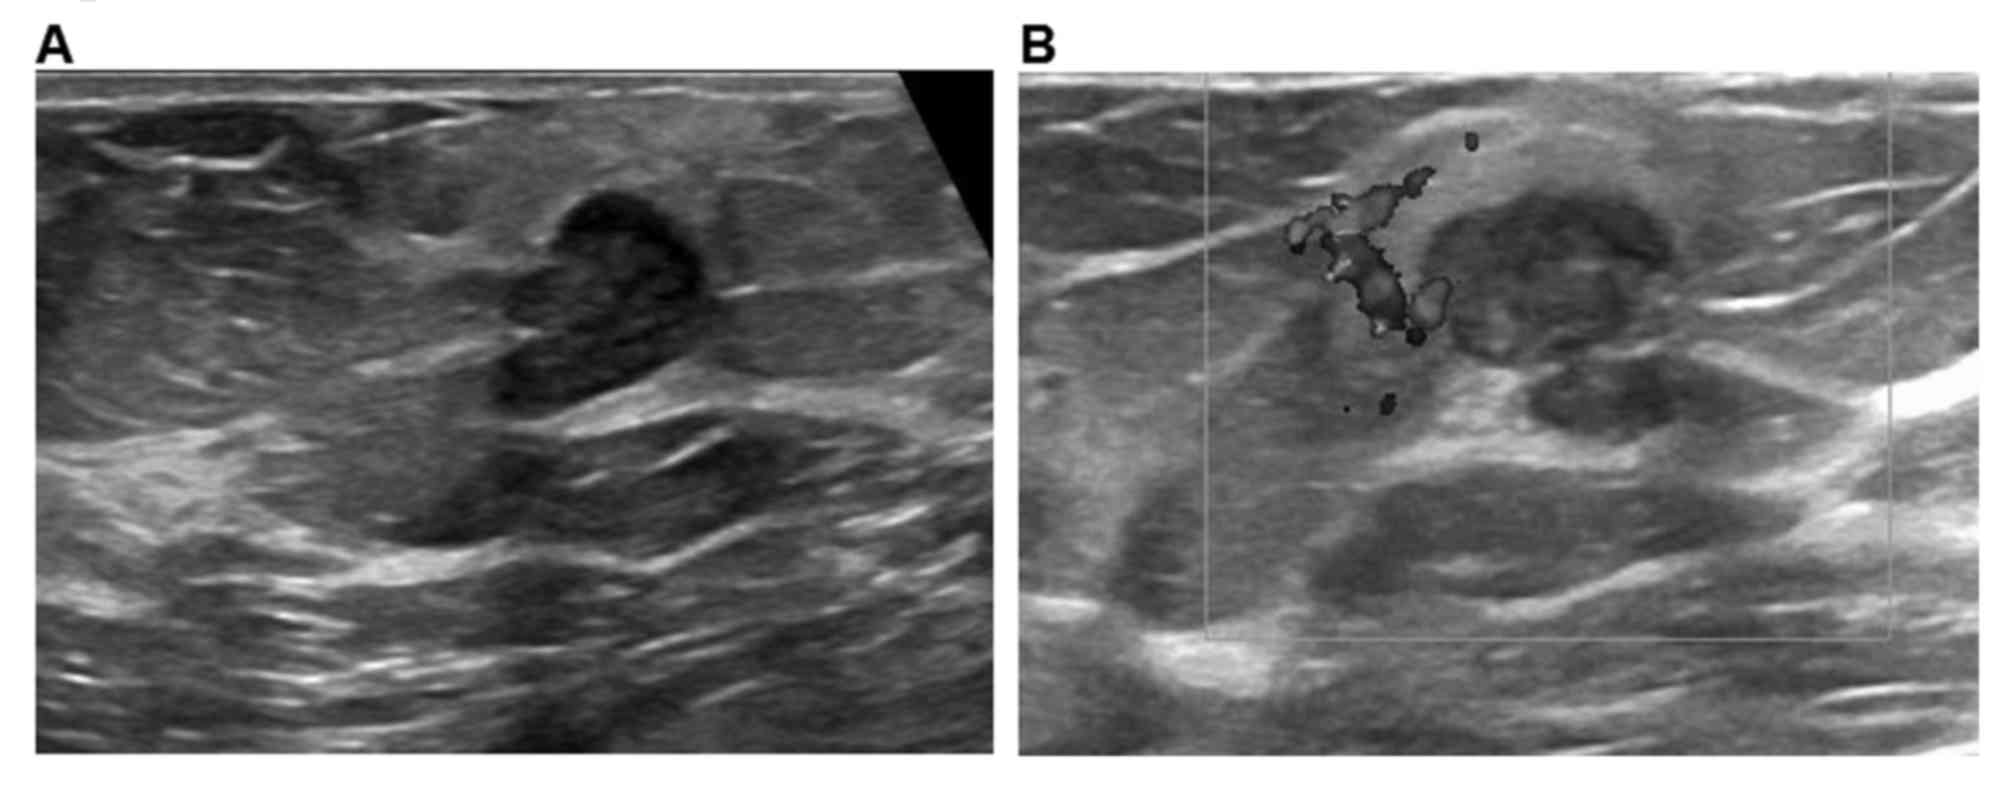
Of 35 cases, DCE-MRI of MDE revealed that 26 lesions
exhibited thickened wall, resembling an enhanced ring, duct or
clumps (Fig. 2); 5 lesions were
enhanced in a patchy or nodular manner; and 4 lesions exhibited
irregular enhancement. All lesions exhibited clear boundaries with
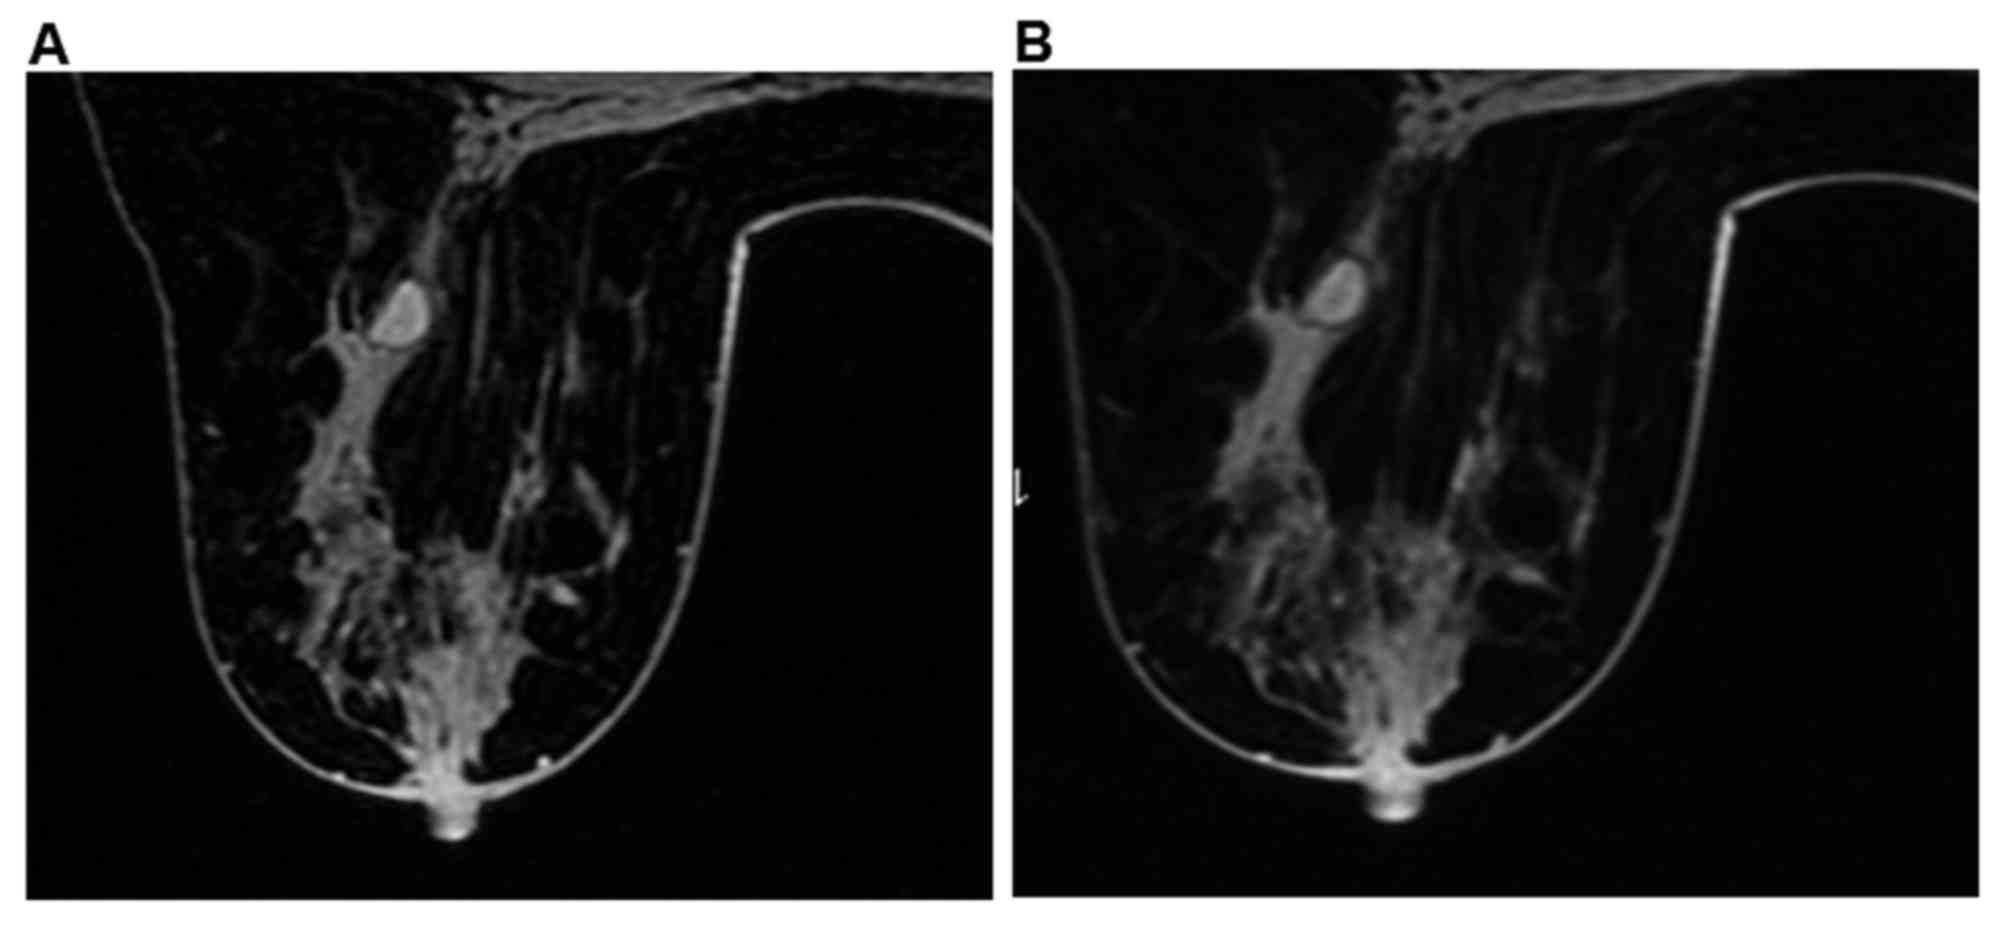
surrounding tissues but not smooth edges. Of the 105 cases, 84
lesions exhibited enhancement (Fig.
3), presenting as peripheral in early phase and center in late
phase (Fig. 4).
As presented in Table
IV, the mean ADC was 1.3±0.19×10⁻³
mm2/sec for MDE and was 1.03±0.32×10⁻³
mm2/sec for breast cancer. There were significant
differences in ADC between the two groups (P<0.001).
| Table IV.Measurement index of MRI for MDE and
breast cancer. |
Table IV.
Measurement index of MRI for MDE and
breast cancer.
| Variables | ADC | EER | PER | T peak |
|---|
| MDE | 1.3±0.19 | 0.67±0.16 | 2.59±0.46 | 248±37 |
| Breast cancer | 1.03±0.32 | 1.03±0.40 | 1.08±0.40 | 169±63s |
| t |
−4.313 |
5.259 | −18.77 |
−7.080 |
| P-value | <0.001 | <0.001 |
0.004 | <0.001 |
For patients with MDE, the mean of EER, PER and
Tpeak was 0.67±0.16, 2.59±0.46 and 248±37 sec,
respectively; for patients with breast cancer, the mean was
1.03±0.40, 1.08±0.40 and 169±63 sec, respectively. There were
significant differences in EER, PER and T peak between the two
groups (P<0.001).
There were 28 lesions of type I, 5 of type II and 2
of type III in TIC for MDE. There were 3 lesions of type I, 47 of
type II and 55 of type III for breast cancer. There were
significant differences of TIC stages between the two groups
(P<0.001).
Diagnostic efficiency of US, MRI and
US with MRI
To determine the diagnostic values, diagnostic
efficiency of US, MRI and US with MRI were compared. As presented
in Table V, for the 35 patients with
MDE, 30 were finally diagnosed with MDE, 3 were finally diagnosed
with intraductal papilloma (IDP) and 2 were finally diagnosed with
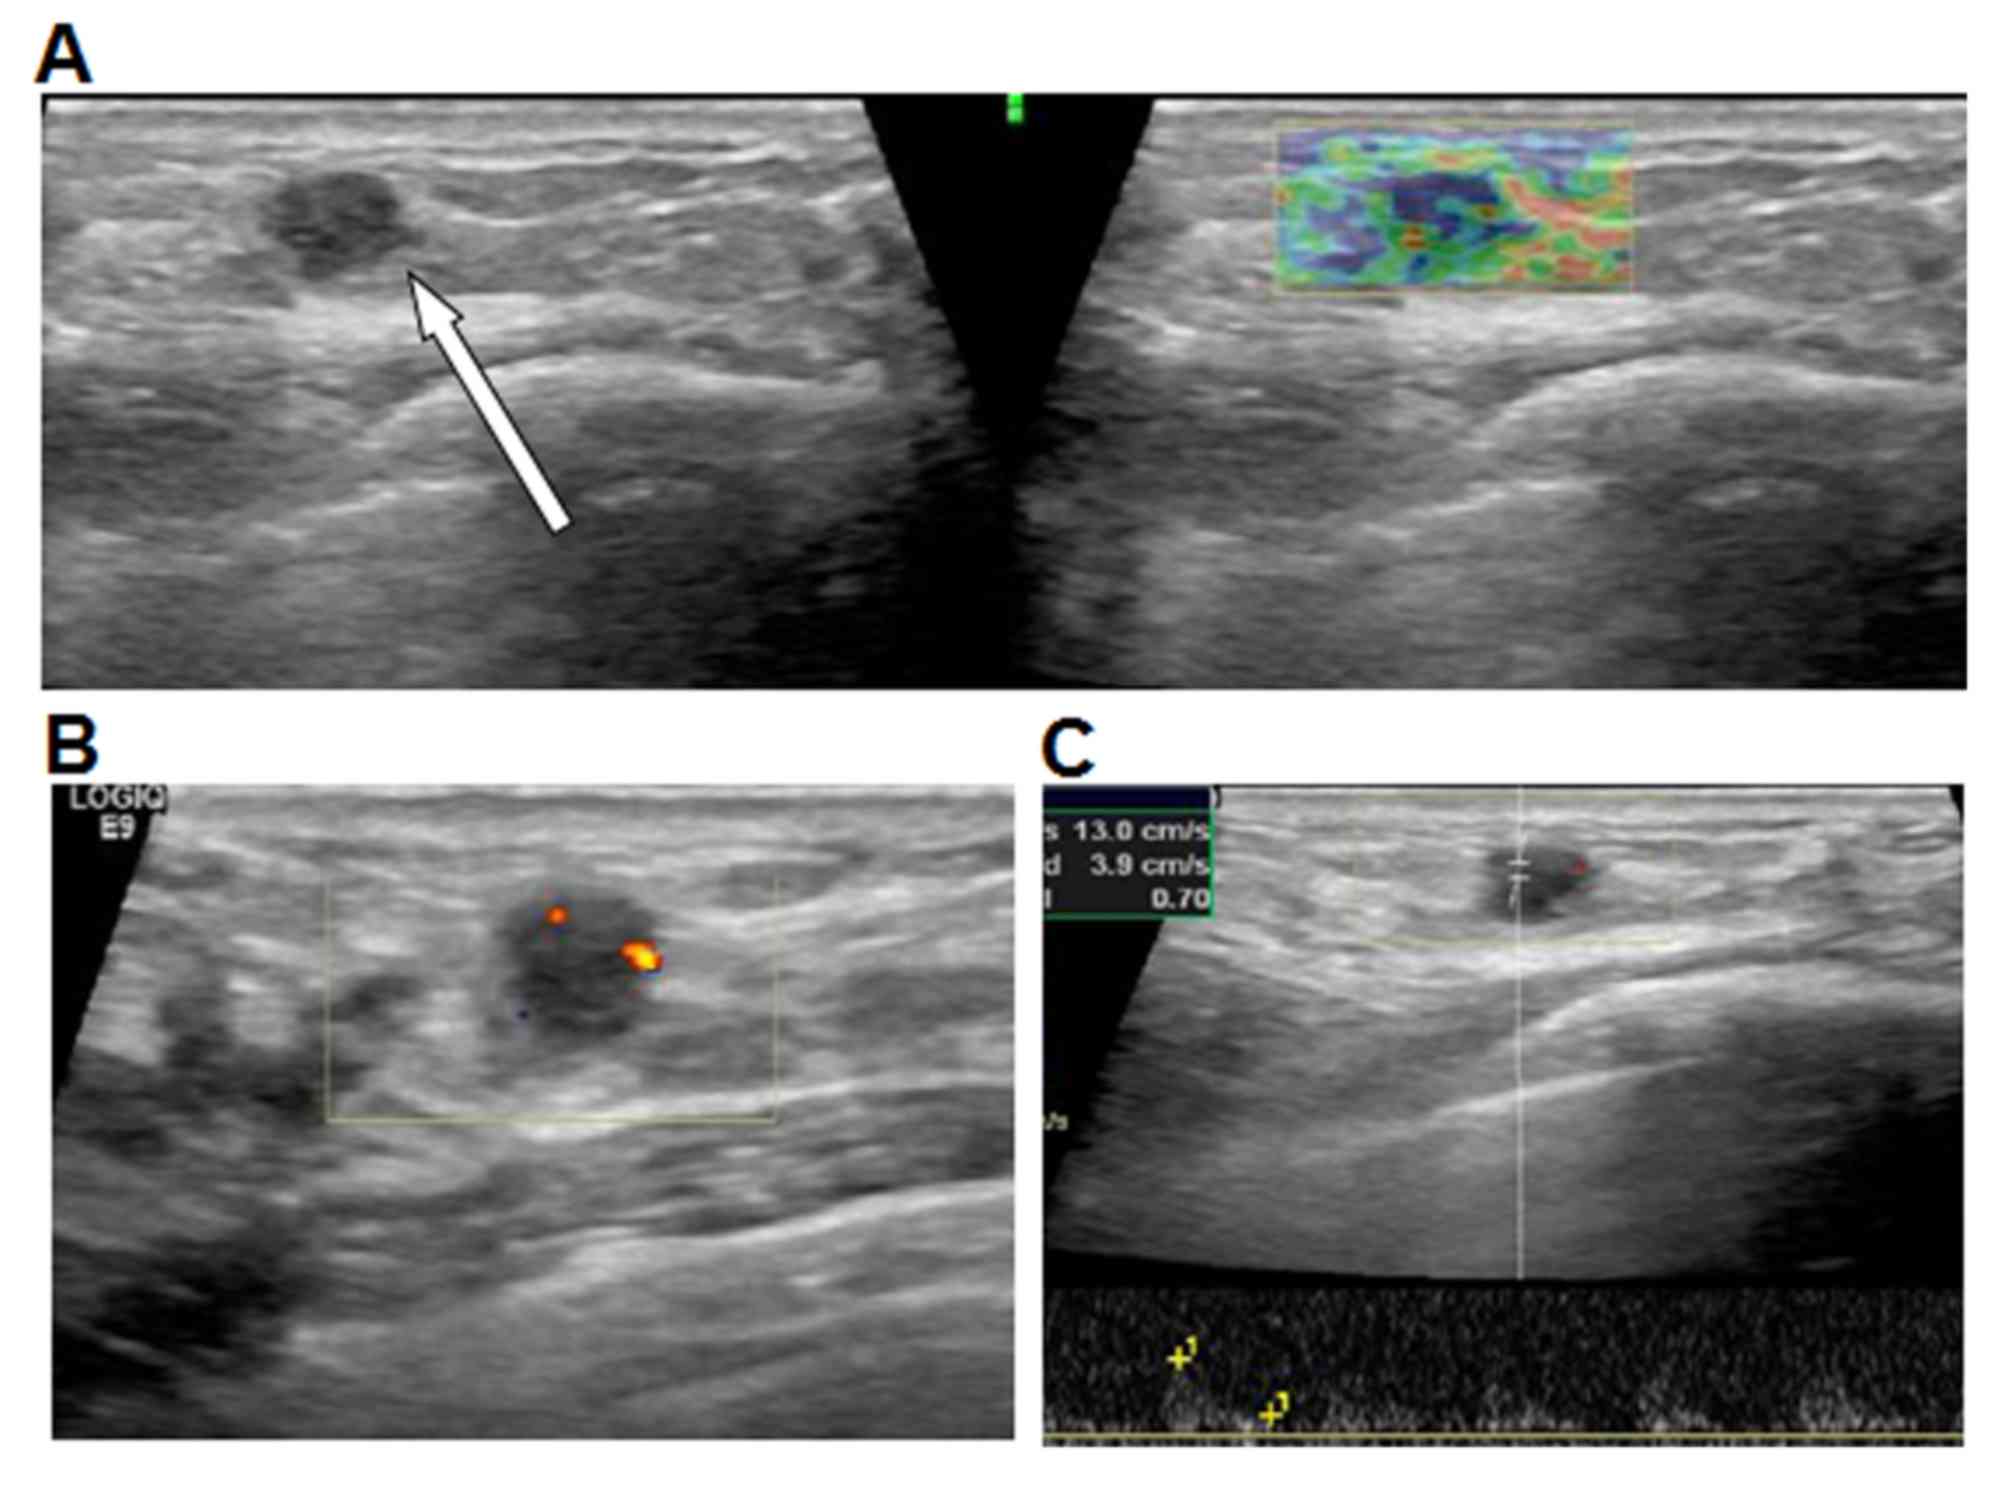
breast cancer by US (Figs. 5 and
6). For patients with breast cancer,
99/105 patients were finally diagnosed with breast cancer by US. In
total, 1 patient with invasive ductal carcinoma (IDC) was
misdiagnosed with intraductal papilloma (Fig. 7) by US; 2 patients with invasive
ductal carcinoma were misdiagnosed as MDE; and 3 patients with
intraductal carcinoma were misdiagnosed as inflammatory lesion,
tumor-like hyperplasia and hyperplastic nodules, respectively.
| Table V.Diagnostic efficiency of US, MRI and
US with MRI. |
Table V.
Diagnostic efficiency of US, MRI and
US with MRI.
|
| US | MRI | US with MRI |
|---|
|
|
|
|
|
|---|
| Variables | Yes | No | Yes | No | Yes | No |
|---|
| MDE | 30 | 5 | 32 | 3 | 33 | 2 |
| Breast cancer | 99 | 6 | 101 | 4 | 102 | 3 |
| χ2
value | 2.664 |
| 1.253 |
| 0.622 |
|
| P-value | 0.103 |
| 0.263 |
| 0.403 |
|
Of the 35 patients with MDE, 32 were finally
diagnosed as MDE, 1 was diagnosed as IDP and 2 were diagnosed as
breast cancer by MRI. For breast cancer patients, 101/105 patients
were finally diagnosed as breast cancer by MRI. In total, 1 IDC
patient was misdiagnosed with intraductal papilloma; 2 patients
with invasive ductal carcinoma were misdiagnosed with MDE; and 1
patient with intraductal carcinoma was misdiagnosed with tumor-like
hyperplasia.
Of the 35 patients with MDE, 33 were finally
diagnosed with MDE, 1 was diagnosed with IDP and 1 was diagnosed
with breast cancer by US and MRI. For patients with clinically
suspected breast cancer, 102/105 patients were finally diagnosed
with breast cancer by US and MRI. A single patient with IDC was
misdiagnosed with intraductal papilloma. A pair of patients with
invasive ductal carcinoma were misdiagnosed with MDE and
fibroadenoma.
There were no differences in diagnostic efficiency
among US, MRI and US with MRI (P=0.103, P=0.263 and P=0.403,
respectively).
Discussion
In previous years, the incidence rate of breast
cancer has been increasing and there is a lack of effective
preventive measures (15). In
addition, it is difficult to cure, despite its high incidence
(1). It has been demonstrated that
the imaging features of MDE may be similar to those of breast
cancer (2). It is therefore important
to distinguish MDE from breast cancer (16).
The mean age of patients with MDE was 33.58±8.81
years in the present study, consistent with another report
(17). However, the mean age of
patients with breast cancer was 44.97±11.04 years, inconsistent
with Jemal et al (18) who
demonstrated that breast cancer frequently occurred in patients at
the age of 50–69 years; however, Labib et al (19) demonstrated that the mean age was
46.3±12.4 years, similar to the present study.
The present study revealed that the morphology
features, including aspect ratio, border, shape and
microcalcification were significantly increased in breast cancer
compared with MDE. Features including unclear border, irregular,
spicular sign and microcalcification, were unspecific for breast
cancer, consistent with the report by Yabuuchi et al
(20). The features of MDE were of
regular shape and clear border, similar to other benign tumors.
CDFI grading may not be used to distinguish breast
cancer and MDE. The RI and elastography score are useful in the
differential diagnosis between breast cancer and MDE (9). It is reported that CDFI grading of II or
III may be specific in diagnosing the malignancy of breast cancer
(21–23). Stanzani et al (24) reported that the sensitivity and
specificity were 72 and 67% in benign and malignant RI,
respectively (threshold value, 0.75). Although the RI of benignancy
and malignancy may overlap and the threshold value differs among
studies, it was useful to distinguish the benign and malignant
tumors (24,25).
Gong et al (26) reported that UE may be as useful as
traditional US, with sensitivity, specificity and accuracy of
92.65, 73.39 and 81.25%, respectively. Combined with UE and US, the
specificity and accuracy could increase to 95.97 and 93.23%.
Fischer et al (27)
demonstrated that UE could be used to distinguish the breast cancer
lesions with BI-RADS of 3–4, small diameter (<2 cm) and
nontypical morphology. In the present study, it was revealed that
UE was important to improve the specificity and accuracy of
diagnosis, consistent with previous studies (6,28). Cho
et al (29) also supported
that UE was important in the differential diagnosis of benign and
malignant tumors.
Caivano et al (30) demonstrated that the ADC value of
benign and malignant were 2.06±0.19×10⁻³
mm2/sec and 1.03±0.07×10⁻³
mm2/sec, respectively. In the present study, the ADC was
1.3±0.19×10⁻³ mm2/sec for MDE, decreased
compared with that of the benign tumor and ADC was
1.03±0.32×10⁻³ mm2/sec for breast cancer,
within the range of that of the malignant tumors. Caivano et
al (30) demonstrated that for
benign tumors, the mean ADC value was 3.42±1.04×10⁻³
mm2/sec for cysts, 1.57±0.78×10⁻³
mm2/sec for fibroadenomas, 0.81±0.13×10⁻³
mm2/sec for mammitis and 1.32±0.11×10⁻³
mm2/sec for tumor without fluid, which was consistent
with the present study (mean ADC, 1.3±0.19×10⁻³
mm2/sec for MDE and 1.32±0.11×10⁻³
mm2/sec for tumor). Luo et al (31) demonstrated that the sensitivity and
specificity of ADC were 74.1 and 70.3% respectively, with a
threshold value of 1.2×10⁻³ mm2/sec. Yabuuchi
et al (20) demonstrated that
sensitivity, specificity, accuracy, positive and negative
predictive value were 92, 86, 97, 71 and 91% respectively, with a
threshold value of 1.1×10⁻³ mm2/sec, which
were important indicators for diagnosis and differential diagnosis.
In the present study there was a significant difference in ADC
between MDE and breast cancer groups (threshold value,
1.2×10⁻³ mm2/sec), indicating the important
function of ADC in the differential diagnosis.
A previous study demonstrated that the enhancement
features of breast cancer were ring-like, with the rim of the
lesion enhanced in the early phase, then moving to the center
(32). The present study revealed
that the enhancement in MDE (26/35) was ring-like or duct-like with
thickening of the pipe wall, while the center was not enhanced in
the delayed phase. Enhancement patterns were distinct between
breast cancer and MDE; when the lesion was enhanced in a ring-like
manner, the enhancement and timing of the lesion center should be
observed.
Luo et al (31)
demonstrated that the EER was increased and PER was decreased in
malignant tumors compared with that in benign tumors. In the
present study, EER was 1.03±0.40 in the breast cancer group and
0.67±0.16 in the MDE group, while PER was 1.08±0.40 in the breast
cancer group and 2.59±0.46 in the MDE group, consistent with Luos
data (31). Yuan et al
(33) reported that the earlier the
peak time, the greater the likelihood of malignancy. If peak time
was <180 sec, all the lesions may be malignant; if peak time was
180–270 sec, the malignancy rate was 85.7%; if peak time was
>270 sec, all the lesions were benign. Sensitivity and
specificity of peak time (cut-off value, 270 sec) were 95.83 and
92.30%, respectively. The mean Tpeak of breast cancer
was 169±63 sec, consistent with the malignancy of <180 sec. The
mean Tpeak of MDE was 248±37 sec, ranging between
180–270 sec, exhibiting benign enhancement in the early phase.
Fernández-Guinea et al (34)
demonstrated that the nodules that were <2 cm in diameter were
enhanced homogeneously with obscure boundary, increased
microvascular density and spicular sign compared with those that
were smooth and clear. Tpeak time <2 min indicated
the association of more vessels compared with Tpeak time
>2 min. The lesions with PER <150% were larger compared with
those with PER >150%. PER in the present study was consistent
with the results of Fernández-Guinea et al (34). Peak intensity was associated with the
degree of vessel formation. In Fernández-Guinea et al
(34), the indexes had an advantage
in recognizing the malignant lesions, including unclear boundary or
spicular, uneven or ring-like enhancement, type III TIC with
diagnosis rates of 75, 81.2 and 57.4%, respectively; in the present
study, the rates were 92.4, 85.6 and 52.4%, respectively.
It has been reported (31) that the majority of benign lesions
belonged to type I TIC and malignant lesions presented type II and
III, which was consistent with the results of the present study. In
the MDE group, 28/35 (80%) cases were type I and 7/35 (20%) cases
were type II and III; in the breast cancer group, 3/105 cases
(2.9%) were type I and 102/105 (97.1%) were type II and III.
Brookes et al (35) reported
that intraductal papilloma was enhanced peripherally and then the
center was enhanced. The majority of the intraductal papillomas
were type II and III, similar to invasive ductal carcinoma
(36), thus it was difficult to
distinguish. Yuan et al (33)
demonstrated that TIC pattern and Tpeak were the most
valuable factors for differential diagnosis.
Analyzing multiple parameters identified that US and
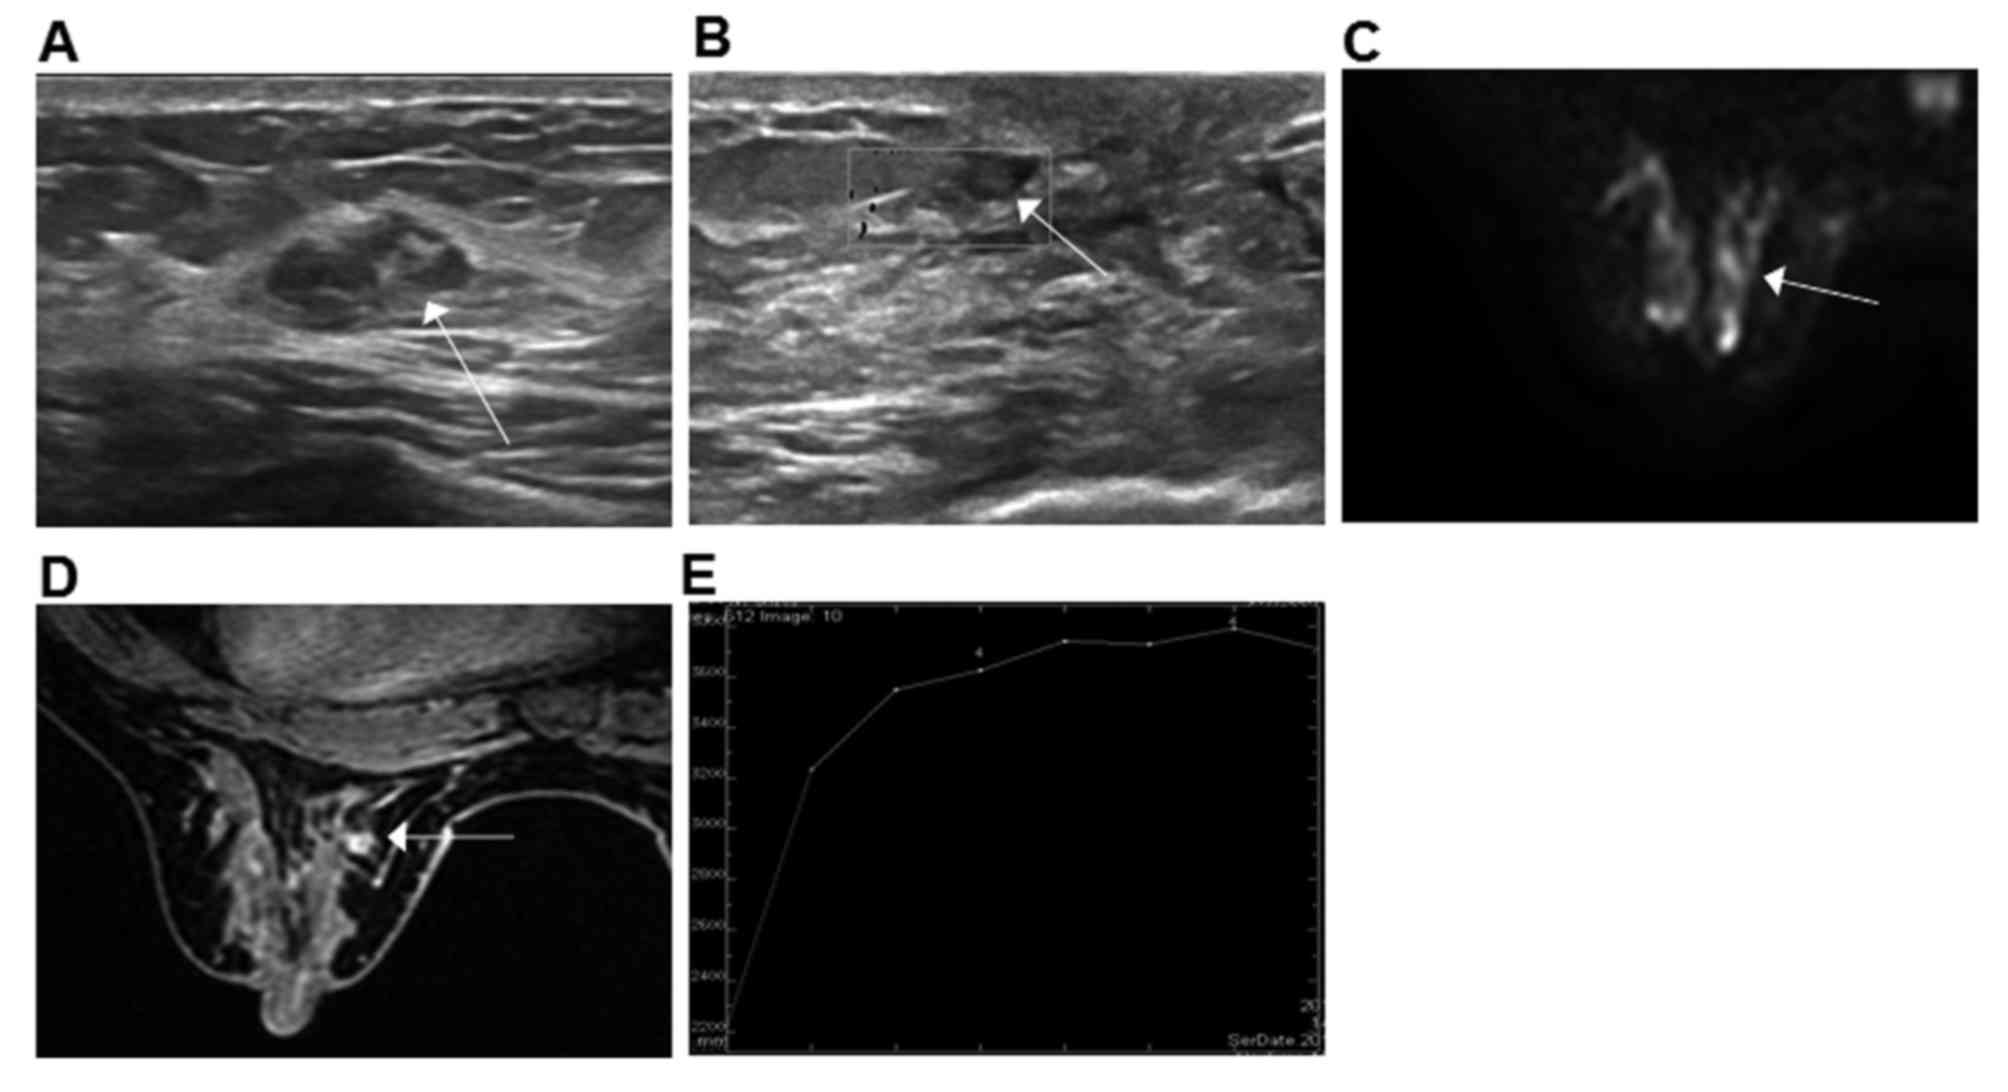
MRI together may decrease the rate of misdiagnosis. There were 4
cases misdiagnosed as IDP, including 3 cases of MDE and 1 case of
breast cancer. This was due to the IDP features being similar to
those of MDE (type II), presenting with cyst-and-solid mass. US
revealed a circle or oval solid echo with dotted or branched blood
signals in dilated duct with a clear border and regular form
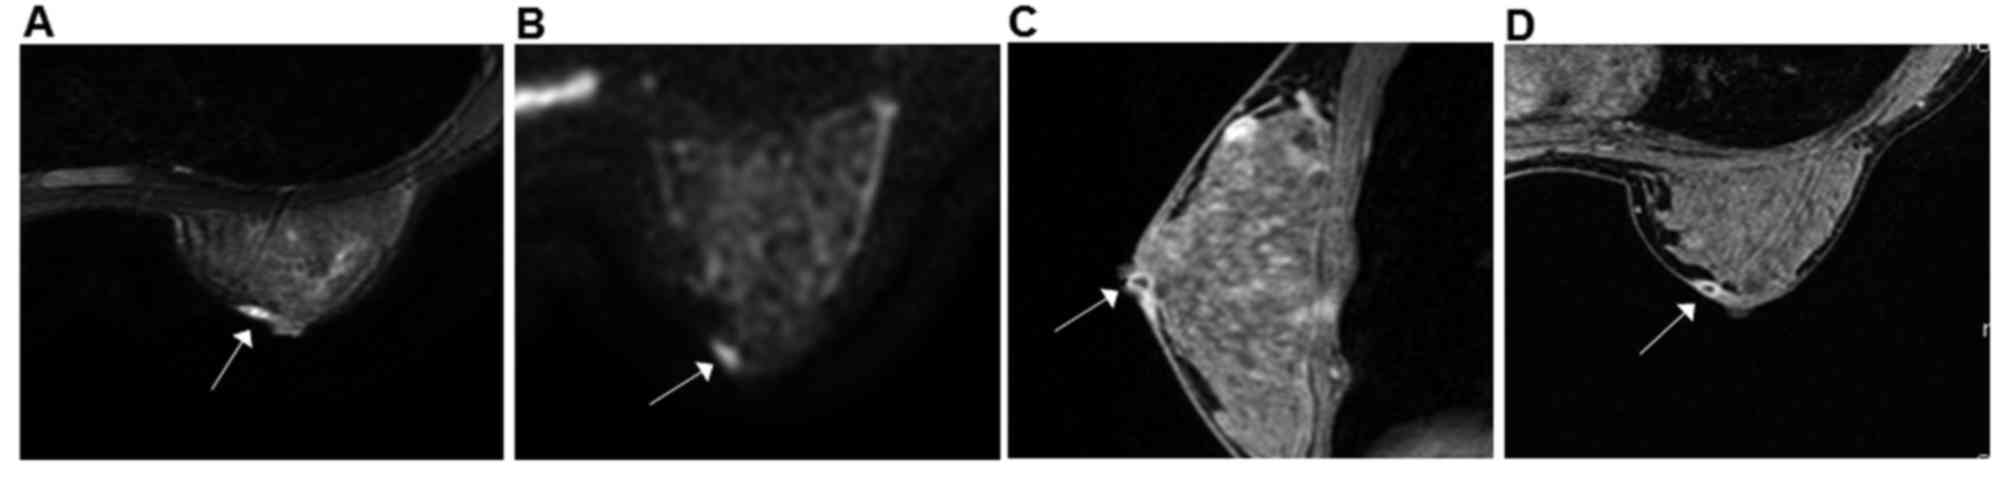
(Fig. 8A and B). The majority of
cases of MDE were located beneath the mammary areola, together with
nipple retraction, sinus tract and fistula. The majority of IDP
cases may attack the breast duct at level II or III. The
predilection site may assist the diagnosis.
MRI identified the dotted, cord-like or small piece
of low signal nodular (Fig. 8C and D)
scattered following the duct and a spicule sign was seldom
observed. The mean ADC value of IDP was between the value of normal
breast and breast cancer. Woodhams et al (37) demonstrated that the mean ADC of IDP
was 1.32±0.15×10⁻³ mm2/sec. In the MDE group,
the ADC of MDE (1.3±0.19×10⁻³ mm2/sec) were
similar. Brookes et al (35)
revealed that IDP was benign with a rich blood supply that may be
enhanced in the early phase with an enhancement rate decreased
compared with breast cancer. The majority of TIC was type II and
the minority were type III, similar to breast cancer (Fig. 8E). The underlying reasons may be as
follows: i) IDP typically locates in the lactiferous sinus of the
big latex duct near the nipple, which is supplied with rich blood;
ii) blood is piled up in the latex duct; and iii) increased
sensitivity and decreased specificity of MRI (37), consistent with the present study. IDP,
MDE and breast cancer may all present as typeIIof TIC, therefore,
TIC may not be used for differential diagnosis without other
indicators.
The present study did not identify any significant
differences in the diagnostic efficiency of MDE and breast cancer
with US, MRI and US with MRI, which suggested that these three
methods were equally efficient. Although multiple quantitative
parameters and morphology alterations in US with MRI may still
misdiagnose MDE and breast cancer, combining US and MRI may
decrease the misdiagnosis rate. Therefore, further studies may use
US and MRI in the diagnosis of MDE and breast cancer.
Acknowledgements
The present study was supported by The Shandong
Provincial Science and Technology Development Program (grant no.
2014GSF118139) and the Shandong Major Development Program (grant
no. 2016GSF201130).
References
|
1
|
Rahal RM, de Freitas-Júnior R, da Cunha L
Carlos, Moreira MA, Rosa VD and Conde DM: Mammary duct ectasia: An
overview. Breast J. 17:694–695. 2011. View Article : Google Scholar : PubMed/NCBI
|
|
2
|
Kim BS, Lee JH, Kim WJ, Kim DC, Shin S,
Kwon HJ, Park JS and Park YM: Periductal mastitis mimicking breast
cancer in a male breast. Clin Imaging. 37:574–576. 2013. View Article : Google Scholar : PubMed/NCBI
|
|
3
|
Duchesne N, Skolnik S and Bilmer S:
Ultrasound appearance of chronic mammary duct ectasia. Can Assoc
Radiol J. 56:297–300. 2005.PubMed/NCBI
|
|
4
|
Masciadri N and Ferranti C: Benign breast
lesions: Ultrasound. J Ultrasound. 14:55–65. 2011. View Article : Google Scholar : PubMed/NCBI
|
|
5
|
Yamauchi H, Woodward WA, Valero V, Alvarez
RH, Lucci A, Buchholz TA, Iwamoto T, Krishnamurthy S, Yang W,
Reuben JM, et al: Inflammatory breast cancer: What we know and what
we need to learn. Oncologist. 17:891–899. 2012. View Article : Google Scholar : PubMed/NCBI
|
|
6
|
Alhabshi SM, Rahmat K, Halim N Abdul, Aziz
S, Radhika S, Gan GC, Vijayananthan A, Westerhout CJ, Mohd-Shah MN,
Jaszle S, et al: Semi-quantitative and qualitative assessment of
breast ultrasound elastography in differentiating between malignant
and benign lesions. Ultrasound Med Biol. 39:568–578. 2013.
View Article : Google Scholar : PubMed/NCBI
|
|
7
|
Suppiah S, Rahmat K, Rozalli FI and Azlan
CA: Re: Improved diagnostic accuracy in differentiating malignant
and benign lesions using single-voxel proton MRS of the breast at 3
T MRI. A reply. Clin Radiol. 69:e110–e111. 2014. View Article : Google Scholar : PubMed/NCBI
|
|
8
|
Min Q, Shao K, Zhai L, Liu W, Zhu C, Yuan
L and Yang J: Differential diagnosis of benign and malignant breast
masses using diffusion-weighted magnetic resonance imaging. World J
Surg Oncol. 13:322015. View Article : Google Scholar : PubMed/NCBI
|
|
9
|
Zhang F, Yu D, Guo M, Wang Q, Yu Z, Zhou
F, Zhao M, Xue F and Shao G: Ultrasound elastography and magnetic
resonance examinations are effective for the accurate diagnosis of
mammary duct ectasia. Int J Clin Exp Med. 8:8506–8515.
2015.PubMed/NCBI
|
|
10
|
Hsu HH, Yu JC, Hsu GC, Chang WC, Yu CP,
Tung HJ, Tzao C and Huang GS: Ultrasonographic alterations
associated with the dilatation of mammary ducts: Feature analysis
and BI-RADS assessment. Eur Radiol. 20:293–302. 2010. View Article : Google Scholar : PubMed/NCBI
|
|
11
|
Itoh A, Ueno E, Tohno E, Kamma H,
Takahashi H, Shiina T, Yamakawa M and Matsumura T: Breast disease:
Clinical application of US elastography for diagnosis. Radiology.
239:341–350. 2006. View Article : Google Scholar : PubMed/NCBI
|
|
12
|
Goddi A, Bonardi M and Alessi S: Breast
elastography: A literature review. J Ultrasound. 15:192–198. 2012.
View Article : Google Scholar : PubMed/NCBI
|
|
13
|
Radiology ACo, . Breast imaging reporting
and data system (BI-RADS). 4th. Reston, VA: American College of
Radiology; 2003
|
|
14
|
El Khouli RH, Macura KJ, Jacobs MA, Khalil
TH, Kamel IR, Dwyer A and Bluemke DA: Dynamic contrast-enhanced MRI
of the breast: Quantitative method for kinetic curve type
assessment. AJR Am J Roentgenol. 193:W295–W300. 2009. View Article : Google Scholar : PubMed/NCBI
|
|
15
|
Howell A, Anderson AS, Clarke RB, Duffy
SW, Evans DG, Garcia-Closas M, Gescher AJ, Key TJ, Saxton JM and
Harvie MN: Risk determination and prevention of breast cancer.
Breast Cancer Res. 16:4462014. View Article : Google Scholar : PubMed/NCBI
|
|
16
|
Holley SO, Appleton CM, Farria DM,
Reichert VC, Warrick J, Allred DC and Monsees BS: Pathologic
outcomes of nonmalignant papillary breast lesions diagnosed at
imaging-guided core needle biopsy. Radiology. 265:379–384. 2012.
View Article : Google Scholar : PubMed/NCBI
|
|
17
|
Cheng J, Ding HY and DU YT: Granulomatous
lobular mastitis associated with mammary duct ectasia: A
clinicopathologic study of 32 cases with review of literature.
Zhonghua Bing Li Xue Za Zhi. 42:665–668. 2013.(In Chinese).
PubMed/NCBI
|
|
18
|
Jemal A, Ward E and Thun MJ: Recent trends
in breast cancer incidence rates by age and tumor characteristics
among U.S. women. Breast Cancer Res. 9:R282007. View Article : Google Scholar : PubMed/NCBI
|
|
19
|
Labib NA, Ghobashi MM, Moneer MM, Helal MH
and Abdalgaleel SA: Evaluation of BreastLight as a tool for early
detection of breast lesions among females attending national cancer
institute, Cairo University. Asian Pac J Cancer Prev. 14:4647–4650.
2013. View Article : Google Scholar : PubMed/NCBI
|
|
20
|
Yabuuchi H, Matsuo Y, Okafuji T, Kamitani
T, Soeda H, Setoguchi T, Sakai S, Hatakenaka M, Kubo M, Sadanaga N,
et al: Enhanced mass on contrast-enhanced breast MR imaging: Lesion
characterization using combination of dynamic contrast-enhanced and
diffusion-weighted MR images. J Magn Reson Imaging. 28:1157–1165.
2008. View Article : Google Scholar : PubMed/NCBI
|
|
21
|
Li B, Zhao X, Dai SC and Cheng W:
Associations between mammography and ultrasound imaging features
and molecular characteristics of triple-negative breast cancer.
Asian Pac J Cancer Prev. 15:3555–3559. 2014. View Article : Google Scholar : PubMed/NCBI
|
|
22
|
Zeng H, Zhao YL, Huang Y, Lin X, Chen XY
and Li AH: Values of color doppler flow imaging and imaging changes
of breast fascia and ligament in differential diagnosis of small
breast neoplasms. Ai Zheng. 25:339–342. 2006.(In Chinese).
PubMed/NCBI
|
|
23
|
Yang M, Liu F, Gu XN, Cai YL, Wang YY and
Zhou WJ: The application value of BI-RADS lexicon and
high-frequency CDFI scoring in differentiation of benign from
malignant lesions of the breast. Zhonghua Yi Xue Za Zhi.
93:1833–1835. 2013.(In Chinese). PubMed/NCBI
|
|
24
|
Stanzani D, Chala LF, Barros Nd, Cerri GG
and Chammas MC: Can Doppler or contrast-enhanced ultrasound
analysis add diagnostically important information about the nature
of breast lesions? Clinics (Sao Paulo). 69:87–92. 2014. View Article : Google Scholar : PubMed/NCBI
|
|
25
|
del Cura JL, Elizagaray E, Zabala R,
Legórburu A and Grande D: The use of unenhanced Doppler sonography
in the evaluation of solid breast lesions. AJR Am J Roentgenol.
184:1788–1794. 2005. View Article : Google Scholar : PubMed/NCBI
|
|
26
|
Gong X, Wang Y and Xu P: Application of
real-time ultrasound elastography for differential diagnosis of
breast tumors. J Ultrasound Med. 32:2171–2176. 2013. View Article : Google Scholar : PubMed/NCBI
|
|
27
|
Fischer T, Sack I and Thomas A:
Characterization of focal breast lesions by means of elastography.
Rofo. 185:816–823. 2013. View Article : Google Scholar : PubMed/NCBI
|
|
28
|
Hassan HHM, Zahran MHM, Hassan HEP,
Abdel-Hamid AEM and Fadaly GAS: Diffusion magnetic resonance
imaging of breast lesions: Initial experience at Alexandria
University. Alex J Med. 49:265–272. 2013. View Article : Google Scholar
|
|
29
|
Cho N, Jang M, Lyou CY, Park JS, Choi HY
and Moon WK: Distinguishing benign from malignant masses at breast
US: Combined US elastography and color doppler US-influence on
radiologist accuracy. Radiology. 262:80–90. 2012. View Article : Google Scholar : PubMed/NCBI
|
|
30
|
Caivano R, Villonio A, D' Antuono F,
Gioioso M, Rabasco P, Iannelli G, Zandolino A, Lotumolo A, Dinardo
G, Macarini L, et al: Diffusion weighted imaging and apparent
diffusion coefficient in 3 tesla magnetic resonance imaging of
breast lesions. Cancer Invest. 33:159–164. 2015. View Article : Google Scholar : PubMed/NCBI
|
|
31
|
Luo Y, Yu J, Chen D, Xu Z and Zeng H: The
actions of diffusion weighted imaging (DWI) and dynamic contrast
enhanced MRI in differentiating breast tumors. Sheng Wu Yi Xue Gong
Cheng Xue Za Zhi. 30:1219–1223. 2013.(In Chinese). PubMed/NCBI
|
|
32
|
Yeh ED, Slanetz PJ, Edmister WB, Talele A,
Monticciolo D and Kopans DB: Invasive lobular carcinoma: Spectrum
of enhancement and morphology on magnetic resonance imaging. Breast
J. 9:13–18. 2003. View Article : Google Scholar : PubMed/NCBI
|
|
33
|
Yuan HM, Yu JQ, Chu ZG and Peng LQ:
Distinguishing benign and malignant lesions with time-signal
intensity curve of dynamic contrast-enhanced breast MRI scanning.
Sichuan Da Xue Xue Bao Yi Xue Ban. 42:556–559. 2011.(In Chinese).
PubMed/NCBI
|
|
34
|
Fernández-Guinea O, Andicoechea A,
González LO, González-Reyes S, Merino AM, Hernández LC, López-Muñiz
A, García-Pravia P and Vizoso FJ: Relationship between
morphological features and kinetic patterns of enhancement of the
dynamic breast magnetic resonance imaging and clinico-pathological
and biological factors in invasive breast cancer. BMC Cancer.
10:82010. View Article : Google Scholar : PubMed/NCBI
|
|
35
|
Brookes MJ and Bourke AG: Radiological
appearances of papillary breast lesions. Clin Radiol. 63:1265–1273.
2008. View Article : Google Scholar : PubMed/NCBI
|
|
36
|
Zhu Y, Zhang S, Liu P, Lu H, Xu Y and Yang
WT: Solitary intraductal papillomas of the breast: MRI features and
differentiation from small invasive ductal carcinomas. AJR Am J
Roentgenol. 199:936–942. 2012. View Article : Google Scholar : PubMed/NCBI
|
|
37
|
Woodhams R, Matsunaga K, Kan S, Hata H,
Ozaki M, Iwabuchi K, Kuranami M, Watanabe M and Hayakawa K: ADC
mapping of benign and malignant breast tumors. Magn Reson Med Sci.
4:35–42. 2005. View Article : Google Scholar : PubMed/NCBI
|