Introduction
Gastric cancer (GC) originates in the stomach. It is
well established that stomach cancer typically develops gradually
over several years in China (1). The
initial signs and symptoms include heartburn, upper abdominal pain,
nausea and loss of appetite. The advanced case symptoms include
weight loss, whiteness of eyes, yellow skin, nausea, difficulty
with swallowing and blood in the stool (2). GC may migrate to other organs, including
the liver, lungs, bones, lining of the abdomen and lymph nodes
(3). Diagnosis is generally
determined on the basis of biopsy during endoscopy, and medical
imaging technology is used to identify if the disease has
progressed to other parts of the body (4). Helicobacter pylori (H. pylori) infection
is a leading cause of GC, which accounts for >60% of cases
(5), and numerous types of H. pylori,
eating pickled vegetables and smoking serve leading roles in the
development of GC. Stomach cancer is the fourth most common type of
cancer and the second leading cause of cancer-associated mortality
worldwide (6). Currently, therapeutic
options for the treatment of GC remain inadequate; they include the
combination of chemotherapy, radiation therapy, targeted therapy
and surgery (7). Therefore,
understanding the underlying molecular mechanisms of the
carcinogenesis of GC would be useful for designing strategies for
the prevention, treatment and control of cancer (8).
A challenge for the application of large-scale
functional genomics to cancer research is the identification of the
expression profile as a potential source of specific cancer genes
that are useful as biomarkers. Previous studies have investigated
differentially expressed genes (DEGs) between tumor and normal
tissues using high-throughput screening technologies, which to some
extent provide numerous possible diagnostic and prognostic
biomarkers (9–11). However, GC is a systemic biological
disease, and its heterogeneity and the complexity of developing
carcinogenesis complicate the diagnosis and determination of its
progression (12,13). In the present study, the gap between
driver mutations and pathological characteristics of tumor cells
are discussed, in addition to facilitating the identification of
specific DEGs as potential biomarkers for GC and furthering the
understanding of the molecular basis of gene regulation.
The introduction of next-generation sequencing,
RNA-seq technology, provides a method for detecting the
transcriptome with high precision and at a reasonable cost
(14). The present study was designed
to illustrate the transcriptome profile in GC tissues and compare
it with healthy gastric mucosa using RNA-seq technology.
Comparative analyses of gene expression levels were performed to
detect DEGs in GC and normal tissues. Thus, the present study
generated a large quantity of information on DEGs in Chinese GC
tissues vs. normal tissues, which may provide valuable information
for evaluation of the underlying molecular mechanism of
carcinogenesis, detection of disease markers and the identification
of novel targeted anticancer drugs.
Materials and methods
Subject samples
Tissue specimens used in the present study,
including tumor and distal normal tissues, were prospectively
collected between June 2012 and June 2015 in the Department of
Gastroenterology and Surgery, Shanghai Pudong Hospital, Fudan
University, Pudong Medical Center (Shanghai, China). The present
study included a total of 33 control subjects and 33 patients with
GC, who were further divided into the transcriptome profiling
groups based on deep sequencing (GC, n=3 patients; controls, n=3
patients) and validation cohorts (GC, n=30; controls, n=30). All
patients were Han Chinese. Gastric biopsy samples were obtained
from the pyloric antrum of the stomach of control subjects who were
referred for upper GI endoscopies due to dyspeptic symptoms, had no
previous history of malignancy and no autoimmune or inflammatory
disease. GC tissue samples were obtained from surgical specimens
immediately following removal from GC patients undergoing primary
surgery, with no preoperative irradiation or chemotherapy. Gastric
adenocarcinoma in patients with GC was confirmed by histology and
classified according to Lauren's criteria into diffuse and
intestinal types (15). Demographic
and clinical characteristics were collected from all cases and
controls using a unified questionnaire. The present study was
approved by the Medical Ethics Committee of the Jinshan Hospital of
Fudan University. Written informed consent was obtained from all
patients prior to enrollment in the present study, conforming to
the Declaration of Helsinki.
Tissue sample preparation and RNA
extraction
Gastric tissue samples were stored in RNA later
(Beijing Solarbio Science and Technology, Co., Ltd., Beijing,
China) at 4°C overnight, and then later stored at −80°C. A sample
of 30 mg gastric tissue was triturated using liquid nitrogen to
homogenize it in sterile conditions. Subsequently, total RNA was
extracted from cancerous and normal tissues using TRIzol
(Invitrogen; Thermo Fisher Scientific, Inc., Waltham, MA, USA),
according to the manufacturer's instructions. The quantity and
quality (including the ratio of 28S/18S and RNA integrity number)
of each RNA sample was assessed using the RNA Nano 6000 assay kit
(Agilent Technologies, Inc., Santa Clara, CA, USA) and Bioanalyzer
2100 system (Agilent Technologies, Inc.).
Library preparation and
sequencing
A total 10 µg RNA for each sample was used to
construct the Illumina sequencing library by the NEBNext mRNA
Sample Prep kit 1 (New England Biolabs, Inc., Ipswich, MA, USA).
Briefly, total RNA was first selected using oligo-d (T) probes for
poly-A mRNAs, then followed by thermal mRNA fragmentation. The
fragmented RNA was subjected to cDNA synthesis and further
converted into double-stranded cDNA. Upon end repairing, the cDNA
product was ligated to Illumina Truseq adaptors and size selected
using a 2% agarose gel to generate the average 300 bp cDNA
libraries. Polymerase chain reaction (PCR) was subsequently
performed using a QIAquick PCR Purification kit (Qiagen GmbH,
Hilden, Germany) to determine the relative concentration of the
library in order to evaluate the volume to use for sequencing. The
RNA-seq library was sequenced on the Illumina Hiseq™ 2500
(Illumina, Inc., San Diego, CA, USA) platform as paired-end (PE)
reads to 100 bp using one lane (with a control lane on the same
flow cell) at Novogene Bioinformatics Technology Co. Ltd. (Beijing,
China). The Digital Gene Expression libraries were generated by
Illumina Hiseq™ 2500 with single-end technology in a single run.
The average read length of 90 bp was generated as raw data.
Analysis of Illumina transcriptome
sequencing results
The Illumina analysis pipeline (CASAVA 1.7) was used
to process the raw sequencing data. All raw reads were filtered to
remove the adaptor sequence, poly-N reads, low quality reads (50%
of the bases had a quality value of ≤5), empty reads (no tags
between the adaptors) and reads with only one copy number (possibly
due to a sequencing error) and low complexity. Simultaneously, the
Q20 (percentage of bases with a Phred value of ≥20) and GC content
of the clean data were summarized. Finally, a total of 10 Gbp of
cleaned reads was produced. The cleaned sequencing reads were then
aligned to the University of California Santa Cruz (UCSC) human
reference genome using TopHat software (version 1.0.12; Intel
Corporation, Santa Clara, CA, USA), which also incorporates Bowtie
software (version 0.11.3; Intel Corporation), to perform the
alignment. Burrows-Wheeler Aligner software (version 0.6.1; Intel
Corporation) was used to map clean reads to the genome reference
(the UCSC human reference genome hg.19), and Bowtie software
version 0.11.3 was used for gene referencing. In order to access
the transcription abundance for each gene, Cufflinks (version
1.0.3; Intel Corporation) was used to process the aligned reads
from alternate samples. The gene transfer format (GTF) file for
reference genome annotation used in this analysis was retrieved
from the UCSC database. The expression level for each transcript
was normalized to the reads per kb of exon model per million mapped
reads (FPKM). Cuffdiff (version 1.0.3; Intel Corporation) was used
to process the original alignment file produced by TopHat and GTF
file for genome annotation to determine the differentially
expressed genes. Following evaluation using the Benjamini-Hochberg
multiple testing correction, the false discovery rate (FDR)
<0.05 was selected as the criteria for significant differences.
Gene ontology (GO) was performed and pathway enrichment analysis to
investigate the biological significance of the differentially
expressed genes. This analysis was performed by the Database for
Annotation, Visualization, and Integrated Discovery (DAVID;
http://www.biomedsearch.com/nih/DAVID-Database-Annotation-Visualization-Integrated/12734009.html),
which is a set of web-based functional annotation tools. The
differentially expressed genes and all the expressed genes were
submitted as the gene list and background list, respectively. A
false discovery rate (FDR) of 1% was used.
The RNA-Seq by Expectation Maximization (RSEM;
Illumina, Inc., San Diego, CA, USA) is an RNA-Seq transcript
quantification program that currently requires gap-free alignments
of RNA-seq reads to Trinity-reconstructed transcripts, including
alignments generated by Bowtie software. Given the
Trinity-assembled transcripts and the RNA-seq reads generated from
a sample, RSEM will directly execute Bowtie to align the reads to
the Trinity transcripts and then compute transcript abundance,
estimating the number of RNA-seq fragments corresponding to each
Trinity transcript, including normalized expression values as FPKM.
In addition to estimating the expression levels of individual
transcripts, RSEM computes ‘gene-level’ estimates using the Trinity
component as a proxy for the gene. To compare the expression levels
of different transcripts or genes across samples, a
Trinity-included script invokes edge R to perform an additional
trimmed mean of M-values (a weighted trimmed mean of the log
expression ratios), a scaling normalization that aims to account
for differences in total cellular RNA production across all
samples. This investigation aimed to identify the different genes
between the gastric cancer tissues and normal tissues by
sequencing, in order to provide a molecular basis for exploring the
pathogenesis of gastric cancer and improve the diagnosis and
therapy for gastric cancer.
Reverse transcription-quantitative
polymerase chain reaction (RT-qPCR) expression validation
To evaluate the quality of the sequence assembly and
expression profile, five differentially expressed genes were
selected for amplification, utilizing RT-qPCR. For RT-qPCR, 1 µg
total RNA from the transcriptome sample was reverse-transcribed in
a 20 µl reaction system, according to the manufacturer's protocol
(PrimeScript™ RT Reagent kit; Takara Bio, Inc., Otsu, Japan). The
PCR primers were designed based on the sequences of the gene by
Primer Premier software (version 5.0, Premier Biosoft
International, Palo Alto, CA, USA). Each reaction was carried out
in a total volume of 20 µl, with 1 µl cDNA, 10 µl SYBR-Green I
Master Mix (LightCycler® 480 SYBR-Green I Master, Roche
Diagnostics Ltd., Lewes, UK), 0.5 µl/primer and 9 µl double
distilled water. RT-qPCR was performed using the
LightCycler® 480 Real-Time PCR system (Roche Diagnostics
Ltd.). The RT-qPCR program consisted of 35 cycles of 30 sec at
95°C, 30 sec at 58°C, and 1 min at 72°C, and a final 3 min at 72°C
with Premix Taq™ (version 2.0; Takara Biotechnology Co., Ltd.).
Each sample was run in triplicate. The data were analyzed with
automatic settings for assigning the baseline, and the average Cq
and standard deviation (SD) values were calculated. The expression
level of mRNA in the tissue was normalized to β-actin. The results
were calculated using the ΔΔCT method (16). The primer sequences were as follows:
CDH1 forward, AATGCCGCCATCGCTTAC and reverse, TCAGGCACCTGACCCTTGTA;
COX-2 forward, GTTCCACCCGCAGTACAGA and reverse,
AGGGCTTCAGCATAAAGCGT; MMP-9 forward, TCTATGGTCCTCGCCCTGAA, and
reverse, CATCGTCCACCGGACTCAAA; DPT forward, TGTCGCTACAGCAAGAGGTG
and reverse, TGAACTTCCACTGGCGATCC; TGFBR2 forward,
GCACGTTCAGAAGTCGGATG and reverse, CTGCACCGTTGTTGTCAGTG; β-actin
forward, TGCGTGACATTAAGGAGAAG and reverse, GCTCGTAGCTCTTCTCCA.
Western blot analysis
Gastric tissue from the control and case samples was
homogenized in 300 ml lysis buffer [50 mM Hepes; pH 7.5; 150 mM
NaCl; 10 mM EDTA; 10 mM glycerophosphate; 100 mM sodium fluoride;
1% Triton X-100; 1 mM phenylmethane sulfenylfluoride and protease
inhibitor (PI) cocktail]. Following centrifugation of the
homogenate (20,000 × g, 15 min) the supernatants were used for
western blotting. A total of 50 µg protein extracts from samples
were suspended in Laemmli buffer (100 mM Hepes; pH 6.8; 10%
β-mercaptoethanol; 20% SDS), incubated at 100°C for 5 min to
denature the proteins, and loaded onto a 10% gel to undergo
SDS-PAGE. Following separation, proteins were electrically
transferred onto a nitrocellulose membrane. The membrane was
incubated with blocking solution (1X TBS; 0.05% Tween-20; 5%
non-fat milk) at room temperature for 1 h and incubated overnight
with primary antibodies raised against CDH1 (cat. no. 14472;
1:1,000; Cell Signaling Technology, Inc., Danvers, MA, USA).
Following incubation with the corresponding horseradish
peroxidase-conjugated rat anti-mouse IgG secondary antibodies for 1
h at room temperature (cat. no. sc-130300; 1:5,000; Santa Cruz
Biotechnology, Inc., Dallas, TX, USA), proteins were visualized
using an Enhanced Chemiluminescence Plus Immunoblotting Detection
system (GE Healthcare Life Sciences, Chalfont, UK). The intensity
of the immunoreactive bands was quantified using a blot analysis
system (Bio-Rad Laboratories, Inc., Hercules, CA, USA), and β-actin
was used as a loading control. Commercial markers (SeeBlue
pre-stained standard; Invitrogen; Thermo Fisher Scientific, Inc.)
were used as molecular weight standards. Each experiment was
repeated three times.
Statistical analysis
The FPKM data was analyzed using the Pearson's
correlation coefficient, the paired t-test and the Benjamini
Hochberg correction for false discovery rate, such that the
differential expression was considered to be significant with a
difference of P<0.01. The data was normalized using rank
invariant normalization and analyzed using the High-Throughput qPCR
package in R (version 3.3.3; https://www.bioconductor.org/) and Bioconductor
(version 3.5; https://www.bioconductor.org/). The validation and
plasma RT-qPCR expression data was analyzed using the nonparametric
Mann-Whitney U-test. P<0.05 was considered to indicate a
statistically significant difference for the Benjamini Hochberg
adjustment.
Results
Transcriptome sequencing
The cancer and normal tissue samples were subjected
to massively parallel primer extension (PE) cDNA sequencing. A
total of 178.2 and 175.4 million raw reads were obtained of 100 bp
length in the normal and cancer tissues from Illumina sequencing,
respectively. Subsequently, the raw reads were filtered by removing
low quality reads and reads containing N and adaptor sequences. The
remaining reads were termed ‘clean reads’ and used for downstream
bioinformatic analysis. Burrows-Wheeler Aligner software (version
0.6.1; Intel Corporation) was used to map clean reads to the genome
reference (the UCSC human reference genome hg.19), and Bowtie
software was used for gene referencing. The unique match reads for
subjected samples were 154.5 and 151.4 million raw reads. The
average coverage of sequencing depth was ~600 times the human
transcriptome (30 Mbp and ~1% of the hg.19, based on the total
length of the uniquely annotated exon region in the Ensembl
database; http://www.ensembl.org/Homo_sapiens/Location/View?db=core;g=ENSG00000231978;r=1:21768269-21768575;t=ENST00000434488).
The results are presented in Table
I.
 | Table I.RNA sequencing results of mRNA. |
Table I.
RNA sequencing results of mRNA.
| Sample name | Total reads
(%) | Clean reads
(%) | Genome map rate
(%) | Gene map rate
(%) |
|---|
| Control 1 | 59,318,462
(100) | 51,352,541
(86.6) | 79.24 | 73.17 |
| Control 2 | 60,891,232
(100) | 52.065,542
(85.48) | 78.41 | 72.41 |
| Control 3 | 58,010,790
(100) | 51.167,261
(88.21) | 77.53 | 71.62 |
| Case 1 | 57,390,348
(100) | 49.765,172
(85.91) | 76.33 | 73.61 |
| Case 2 | 58,540,531
(100) | 51.152,986
(87.25) | 78.12 | 74.51 |
| Case 3 | 59,643,118
(100) | 50.351,271
(85.12) | 77.29 | 72.65 |
Differentially expressed genes
Subsequently, the present study detected the gene
expression levels and identified the differentially expressed genes
between case and control samples using the software package, RSEM.
RSEM computes maximum likelihood abundance estimates using the
Expectation-Maximization (EM) algorithm for its statistical model,
including the modeling of PE and variable-length reads, fragment
length distributions and quality scores, to determine which
transcripts are isoforms of the same gene. The FPKM method was used
to determine the gene expression levels. In total, 14,318 and
14,694 expressed genes were evaluated by postulating that the FPKM
value was >1 among any samples of each group. The analysis
contained the majority of the annotated human genes. Following
this, the correlation of the gene expression between two samples
was evaluated. The results revealed that gene expression levels
among samples were highly correlated (Pearson's correlation
coefficient r=0.92), suggesting that the experiments were reliable
and the samples chosen were reasonable (Table II).
| Table II.Correlation values between
samples. |
Table II.
Correlation values between
samples.
| Sample | Control 1 | Control 2 | Control 3 | Case 1 | Case 2 | Case 3 |
|---|
| Control 1 | 1.000 | 0.997 | 0.982 | 0.991 | 0.984 | 0.989 |
| Control 2 | 0.994 | 1.000 | 0.978 | 0.000 | 0.985 | 0.993 |
| Control 3 | 0.995 | 0.995 | 1.000 | 0.985 | 0.982 | 0.994 |
| Case 1 | 0.986 | 0.995 | 0.981 | 1.000 | 0.987 | 0.987 |
| Case 2 | 0.994 | 0.997 | 0.972 | 0.971 | 1.000 | 0.973 |
| Case 3 | 0.997 | 0.993 | 0.993 | 0.975 | 0.989 | 1.000 |
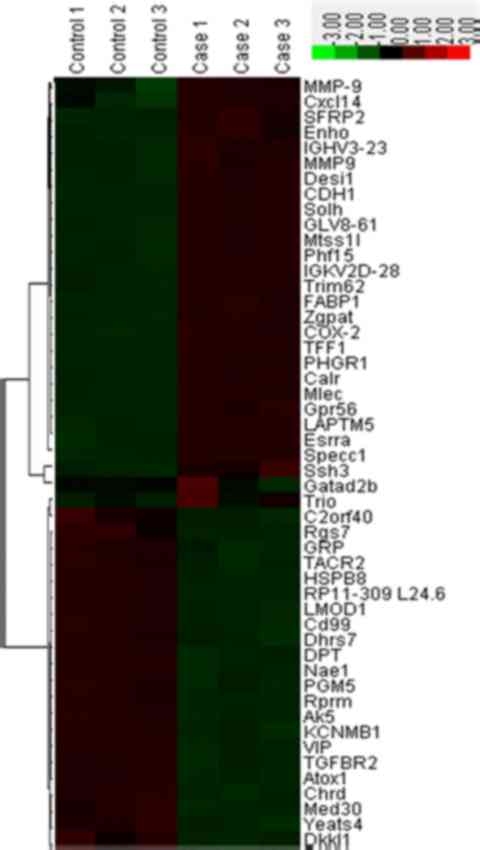
In order to refine the analysis, the selection
criteria was strengthened with a threshold of FDR ≤0.05 and
fold-change ≥3 applied. The stringent criteria generated a list of
28 instances of mRNA upregulation and 22 instances of
downregulation between cancer and normal samples, which are
presented in Fig. 1. The genes ranked
with the five highest expression levels between normal and cancer
samples are as follows: Cadherin-1 gene (CDH1), cyclooxygenase 2
(COX-2), matrix metalloproteinase-9 (MMP-9), dermatopontin (DPT)
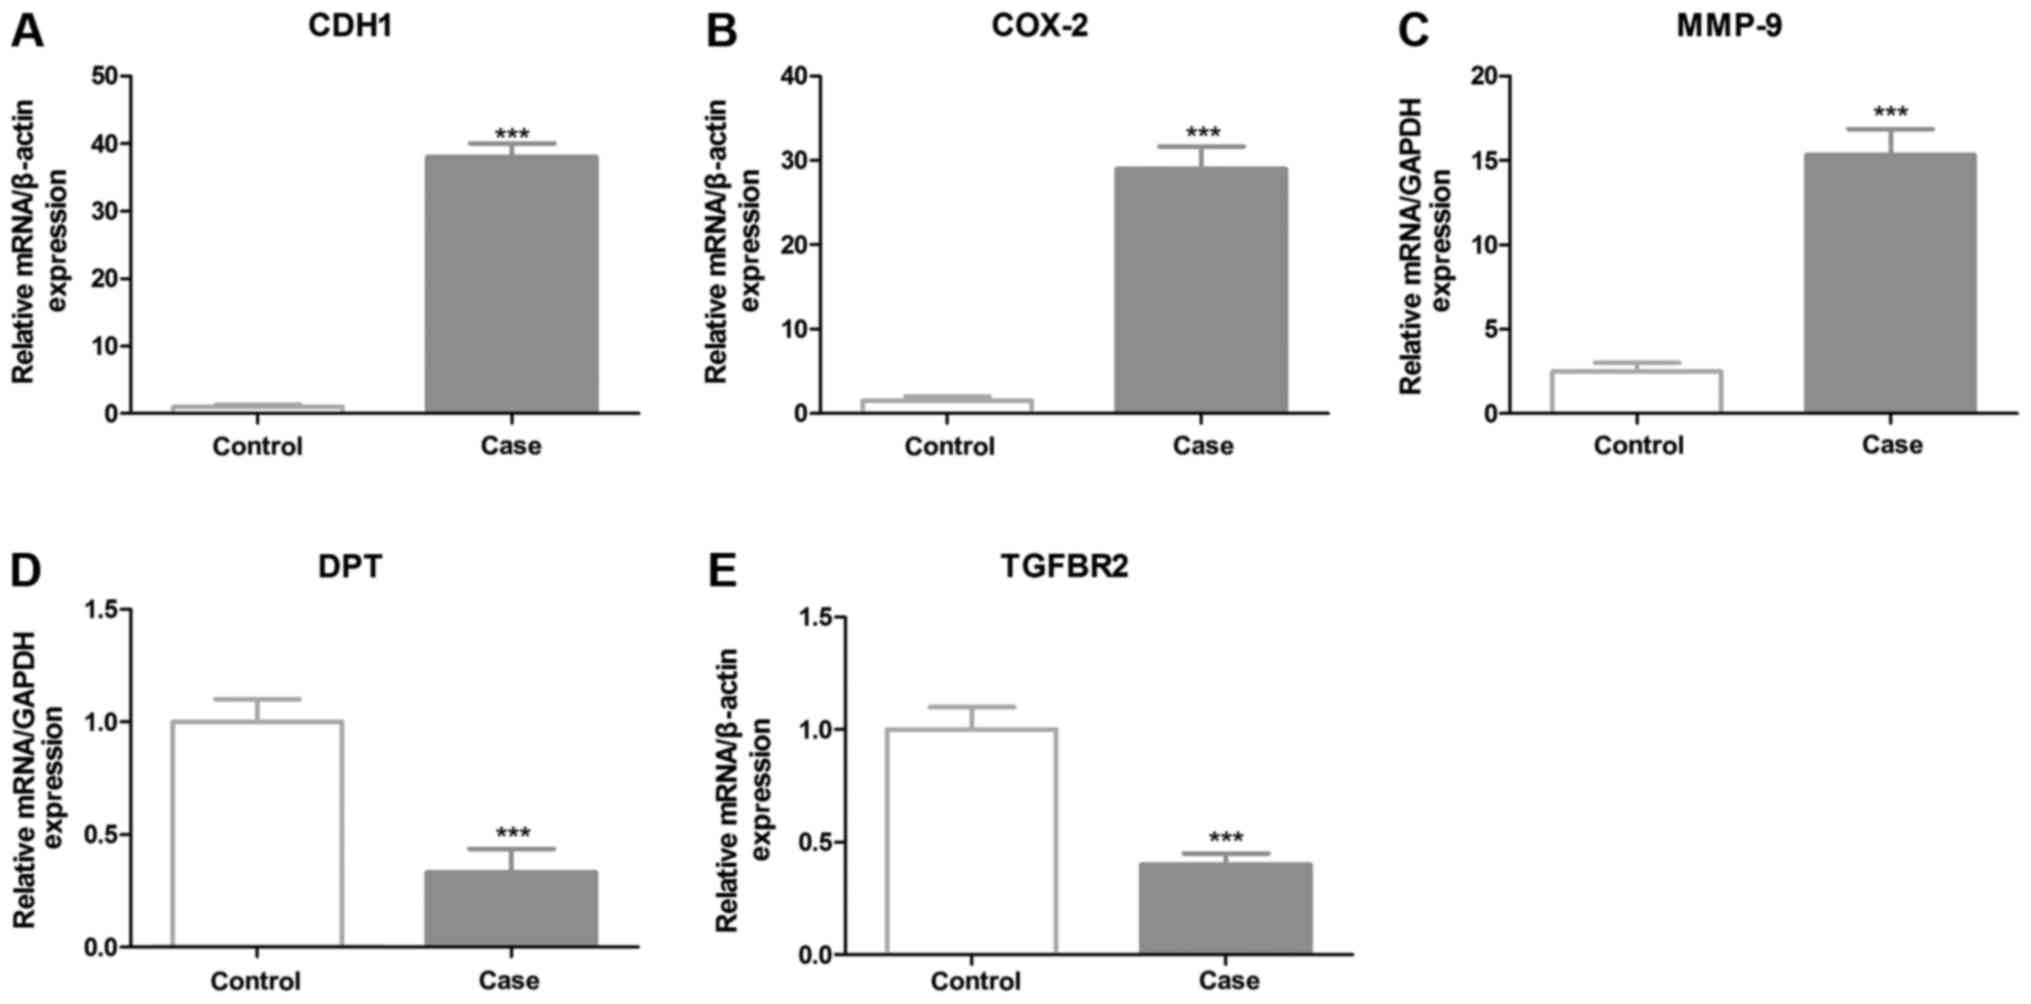
and transforming growth factor β receptor II (TGFBR2). Further
evaluation confirmed high-throughput sequencing in validation
cohorts, including samples that participated in deep sequencing. A
total of five genes expressed in normal and cancer samples were
selected to be verified by RT-qPCR. The results revealed that CDH1,
COX-2 and MMP-9 had significantly increased expression levels,
whereas the expression levels of DPT and TGFBR2 were decreased in
GC samples, compared with the control (Fig. 2). Notably, CDH1 demonstrated a 36-fold
higher expression level in cancer tissues. In previous studies CDH1
has been revealed to have significantly altered expression levels
in GC tissues. The most significantly downregulated gene in cancer
tissue samples is DPT, which encodes the dermatopontin protein.
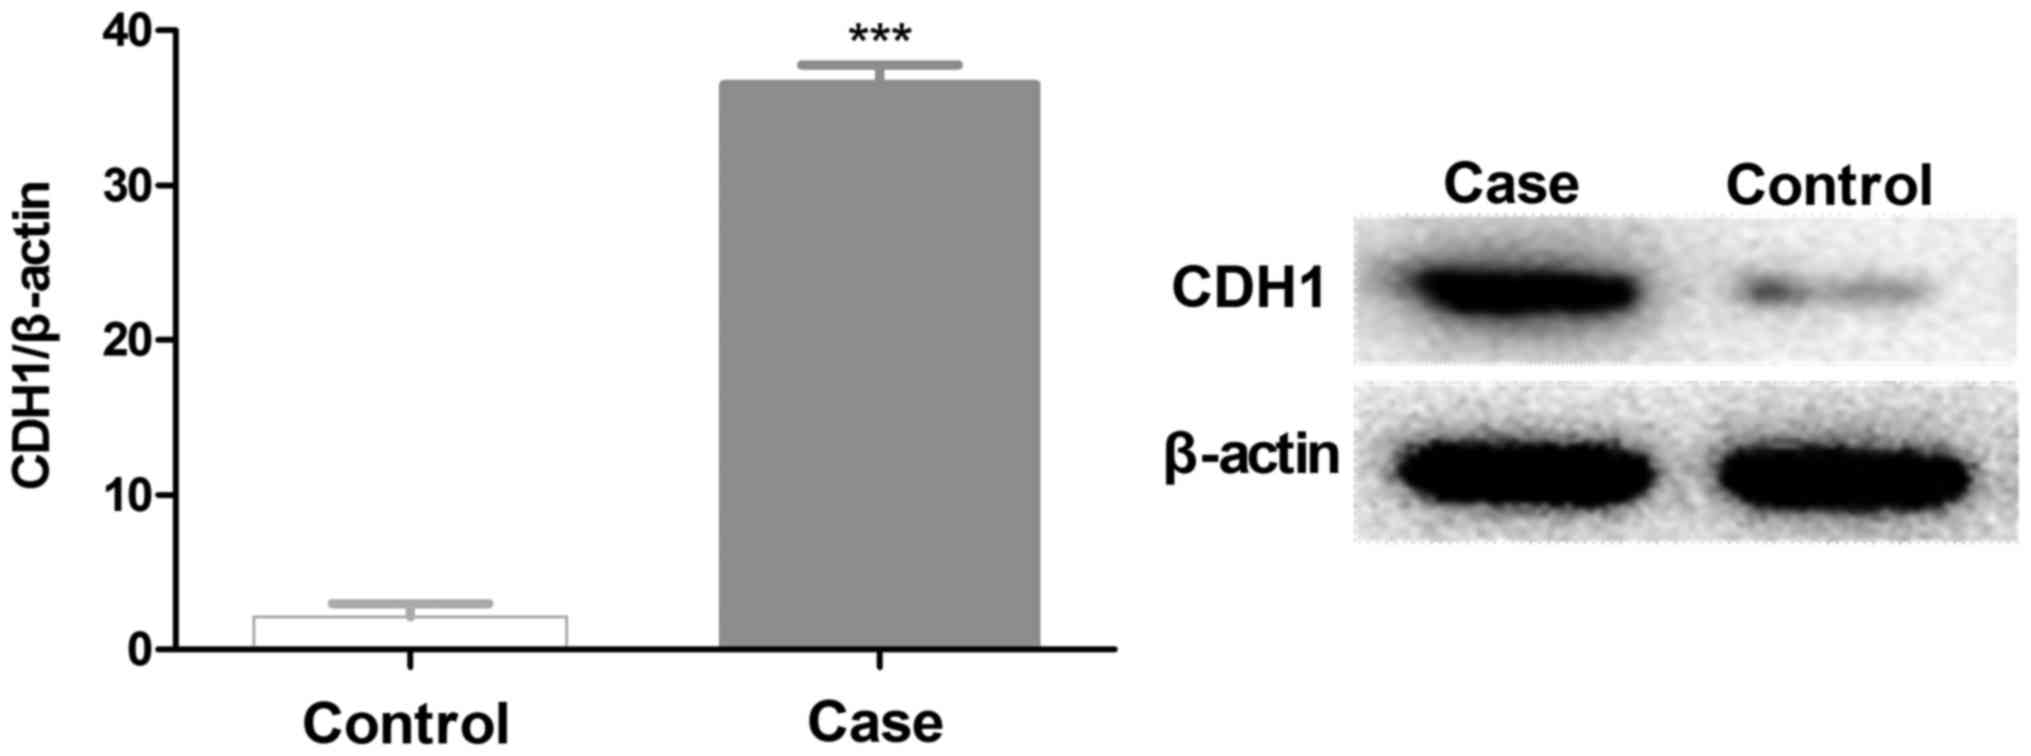
Furthermore, western blot analysis results also demonstrated that
CDH1 was highly expressed in validation cohorts (Fig. 3).
Functional enrichment analysis of
DEGs
To better understand the biological function of
DEGs, GO enrichment analysis was performed. GO is an international
standard gene functional classification system that offers a
dynamic-updated controlled vocabulary, in addition to a strictly
defined concept to comprehensively describe properties of genes and
their products in organisms. GO has three ontologies: Molecular
function, cellular component and biological process. The basic unit
of GO is a GO-term. Every GO-term belongs to a type of ontology. GO
enrichment analysis provides all GO terms that significantly
enriched in a list of DEGs, comparing to a genome background, and
filter the DEGs that correspond to specific biological functions.
This method firstly maps all DEGs to GO terms in the database
(http://www.geneontology.org/),
calculating gene numbers for each term; subsequently a
hypergeometric test was performed to identify significantly
enriched GO terms in the input list of DEGs based on GO:
TermFinder. In the present study, only biological process and
molecular function categories were considered. The functional
enrichment work was performed using an online tool, DAVID. Using a
threshold of FDR <0.05, it was revealed that all differentially
expressed genes were categorized into 12 functional categories
(Table III). For example, the
over-represented GO categories include digestive system process,
regulation of body fluid levels, secretion and digestion.
| Table III.Enriched GO categories of DEGs. |
Table III.
Enriched GO categories of DEGs.
| Category | GO ID | GO term | Cluster
frequency | Genome frequency of
use | Corrected
P-value |
|---|
| BP | GO:0022600 | Digestive system
process | 4/50 genes, 8% | 19/15,332 genes,
0.1%a | 0.0012 |
|
| GO:0050878 | Regulation of body
fluid | 6/50 genes,
12% | 835/15,332 genes,
5.4%a | 0.0018 |
|
| GO:0046903 | Secretion | 8/50 genes,
16% | 143/15,332 genes,
0.9%a | 0.0024 |
|
| GO:0007586 | Digestion | 5/50 genes,
10% | 253/15,332 genes,
1.7%a | 0.0027 |
|
| GO:0007155 | Cell adhesion | 13/50 genes,
26% | 373/15,332 genes,
2.4%a | 0.0040 |
|
| GO:0022610 | Biological
adhesion | 14/50 genes,
28% | 2,954/15,332 genes,
19.3%a | 0.0041 |
|
| GO:0007267 | Cell-cell
signaling | 14/50 genes,
28% | 3,787/15,332 genes,
24.7%a | 0.0031 |
|
| GO:0007967 | System process | 13/50 genes,
26% | 3,787/15,332 genes,
24.7%a | 0.0029 |
| MF | GO:0005184 | Neuropeptide
hormone | 6/50 genes,
12% | 24/15,332 genes,
0.2%a | 0.0147 |
|
| GO:0005509 | Calcium ion
binding | 20/50 genes,
40% | 4,489/15,451 genes,
29.1%a | 0.0152 |
|
| GO:0005179 | Cytokine
activity | 10/50 genes,
20% | 3,537/15,451 genes,
22.9%a | 0.0703 |
|
| GO:0003823 | Symporter
activity | 12/50 genes,
24% | 2,111/15,451 genes,
27%a | 0.0431 |
Discussion
The present study comprehensively investigated the
transcriptome in GC and normal tissue samples, and further verified
DEG expression levels in large samples. By applying the whole
transcriptome sequencing technology (RNA-seq), it was estimated
that the expression levels of DEGs were associated with GC tissues.
Additionally, the present study also provided novel ideas for the
identification of underlying molecular mechanisms of GC and its
role in the diagnosis and treatment of GC.
An Illumina Hiseq 2500 platform with a 90-bp
sequencing read length was used in the present study. A total of
>350 million raw reads were obtained; this number of raw reads
has been used in previous studies to achieve sufficient sequencing
coverage for transcriptome profiling. A total of 98% sequencing
reads that align with the hg19 met the quality standards of the
RNA-seq technique. Therefore, the mRNA-seq data provided a
sufficient profile of expressed genes in the subject genome.
Furthermore, the present study further verified RNA-seq data in
large samples by RT-qPCR and western blotting. Results generated
from RT-qPCR and western blotting were consistent with the
high-throughput sequencing results, which indicates that
high-throughput sequencing may be a novel approach for the
precision treatment of cancer.
The present study verified numerous DEGs and
isoforms in gene expression levels in GC tissues. A number of the
genes identified are known to be involved in various types of
cancer. Based on the results of the present study, 12 GO categories
were confirmed to over-represent among the DEGs, including in the
regulation of body fluid levels, secretion and digestive system
process categories (Table III).
Consistent with previous studies, transcriptome analysis in the
present study identified DEGs with biological functions that were
associated with cell adhesion. The CDH1 gene demonstrated the most
significant difference between normal and cancer tissue samples,
with a 36-fold higher expression in GC tissues. Similarly, the
expression level of CDH1 protein was also significantly higher in
GC tissues (Fig. 3). The CDH1 gene is
associated with the cadherin superfamily (17–19):
Sequence mutations occurring in this gene are always correlated
with GC. Loss of function may contribute to the progression of GC
by increasing proliferation, invasion and/or metastasis (20–24), which
is associated with cancer progression, metastasis and decreased
level of cellular adhesion in the tissue, ultimately increasing
cellular motility (25–29).
COX-2 has a length of 8,3 kb and is
positioned on chromosome 1 (1q25.2–25.3), and consists of 10 exons
and 9 introns, encoding 603 or 604 amino acids; However, it is not
expressed under normal physiological conditions (30–34). A
number of previous studies have revealed that the COX-2 gene was
one of the early growth response genes and may be widely vessels
inside and outside activator (including interleukin 15-serotonin
transforming growth factor), resulting in tumorigenesis (35–39). Sun
et al (40) revealed that in
superficial gastritis (100%), atrophic gastritis (35.7%),
intestinal metaplasia (37.8%), stomach dysplasia (41.7%) and GC
(69.5%), of COX-2 positive the expression was gradually increasing
trend. COX-2 is considered to be an initial process in gastric
carcinogenesis.
MMP-9 is a class of enzymes associated with
the zinc-MMP family complex and the degradation of the
extracellular matrix. The MMP-9 gene encodes a signal peptide in
humans, a propeptide; it has a catalytic domain, followed by three
repeats of a fibronectin type II domain and finally a C-terminal
hemopexin-like domain (41).
Specifically, MMP-9 is associated with the pathogenesis of cancer,
due to its key role in extracellular matrix remodeling and
angiogenesis; its elevated expression level has been previously
demonstrated in metastatic mammary cancer cell lines. Gelatinase B
serves a role in tumor progression and angiogenesis, stromal
remodeling and eventually metastasis (42). It may be challenging to utilize
gelatinase B inhibition in cancer therapy strategies due to its
physiological function. However, the role of gelatinase B in tumor
metastasis diagnosis has previously been studied: Complexes of
gelatinase B/tissue inhibitors of metalloproteinases were revealed
to have increased expression levels in gastrointestinal cancer and
gynecologic malignancies. MMPs, including MMP-9, may participate in
the progression of numerous human malignancies, as the degradation
of collagen IV in the basement membrane and extracellular matrix
assists tumor progression, including invasion, metastasis, growth
and angiogenesis (43). A number of
studies detected that MMP-9 expression in GC tissues was higher,
compared with in normal gastric mucosa, and serosal invasion, and
MMP-9 persons were significantly higher compared with those without
serosal invasion, as determined by flow cytometry (44–46). The
differentiated group of lymph node metastasis was revealed to have
a higher frequency than those deprived of lymph node metastasis
(P≤0.05). Additionally, Shan et al (47) demonstrated suppressed expression
levels of MMP-9 in a poorly segregated GC cell line, BGC-823, by
pGenesil carrie, which subsequently set the foundation for further
in vivo experiments and gene therapy (47,48).
Dermatopontin is a protein, which is encoded by the
DPT gene and is present in numerous tissues types. Briefly, it is
an extracellular matrix protein with possible functions in
cell-matrix interactions and matrix assembly, and a number of its
tyrosine residues are sulfated. It has also been suggested that
dermatopontin may modify the behavior of TGF β by interacting with
decorin (49). The TGFBR2 gene
encodes a member of the serine/threonine protein kinase family
receptor. These encoded proteins have a protein kinase domain,
which forms a heterodimeric complex with other protein receptors
and binds TGF-β. These receptor/ligand complexes phosphorylate
proteins, prior to entering the nucleus and regulating the
transcription of genes associated with the cell proliferation
process. TGFBR2 gene mutations have previously been associated with
Marfan syndrome, Loeys-Deitz aortic aneurysm syndrome,
Osler-Weber-Rendu syndrome and the development of numerous types of
tumors (50,51). Furthermore, spliced transcript
variants encoding for a number of isoforms have also been
characterized (52,53).
In summary, based on RNA-seq technology, sequencing
reads were generated to profile the GC transcriptome. The results
provided a wealth of information on DEGs in case-control tissue
samples, which may benefit further studies and lead to improved
methods for GC detection and therapy.
Acknowledgements
The present study was supported by the Training
Program Foundation for Talent of the Jinshan Hospital of Fudan
University (Shanghai, China; grant no. JHFU201326148).
References
|
1
|
Chen W, Zheng R, Baade PD, Zhang S, Zeng
H, Bray F, Jemal A, Yu XQ and He J: Cancer statistics in China,
2015. CA Cancer J Clin. 66:115–132. 2016. View Article : Google Scholar : PubMed/NCBI
|
|
2
|
Patel SA: The inferior vena cava (IVC)
syndrome as the initial manifestation of newly diagnosed gastric
adenocarcinoma: A case report. J Med Case Rep. 9:2042015.
View Article : Google Scholar : PubMed/NCBI
|
|
3
|
Du T, Zhang B, Zhang S, Jiang X, Zheng P,
Li J, Yan M, Zhu Z and Liu B: Decreased expression of long
non-coding RNA WT1-AS promotes cell proliferation and invasion in
gastric cancer. Biochim Biophys Acta. 1862:12–19. 2016. View Article : Google Scholar : PubMed/NCBI
|
|
4
|
Yao K, Nagahama T, Matsui T and Iwashita
A: Detection and characterization of early gastric cancer for
curative endoscopic submucosal dissection. Dig Endosc. 25 Suppl
1:S44–S54. 2013. View Article : Google Scholar
|
|
5
|
Amorim I, Smet A, Alves O, Teixeira S,
Saraiva AL, Taulescu M, Reis C, Haesebrouck F and Gärtner F:
Presence and significance of Helicobacter spp. in the gastric
mucosa of Portuguese dogs. Gut Pathog. 7:122015. View Article : Google Scholar : PubMed/NCBI
|
|
6
|
Ferlay J, Soerjomataram I, Dikshit R, Eser
S, Mathers C, Rebelo M, Parkin DM, Forman D and Bray F: Cancer
incidence and mortality worldwide: Sources, methods and major
patterns in GLOBOCAN 2012. Int J Cancer. 136:E359–E386. 2015.
View Article : Google Scholar : PubMed/NCBI
|
|
7
|
Delaunoit T: Latest developments and
emerging treatment options in the management of stomach cancer.
Cancer Manag Res. 3:257–266. 2011. View Article : Google Scholar : PubMed/NCBI
|
|
8
|
Yegin EG, Kani T, Banzragch M, Kalayci C,
Bicakci E and Duman DG: Survival in patients with hypoechoic
muscularis propria lesions suggestive of gastrointestinal stromal
tumors in gastric wall. Acta Gastroenterol Belg. 78:12–17.
2015.PubMed/NCBI
|
|
9
|
Printz C: High-throughput sequencing
detects signs of cancer recurrence. Cancer. 118:40972012.
View Article : Google Scholar
|
|
10
|
Conley A, Minciacchi VR, Lee DH, Knudsen
BS, Karlan BY, Citrigno L, Viglietto G, Tewari M, Freeman MR,
Demichelis F and Di Vizio D: High-throughput sequencing of two
populations of extracellular vesicles provides an mRNA signature
that can be detected in the circulation of breast cancer patients.
RNA Biol. 14:305–316. 2017. View Article : Google Scholar : PubMed/NCBI
|
|
11
|
Dallol A, Buhmeida A, Al-Ahwal MS,
Al-Maghrabi J, Bajouh O, Al-Khayyat S, Alam R, Abusanad A, Turki R,
Elaimi A, et al: Clinical significance of frequent somatic
mutations detected by high-throughput targeted sequencing in
archived colorectal cancer samples. J Transl Med. 14:1182016.
View Article : Google Scholar : PubMed/NCBI
|
|
12
|
Shaheen MF and Barrette P: Successful
endoscopic management of gastric perforation caused by ingesting a
sharp chicken bone. Int J Surg Case Rep. 9:12–14. 2015. View Article : Google Scholar : PubMed/NCBI
|
|
13
|
Bonfrate L, Grattagliano I, Palasciano G
and Portincasa P: Dynamic carbon 13 breath tests for the study of
liver function and gastric emptying. Gastroenterol Rep (Oxf).
3:12–21. 2015. View Article : Google Scholar : PubMed/NCBI
|
|
14
|
Luo YH, Liang L, He RQ, Wen DY, Deng GF,
Yang H, He Y, Ma W, Cai XY, Chen JQ and Chen G: RNA-sequencing
investigation identifies an effective risk score generated by three
novel lncRNAs for the survival of papillary thyroid cancer
patients. Oncotarget. 8:74139–74158. 2017.PubMed/NCBI
|
|
15
|
Tichá V, Jansa P and Tichý M:
Retrospective study of gastric cancer on the basis of Lauren's
classification criteria. Acta Univ Palacki Olomuc Fac Med.
120:193–198. 1988.PubMed/NCBI
|
|
16
|
Livak KJ and Schmittgen TD: Analysis of
relative gene expression data using real-time quantitative PCR and
the 2(-Delta Delta C(T)) method. Methods. 25:402–408. 2001.
View Article : Google Scholar : PubMed/NCBI
|
|
17
|
Chen QH, Deng W, Li XW, Liu XF, Wang JM,
Wang LF, Xiao N, He Q, Wang YP and Fan YM: Novel CDH1 germline
mutations identified in Chinese gastric cancer patients. World J
Gastroenterol. 19:909–916. 2013. View Article : Google Scholar : PubMed/NCBI
|
|
18
|
Garziera M, Canzonieri V, Cannizzaro R,
Geremia S, Caggiari L, De Zorzi M, Maiero S, Orzes E, Perin T,
Zanussi S, et al: Identification and characterization of CDH1
germline variants in sporadic gastric cancer patients and in
individuals at risk of gastric cancer. PloS One. 8:e770352013.
View Article : Google Scholar : PubMed/NCBI
|
|
19
|
Garziera M, De Re V, Geremia S, Seruca R,
Figueiredo J, Melo S, Simões-Correia J, Caggiari L, De Zorzi M,
Canzonieri V, et al: A novel CDH1 germline missense mutation in a
sporadic gastric cancer patient in north-east of Italy. Clin Exp
Med. 13:149–157. 2013. View Article : Google Scholar : PubMed/NCBI
|
|
20
|
Hansford S, Kaurah P, Li-Chang H, Woo M,
Senz J, Pinheiro H, Schrader KA, Schaeffer DF, Shumansky K,
Zogopoulos G, et al: Hereditary diffuse gastric cancer syndrome:
CDH1 mutations and beyond. JAMA Oncol. 1:23–32. 2015. View Article : Google Scholar : PubMed/NCBI
|
|
21
|
de Campos EC, Ribeiro S, Higashi R,
Manfredini R, Kfouri D and Cavalcanti TC: Hereditary diffuse
gastric cancer: laparoscopic surgical approach associated to rare
mutattion of CDH1 gene. Arq Bras Cir Dig. 28:149–151. 2015.(In
English, Portuguese). View Article : Google Scholar : PubMed/NCBI
|
|
22
|
van der Post RS, Vogelaar IP, Manders P,
van der Kolk LE, Cats A, van Hest LP, Sijmons R, Aalfs CM, Ausems
MG, Gómez García EB, et al: Accuracy of hereditary diffuse gastric
cancer testing criteria and outcomes in patients with a germline
mutation in CDH1. Gastroenterology. 149:897–906.e19. 2015.
View Article : Google Scholar : PubMed/NCBI
|
|
23
|
Benusiglio PR, Colas C, Rouleau E,
Uhrhammer N, Romero P, Remenieras A, Moretta J, Wang Q, De Pauw A,
Buecher B, et al: Hereditary diffuse gastric cancer syndrome:
Improved performances of the 2015 testing criteria for the
identification of probands with a CDH1 germline mutation. J Med
Genet. 52:563–565. 2015. View Article : Google Scholar : PubMed/NCBI
|
|
24
|
Lajus TB and Sales RM: CDH1 germ-line
missense mutation identified by multigene sequencing in a family
with no history of diffuse gastric cancer. Gene. 568:215–219. 2015.
View Article : Google Scholar : PubMed/NCBI
|
|
25
|
Lynch HT and Lynch JF: Hereditary diffuse
gastric cancer: lifesaving total gastrectomy for CDH1 mutation
carriers. J Med Genet. 47:433–435. 2010. View Article : Google Scholar : PubMed/NCBI
|
|
26
|
Matsukuma KE, Mullins FM, Dietz L, Zehnder
JL, Ford JM, Chun NM and Schrijver I: Hereditary diffuse gastric
cancer due to a previously undescribed CDH1 splice site mutation.
Hum Pathol. 41:1200–1203. 2010. View Article : Google Scholar : PubMed/NCBI
|
|
27
|
Pinheiro H, Bordeira-Carriço R, Seixas S,
Carvalho J, Senz J, Oliveira P, Inácio P, Gusmão L, Rocha J,
Huntsman D, et al: Allele-specific CDH1 downregulation and
hereditary diffuse gastric cancer. Hum Mol Genet. 19:943–952. 2010.
View Article : Google Scholar : PubMed/NCBI
|
|
28
|
Chen B, Zhou Y, Yang P, Liu L, Qin XP and
Wu XT: CDH1-160C>A gene polymorphism is an ethnicity-dependent
risk factor for gastric cancer. Cytokine. 55:266–273. 2011.
View Article : Google Scholar : PubMed/NCBI
|
|
29
|
Chen Y, Kingham K, Ford JM, Rosing J, Van
Dam J, Jeffrey RB, Longacre TA, Chun N, Kurian A and Norton JA: A
prospective study of total gastrectomy for CDH1-positive hereditary
diffuse gastric cancer. Ann Surg Oncol. 18:2594–2598. 2011.
View Article : Google Scholar : PubMed/NCBI
|
|
30
|
Zhang P, Luo HS, Li M and Tan SY:
Artesunate inhibits the growth and induces apoptosis of human
gastric cancer cells by downregulating COX-2. Onco Targets Ther.
8:845–854. 2015. View Article : Google Scholar : PubMed/NCBI
|
|
31
|
Yu F, Li K, Chen S, Liu Y and Li Y:
Pseudolaric acid B circumvents multidrug resistance phenotype in
human gastric cancer SGC7901/ADR cells by downregulating Cox-2 and
P-gp expression. Cell Biochem Biophys. 71:119–126. 2015. View Article : Google Scholar : PubMed/NCBI
|
|
32
|
Bai YN, Zhang P, Li L, Wang SL, Yao NL,
Zhang RS, Liu Z, Yan D, Zhu YL, Ma JZ, et al: Effect of jianpi
tongluo jiedu recipe on expression levels of COX-2, NF-kappaBp65,
and Bcl-2 in gastric mucosa of patients with precancerous lesions
of gastric cancer. Zhongguo Zhong Xi Yi Jie He Za Zhi. 35:167–173.
2015.(In Chinese). PubMed/NCBI
|
|
33
|
Aziz F, Yang X, Wang X and Yan Q: Anti-LeY
antibody enhances therapeutic efficacy of celecoxib against gastric
cancer by downregulation of MAPKs/COX-2 signaling pathway:
Correlation with clinical study. J Cancer Res Clin Oncol.
141:1221–1235. 2015. View Article : Google Scholar : PubMed/NCBI
|
|
34
|
Wang Z, Chen JQ and Liu JL: COX-2
inhibitors and gastric cancer. Gastroenterol Res Pract.
2014:1323202014. View Article : Google Scholar : PubMed/NCBI
|
|
35
|
Schildberg C, Abbas M, Merkel S, Agaimy A,
Dimmler A, Schlabrakowski A, Croner R, Leupolt J, Hohenberger W and
Allgayer H: COX-2, TFF1, and Src define better prognosis in young
patients with gastric cancer. J Surg Oncol. 108:409–413. 2013.
View Article : Google Scholar : PubMed/NCBI
|
|
36
|
Chen Z, Liu M, Liu X, Huang S, Li L, Song
B, Li H, Ren Q, Hu Z, Zhou Y and Qiao L: COX-2 regulates E-cadherin
expression through the NF-kappaB/Snail signaling pathway in gastric
cancer. Int J Mol Med. 32:93–100. 2013. View Article : Google Scholar : PubMed/NCBI
|
|
37
|
Tseng YC, Tsai YH, Tseng MJ, Hsu KW, Yang
MC, Huang KH, Li AF, Chi CW, Hsieh RH, Ku HH and Yeh TS:
Notch2-induced COX-2 expression enhancing gastric cancer
progression. Mol Carcinog. 51:939–951. 2012. View Article : Google Scholar : PubMed/NCBI
|
|
38
|
Targosz A, Brzozowski T, Pierzchalski P,
Szczyrk U, Ptak-Belowska A, Konturek SJ and Pawlik W: Helicobacter
pylori promotes apoptosis, activates cyclooxygenase (COX)-2 and
inhibits heat shock protein HSP70 in gastric cancer epithelial
cells. Inflam Res. 61:955–966. 2012. View Article : Google Scholar
|
|
39
|
Shin WG, Kim HJ, Cho SJ, Kim HS, Kim KH,
Jang MK, Lee JH and Kim HY: The COX-2-1195AA genotype is associated
with diffuse-type gastric cancer in Korea. Gut Liver. 6:321–327.
2012. View Article : Google Scholar : PubMed/NCBI
|
|
40
|
Sun WH, Yu Q, Shen H, Ou XL, Cao DZ, Yu T,
Qian C, Zhu F, Sun YL, Fu XL and Su H: Roles of Helicobacter pylori
infection and cyclooxygenase-2 expression in gastric
carcinogenesis. World J Gastroenterol. 10:2809–2813. 2004.
View Article : Google Scholar : PubMed/NCBI
|
|
41
|
Zucker S, Lysik RM, DiMassimo BI, Zarrabi
HM, Moll UM, Grimson R, Tickle SP and Docherty AJ: Plasma assay of
gelatinase B: tissue inhibitor of metalloproteinase complexes in
cancer. Cancer. 76:700–708. 1995. View Article : Google Scholar : PubMed/NCBI
|
|
42
|
Groblewska M, Siewko M, Mroczko B and
Szmitkowski M: The role of matrix metalloproteinases (MMPs) and
their inhibitors (TIMPs) in the development of esophageal cancer.
Folia Histochem Cytobiol. 50:12–19. 2012. View Article : Google Scholar : PubMed/NCBI
|
|
43
|
Li M, Yang G, Xie B, Babu K and Huang C:
Changes in matrix metalloproteinase-9 levels during progression of
atrial fibrillation. J Int Med Res. 42:224–230. 2014. View Article : Google Scholar : PubMed/NCBI
|
|
44
|
Avci N, Ture M, Deligonul A, Cubukcu E,
Olmez OF, Sahinturk S, Topak A, Kurt E, Evrensel T, Şahin AB and
Yakut T: Association and prognostic significance of the functional
−1562C/T polymorphism in the promoter region of MMP-9 in Turkish
patients with gastric cancer. Pathol Oncol Res. 21:1243–1247. 2015.
View Article : Google Scholar : PubMed/NCBI
|
|
45
|
Xia Y, Lian S, Khoi PN, Yoon HJ, Joo YE,
Chay KO, Kim KK and Do Jung Y: Chrysin inhibits tumor
promoter-induced MMP-9 expression by blocking AP-1 via suppression
of ERK and JNK pathways in gastric cancer cells. PloS One.
10:e01240072015. View Article : Google Scholar : PubMed/NCBI
|
|
46
|
Akter H, Park M, Kwon OS, Song EJ, Park WS
and Kang MJ: Activation of matrix metalloproteinase-9 (MMP-9) by
neurotensin promotes cell invasion and migration through ERK
pathway in gastric cancer. Tumour Biol. 36:6053–6062. 2015.
View Article : Google Scholar : PubMed/NCBI
|
|
47
|
Shan YQ, Ying RC, Zhou CH, Zhu AK, Ye J,
Zhu W, Ju TF and Jin HC: MMP-9 is increased in the pathogenesis of
gastric cancer by the mediation of HER2. Cancer Gene Ther.
22:101–107. 2015. View Article : Google Scholar : PubMed/NCBI
|
|
48
|
Shimura T, Dagher A, Sachdev M, Ebi M,
Yamada T, Yamada T, Joh T and Moses MA: Urinary ADAM12 and
MMP-9/NGAL complex detect the presence of gastric cancer. Cancer
Prev Res (Phila). 8:240–248. 2015. View Article : Google Scholar : PubMed/NCBI
|
|
49
|
Yamatoji M, Kasamatsu A, Kouzu Y, Koike H,
Sakamoto Y, Ogawara K, Shiiba M, Tanzawa H and Uzawa K:
Dermatopontin: A potential predictor for metastasis of human oral
cancer. Int J Cancer. 130:2903–2911. 2012. View Article : Google Scholar : PubMed/NCBI
|
|
50
|
Docea AO, Mitruţ P, Grigore D, Pirici D,
Călina DC and Gofiţă E: Immunohistochemical expression of TGF beta
(TGF-beta), TGF beta receptor 1 (TGFBR1), and Ki67 in intestinal
variant of gastric adenocarcinomas. Rom J Morphol Embryol. 53 Suppl
3:S683–S692. 2012.
|
|
51
|
Shinto O, Yashiro M, Kawajiri H, Shimizu
K, Shimizu T, Miwa A and Hirakawa K: Combination effect of a
TGF-beta receptor kinase inhibitor with 5-FU analog S1 on lymph
node metastasis of scirrhous gastric cancer in mice. Cancer Sci.
101:1846–1852. 2010. View Article : Google Scholar : PubMed/NCBI
|
|
52
|
Park D II, Son HJ, Song SY, Choe WH, Lim
YJ, Park SJ, Kim JJ, Kim YH, Rhee PL, Paik SW, et al: Role of
TGF-beta 1 and TGF-beta type II receptor in gastric cancer. The
Korean J Intern Med. 17:160–166. 2002. View Article : Google Scholar : PubMed/NCBI
|
|
53
|
Park SH, Kim YS, Park BK, Hougaard S and
Kim SJ: Sequence-specific enhancer binding protein is responsible
for the differential expression of ERT/ESX/ELF-3/ESE-1/jen gene in
human gastric cancer cell lines: Implication for the loss of
TGF-beta type II receptor expression. Oncogene. 20:1235–1245. 2001.
View Article : Google Scholar : PubMed/NCBI
|