Introduction
Globally, malignant glioma is the most common type
of central nervous system tumor in humans, and is characterized by
high morbidity and mortality rates (1). Thus far, the standard treatment has
included tumor resection with maximal range, adjuvant radiotherapy
and concomitant chemotherapy (1,2). Numerous
types of treatment methods have been adopted, but the median
survival time remains limited to 16–19 months (2). This poor prognosis is primarily due to
the invasive potential of malignant glioma (3). To date, the molecular mechanisms
underlying the invasion of glioma remain unclear (4); therefore, it is urgent that biological
and molecular mechanisms underlying glioma development and
progression are elucidated, which can assist in the development of
more effective treatments.
The melanoma-associated antigen (MAGE) gene was
first discovered in melanoma cells, and melanoma and glial tumors
are known to be commonly derived from neural ectoderm. MAGE has
also been demonstrated to serve as a glioma-specific antigen, and
an increasing amount of evidence has indicated that it is
particularly expressed in glioma tumors (5). The MAGE gene was first recorded by van
der Bruggen et al in 1991 (6),
when it was identified to be a novel gene encoding a tumor-specific
antigen presented by human melanoma cells. In total, >50 MAGE
genes have been identified and divided into two types, based on
differences in the sequence and tissue-specific gene expression
patterns (7). Type I MAGE genes,
which encode for MAGE-A, -B and -C proteins, are located on the X
chromosome; these proteins are expressed in the process of germ
cell development, but not in normal, mature somatic cells (8). By contrast, the localization and
expression of type II MAGE proteins (MAGE-D, -E, -F, -G and -H)
have yet to be clearly elucidated. MAGE-D is divided into four
groups, which belong to the type II MAGE protein family (7).
MAGE-D4 is a tumor-specific antigen that serves an
important role in invasion and metastasis. Numerous studies have
demonstrated that MAGE-D4 can drive cell progression and
metastasis, including that of renal cell carcinoma (9), non-small cell lung cancer (10), breast cancer (11), oral squamous cell carcinoma (12), hepatocellular carcinoma (13), squamous cell carcinoma of the
esophagus (14) and colorectal cancer
(15). In a previous study, it was
identified that the MAGE-D4 mRNA and protein expression levels were
relatively high in gliomas, but that limited, lower or no
expression was present in normal tissue (16); however, an analysis of the function of
MAGE-D4 for survival in glioma cells has not been reported. The
evaluation of MAGE-D4 expression levels in glioma, independent of
other MAGE genes, would be beneficial to glioma treatment options;
therefore, in the present study, the association of MAGE-D4
overexpression with clinical indices and outcomes [sex, age, tumor
size, World Health Organization (WHO) grade, the Ki-67 labeling
index (percentage of Ki-67 positive cells) and the Karnofsky
performance scale (KPS) index] was evaluated using follow-up
materials. The purpose of the present study was to investigate the
potential of the MAGE-D4 gene as a cancer-associated tumor marker,
which may represent a valuable prognostic biomarker and
immunotherapeutic target for glioma.
Materials and methods
Patient characteristics and tissue
specimens
The present study involved the analysis of 124 cases
of glioma from patients aged 2–78 years (median age, 38 years) at
the time of diagnosis. These patients consisted of 78 males and 46
females. Furthermore, 12 samples of normal brain biopsy tissue
obtained from the Specimens Library of the Guangxi Medical
University's Department of Histology and Embryology (Nanning,
China) were included in the study as a control. None of the
patients received preoperative radiotherapy or chemotherapy.
Surgically resected tumor tissues were collected consecutively from
patients at The First Affiliated Hospital and the Affiliated Tumor
Hospital of Guangxi Medical University (Nanning, China) between
September 2009 and June 2016, and were analyzed following study
approval from the Ethics Committee of Guangxi Medical University
and with written informed consent from the patients. Demographics,
tumor size, WHO Classification of Tumors of the Central Nervous
System (15), Ki-67 expression, p53
expression and KPS score were investigated from the retrospective
database. Of the 124 patients, 84 were followed up via a telephone
interview (Table I). Postoperative
follow-up examinations, including a physical examination and
enhanced computed tomography scan, were conducted every 3–6 months.
A treatment strategy was selected from surgery, adjuvant
radiotherapy and chemotherapy, according to the tumor status, tumor
grade and patient condition. Collected tissue specimens were stored
in liquid nitrogen at −80°C prior to analysis. Pathological
evaluation with tumor staging was based on the 2007 WHO
Classification of Tumors of the Central Nervous System (17).
 | Table I.Clinical parameters of follow-up
patients with gliomas (n=84) who were enrolled for survival
analysis. |
Table I.
Clinical parameters of follow-up
patients with gliomas (n=84) who were enrolled for survival
analysis.
| Variable | Number of
patients | Percentage of
patients |
|---|
| Sex |
|
|
|
Male | 56 | 66.67 |
|
Female | 28 | 33.33 |
| Age, years |
|
|
|
<38 | 41 | 48.81 |
|
≥38 | 43 | 51.19 |
| Tumor size, cm |
|
|
|
<5 | 38 | 45.24 |
| ≥5 | 46 | 54.76 |
| WHO
classificationa |
|
|
|
I–II | 40 | 47.61 |
|
III–IV | 44 | 52.38 |
| KPS |
|
|
|
<70 | 35 | 41.67 |
|
≥70 | 49 | 58.33 |
Reverse transcription-quantitative
polymerase chain reaction (RT-qPCR)
Total RNA extraction from frozen tissues and RT-qPCR
were performed as previously described (18). Briefly, total RNA, which was derived
from glioma tissues and normal brain specimens, was prepared using
TRIzol® (Gibco; Thermo Fisher Scientific, Inc., Waltham,
MA, USA). Then RNA was reverse transcribed into cDNA with
RevertAid™ First Strand cDNA Synthesis kit (Fermentas, USA),
according to the manufacturer's instructions. Primers of MAGE-D4
(19) and glyceraldehyde-3-phosphate
dehydrogenase (GAPDH) (20) were
obtained from Applied Biosystems (Thermo Fisher Scientific, Inc.).
The forward primer sequence for MAGE-D4 was
5′-CCAGCTTCTTCTCCTGGATC-3′ and the reverse primer sequence was
5′-GTAACACTGATACCCAAAACATG-3′. The forward primer sequence for
GAPDH was 5′-GCACCGTCAAGGCTGAGAAC-3′ and the reverse primer
sequence was 5′-TGGTGAAGACGCCAGTGGA-3′. qPCR was performed in a 20
µl total reaction volume using SYBR® Premix Ex Taq™ II
kit (Takara Biotechnology Co., Ltd.) on the ABI Prism 7900 sequence
detection system (Applied Biosystems; Thermo Fisher Scientific,
Inc.). The cycling parameters were as follows: Initial denaturation
at 95°C for 10 min, followed by 40 cycles at 95°C for 15 sec, and
annealing and extension at 60°C for 1 min. Dissociation curves were
performed to confirm specific product amplification. MAGE-D4 mRNA
expression was standardized to that of GAPDH mRNA. All samples were
tested in triplicate. Expression levels for samples were
demonstrated as MAGE-D4 values standardized to the MAGE-D4/GAPDH
ratio. The relative number of target transcripts was normalized to
the number of human GAPDH transcripts in the same sample. The
relative quantitation of target gene expression was performed using
the standard curve or quantification cycle method (21).
Immunohistochemistry (IHC)
IHC was performed according to previous studies
(15,16). Paraffin-embedded tissues were formalin
fixed in 10% (v/v) formalin for 24 h at room temperature and cut
into 4 µm-thick sections for IHC. Sections of formalin-fixed and
paraffin-embedded tissues were dried in an oven at 60°C for 1 h,
dewaxed with xylene and rehydrated through a descending series of
alcohols (95, 80, 70 and 50%, v/v). The sections were then heated
in EDTA (pH 8.0; 120°C for 3 min) in order to achieve antigen
retrieval and washed by PBS prior to being treated with 3%
H2O2 for 15 min at room temperature to block
endogenous peroxidase activity. Non-specific binding was blocked by
incubation with 5% (v/v) normal goat serum (OriGene Technologies,
Inc., Beijing, China) for 10 min at 25°C. Subsequently, sections
were incubated with the primary antibody (mouse anti-human
monoclonal antibody IgG; cat. no. sc-393203 HRP; dilution, 1:500;
Santa Cruz Biotechnology, Inc., Dallas, TX, USA) overnight at 4°C.
Following washing three times with 0.01 M phosphate buffer (Beijing
Solarbio Science & Technology Co., Ltd.; pH 7.2), Next, the
sections were incubated at room temperature for 20 min with biotin
conjugated goat anti-mouse IgG (cat. no. TA130009; dilution, 1:200;
OriGene Technologies Inc.), which was used as the biotinylated
secondary antibody. And then, horseradish peroxidase-labeled
streptavidin (OriGene Technologies, Inc.) was performed for 20 min
at room temperature. Finally, all antibody staining was developed
using 3,3′-diaminobenzidine (DAB; Fuzhou Maixin Biotech Co., Ltd.,
Fuzhou, China) as the chromogen for 5 min at room temperature and
counterstained with hematoxylin. Omission of primary antibody was
used as a negative control, and a known glioma tissue section with
MAGE-D4-positive expression as a positive control.
According to the staining characteristics of MAGE-D4
protein, the majority was located within the cell cytoplasm and
nucleus. The final score of protein expression was evaluated by the
sum of the scores of staining intensity and the scores of the
positive cell rate (22,23). The staining intensity was defined
using the following scores: 0, negative; 1, very weak; 2, weak; 3,
moderate; 4, intense; and 5, very intense. The rate of positive
glioma cells were as follows: 0, absence of positive cells; 1, 1–5%
positive cells; 2, 6–25% positive cells; 3, 26–50% positive cells;
4, 51–75% positive cells; and 5, 76–100% positive cells. Sum scores
were as follows: 0–1, negative expression (−); 2–3, weak expression
(+); 4–5, moderate expression (++); and 6–7, strong expression
(+++). The assessment of positive immunoreactivity was achieved by
two independent pathologists (Department of Pathology, First
Affiliated Hospital of Guangxi Medical University, China) using a
blind method. At least five independent foci of neoplastic
infiltration in each tissue specimen were observed using an optical
microscope (Nikon Corporation, Tokyo, Japan) at magnification, ×100
and ×200.
Bioinformatics and statistical
analysis
ONCOMINE (https://www.oncomine.org) is currently the largest
cancer microarray database and integrated data-mining platform
globally, and was used to retrieve and analyze the gene expression
profile microarray data for tumor samples (24). The expression levels of MAGE-D4 in a
number of types of glioma were obtained from the Oncomine dataset
(http://www.proteinatlas.org). A one-way
analysis of variance (ANOVA) test was used to identify the
significantly expressed differentially expressed genes (DEGs) in
glioma samples, with a combination of P<0.05 and the |log2FC
(fold change) |>2 used as the threshold. The immunohistochemical
staining results of MAGE-D4 in glioma and normal tissues were
selected from the Human Protein Atlas (www.proteinatlas.org) was applied to identify the
total percentage of positive cells for MAGE-D4 protein. The MAGE-D4
protein expression associated with clinicopathological parameters
was analyzed using the χ2 or Fisher's exact probability
test. Data are expressed as the mean ± standard deviation. The data
of normal brain tissues and different glioma groups were analyzed
by an one-way ANOVA test followed by the post-hoc
Student-Newman-Keuls test. The prognostic value of the MAGE-D4
protein expression was evaluated using regression analysis. The
Kaplan-Meier method was used to calculate overall survival (OS) and
recurrence-free survival (RFS) rates, whilst differences in
survival curves were compared using the log-rank test. Cox
proportional hazard models were used to detect prognostic factors
during the multivariable regression analysis. Variables with
P<0.05 were included in the final model. All the statistical
analyses were conducted using the SPSS version 16 statistical
software package for Windows (SPSS, Inc., Chicago, IL, USA).
P<0.05 was considered to indicate a statistically significant
difference.
Results
MAGE-D4 mRNA and protein expression
analysis using bioinformatics
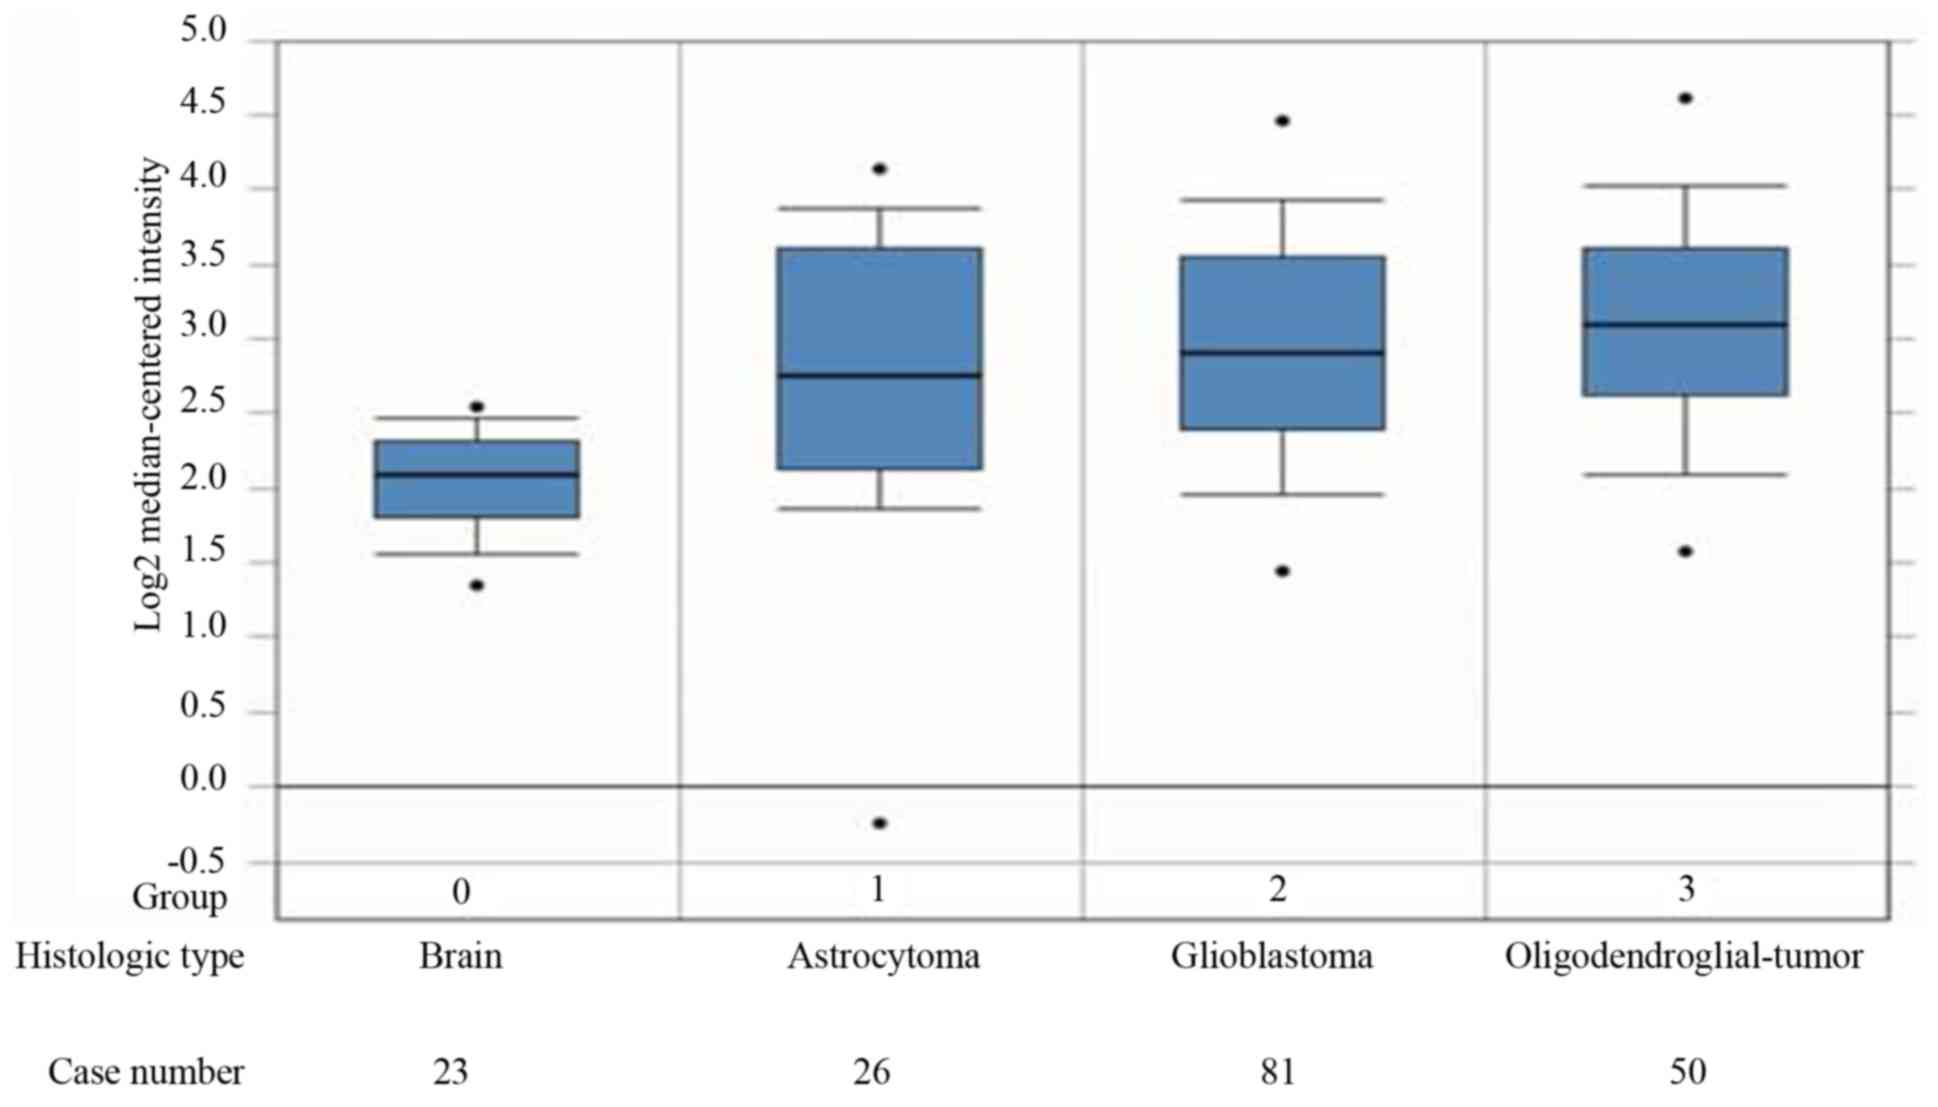
The differences in MAGE-D4 mRNA expression in
various types of gliomas can be determined by searching the
ONCOMINE microarray datasets. Query results from the Sun Brain 2
dataset (Fig. 1) indicated that
MAGE-D4 mRNA expression in different types of glioma tissues
(astrocytoma, glioblastoma and oligodendroglial) were all
significantly increased compared with that in normal brain tissue
(P<0.05; Student-Newman-Keuls post-hoc test). Furthermore,
MAGE-D4 protein was detected in 10 cases of glioma, although not in
normal brain tissue, using the Human Protein Atlas (HPA) Database
(http://www.proteinatlas.org). The HPA
database indicated that the total percentage of positive cells for
MAGE-D4 protein was 80%. This consisted of 10% with strong
expression, 30% with moderate expression and 40% with weak
expression. The remaining 20% recorded negative expression.
Staining for MAGE-D4 protein was mainly located within the cell
nucleus.
MAGE-D4 mRNA expression analysis using
RT-qPCR
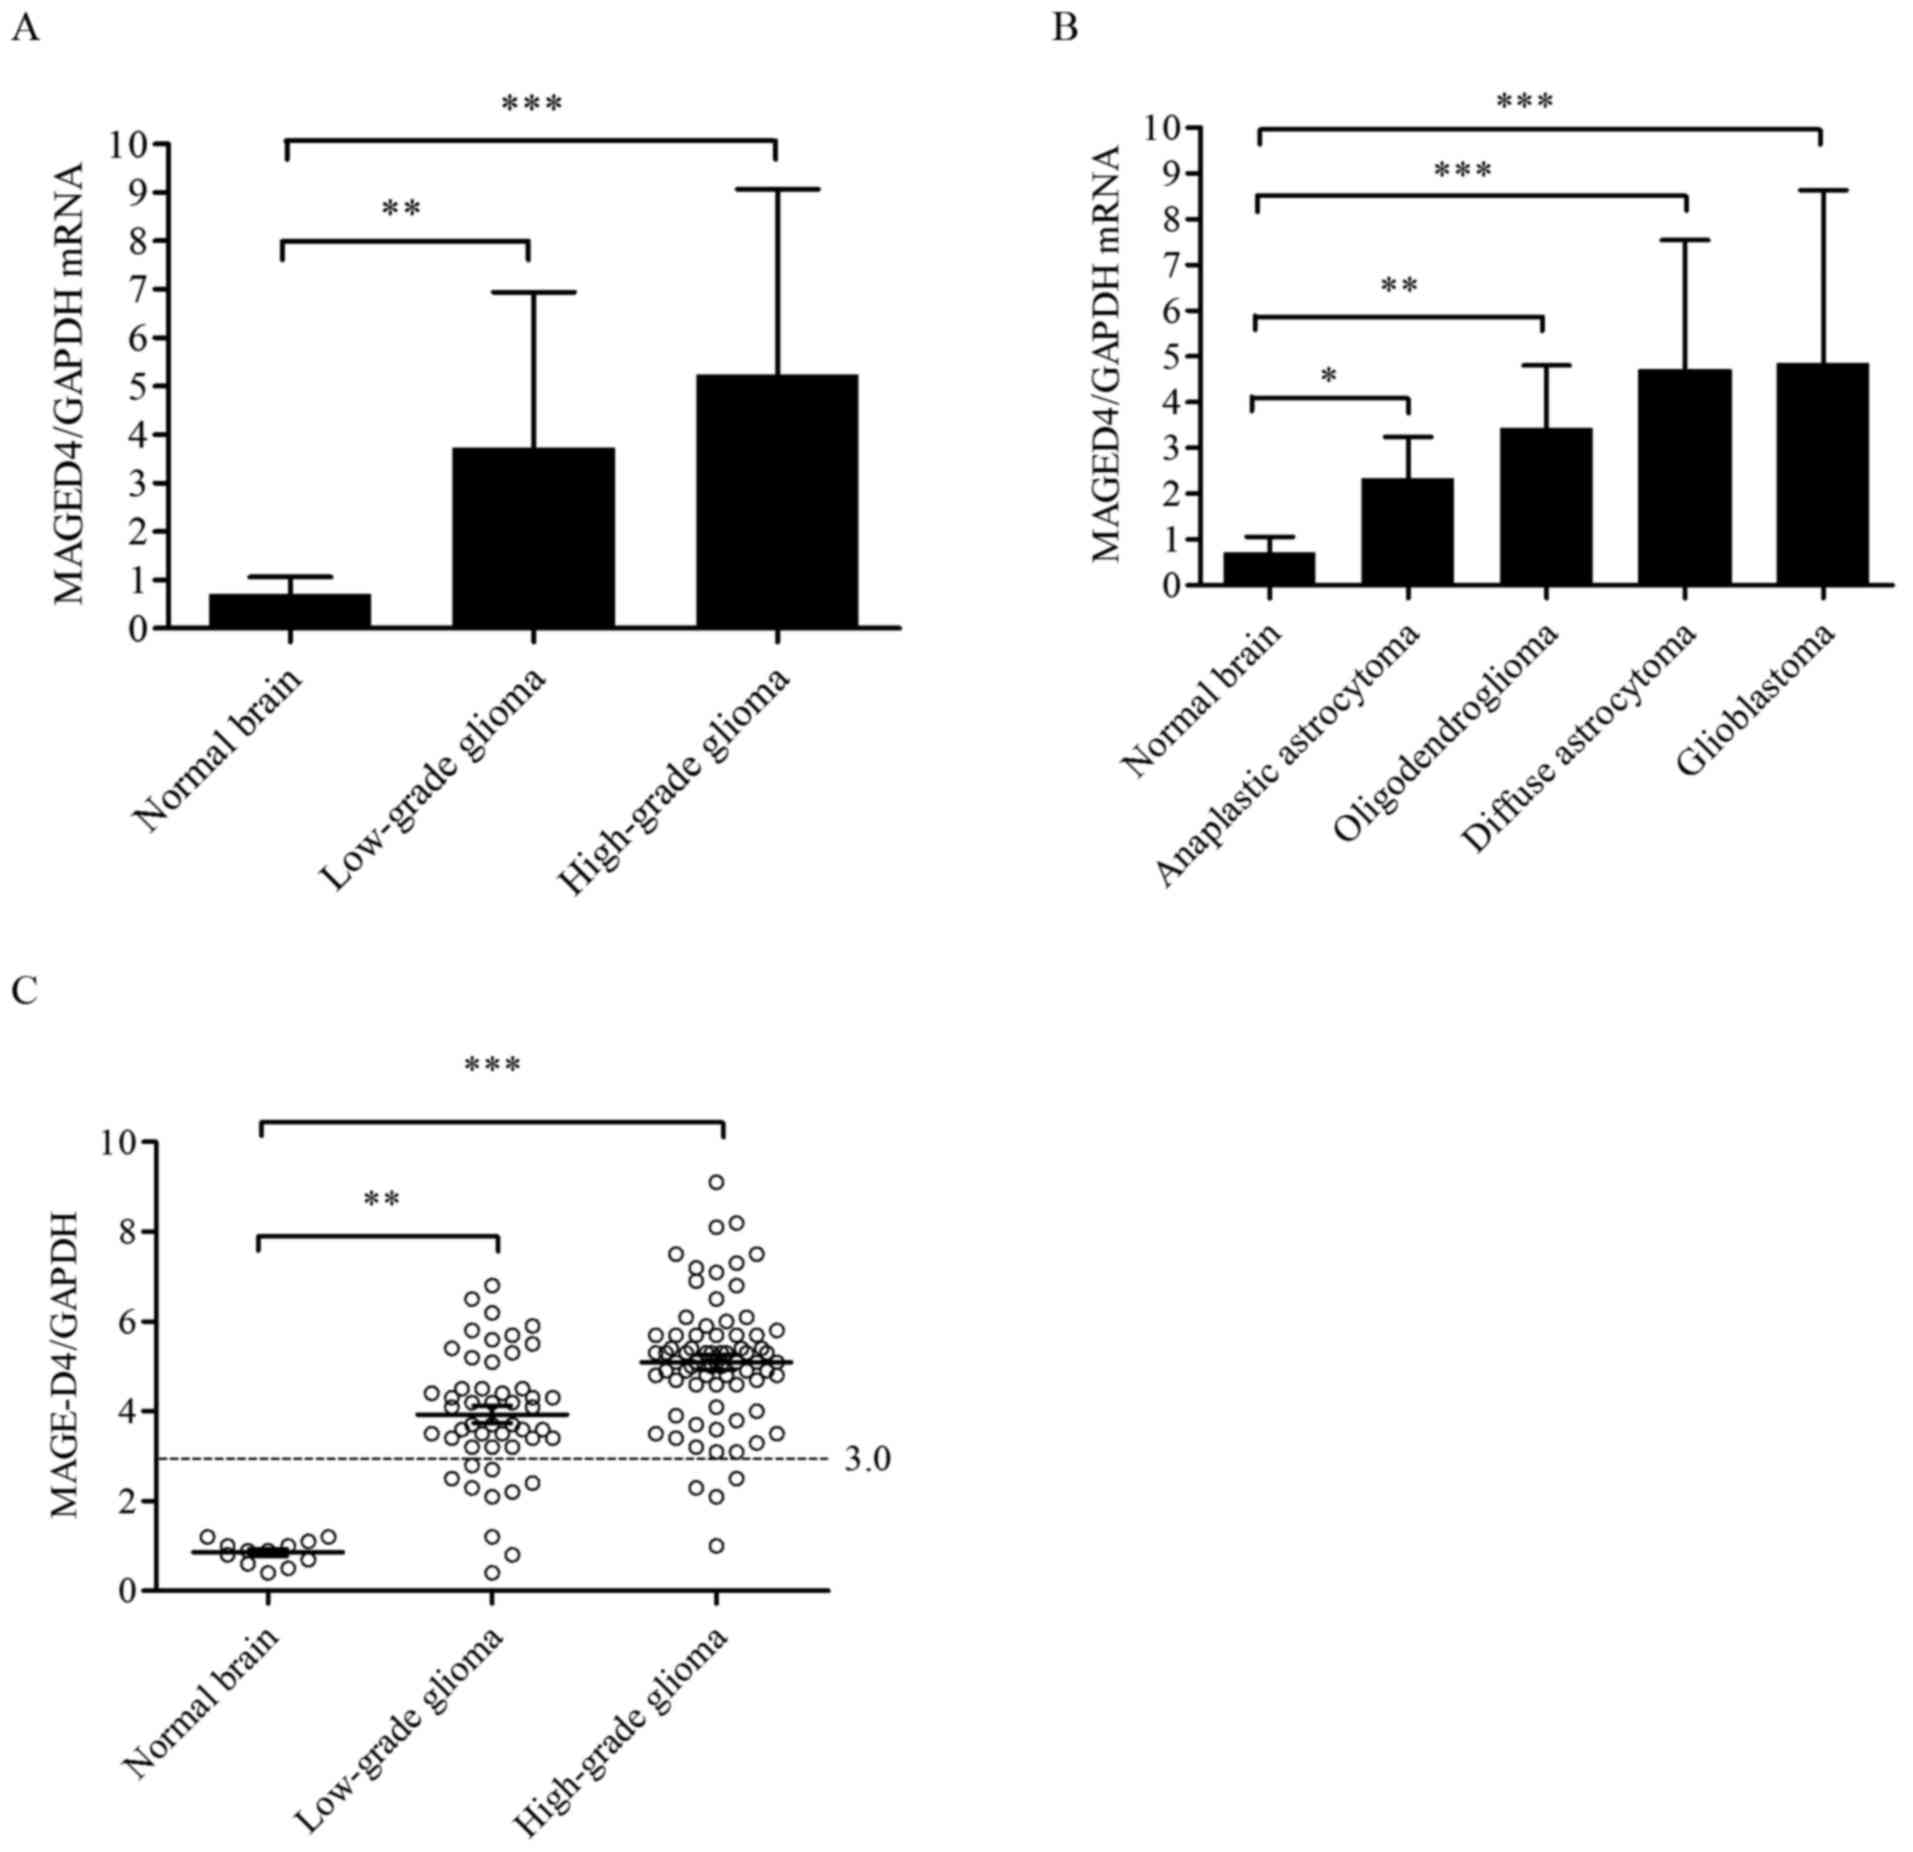
The expression levels of MAGE-D4 mRNA were analyzed
in 124 glioma and 12 normal brain tissue specimens using RT-qPCR.
The data from the normal brain tissues and the different glioma
groups were analyzed using an one-way ANOVA test. There were
significant differences between low-grade glioma and high-grade
glioma compared with normal brain tissues (F=6.333; P<0.01). The
median values of MAGE-D4 mRNA in low-grade glioma (3.733±0.10;
P<0.01) and high-grade glioma (5.237±0.13; P<0.001) were
significantly higher than that in normal brain tissues
(0.710±0.07); however, there was no significant difference in
MAGE-D4 mRNA between high-grade and low-grade glioma (P=0.486;
Fig. 2A). For the expression levels
of MAGE-D4 mRNA in each group, one-way ANOVA demonstrated
significant differences between various types of glioma and normal
brain tissues (F=5.922; P<0.001). The median value of MAGE-D4
mRNA was highest in glioblastoma (4.855±0.11; P<0.001), while
diffuse astrocytoma had the second highest value (4.695±0.04;
P<0.001), followed by oligodendroglioma (3.437±0.09; P<0.01)
and anaplastic astrocytoma (2.333±0.13; P<0.05), all compared
with normal brain tissue (0.710±0.07); however, there was no
significant effect of multiple comparisons following a post-hoc
test (Fig. 2B). As depicted in
Fig. 2C, high expression of MAGE-D4
was defined as exceeding the median value of MAGE-D4/GAPDH in
normal brain tissues by three-fold. The results demonstrated that
the percentage of glioma tissues that exhibited high mRNA MAGE-D4
expression was 67.74%, whereas 0% of normal brain tissues had high
expression levels (P<0.001). The percentage of high mRNA MAGE-D4
expression in low-grade (WHO, I–II; 24.19%) and high-grade gliomas
(WHO, III–IV; 43.55%) was compared with that in normal brain
tissue, respectively, with significant differences found (P<0.01
and P<0.001, respectively); however, no significant differences
were found between high-grade and low-grade glioma (P=0.810). No
apparent association was identified between the relative expression
level and high expression ratio of MAGE-D4 with age, sex, tumor
size and WHO grade (data not shown).
MAGE-D4 protein expression analysis
using IHC
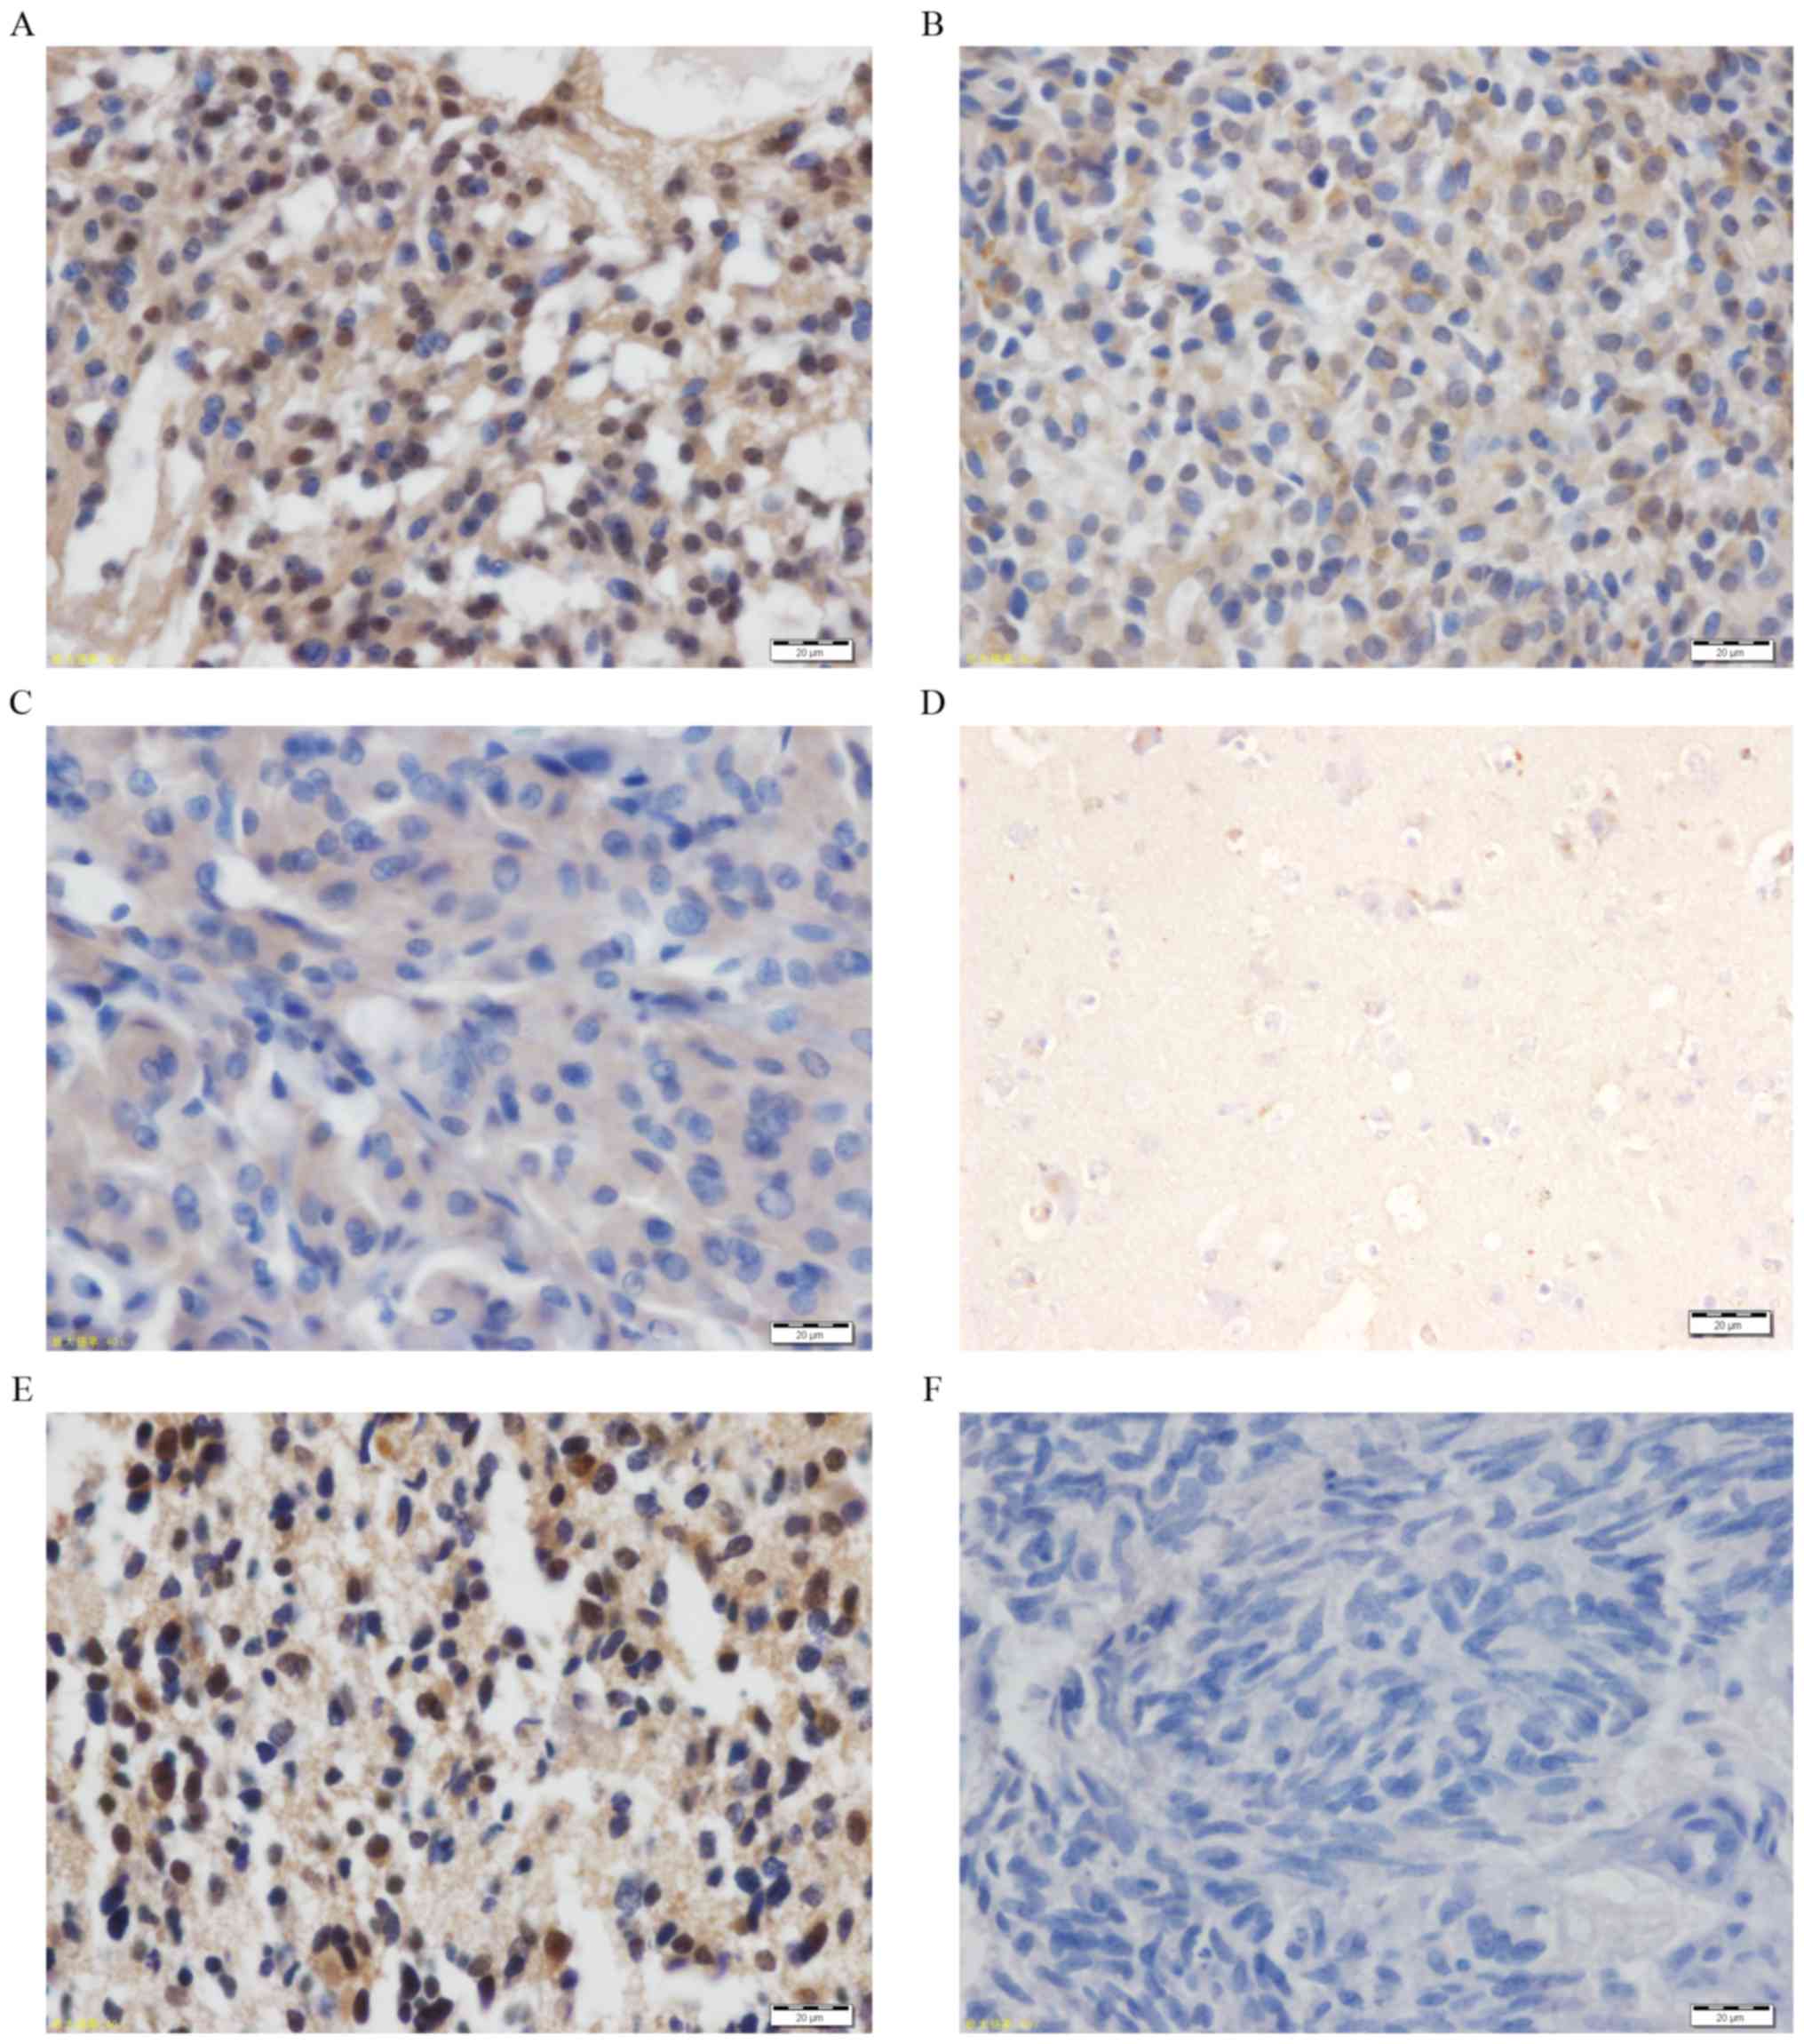
MAGE-D4 protein expression in 124 glioma tissues was
analyzed using IHC. The results demonstrated that the total
percentage of cells positive for MAGE-D4 protein was 78.23%. The
majority of the staining for the MAGE-D4 protein was distributed in
the cell cytoplasm and nucleus. The percentage of MAGE-D4-positive
protein expression in cells in the low-grade glioma samples (WHO,
I–II) was 28.23%, while in high-grade gliomas (WHO, III–IV) it was
50.00% (Table II). Based on age
group, the percentage of positive cells in children (<16 years
old) was 9.67% and in adults was 68.55%. According to the staining
intensity, high expression of the MAGE-D4 protein (Fig. 3A and B) was demonstrated in 59.68% of
patients, and low protein expression of MAGE-D4 (Fig. 3C) was demonstrated in the remaining
40.32%. Furthermore, 12 normal brain tissues were stained and the
presence of MAGE-D4 was almost non-existent (Fig. 3D). A known glioma tissue section with
MAGE-D4-positive expression was used as the positive control
(Fig. 3E) and pre-immune rabbit serum
was used as a negative control (Fig.
3F).
| Table II.Association between the MAGE-D4
protein and clinical charateristic of patients with glioma. |
Table II.
Association between the MAGE-D4
protein and clinical charateristic of patients with glioma.
|
|
| Positive/total, n
(%) |
|
|
|---|
|
|
|
|
|
|
|---|
|
Characteristics | Positive/total
test, n (%) | Higha | Lowb | χ2 | P-value |
|---|
| Sex |
|
|
|
|
|
|
Male | 61/124 (49.19) | 45/124 (36.29) | 33/124 (26.61) | 0.749 | 0.862 |
|
Female | 36/124 (29.03) | 29/124 (23.39) | 17/124 (13.71) |
|
|
| Age, years |
|
|
|
|
|
|
<38 | 49/124 (39.51) | 39/124 (31.45) | 23/124 (18.55) | 0.670 | 0.880 |
|
≥38 | 48/124 (38.71) | 35/124 (28.23) | 27/124 (21.77) |
|
|
| Age group |
|
|
|
|
|
|
Children | 12/124 (9.67) | 9/124 (7.26) | 11/124 (8.87) | 2.417 | 0.518 |
|
Adults | 85/124 (68.55) | 55/124 (44.35) | 49/124 (39.52) |
|
|
| Tumor size, cm |
|
|
|
|
|
|
<5 | 47/124 (37.90) | 35/124 (28.23) | 24/124 (19.35) | 0.774 | 0.855 |
| ≥5 | 50/124 (40.32) | 43/124 (34.68) | 22/124 (17.74) |
|
|
| WHO
classificationc |
|
|
|
|
|
|
I–II | 35/124 (28.23) | 23/124 (18.55) | 32/124 (25.80) | 16.116 | 0.001d |
|
III–IV | 62/124 (50.00) | 51/124 (41.13) | 18/124 (14.52) |
|
|
| Ki-67 expression,
% |
|
|
|
|
|
|
<10 | 51/124 (41.13) | 37/124 (29.84) | 33/124 (26.61) | 4.071 | 0.254 |
|
≥10 | 46/124 (37.10) | 37/124 (29.84) | 17/124 (13.71) |
|
|
| p53 expression,
% |
|
|
|
|
|
|
≤10 | 42/124 (33.87) | 27/124 (21.77) | 36/124 (29.03) | 19.969 |
<0.001d |
|
≥10 | 55/124 (44.35) | 47/124 (37.90) | 14/124 (11.29) |
|
|
| KPS score |
|
|
|
|
|
|
<70 | 42/124 (33.87) | 33/124 (26.61) | 19/124 (15.32) | 0.615 | 0.893 |
|
≥70 | 55/124 (44.35) | 46/124 (37.10) | 26/124 (20.97) |
|
|
| Total | 97/124 (78.23) | 74/124 (59.68) | 50/124 (40.32) |
|
|
Association between MAGE-D4 protein
expression and clinicopathological parameters
The association of MAGE-D4 protein expression with
clinical factors is demonstrated in Table II. There was a significant
association between MAGE-D4 protein expression and WHO
classification (P<0.001) and p53 expression (P<0.001). By
contrast, MAGE-D4 protein expression was not associated with age
(P=0.880), sex (P=0.862), age group (P=0.518), tumor size
(P=0.855), Ki-67 expression (P=0.254) or KPS score (P=0.893).
Prognostic influence of overexpression
of the MAGE-D4 protein
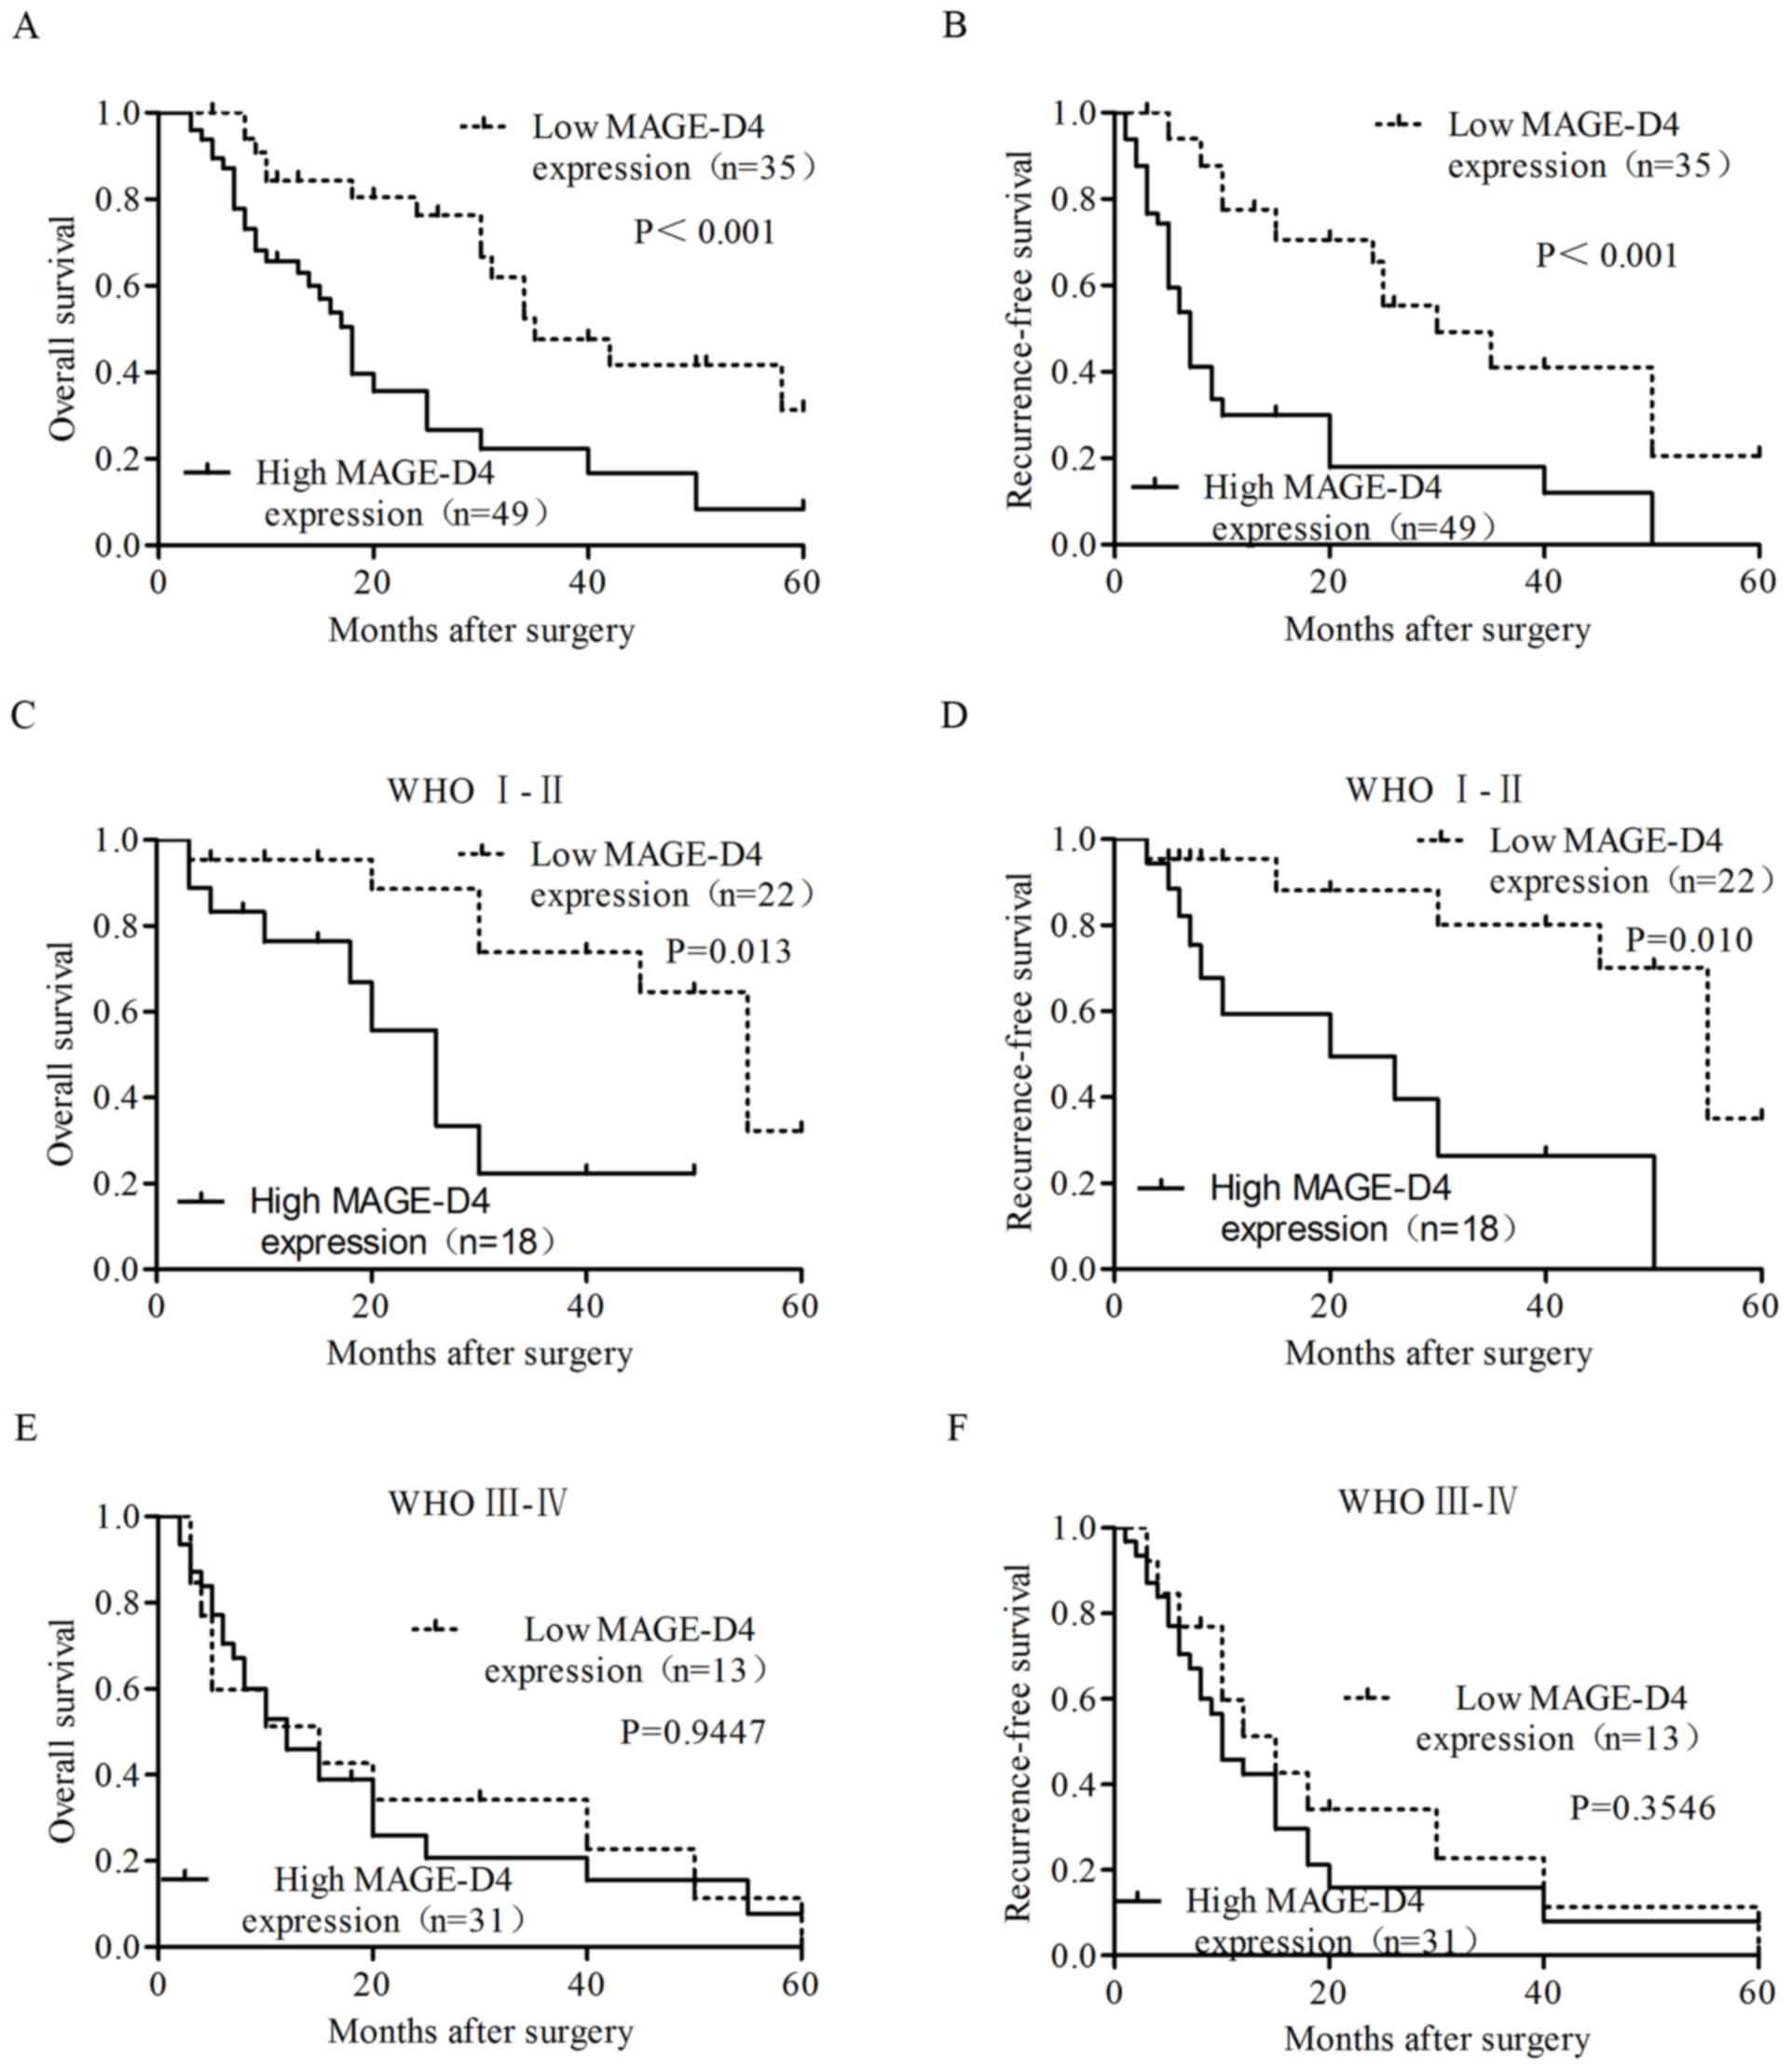
To determine the prognostic value for MAGE-D4, the
impact of MAGE-D4 expression and tumor classification was assessed
via Kaplan-Meier survival analysis. In total, 84/124 patients with
glioma were followed up in the present study and had complete
clinical records. The median duration of patient follow-up was 24.8
months (range, 1–69 months). Taking these clinical records into
account, a significant positive association between MAGE-D4 protein
expression and OS and RFS time was identified in patients with
glioma. All patients with high MAGE-D4 expression in cancerous
tissues had a significantly reduced median OS (18.00 vs. 33.29
months; P<0.001) and RFS (12.7 vs. 28.3 months; P<0.001) time
compared with those with low MAGE-D4 expression (Fig. 4A and B). In the patients with
low-grade (WHO, I–II) glioma, the median OS (26.11 vs. 35.85
months; P=0.013) and RFS (22.7 vs. 37.3 months; P=0.010) times were
significantly reduced in patients with high MAGE-D4 protein
expression (Fig. 4C and D); however,
in high-grade gliomas (WHO, III–IV), there was no significant
difference between high and low MAGE-D4 expression for OS and RFS
(P>0.05; Fig. 4E and F) time.
Patients were grouped by sex, age, tumor size (≥5.0 cm) (25), KPS score (<70), WHO classification
(III and IV), Ki-67 expression (≥10%), p53 expression (≥10%)
(26–28) and MAGE-D4 protein expression. Among
these variables, an age of ≥38 years, WHO classification of III and
IV, Ki-67 expression ≥10%, p53 expression ≥10% and high
MAGE-D4protein expression were considered as significant prognostic
parameters via univariate analysis. The survival of patients was
impacted by a number of elements; therefore, the implementation of
a multivariate analysis was necessary. The analysis indicated that
the WHO classification and MAGE-D4 protein expression were
significant impact factors in the prognosis of patients with
glioma. There was a significant positive association between the
high MAGE-D4 protein expression levels and the prognosis of
patients with glioma; therefore, it was presumed that the MAGE-D4
protein expression could be identified as an independent prognostic
factor for patients with glioma (Table
III).
| Table III.Univariate and multivariate analysis
of different prognostic parameters. |
Table III.
Univariate and multivariate analysis
of different prognostic parameters.
|
|
|
Univariatea |
Multivariateb |
|---|
|
|
|
|
|
|---|
| Variable | n | HR (95%
CI)c | P-value | HR (95%
CI)c | P-value |
|---|
| Sex, male | 56 | 1.164
(0.645–2.102) | 0.609 |
|
|
| Age, ≥38 years | 43 | 1.964
(1.102–3.501) | 0.018d | 1.353
(0.633–2.892) | 0.436 |
| Tumor size, ≥5
cm | 46 | 1.079
(0.536–2.172) | 0.829 |
|
|
| KPS score,
<70 | 35 | 1.028
(0.580–1.821) | 0.924 |
|
|
| WHO classification,
III + IV | 44 | 3.343
(1.794–5.861) |
<0.001d | 3.698
(2.017–6.782) |
<0.001d |
| Ki-67 expression,
≥10% | 36 | 1.885
(1.084–3.278) | 0.021d | 1.336
(0.668–2.671) | 0.413 |
| p53 expression,
≥10% | 44 | 2.079
(1.168–3.701) | 0.010d | 1.463
(0.805–2.656) | 0.212 |
| MAGE-D4 protein
expression, high | 49 | 1.971
(1.102–3.527) | 0.019d | 2.384
(1.308–4.347) | 0.005d |
Discussion
The diagnosis of glioma relies mainly on clinical
manifestations and immunochemical indicators, including
histopathological features, although few cancer-associated genes
have been identified as valuable prognostic biomarkers (29). Recently, the molecular heterogeneity
of cancer has been elucidated by microarray-based expression
profiling studies. These microarray studies can be considered as
high-throughput platforms for the analysis of gene expression with
different tumor types (30,31). The identification of valuable
prognostic biomarkers will benefit early diagnosis, tumor therapy
response predictions, prognosis and eventually individualized
treatment. The results of the microarray-based expression profiling
studies demonstrated thatMAGE-D4 is a valuable prognostic biomarker
and therapeutic target for glioma (30,31).
In the present study, it was first confirmed that
the expression of MAGE-D4 mRNA and protein in different types of
glioma specimens was significantly increased compared with that in
normal brain tissue, as determined by bioinformatics analysis.
Secondly, RT-qPCR and IHC analysis confirmed that MAGE-D4 mRNA and
protein expression levels were significantly higher in glioma
tissues than in normal brain tissues. The present results indicated
that the percentage of glioma tissues with high expression of
MAGE-D4 mRNA was 67.74% and that the percentage positive for
MAGE-D4 protein expression was 78.23%. MAGE-D4 protein expression
was also significantly associated with the age group (P<0.0001),
WHO classification (P<0.001) and p53 expression (P<0.001).
Finally, patients with high MAGE-D4 expression in cancerous tissues
experienced significantly reduced median OS and RFS times compared
with those with low MAGE-D4 expression.
MAGE-D4, which was initially defined as MAGE-E1,
belongs to the MAGE family of genes and has been identified to
exhibit significantly higher expression in tumor tissues than
normal tissues (19). In exploring
immunotherapeutic treatments, researchers initially identified that
MAGE-D4 was overexpressed in a number of human malignant tumor
types, including renal cell carcinoma, non-small cell lung cancer
and oral squamous cell carcinoma (9,30,31), and the present study results were
consistent with this aspect. Compared with our previous report
(16), the present study demonstrated
that the positive percentage of MAGE-D4 protein was greater than
that of the mRNA expression, and there are several possibilities
for explaining this inconsistency. According to the patterns of
eukaryote gene expression, the level of mRNA does not always
accurately reflect the protein level, which may be due to mRNA
stability, translational regulation, post-transcriptional
modifications, and proteasomal degradation (32,33). In
this regard, it is more important to perform a protein analysis
than an mRNA analysis; therefore, IHC was used to directly measure
MAGE-D4 protein expression in glioma, and these protein levels were
used in the subsequent statistical analysis. The present study
demonstrated that MAGE-D4 protein expression was not associated
with the age group (P>0.05). As there were fewer cases of
gliomas in children, therefore, the number of patients included in
such studies should be increased in the future.
In a type I MAGE family genetic study, Guo et
al (5) reported that the protein
expression levels of MAGE-A1, -A3 and -A11 in the glioma specimens
were all significantly increased compared with those in the normal
brain tissue. Patients with high MAGE-A1 and -A11 expression levels
exhibited significantly reduced OS times compared with those with
low expression levels (5). The
results in terms of these aspects were consistent with the present
study of a type II MAGE family. The results indicated that MAGE
family types I and II may be used as ideal targets in immunotherapy
for glioma, and may be potential markers for a poor prognosis of
glioma. He et al (16)
reported the differential expression of MAGE-D4 at the mRNA and
protein level in glioma and normal brain tissues. There were 41
cases of glioma, with the number of cases being less than the
present study with 124 cases of glioma and statistical efficiency
being insufficient (16); however,
the present study involved the analysis of 124 cases of glioma. In
addition, the association of expression levels with
clinicopathological parameters was analyzed and multivariate
analysis and survival analysis, including OS and RFS time, of
patients with glioma were performed. The present study is therefore
superior to the study by He et al (16), and further verified that MAGE-D4 is a
potential biomarker of glioma and an important factor in the
prognosis of patients with glioma initiation and recurrence.
Additionally, with regard to the choice of a tumor
size of ≥5 cm, Ki-67 expression of ≥10% and p53 expression of ≥10%,
several factors were considered. Firstly, the average tumor size
was 5 cm in the present study. Furthermore, according to the
survival risk stratification standard for patients with low-grade
glioma by the European Organization for Research and Treatment of
Cancer (34). Karim et al
(34) chose the ‘Greatest diameter=5
cm’ as the TNM staging classification standard of primary low-grade
glioma, Daniels et al (35)
considered that a tumor size of ≥6 cm was a be risk factor for OS
time of low-grade glioma. Therefore, after comprehensive
consideration, a tumor size of ≥5 cm was selected to be a
prognostic parameter in the our present study. Secondly, according
to the Human Protein Atlas (HPA) Database (http://www.proteinatlas.org), as IHC showed Ki-67
staining in nucleus, nucleoli and nuclear (https://www.proteinatlas.org/ENSG00000148773-MKI67/cell),
and p53 staining in nucleoplasm (https://www.proteinatlas.org/ENSG00000141510-TP53/cell).
Distribution of Ki-67 and p53 proteins was all located in the cell
nucleus (36). Specimens with
positive immunostaining of Ki-67 and p53 in glioma were quantified
by image analysis. The ratio of immunostained surface was
determined as previously described (26–28).
Vascular endothelial cells, lymphocytic cells and necrotic areas
were excluded from counts. From the five high magnification views
of 100 cells, the percentage of positive cells was calculated and
used in the following scoring method: 0–10%, 0 points; 11–24%, 1
points; 25–49%, 2 points; 50–74%, 3 points; ≥75%, 4 points. Thus,
Ki-67<10%, low expression; Ki-67≥10%, high expression;
p53<10%, low expression; and p53≥10%, high expression were
used.
Additionally, there are 6 studies regarding survival
analysis concerning MAGE-D4 in different tumor types (11–15,22),
including non-small cell lung cancer, hepatocellular carcinoma,
oral squamous cell carcinoma, breast cancer, squamous cell
carcinoma of the esophagus and colorectal cancer. Of the 6 studies,
5 identified that MAGE-D4 was a major, independent prognostic
factor for OS time (11–15) however, Ito et al (22) identified no significant difference
between high and low MAGE-D4 expression for post-operative survival
in non-small cell lung cancer. In the present study, there was no
significantdifference between high and low MAGE-D4 expressionin
high-grade gliomas (WHO, III–IV) for OS and RFS (P>0.05) time,
possibly due to the relatively small patient number in the study;
thus further studies should use an increased number of patients. To
the best of our knowledge, the function of MAGE-D4 for survival
analysis in patients with glioma has not previously been reported.
The present study was the first to indicate MAGE-D4 as a major
independent prognostic factor for OS and RFS time in glioma.
There were several limitations to the present study.
Firstly, it is known that there is a significant association
between the localization of protein and the biological functions of
the cells (7). It has been indicated
via immunofluorescence microscopy that MAGE-D4 is concentrated in
the central-spindle and the mid-body regions from the telophase to
the post-mitotic phase in lung cancer cells, which demonstrates
that MAGE-D4 may serve a role in a particular cell cycle pattern
and in cell division (22). Another
study indicated that MAGE-D4 affected adhesion by causing changes
in breast cancer cell morphology (11). In light of this other research, the
present study is limited by its lack of functional analysis
associated with the localization of the MAGE-D4 protein. Further
study should focus on elucidating the cause of the morphological
changes associated with glioma cells underlying the biological
activities of MAGE-D4, including the mechanism underlying the
action.
Secondly, in the present study, the focus was on
understanding the differences in MAGE-D4 expression in glioma and
normal brain tissue, including the influence of MAGE-D4 on the
prognosis of patients with glioma. In order to identify the
biological function of MAGE-D4, future in vitro and in
vivo experiments should be designed using MAGE-D4-positive and
-negative glioma cells. Finally, considering that the present study
was conducted in a single institute, the number of patients
included in the study should be increased and the classification of
these patients should be balanced. In addition, it is equally
important to detect the serum immunoreactivity of patients with
glioma. The ultimate purpose of the experimental line of
questioning is building up a foundation for immunotherapy based on
MAGE-D4.
In conclusion, the present study demonstrated that
MAGE-D4 protein was expressed at high levels in glioma, and its
expression was significantly associated with the age group, WHO
classification of glioma severity and p53 expression. Patients with
high levels of MAGE-D4 expression generally had a poorer prognosis
compared with those with a low level of expression. The
multivariable analysis indicated that the high expression of
MAGE-D4protein was an independent prognostic factor. These results
indicated that MAGE-D4 may be a promising biomarker for glioma and
an important factor for determining the prognosis of patients with
new or recurring glioma.
Acknowledgements
The present study was supported by grants from the
Guangxi Health and Family Planning Commission Research Award (no.
Z2016037), the Guangxi Traditional Chinese Medicine Research
Project (no. GZZC16-53) and the Youth Science Foundation of Guangxi
Medical University (no. GXMUYSF201306).
Glossary
Abbreviations
Abbreviations:
|
MAGE
|
melanoma-associated antigen
|
|
IHC
|
immunohistochemistry
|
References
|
1
|
Huse JT and Holland EC: Targeting brain
cancer: Advances in the molecular pathology of malignant glioma and
medulloblastoma. Nat Rev Cancer. 10:319–331. 2010. View Article : Google Scholar : PubMed/NCBI
|
|
2
|
Thomas AA, Brennan CW, DeAngelis LM and
Omuro AM: Emerging therapies for glioblastoma. JAMA Neurol.
71:1437–1444. 2014. View Article : Google Scholar : PubMed/NCBI
|
|
3
|
Lee KH, Ahn EJ, Oh SJ, Kim O, Joo YE, Bae
JA, Yoon S, Ryu HH, Jung S, Kim KK, et al: KITENIN promotes glioma
invasiveness and progression, associated with the induction of EMT
and stemness markers. Oncotarget. 6:3240–3253. 2015.PubMed/NCBI
|
|
4
|
Diksin M, Smith SJ and Rahman R: The
molecular and phenotypic basis of the glioma invasive perivascular
niche. Int J Mol Sci. 18:pii: E23422017. View Article : Google Scholar
|
|
5
|
Guo L, Sang M, Liu Q, Fan X, Zhang X and
Shan B: The expression and clinical significance of
melanoma-associated antigen-A1, -A3 and -A11 in glioma. Oncol Lett.
6:55–62. 2013. View Article : Google Scholar : PubMed/NCBI
|
|
6
|
van der Bruggen P, Traversari C, Chomez P,
Lurquin C, De Plaen E, Van den Eynde B, Knuth A and Boon T: A gene
encoding an antigen recognized by cytolytic T lymphocytes on a
human melanoma. Science. 254:1643–1647. 1991. View Article : Google Scholar : PubMed/NCBI
|
|
7
|
Lee AK and Potts PR: A comprehensive guide
to the MAGE family of ubiquitin ligases. J Mol Biol. 429:1114–1142.
2017. View Article : Google Scholar : PubMed/NCBI
|
|
8
|
Chomez P, De Backer O, Bertrand M, De
Plaen E, Boon T and Lucas S: An overview of the MAGE gene family
with the identification of all human members of the family. Cancer
Res. 61:5544–5551. 2001.PubMed/NCBI
|
|
9
|
Krämer BF, Schoor O, Krüger T, Reichle C,
Müller M, Weinschenk T, Hennenlotter J, Stenzl A, Rammensee HG and
Stevanovic S: MAGED4-expression in renal cell carcinoma and
identification of an HLA-A'25-restricted MHC class I ligand from
solid tumor tissue. Cancer Biol Ther. 4:943–948. 2005. View Article : Google Scholar : PubMed/NCBI
|
|
10
|
Ma QY, Pang LW, Chen ZM, Zhu YJ, Chen G
and Chen J: The significance of MAGED4 expression in non-small cell
lung cancer as analyzed by real-time fluorescence quantitative PCR.
Oncol Lett. 4:733–738. 2012. View Article : Google Scholar : PubMed/NCBI
|
|
11
|
Germano S, Kennedy S, Rani S, Gleeson G,
Clynes M, Doolan P, McDonnell S, Hughes L, Crown J and O'Driscoll
L: MAGE-D4B is a novel marker of poor prognosis and potential
therapeutic target involved in breast cancer tumorigenesis. Int J
Cancer. 130:1991–2002. 2012. View Article : Google Scholar : PubMed/NCBI
|
|
12
|
Chong CE, Lim KP, Gan CP, Marsh CA, Zain
RB, Abraham MT, Prime SS, Teo SH, Silvio Gutkind J, Patel V and
Cheong SC: Over-expression of MAGED4B increases cell migration and
growth in oral squamous cell carcinoma and is associated with poor
disease outcome. Cancer Lett. 321:18–26. 2012. View Article : Google Scholar : PubMed/NCBI
|
|
13
|
Takami H, Kanda M, Oya H, Hibino S,
Sugimoto H, Suenaga M, Yamada S, Nishikawa Y, Asai M, Fujii T, et
al: Evaluation of MAGE-D4 expression in hepatocellular carcinoma in
Japanese patients. J Surg Oncol. 108:557–562. 2013. View Article : Google Scholar : PubMed/NCBI
|
|
14
|
Oya H, Kanda M, Takami H, Hibino S,
Shimizu D, Niwa Y, Koike M, Nomoto S, Yamada S, Nishikawa Y, et al:
Overexpression of melanoma-associated antigen D4 is an independent
prognostic factor in squamous cell carcinoma of the esophagus. Dis
Esophagus. 28:188–195. 2015. View Article : Google Scholar : PubMed/NCBI
|
|
15
|
Zhang QM, He SJ, Shen N, Luo B, Fan R, Fu
J, Luo GR, Zhou SF, Xiao SW and Xie XX: Overexpression of MAGE-D4
in colorectal cancer is a potentially prognostic biomarker and
immunotherapy target. Int J Clin Exp Pathol. 7:3918–3927.
2014.PubMed/NCBI
|
|
16
|
He SJ, Gu YY, Yu L, Luo B, Fan R, Lin WZ,
Lan XW, Lin YD, Zhang QM, Xiao SW and Xie XX: High expression and
frequently humoral immune response of melanoma-associated antigen
D4 in glioma. Int J Clin Exp Pathol. 7:2350–2360. 2014.PubMed/NCBI
|
|
17
|
Louis DN, Ohgaki H, Wiestler OD, Cavenee
WK, Burger PC, Jouvet A, Scheithauer BW and Kleihues P: The 2007
WHO classification of tumours of the central nervous system. Acta
Neuropathol. 114:97–109. 2007. View Article : Google Scholar : PubMed/NCBI
|
|
18
|
Zhang QM, Shen N, Xie S, Bi SQ, Luo B, Lin
YD, Fu J, Zhou SF, Luo GR, Xie XX and Xiao SW: MAGED4 expression in
glioma and upregulation in glioma cell lines with
5-aza-2′-deoxycytidine treatment. Asian Pac J Cancer Prev.
15:3495–3501. 2014. View Article : Google Scholar : PubMed/NCBI
|
|
19
|
Sasaki M, Nakahira K, Kawano Y, Katakura
H, Yoshimine T, Shimizu K, Kim SU and Ikenaka K: MAGE-E1, a new
member of the melanoma-associated antigen gene family and its
expression in human glioma. Cancer Res. 61:4809–4814.
2001.PubMed/NCBI
|
|
20
|
Parney IF, Hao C and Petruk KC: Glioma
immunology and immunotherapy. Neurosurgery. 46:778–792. 2000.
View Article : Google Scholar : PubMed/NCBI
|
|
21
|
Kimura M: A simple method for estimating
evolutionary rates of base substitutions through comparative
studies of nucleotide sequences. J Mol Evol. 16:111–120. 1980.
View Article : Google Scholar : PubMed/NCBI
|
|
22
|
Ito S, Kawano Y, Katakura H, Takenaka K,
Adachi M, Sasaki M, Shimizu K, Ikenaka K, Wada H and Tanaka F:
Expression of MAGE-D4, a novel MAGE family antigen, is correlated
with tumor-cell proliferation of non-small cell lung cancer. Lung
Cancer. 51:79–88. 2006. View Article : Google Scholar : PubMed/NCBI
|
|
23
|
Thaker PH, Deavers M, Celestino J,
Thornton A, Fletcher MS, Landen CN, Kinch MS, Kiener PA and Sood
AK: EphA2 expression is associated with aggressive features in
ovarian carcinoma. Clin Cancer Res. 10:5145–5150. 2004. View Article : Google Scholar : PubMed/NCBI
|
|
24
|
Rhodes DR, Yu J, Shanker K, Deshpande N,
Varambally R, Ghosh D, Barrette T, Pandey A and Chinnaiyan AM:
ONCOMINE: A cancer microarray database and integrated data-mining
platform. Neoplasia. 6:1–6. 2004. View Article : Google Scholar : PubMed/NCBI
|
|
25
|
Han ZG, Jiang WG, Hiscox S, Hallett MB,
Isoai A and Mansel RE: Inhibition of motility and invasion of human
lung cancer cells by invasion inhibiting factor 2. Surg Oncol.
5:77–84. 1996. View Article : Google Scholar : PubMed/NCBI
|
|
26
|
Zhao W, Zhou Y, Xu H, Cheng Y and Kong B:
Snail family proteins in cervical squamous carcinoma: Expression
and significance. Clin Invest Med. 36:E223–E233. 2013. View Article : Google Scholar : PubMed/NCBI
|
|
27
|
Song X, Zhang W, Zhang Y, Zhang H, Fu Z,
Ye J, Liu L, Song X and Wu Y: Expression of semaphorin 3A and
neuropilin 1 with clinicopathological features and survival in
human tongue cancer. Med Oral Patol Oral Cir Bucal. 17:e962–e968.
2012. View Article : Google Scholar : PubMed/NCBI
|
|
28
|
Liu LK, Jiang XY, Zhou XX, Wang DM, Song
XL and Jiang HB: Upregulation of vimentin and aberrant expression
of E-cadherin/beta-catenin complex in oral squamous cell
carcinomas: Correlation with the clinicopathological features and
patient outcome. Mod Pathol. 23:213–224. 2010. View Article : Google Scholar : PubMed/NCBI
|
|
29
|
Szopa W, Burley TA, Kramer-Marek G and
Kaspera W: Diagnostic and therapeutic biomarkers in glioblastoma:
Current status and future perspectives. Biomed Res Int.
2017:80135752017. View Article : Google Scholar : PubMed/NCBI
|
|
30
|
Cheong SC, Chandramouli GV, Saleh A, Zain
RB, Lau SH, Sivakumaren S, Pathmanathan R, Prime SS, Teo SH, Patel
V and Gutkind JS: Gene expression in human oral squamous cell
carcinoma is influenced by risk factor exposure. Oral Oncol.
45:712–719. 2009. View Article : Google Scholar : PubMed/NCBI
|
|
31
|
Tsai JR, Chong IW, Chen YH, Yang MJ, Sheu
CC, Chang HC, Hwang JJ, Hung JY and Lin SR: Differential expression
profile of MAGE family in non-small-cell lung cancer. Lung Cancer.
56:185–192. 2007. View Article : Google Scholar : PubMed/NCBI
|
|
32
|
Mathieu MG, Linley AJ, Reeder SP, Badoual
C, Tartour E, Rees RC and McArdle SE: HAGE, a cancer/testis antigen
expressed at the protein level in a variety of cancers. Cancer
Immun. 10:22010.PubMed/NCBI
|
|
33
|
Chen G, Gharib TG, Huang CC, Taylor JM,
Misek DE, Kardia SL, Giordano TJ, Iannettoni MD, Orringer MB,
Hanash SM and Beer DG: Discordant protein and mRNA expression in
lung adenocarcinomas. Mol Cell Proteomics. 1:304–313. 2002.
View Article : Google Scholar : PubMed/NCBI
|
|
34
|
Karim AB, Maat B, Hatlevoll R, Menten J,
Rutten EH, Thomas DG, Mascarenhas F, Horiot JC, Parvinen LM, van
Reijn M, et al: A randomized trial on dose-response in radiation
therapy of low-grade cerebral glioma: European Organization for
Research and Treatment of Cancer (EORTC) study 22844. Int J Radiat
Oncol Biol Phys. 36:549–556. 1996. View Article : Google Scholar : PubMed/NCBI
|
|
35
|
Daniels TB, Brown PD, Felten SJ, Wu W,
Buckner JC, Arusell RM, Curran WJ, Abrams RA, Schiff D and Shaw EG:
Validation of EORTC prognostic factors for adults with low-grade
glioma: A report using intergroup 86-72-51. Int J Radiat Oncol Biol
Phys. 81:218–224. 2011. View Article : Google Scholar : PubMed/NCBI
|
|
36
|
Bouvier-Labit C, Chinot O, Ochi C,
Gambarelli D, Dufour H and Figarella-Branger D: Prognostic
significance of Ki67, p53 and epidermal growth factor receptor
immunostaining in human glioblastomas. Neuropathol Appl Neurobiol.
24:381–388. 1998. View Article : Google Scholar : PubMed/NCBI
|