Introduction
Lung cancer is one of the most common cancer types
worldwide, and is the leading cause of cancer-associated mortality
(1). It was reported that ~158,040
Americans were expected to succumb to lung cancer in 2015,
accounting for ~27% of all cancer-associated mortalities (2). Non-small-cell lung cancer (NSCLC)
accounts for ~85% of all lung cancer cases, including squamous cell
carcinoma, adenocarcinoma and large cell carcinoma (3). Treatments include surgery, chemotherapy,
radiation therapy and targeted therapy. Recently, targeted therapy
has demonstrated to be an effective method to treat with lung
cancer (4). To identify a candidate
tumor marker, phage display technology was applied to screen
specific novel peptides in lung cancer cells (5).
Glutathione S-transferases (GSTs) belong to a super
family of phase II detoxification enzymes, which catalyze the
conjugation of glutathione (GSH) to variable environmentally and
endogenously produced electrophonic substances (6). Human cytosolic GSTs are divided into
seven classes abbreviated in Roman capitals A, M, P, S, T, Z and O
(7). In addition to their enzymatic
roles, GSTs have an important ability in inhibiting cell apoptosis,
including in cancer cells.
Evidence has confirmed a high correlation of GSTs
with cancer progression and drug resistance (8–10). It has
been reported that certain GSTs subtypes are overexpressed in
several human tumors and promotes cancer progression (8), while the inhibition of GST activity
significantly induces cellular death (11). In addition to the role of regulating
cancer cell growth, GSTs serve an essential role in tumor drug
resistance. For example, knockdown of GSTO1 expression was
demonstrated to abrogate carboplatin-induced breast cancer stem
cell enrichment, and decrease tumor recurrence and metastatic
capacity (12). In addition, GSTP1
blocks As2O3-induced apoptosis in lymphoma
cells by decreasing the intracellular amounts of
H2O2. GSTA1 is abundantly expressed in A549
cells, located in the cytoplasm and/or membranes (13). Furthermore, its expression is
associated with an increased risk in colorectal, breast and gastric
cancer (14–16). The alpha class, GSTA1-A5 are not only
expressed in normal human tissues, but also in human cancer
(17). GSTA1, GSTA2 and GSTA4 are
widely expressed in human tissues. The genetic polymorphism of
GSTA1 is characterized by two alleles, GSTA1*A and GSTA1*B
(17). However, the roles of GSTA1 in
NSCLC cells remain to be elucidated. We hypothesize that
downregulation of GSTA1 serves a functional role in inhibiting
proliferation and inducing apoptosis in the A549 cell line.
Materials and methods
Chemicals and cell culture
LPP-Z3392-Lv105-400 (lentiviral particles for
GSTA1), LPP-e green fluorescent protein (GFP)-Lv105-100 (lentiviral
particles for eGFP), LP-HSH008475-5-LvRH1GP-200 [lentiviral
particles for small interfering RNA, (si-RNA)] and
LP-CSHCTR001-LVRH1GP-050 (lentiviral particles for scramble
control) were prepared by GeneCopoeia, Inc. (Rockville, MD, USA).
The human lung adenocarcinoma cell line A549 was purchased from
Shanghai Institute of Cellular Biology of Chinese Academy of
Sciences (Shanghai, China). Cells were maintained in RPMI-1640
medium supplemented with 10% fetal bovine serum and 0.1%
penicillin/streptomycin (all from Gibco; Thermo Fisher Scientific,
Inc., Waltham, MA, USA) in a humidified atmosphere with 5%
CO2 at 37°C.
Animals and xenograft experiments
A total of 24 healthy BALB/c nude mice (half male
and female; aged ~3 weeks; weight 17~20 g) were purchased from
Guangdong Medical Experimental Center (Guangzhou, China). Mice were
maintained under specific pathogen-free conditions at a temperature
of 20–25°C with humidity of 40–70%. They were fed in groups, and
had free access to water and food. The mice were randomly divided
into four groups: GSTA1, vector (lentiviral particles for eGFP),
si-control (scramble control) and si-GSTA1 groups with six
mice/group. To establish the above four groups of animal A549 tumor
models, each nude mouse was injected with 4×10⁵ A549
cells (transfected with GSTA1, vector, si-control and si-GSTA1
respectively) into the right flank. Tumor size was measured using a
caliper four times/week. Tumor volumes were calculated by the
following formula: 0.5× largest diameter (mm) × smallest
diameter2 (mm). Mice were sacrificed and xenograft
tumors were removed en bloc following 3 weeks. All xenograft
experiments were performed under a protocol approved by the Animal
Care and Use Committee. All animal experiments were approved by the
Animal Care Committee of Guangdong Pharmaceutical University
(Guangzhou, China).
Western blot analysis
Total protein was extracted from the tumor tissues
of the four groups or cells cultured in six-well plates. The tumor
tissues were ground and lysed in radioimmunoprecipitation assay
lysis buffer (#P0013B, Beyotime Institute of Biotechnology, Haimen,
China) containing 50 mM Tris-HCl (pH 7.4), 150 mM NaCl, 2 mM EDTA,
1% Triton X-100, 1% sodium deoxycholate, 1 µg/ml leupeptin and 0.1%
SDS on ice, and then centrifuged at 12,000 × g, 4°C for 20 min to
obtain the total protein supernatants. The protein concentration of
each extract was measured using a BCA Protein assay kit (Thermo
Fisher Scientific, Inc.). A total of 40 µg protein per lane was
loaded and separated via 12% SDS-PAGE, and then transferred onto
polyvinylidene difluoride membranes (EMD Millipore, Billerica, MA,
USA). The membranes were blocked with 5% (w/v) non-fat milk powder
in Tris buffered saline with Tween-20 (TBS-T) pH 7.6 solution at
room temperature for 1 h. Membranes were then incubated with the
primary antibodies goat anti-GSTA1 (#ab53940; 1:3,000 dilution;
Abcam, Cambridge, UK) or mouse anti-β-actin (#ab8226; 1:3,000
dilution; Abcam) overnight at 4°C. The membrane was washed with
TBS-T buffer three times and incubated with horseradish
peroxidase-conjugated polyclonal donkey anti-goat IgG (#ab97110;
1:5,000 dilution; Abcam) or goat anti-mouse IgG (#ab136815; 1:5,000
dilution; Abcam) at room temperature for 1 h. After washing with
TBS-T buffer three times, the membranes were visualized after
incubation SuperSignal™ West Pico PLUS Chemiluminescent
Substrate (#34580, Thermo Fisher Scientific, Inc.). β-actin was
used as loading control. The gray value was analyzed by using
ImageJ software (version 1.46; National Institutes of Health,
Bethesda, MD, USA).
Reverse transcription-quantitative
polymerase chain reaction (RT-qPCR) assay
Total RNA from the tumor lysates or cells was
extracted with TRIzol solution (Life Technologies; Thermo Fisher
Scientific, Inc.) following the manufacturer's protocol. cDNA was
synthesized using the PrimeScript™ II First Strand cDNA
Synthesis kit according to the manufacturer's protocol using 1 µg
of total RNA with the Bio-Rad Reverse Transcription system. The
temperature protocol was as follows: 42°C for 2 min, then at 37°C
for 15 min and 85°C for 5 sec. The RT-qPCR assay was run in a 25 µl
reaction system containing 12.5 µl X2 PCR Master mix, 1 µl forward
and reverse primer each, 2 µl cDNA and 8.5 µl nuclease-free water
on a CFX96™ Real-Time PCR Detection system with
SYBR® Premix Ex Taq™ II (Takara Bio, Inc.,
Otsu, Japan). The primers were synthesized according to the
designed sequence by Shanghai Shenggong Biology Engineering
Technology Service, Ltd. (Shanghai, China) and were used for qPCR:
GSTA1 forward, 5′-GCCTCCATGACTGCGTTATT-3′ and reverse,
5′-CCTGCCCACAGTGAAGAAGT-3′; GAPDH forward,
5′-AACGGATTTGGTCGTATTGGG-3′ and reverse
5′-CCTGGAAGATGGTGATGGGAT-3′. qPCR was performed under the following
conditions: 95°C for 30 sec; 40 cycles of 95°C for 5 sec, 60°C for
30 sec; 95°C for 5 sec, 60°C for 1 min; 50°C for 30 sec. GAPDH
served as a reference gene. The relative quantity of mRNA
expression was calculated by using the 2−ΔΔCt method
(18). All experiments were performed
in triplicate.
Cell growth assay in vitro
A549 cells were seeded at a density of
5×10³ cells/well in 96-well flat bottom plates. A total
of 4 µl of 1 ×10⁸ TU/ml lentivirus particles (GSTA1,
vector, si-control and si-GSTA1) were serially diluted to
4×10⁶ TU/ml by serum free OptiMEM medium (Gibco; Thermo
Fisher Scientific, Inc.) containing 5 µg/ml Polybrene (Santa Cruz
Biotechnology, Inc., Dallas, TX, USA). When the cells reached
30–50% confluence, they were transfected with the aforementioned
lentivirus particles using 2 µg/ml puromycin (Santa Cruz
Biotechnology, Inc., Dallas, TX, USA) for screening stable cell
lines. The cells were cultured for 5 days. During this time, 20 µl
MTT solution (Sigma-Aldrich; Merck KGaA, Darmstadt, Germany) in PBS
(5 mg/ml) were added to each well at 1-day interval for 4 h at
37°C, then, 200 µl DMSO was added after removing the supernatants.
The absorbance of each well was measured with a microplate reader
at 570 nm. All experiments were performed in triplicate.
Lentivirus-meditated GSTA1 overexpression and
si-GSTA1 in A549 cell models. The aforementioned lentiviral
particles (1×10⁸ TU/ml) were diluted and added
(multiplicity of infection: 40, 20, 10, 5) to transfect A549 cells
for 24 h. The supernatants containing lentivirus were replaced with
OptiMEM medium, and the cells were cultured for an additional 48 h.
Successful infection was detected by the presence of green
fluorescence in cells due to GFP as observed under an inversed
fluorescence microscope (×100).
Cell morphological assay
The si-GSTA1 and si-control A549 cells were seeded
in 12-well plates at a density of 1×10⁵ cells/well, and
then cultured for up to 5 days. Following treatment, the cells were
fixed with 4% formaldehyde for 30 min at room temperature, exposed
to Hoechst 33258 (15 µM) for 30 min at room temperature, then
observed and imaged using an inverted fluorescence microscope
(×100).
Flow cytometric analysis
The si-GSTA1 and si-control A549 cells were cultured
in 6-well plates at a density of 5×10⁵ cells/well for 5
days. The cells were collected every day, washed twice with
ice-cold PBS and resuspended in binding buffer (cat. no. KGA106;
Nanjing KeyGen Biotech, Nanjing, China) containing PBS (pH 7.4), 1%
fetal bovine serum and 0.1% NaN3 at a concentration of
1×10⁶ cells/ml. Then, 5 µl of Annexin V-fluorescein
isothiocyanate and 5 µl of propidium iodide were added. The cells
were cultured for 15 min at room temperature in the dark, after
which apoptotic cells were quantified using flow cytometry
(FACSCalibur/Calibur; BD Biosciences, Franklin Lakes, NJ, USA). All
experiments were performed in triplicate.
Statistical analysis
Data are presented as the mean + standard deviation.
Statistical analysis was performed using SPSS software (version
17.0; SPSS, Inc., Chicago, IL, USA). One-way analysis of variance
followed by Tukey's post-hoc test was used for multiple comparisons
and the paired Student's t-test was applied when only two groups
were compared. P<0.05 and P<0.01 were considered to indicate
statistically significant difference.
Results
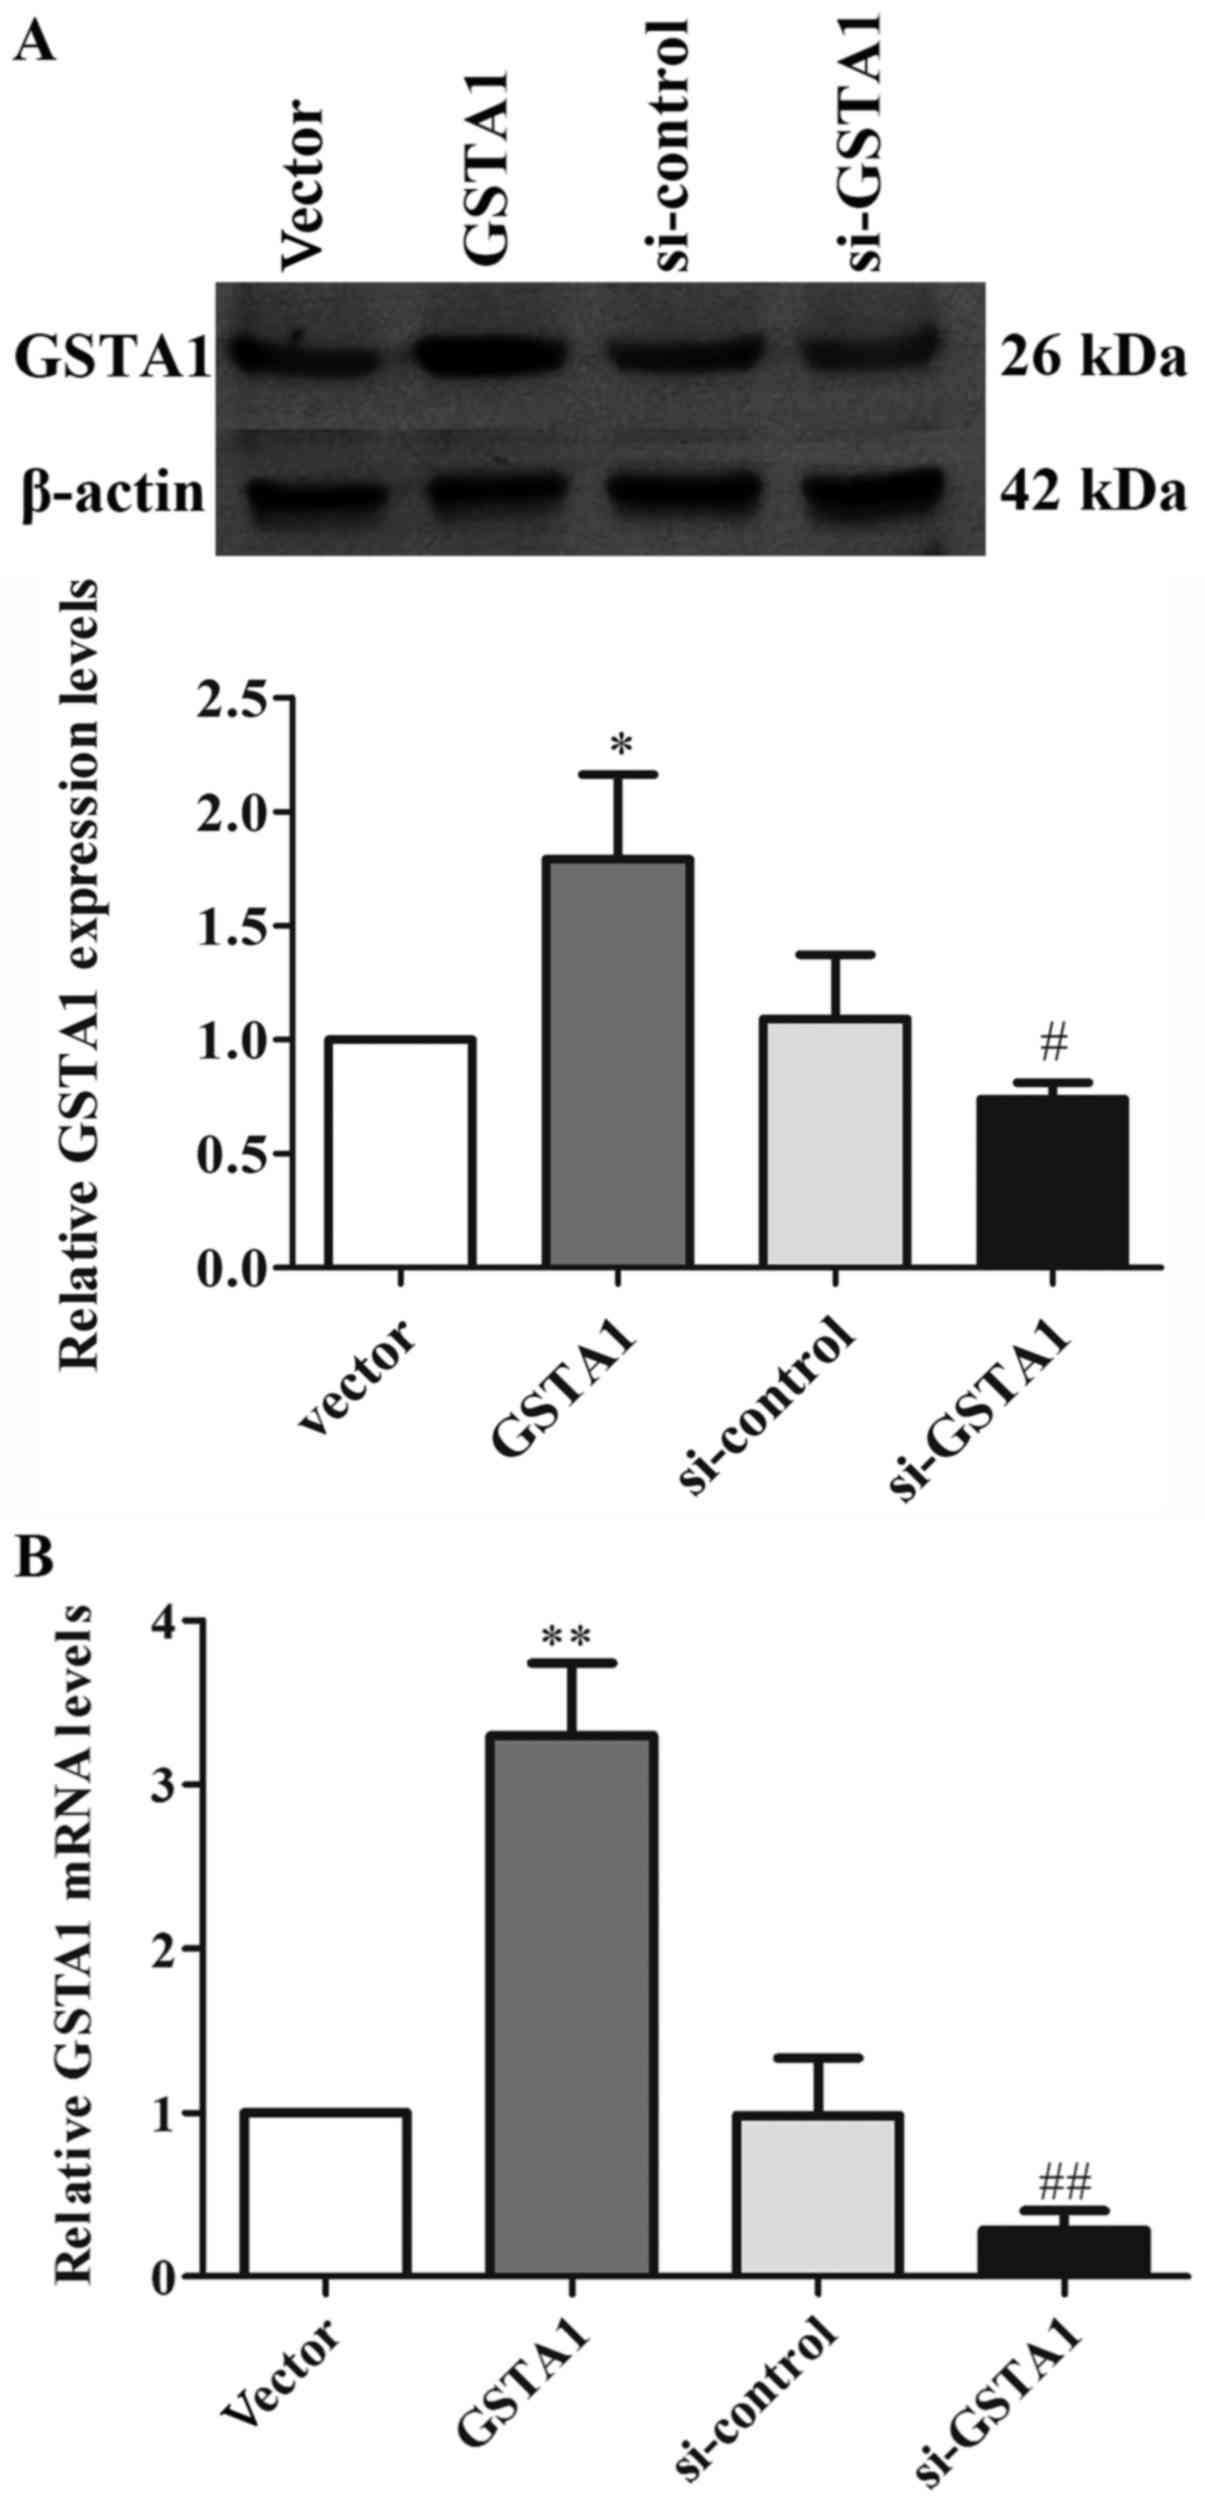
Expression of GSTA1 in each group in
vitro
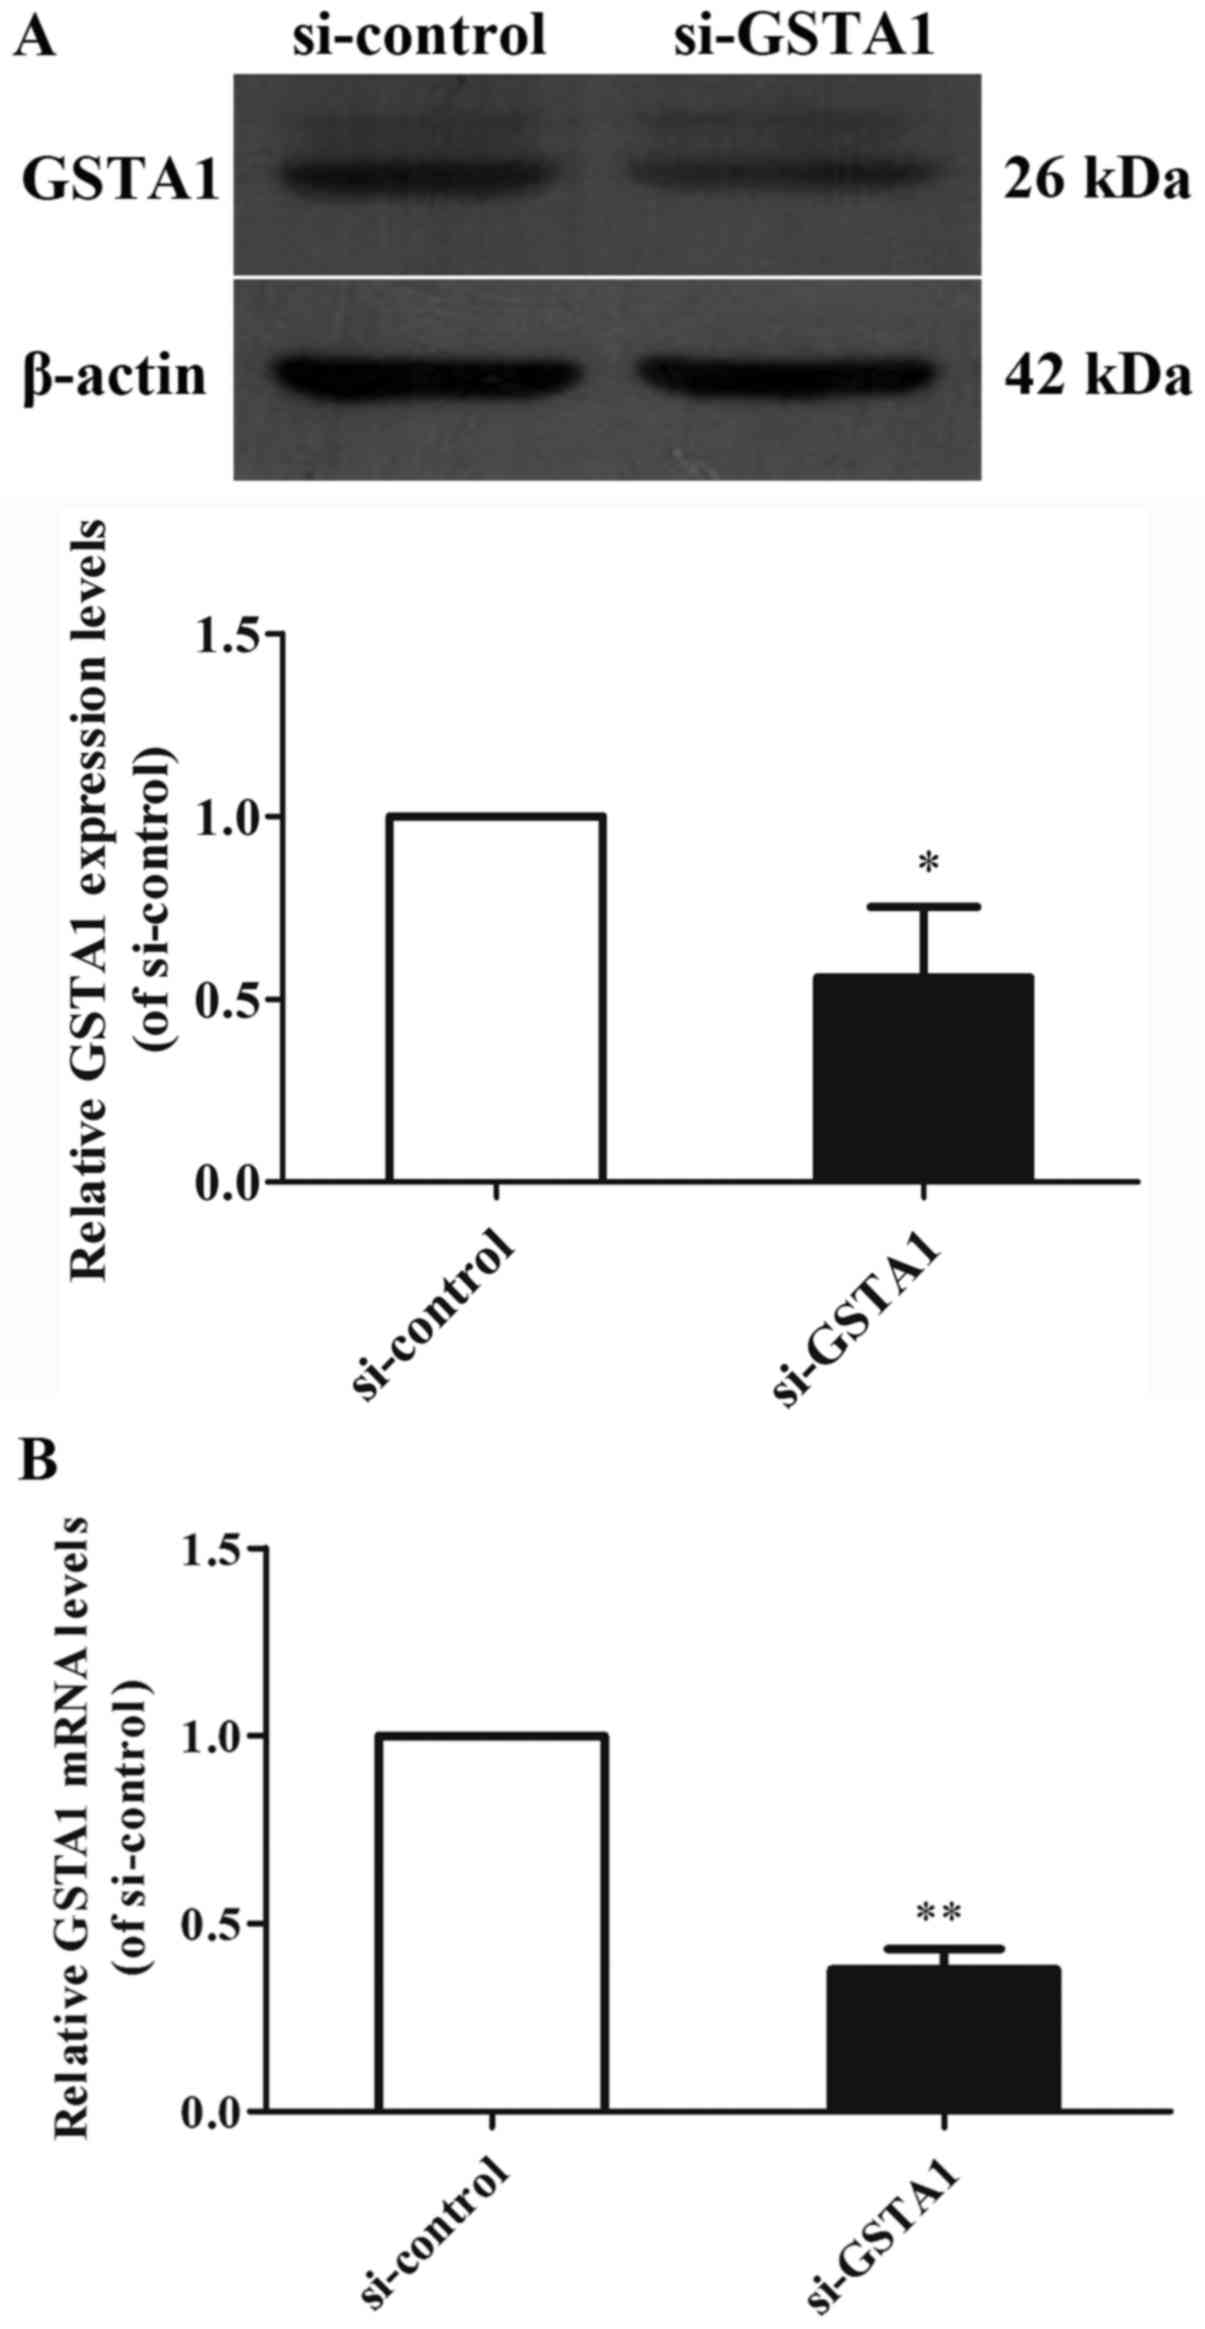
GSTA1 protein and mRNA expression levels were
investigated using western blot analysis, and RT-qPCR in cell
samples from the GSTA1 and vector groups (Figs. 1 and 2).
Si-GSTA1 protein expression (0.56-fold lower) was significantly
suppressed compared with the si-control group (Fig. 1A; P<0.01). The data demonstrated
that the relative mRNA levels in the si-GSTA1 group were 0.38-fold
significantly lower compared with that of the si-control
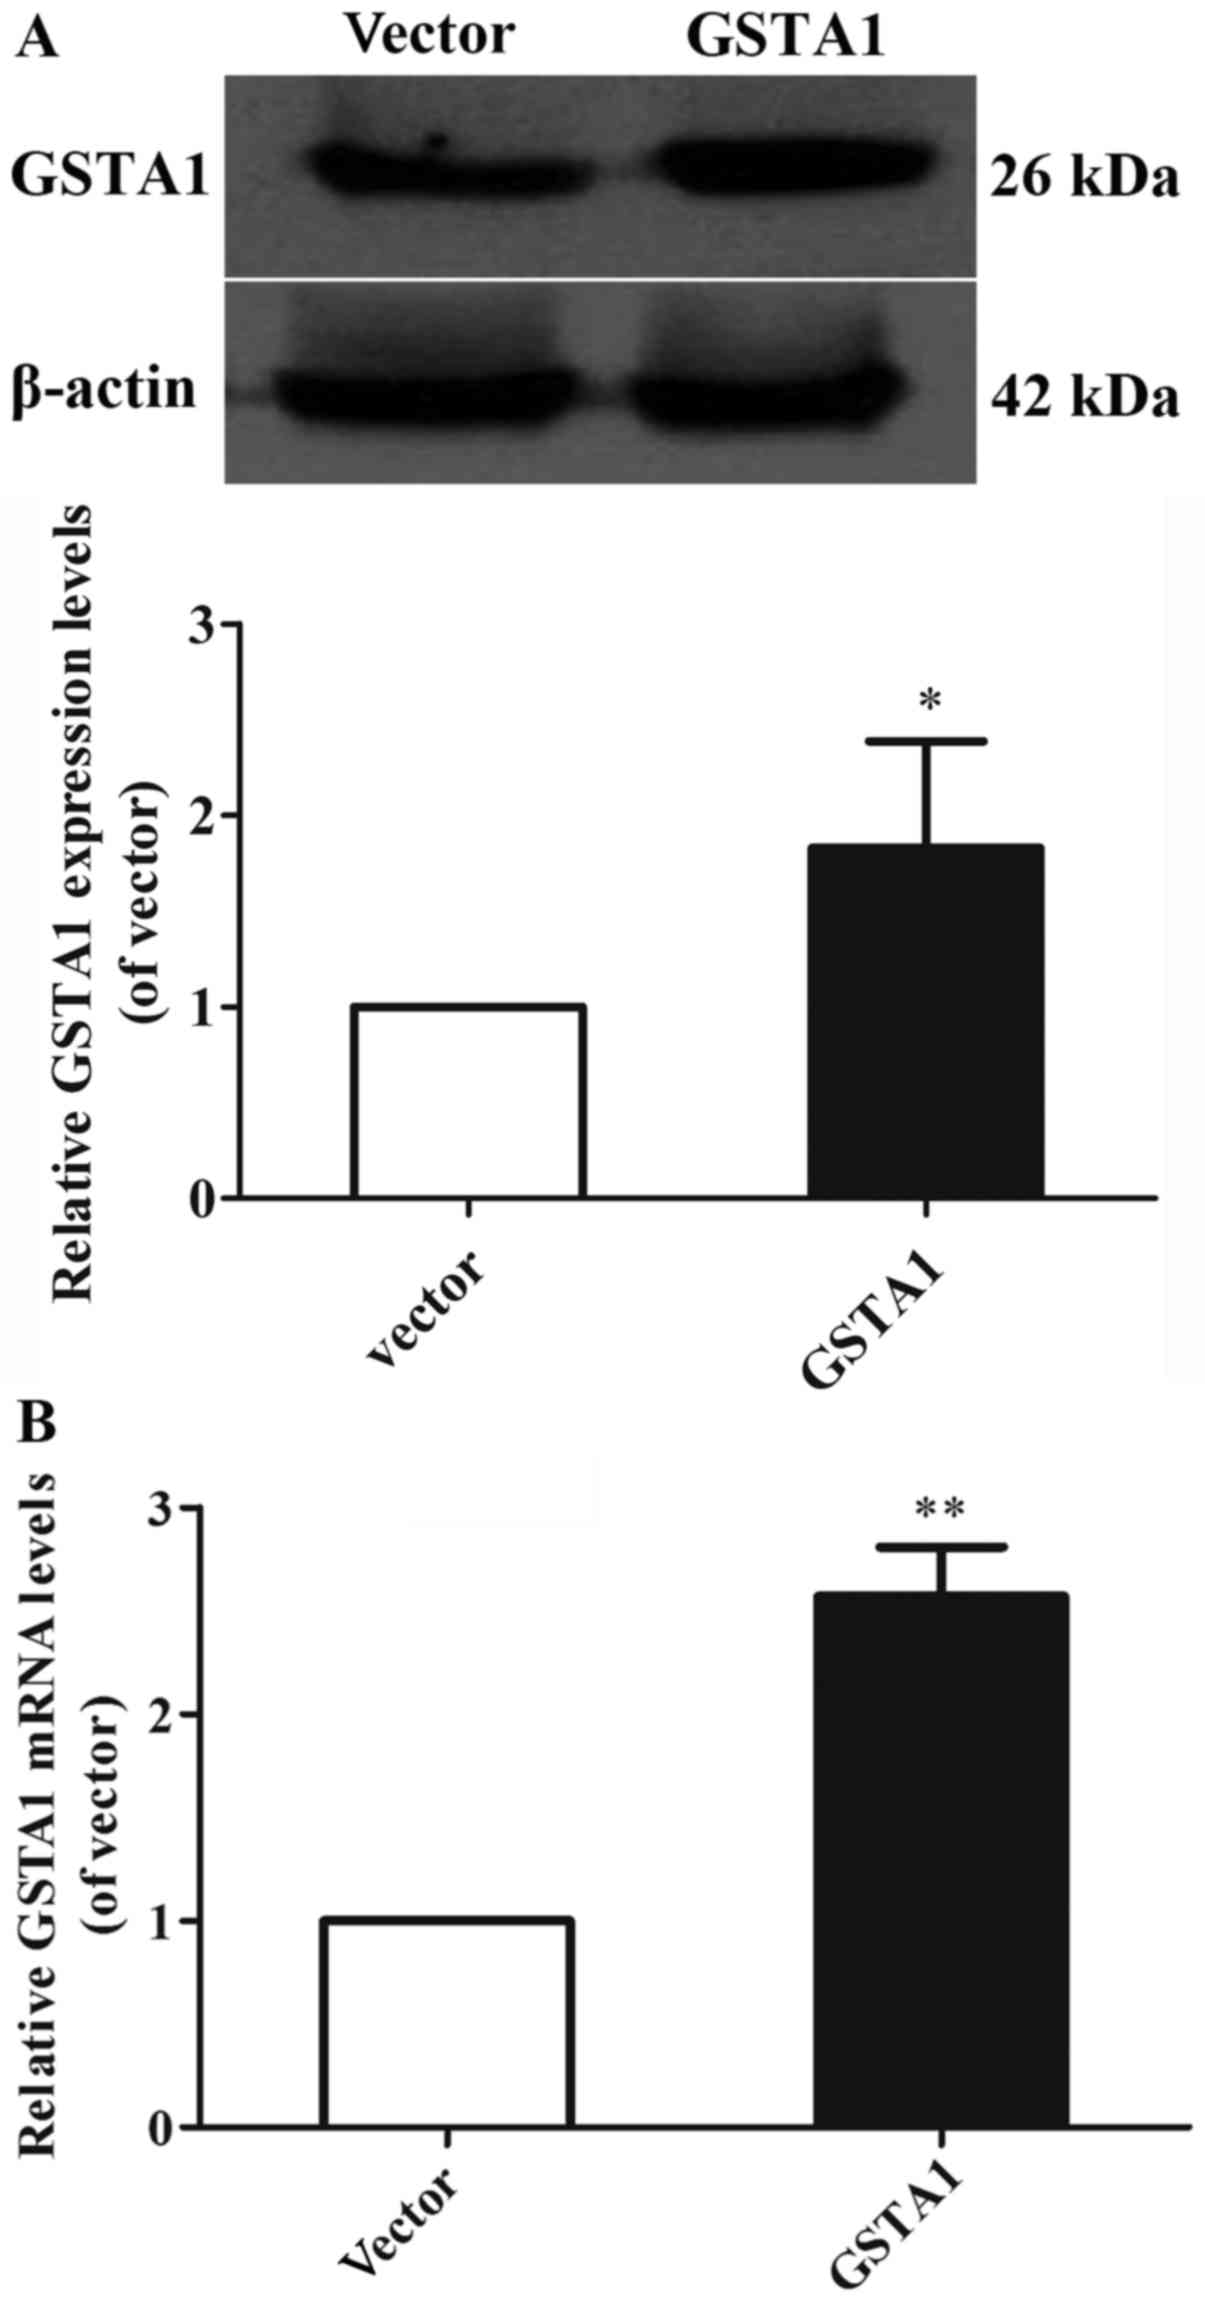
(P<0.01; Fig. 1B). In addition,
the GSTA1 protein levels in the GSTA1 overexpression group were
1.83-fold higher compared with that of the vector group (P<0.05;
Fig. 2A). Likewise, the GSTA1 mRNA
expression in the GSTA1 overexpression group was 2.57-fold higher
compared with that of the vector group (P<0.01; Fig. 2B). These results implied that the
si-GSTA1 and GSTA1 overexpression cell models were successfully
established.
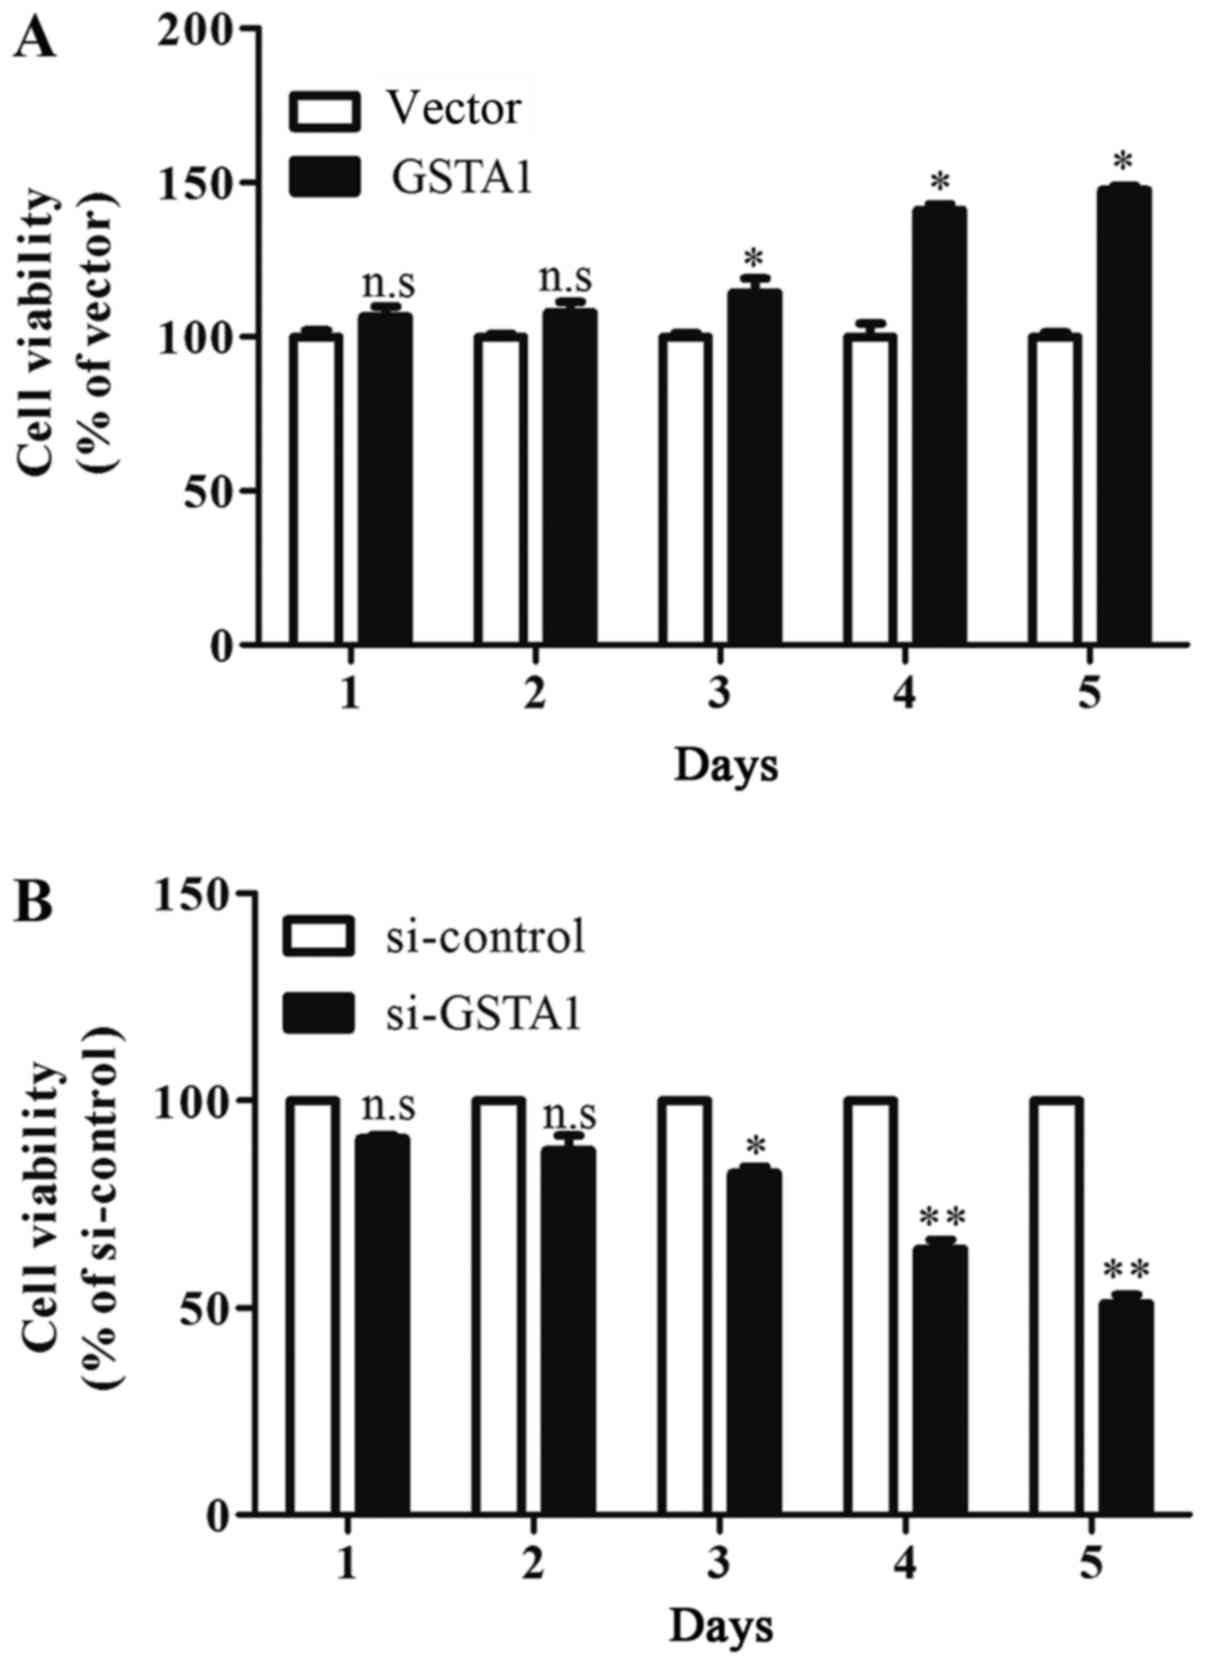
Downregulation of GSTA1 inhibits cell
proliferation and induces cell apoptosis in vitro
The results of the MTT assay indicated that cell
viability in the GSTA1 group after culturing for 3 days were
significantly improved when compared with the vector group
(P<0.05; Fig. 3A). In addition,
si-GSTA1 transfection resulted in significantly decreased cell
viability compared with the si-control following 3 days of culture
(Fig. 3B; P<0.05). Hoechst 33258
staining was used to observe the morphological changes in the cell
nuclei. As shown in Fig. 4, the cell
florescence of A549 cells transfected with si-GSTA1 was relatively
brighter compared with the si-control groups. When compared with
si-control A549 cells, the cell amounts of si-GSTA1 were few. In
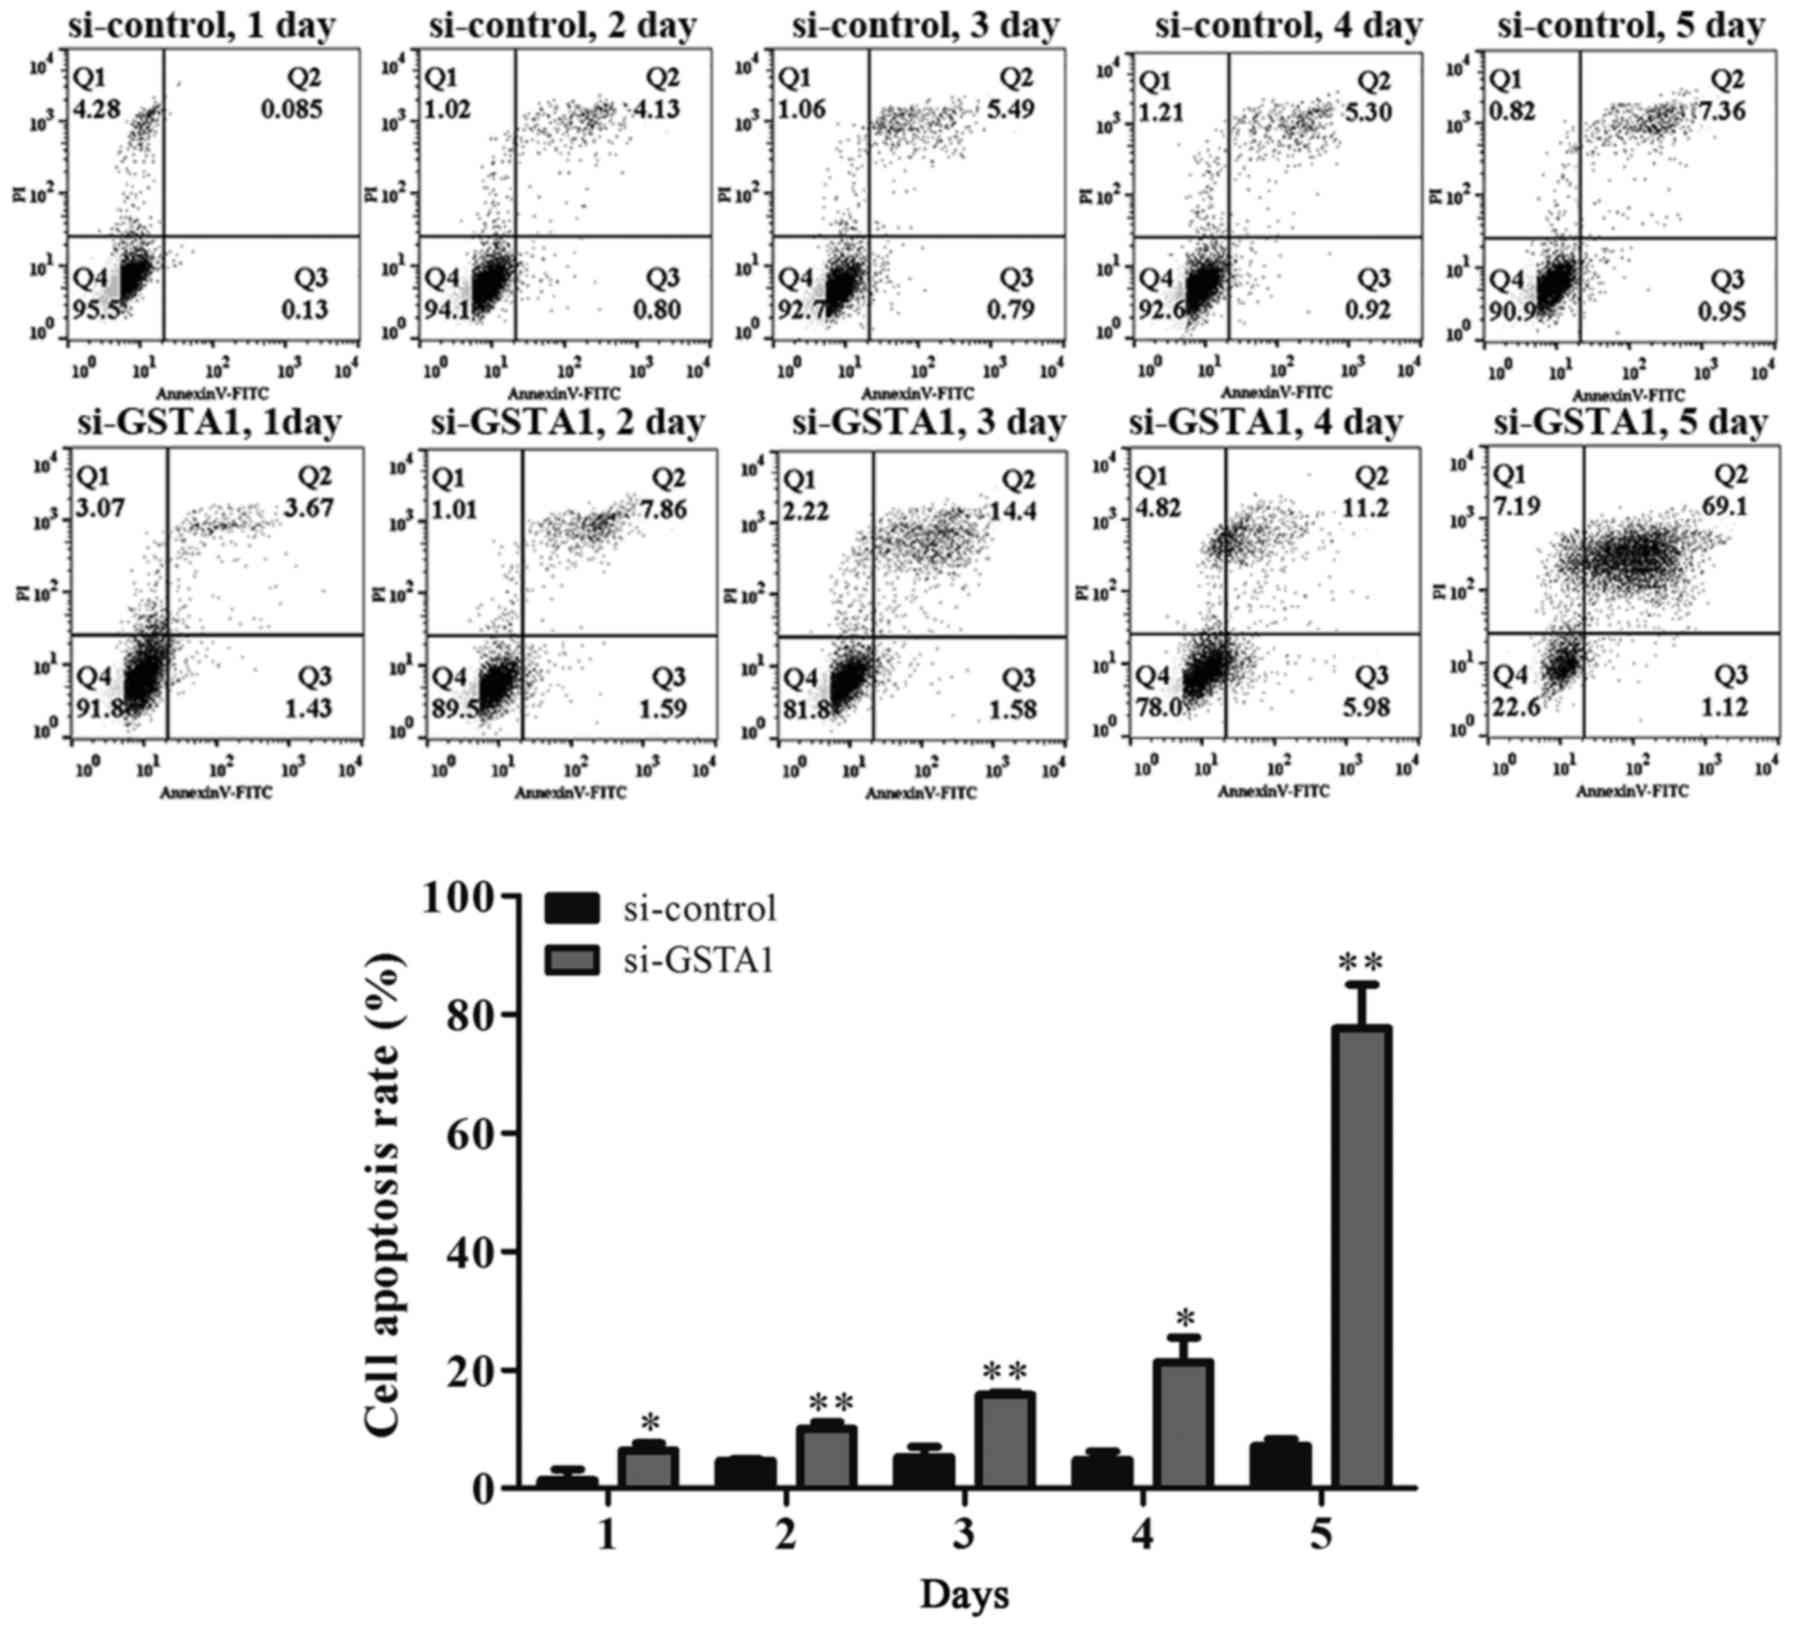
order to further confirm that the cell death induced by si-GSTA1
was apoptosis, AnnexinV-FITC/PI staining was used to detect early
apoptosis cells and middle-late apoptotic cells (19). A time-dependent increase in apoptotic
cells was observed from 6.42 on day 1 to 10.06, 15.8, 21.3 and
77.61% in si-GSTA1 A549 cells cultured for 5 days compared with the
control counterparts, which saw an increase from 1.38 on day 1 to
4.63, 5.30, 4.84 and 7.22% (Fig. 5).
These results demonstrated that the downregulation of GSTA1 in A549
cell lines is able to suppress cell proliferation and induce cell
apoptosis in vitro.
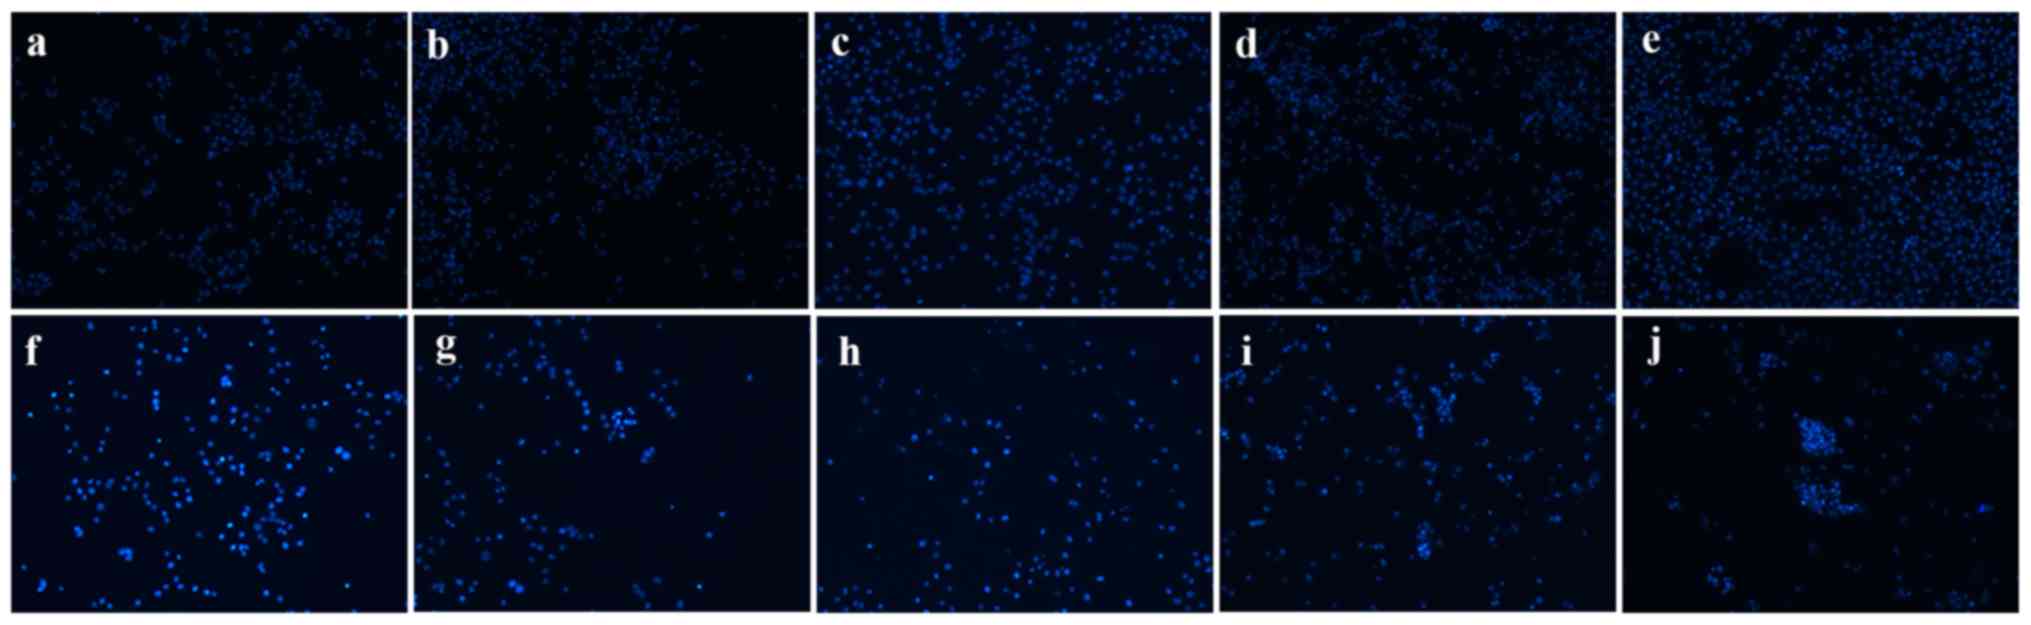 | Figure 4.Morphological changes of si-GSTA1 and
si-control A549 cells. Apoptotic nuclei manifested condensed or
fragmented DNA brightly stained by Hoechst 33258 (magnification,
×100). (a-e) Si-control A549 cells cultured for 1, 2, 3, 4 and 5
days, respectively. (f-j) Si-GSTA1 A549 cells cultured for 1, 2, 3,
4 and 5 days, respectively. GSTA1, glutathione S-transferase A1;
si, small interfering RNA. |
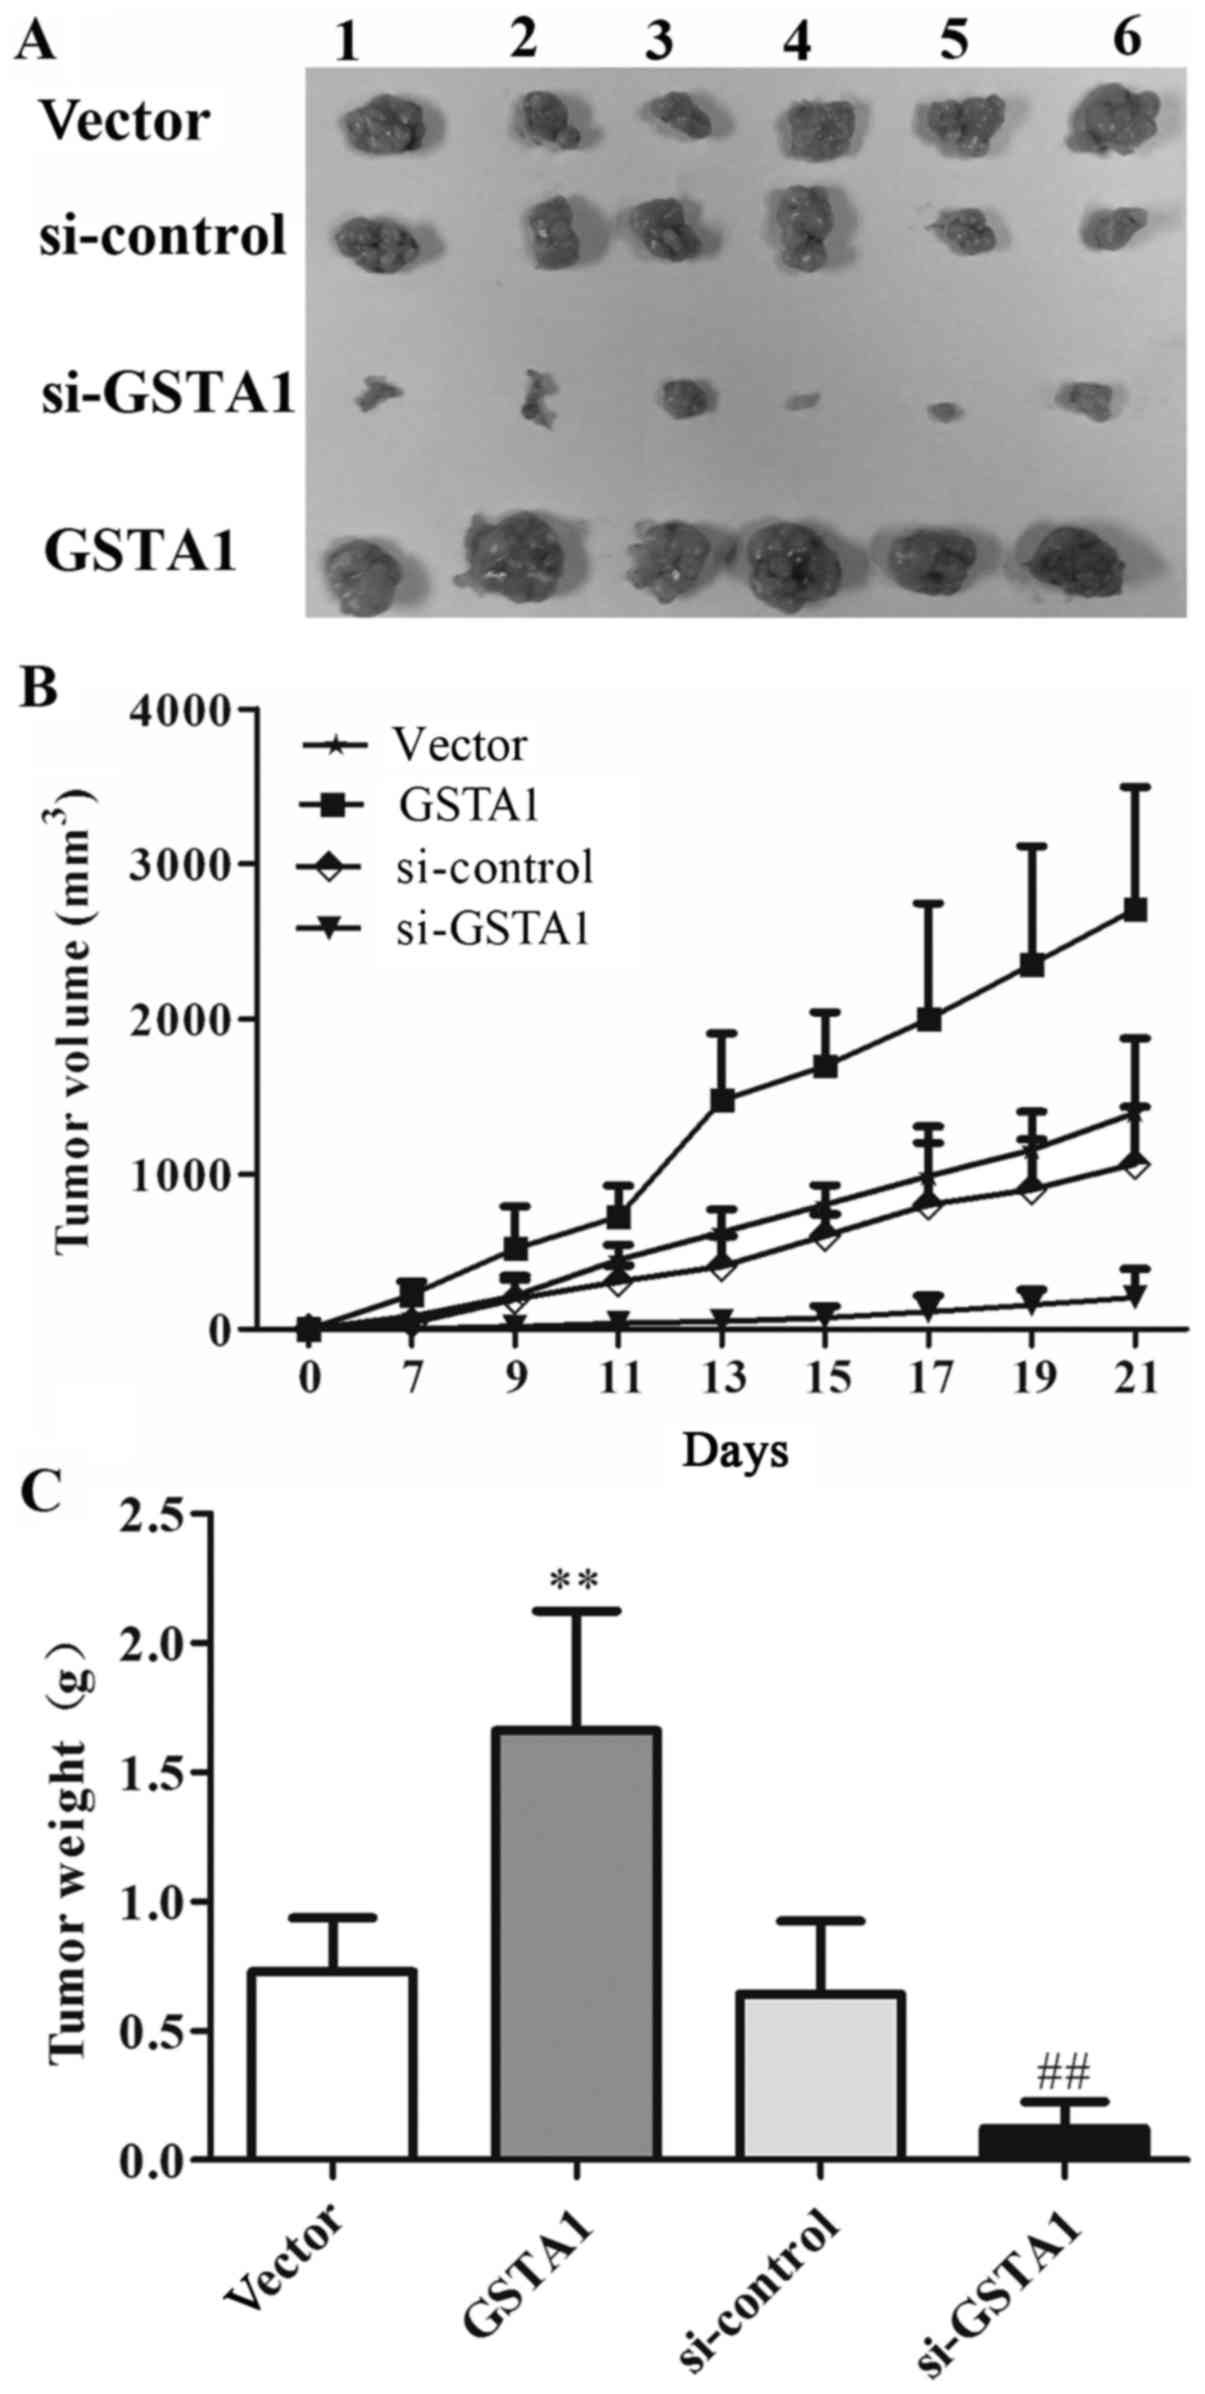
GSTA1 induces tumor growth in
xenograft models
Based on the aforementioned results in vitro,
the potential effect of GSTA1 in vivo in A549 cell
xenografts was explored (Fig. 6A). As
shown in Fig. 6B, the tumor volume in
the GSTA1 group was 2,709.27 mm3, whereas that of the
vector group was 1,395.43 mm3 after 21 days. The tumor
volume in the si-GSTA1 group was 204.12 mm3 compared
with that of the si-control group (1,066.07 mm3).
Furthermore, as shown in Fig. 6C, the
tumor weight in vector, GSTA1, si-control and si-GSTA1 groups were
0.73, 1.66, 0.64, and 0.12 g, respectively. These results indicated
that GSTA1 significantly induced tumor growth compared with the
vector control, while si-GSTA1 significantly inhibited tumor growth
compared with the si-control (Fig.
6).
GSTA1 protein and mRNA expression of
tumors in each group
In order to further verify the role of GSTA1 in lung
cancer cell growth in vivo, western blotting and RT-qPCR
were used to analyze the expression of GSTA1. The gray values of
GSTA1/β-actin in the vector, GSTA1 overexpression, si-control and
si-GSTA1 groups were 0.50, 1.28, 0.52, and 0.38, respectively
(Fig. 7A). As shown in Fig. 7B, the relative GSTA1 mRNA levels of
the four tumor groups were 1.00, 3.30, 0.98 and 0.28, which
demonstrated that tumor growth may have a significant association
with the expression of GSTA1.
Discussion
To evaluate the function of GSTA1 in lung cancer
cells, GSTA1 knockdown and overexpression was established in the
A549 cell line. Western blot analysis and RT-qPCR analysis revealed
significantly high expression levels of GSTA1 protein and mRNA in
GSTA1 A549 cells compared with that of the vector control.
Likewise, the protein and mRNA expression levels of
si-GSTA1-transfected A549 cells were significantly lower compared
with that of the si-control. According to the cell viability assay,
it was evident that GSTA1 overexpression promoted cell
proliferation and si-GSTA1 suppressed cell growth in vitro,
and in vivo. In addition, the downregulation of GSTA1 in
A549 cells significantly induced cell apoptosis in vitro. To
the best of our knowledge, little has been reported regarding the
biofunctional role of GSTA1 on cell proliferation and apoptosis in
lung cancer cells. In the study of Adnan et al (19), siRNA-mediated downregulation of GSTA1
significantly increased cell proliferation and did not alter sodium
butyrate-induced apoptosis in Caco-2 cells (19), which are different to the results of
the present study. This discrepancy may be due to the heterogeneity
of cancer, which may lead to the polymorphisms of GSTA1 in
different cancer cell types. It is a normal phenomenon that one
gene serves opposite roles in different tumor types. Previously,
the polymorphisms of GSTM1 and GSTT1 were identified to be
associated with lung cancer risk: Liu et al (20) demonstrated that the GSTM1 null
genotype exhibited a significant association between squamous
carcinoma (SC), adenocarcinoma (AC) and small cell lung carcinoma,
and an association between the GSTT1 null genotype in SC and AC.
Several studies have investigated the association between GSTA1
polymorphisms, and colorectal, prostate, breast and bladder cancer
(21–24). Deng et al (17) reported that the GSTA1 BB genotype was
associated with an increased cancer risk, particularly for
colorectal cancer in Caucasians. The present results suggest that
GSTA1 is important in tumor growth, and that the downregulation of
GSTA1 suppresses proliferation and induces apoptosis in A549 cells.
However, the potential underlying mechanisms of GSTA1 in lung
cancer require confirmation. It may involve the binding of GSTA1 to
certain cellular proteins that serve prominent roles in the
regulation of the stress response, cell proliferation and
apoptosis.
To date, the best-characterized GST-interacting
protein is JUN N-terminal kinase (JNK1), which is a member of a
large family of Ser/Thr kinases known as the mitogen-activated
protein kinase family (25). JNKs
serve an important role in the response to various stress stimuli,
and regulate the activities of several target proteins involved in
a variety of biological processes, including apoptosis, cell cycle
regulation and proliferation (26).
Yang et al (27) reported that
overexpression of GSTA2 reduced the activation of JNK in K562 cells
and attenuated H2O2-induced apoptosis.
Furthermore, overexpression of hGSTA1 reduced JNK activation, c-jun
phosphorylation and the cytotoxic effects of
H2O2, interleukin-1β, and ultraviolet
irradiation (28). Taken together,
these studies indicate the pivotal role GSTA may act as one of the
determinants of the differential activation of JNK. On the basis of
the present results, the effects of si-GSTA1 and si-control on JNK
phosphorylation, and expression in A549 cells should be
investigated.
In conclusion, to the best of our knowledge, the
present study demonstrated for the first time that GSTA1
overexpression acts as a tumor promoter in vivo, and
si-GSTA1 is able to suppress proliferation and induce apoptosis of
A549 cells in vitro. The results suggested that checking the
expression of GSTA1 in clinical tests may be useful for diagnosis
of lung cancer. Furthermore, GSTA1 may be used as a target molecule
for developing anti-NSCLC drugs.
Acknowledgements
Not applicable.
Funding
The present study was supported by grants from the
National Natural Science Foundation of China (grant no.
81102465).
Availability of data and materials
The datasets used and/or analyzed during the current
study are available from the corresponding author on reasonable
request.
Authors' contributions
XDP and ZPY designed the study. LQZ, GXW and SZ
performed experiments. GFJ, HL and ZCY analyzed the data. HL wrote
the manuscript.
Ethics approval and consent to
participate
All animal experiments were approved by the Animal
Care Committee of Guangdong Pharmaceutical University.
Consent for publication
Not applicable.
Competing interests
The authors declare that they have no competing
interests.
References
|
1
|
Ferlay J, Soerjomataram I, Dikshit R, Eser
S, Mathers C, Rebelo M, Parkin DM, Forman D and Bray F: Cancer
incidence and mortality worldwide: Sources, methods and major
patterns in GLOBOCAN 2012. Int J Cancer. 136:E359–E386. 2015.
View Article : Google Scholar : PubMed/NCBI
|
|
2
|
Siegel RL, Miller KD and Jemal A: Cancer
statistics, 2016. CA Cancer J Clin. 66:7–30. 2016. View Article : Google Scholar : PubMed/NCBI
|
|
3
|
Sher T, Dy GK and Adjei AA: Small cell
lung cancer. Mayo Clin Proc. 83:355–367. 2008. View Article : Google Scholar : PubMed/NCBI
|
|
4
|
Zappa C and Mousa SA: Non-small cell lung
cancer: Current treatment and future advances. Transl Lung Cancer
Res. 5:288–300. 2016. View Article : Google Scholar : PubMed/NCBI
|
|
5
|
Zang L, Shi L, Guo J, Pan Q, Wu W, Pan X
and Wang J: Screening and identification of a peptide specifically
targeted to NCI-H1299 from a phage display peptide library. Cancer
Lett. 281:64–70. 2009. View Article : Google Scholar : PubMed/NCBI
|
|
6
|
Singh S: Cytoprotective and regulatory
functions of glutathione S-transferases in cancer cell
proliferation and cell death. Cancer Chemother Pharmacol. 75:1–15.
2015. View Article : Google Scholar : PubMed/NCBI
|
|
7
|
Board PG and Menon D: Glutathione
transferases, regulators of cellular metabolism and physiology.
Biochim Biophys Acta. 1830:3267–3288. 2013. View Article : Google Scholar : PubMed/NCBI
|
|
8
|
Townsend DM and Tew KD: The role of
glutathione-S-transferase in anti-cancer drug resistance. Oncogene.
22:7369–7375. 2003. View Article : Google Scholar : PubMed/NCBI
|
|
9
|
Housman G, Byler S, Heerboth S, Lapinska
K, Longacre M, Snyder N and Sarkar S: Drug resistance in cancer: An
overview. Cancers (Basel). 6:1769–1792. 2014. View Article : Google Scholar : PubMed/NCBI
|
|
10
|
Searchfield L, Price SA, Betton G, Jasani
B, Riccardi D and Griffiths DF: Glutathione S-transferases as
molecular markers of tumour progression and prognosis in renal cell
carcinoma. Histopathology. 58:180–190. 2011. View Article : Google Scholar : PubMed/NCBI
|
|
11
|
Zhuo R, Kosak KM, Sankar S, Wiles ET, Sun
Y, Zhang J, Ayello J, Prestwich GD, Shami PJ, Cairo MS, et al:
Targeting Glutathione S-transferase M4 in Ewing sarcoma. Front
Pediatr. 2:832014. View Article : Google Scholar : PubMed/NCBI
|
|
12
|
Lu H, Chen I, Shimoda LA, Park Y, Zhang C,
Tran L, Zhang H and Semenza GL: Chemotherapy-Induced Ca2+ release
stimulates breast cancer stem cell enrichment. Cell Rep.
18:1946–1957. 2017. View Article : Google Scholar : PubMed/NCBI
|
|
13
|
Pan XD, Yang ZP, Tang QL, Peng T, Zhang
ZB, Zhou SG, Wang GX, He B and Zang LQ: Expression and function of
GSTA1 in lung cancer cells. Asian Pac J Cancer Prev. 15:8631–8635.
2014. View Article : Google Scholar : PubMed/NCBI
|
|
14
|
Cordoba EE, Abba MC, Lacunza E, Fernande E
and Guerci AM: Polymorphic variants in oxidative stress genes and
acute toxicity in breast cancer patients receiving radiotherapy.
Cancer Res Treat. 48:948–954. 2016. View Article : Google Scholar : PubMed/NCBI
|
|
15
|
Eichholzer M, Rohrmann S, Barbir A,
Hermann S, Teucher B, Kaaks R and Linseisen J: Polymorphisms in
heterocyclic aromatic amines metabolism-related genes are
associated with colorectal adenoma risk. Int J Mol Epidemiol Genet.
3:96–106. 2012.PubMed/NCBI
|
|
16
|
Nguyen TV, Janssen MJ, van Oijen MG,
Bergevoet SM, te Morsche RH, van Asten H, Laheij RJ, Peters WH and
Jansent JB: Genetic polymorphisms in GSTA1, GSTP1, GSTT1, and GSTM1
and gastric cancer risk in a Vietnamese population. Oncol Res.
18:349–355. 2010. View Article : Google Scholar : PubMed/NCBI
|
|
17
|
Deng Q, He B, Pan Y, Sun H, Liu X, Chen J,
Ying H, Lin K, Peng H and Wang S: Polymorphisms of GSTA1 contribute
to elevated cancer risk: Evidence from 15 studies. J BUON.
20:287–295. 2015.PubMed/NCBI
|
|
18
|
Livak KJ and Schmittgen TD: Analysis of
relative gene expression data using real-time quantitative PCR and
the 2(-Delta Delta C(T)) method. Methods. 25:402–408. 2001.
View Article : Google Scholar : PubMed/NCBI
|
|
19
|
Adnan H, Quach H, MacIntosh K, Antenos M
and Kirby GM: Low levels of GSTA1 expression are required for
Caco-2 cell proliferation. PLoS One. 7:e517392012. View Article : Google Scholar : PubMed/NCBI
|
|
20
|
Liu K, Lin X, Zhou Q, Ma T, Han L, Mao G,
Chen J, Yue X, Wang H, Zhang L, et al: The associations between two
vital GSTs genetic polymorphisms and lung cancer risk in the
Chinese population: Evidence from 71 studies. PLoS One.
9:e1023722014. View Article : Google Scholar : PubMed/NCBI
|
|
21
|
Ahn J, Gammon MD, Santella RM, Gaudet MM,
Britton JA, Teitelbaum SL, Terry MB, Neugut AI, Eng SM, Zhang Y, et
al: Effects of glutathione S-transferase A1 (GSTA1) genotype and
potential modifiers on breast cancer risk. Carcinogenesis.
27:1876–1882. 2006. View Article : Google Scholar : PubMed/NCBI
|
|
22
|
Komiya Y, Tsukino H, Nakao H, Kuroda Y,
Imai H and Katoh T: Human glutathione S-transferase A1, T1, M1, and
P1 polymorphisms and susceptibility to prostate cancer in the
Japanese population. J Cancer Res Clin Oncol. 131:238–242. 2005.
View Article : Google Scholar : PubMed/NCBI
|
|
23
|
Martinez C, Martin F, Fernandez JM,
García-Martín E, Sastre J, Díaz-Rubio M, Agúndez JA and Ladero JM:
Glutathione S-transferases mu 1, theta 1, pi 1, alpha 1 and mu 3
genetic polymorphisms and the risk of colorectal and gastric
cancers in humans. Pharmacogenomics. 7:711–718. 2006. View Article : Google Scholar : PubMed/NCBI
|
|
24
|
Matic M, Pekmezovic T, Djukic T, Mimic-Oka
J, Dragicevic D, Krivic B, Suvakov S, Savic-Radojevic A,
Pljesa-Ercegovac M, Tulic C, et al: GSTA1, GSTM1, GSTP1, and GSTT1
polymorphisms and susceptibility to smoking-related bladder cancer:
A case-control study. Urol Oncol. 31:1184–1192. 2013. View Article : Google Scholar : PubMed/NCBI
|
|
25
|
Lo HW and Ali-Osman F: Genetic
polymorphism and function of glutathione S-transferases in tumor
drug resistance. Curr Opin Pharmacol. 7:367–374. 2007. View Article : Google Scholar : PubMed/NCBI
|
|
26
|
Dhanasekaran DN and Reddy EP: JNK
signaling in apoptosis. Oncogene. 27:6245–6251. 2008. View Article : Google Scholar : PubMed/NCBI
|
|
27
|
Yang Y, Cheng JZ, Singhal SS, Saini M,
Pandya U, Awasthi S and Awasthi YC: Role of glutathione
S-transferases in protection against lipid peroxidation.
Overexpression of hGSTA2-2 in K562 cells protects against hydrogen
peroxide-induced apoptosis and inhibits JNK and caspase 3
activation. J Biol Chem. 276:19220–19230. 2001. View Article : Google Scholar : PubMed/NCBI
|
|
28
|
Romero L, Andrews K, Ng L, O'Rourke K,
Maslen A and Kirby G: Human GSTA1-1 reduces c-Jun N-terminal kinase
signalling and apoptosis in Caco-2 cells. Biochem J. 400:135–141.
2006. View Article : Google Scholar : PubMed/NCBI
|