Introduction
Ovarian cancer (OC) is the most common gynecological
malignancy in China, with an estimated 52,100 incident cases
diagnosed and >22,500 mortalities in China in 2015 (1). Despite advances in its treatment,
including surgery, chemotherapy and radiotherapy, survival rates
remain poor for the majority of patients, with a 5-year survival
rate of ~30% (2). Therefore, it is
essential to develop novel therapeutic strategies.
MicroRNAs (miRNAs) are small non-coding RNAs
measuring 19–22 nucleotides in length that regulate gene expression
by binding to complementary sequences in the 3′untranslated region
(UTR) of genes, leading to either the inhibition of translation or
degradation of the gene transcript (3). Increasing evidence has suggested that
miRNAs are involved in OC development and progression. For example,
Yang et al (4) demonstrated
that miR-23a was upregulated in OC cells, and that it promoted the
proliferation, migration and invasion, but repressed apoptosis, of
OC cells through the downregulation of the expression of the tumor
suppressor gene Suppression of tumorigenicity 7 like, and
activation of the Wnt signaling pathways. Shen et al
(5) demonstrated that miR-26a was
overexpressed in human OC specimens: Ectopic expression of miR-26a
increased OC cell proliferation and clonal formation through the
inhibition of estrogen receptor (ER)-α, which was also confirmed in
nude mice. Dong et al (6)
demonstrated that OC tissues exhibited significantly decreased
levels of miR-137 and miR-34a when compared with adjacent normal
tissues, resulting in a trend towards poorer survival.
Additionally, using luciferase assays, miR-137 and miR-34a were
demonstrated to inhibit epithelial-to-mesenchymal transition and
cell invasion by acting as direct suppressors of zinc finger
protein SNAI1 in OC cells (6).
Therefore, miRNAs may be potential targets in OC treatment.
In addition to being present intracellularly, miRNAs
may also be secreted extracellularly through membrane-bound
vesicles, including exosomes. It has been suggested that exosomal
miRNAs may transfer phenotypic traits from the cancer cells of
origin into surrounding normal cells, and therefore facilitate
tumorigenesis and progression (7).
For example, Baroni et al (8)
observed that the transfer of breast cancer-secreted miR-9 to
normal fibroblasts via exosomes increased the migration and
invasion capabilities of recipient normal fibroblasts, contributing
to the formation of cancer-associated fibroblasts. Treatment with
exosomes derived from metastatic breast cancer MDA-MB-231 cells,
including the highly-expressed miR-10b when compared with
non-metastatic breast cancer MCF-7 cells or non-malignant breast
HMLE or MCF-10A cells, was also observed to induce the invasive
ability of non-malignant mammary epithelial cells (9). Therefore, targeting miRNAs in cancer
cells and their exosomes may represent a more effective approach
for OC treatment.
At present, miRNAs of OC in exosomes have rarely
been investigated (10). Ying et
al (11) proposed that OC-derived
exosomes may release miR-222-3p into macrophages and induce
polarization of the M2 phenotype, a tumor-associated
macrophage-like phenotype, via inhibiting the suppressor of
cytokine signalling-3/signal transducer and activator of
transcription-3 pathway, which then promoted the growth and
metastasis of OC. Using the microarray data, Kanlikilicer et
al (12) compared the miRNAs
profiles of OC cells with their exosomes, and indicated that
miR-6126 was released from OC cells via exosomes. miR-6126 also
significantly decreased the tube-forming, invasive and migratory
abilities of OC cells in vitro and inhibited tumor growth
(with smaller tumor size and lower weight), cell number (fewer
numbers of Ki67-positive cells) and microvessel density (fewer
CD31-positive cells) in vivo by inhibiting integrin-β1
(12). However, these studies did not
investigate the common miRNAs in OC cells or their exosomes
compared with normal cells, which was the aim of the present study.
The present study preliminarily identified that miR-127-3p,
miR-339-5p, miR-409-3p and miR-654-3p were commonly differentially
expressed in OC cells and their exosomes and therefore may be
underlying important targets for the treatment of OC (13).
Materials and methods
Data collection
The Affymetrix miRNA microarray data (accession
number GSE76449) were collected from the Gene Expression Omnibus
(GEO) database (http://www.ncbi.nlm.nih.gov/geo/) (12), in which exosomal samples isolated from
6 human epithelial OC [SKOV3_ip1; A2780_PAR, HEYA8, SKOV3_TR
(Taxol-resistant), A2780_CP20 (cisplatin-resistant) and HEYA8_MDR
(multidrug-resistant)] cell lines, 1 normal ovarian surface
epithelial HIO180 cell line and their original cell samples were
downloaded. Each sample had 2 biological repeats, resulting in a
total of 28 samples. To simplify the present study, and to exclude
the effects of chemotherapy drugs including paclitaxel and
cisplatin which were been used in the study of Kanlikilicer et
al (12), only the exosomal and
original cell samples in the chemo-sensitive OC cells (SKOV3_ip1,
A2780_PAR and HEYA8) and normal cells (n=16) were included in the
present study to reveal the mechanism and underlying treatment
targets for OC.
Data normalization and identification
of differentially-expressed miRNAs (DE-miRNAs)
The raw data (CEL files) downloaded from the
Affymetrix Multispecies miRNA-4 Array platform GPL19117 were
preprocessed, including background correction log2 transformation
and quantile normalization, using the Robust Multiarray Average
function available in the Bioconductor package (version 1.34.2;
http://www.bioconductor.org/packages/release/bioc/html/limma.html).
The DE-miRNAs between cancer and normal cells were identified using
the Linear Models for Microarray data method (14) in the Bioconductor R package (version
3.32.5; http://www.bioconductor.org/packages/release/bioc/html/limma.html).
miRNAs with P<0.05 and |log fold change (FC)| >1 were
considered differentially expressed. To visualize the shared
DE-miRNAs between different cell types and between exosomes and
their cells of origin, a Venn diagram was generated using a
web-based tool accessed September 2017 (http://bioinformatics.psb.ugent.be/webtools/Venn/).
Target genes prediction and functional
enrichment analysis
mRNA targets of the DE-miRNAs were predicted using
the miRWalk2 database (http://zmf.umm.uni-heidelberg.de/apps/zmf/mirwalk2/),
which contains 12 bioinformatic algorithms: Microt4; miRWalk;
mirbridge; miRanda; miRDB; miRMap; Pictar2; PITA; miRNAMap;
RNAhybrid; RNA22; and Targetscan. Targets were selected when they
overlapped in at least 4 of 12 databases. Then, the miRNA-target
gene interaction network was constructed and visualized using
Cytoscape software (version 2.8; www.cytoscape.org/) (15).
The Kyoto Encyclopedia of Genes and Genomes (KEGG)
pathways for these target genes were analyzed using the Database
for Annotation, Visualization and Integrated Discovery (DAVID)
online tool (version 6.8; http://david.abcc.ncifcrf.gov) (16). P<0.05 was set as the cut-off
value.
Validation of the association between
crucial miRNAs, target genes and clinical characteristics
The miRNASeq data of OC (Level 3) was obtained from
The Cancer Genome Atlas (TCGA; https://tcga-data.nci.nih.gov/; accessed January 2018)
to confirm the potential associations between crucial miRNAs and
clinical characteristics, including age, tumor stage, tumor grade,
residual tumor, overall survival (OS) and disease-free survival
(DFS).
Raw counts in TCGA were converted to log-counts per
million (CPM) values using the CPM function in edgeR (version 3.4;
http://www.bioconductor.org/packages/release/bioc/html/edgeR.html)
and normalized using the trimmed mean of M-values algorithm. The
preprocessed data were transformed into the gene expression matrix
using the voom/Limma R-package (version 3.32.5; http://bioconductor.org/packages/release/bioc/html/limma.html),
and then the targeted miRNAs were selected.
The OC samples were dichotomously grouped according
to their clinical characteristics (age, ≥60 vs. <60; stage, I–II
vs. stage III–IV; histologic tumor grade, 1–2 vs. 3–4; with tumor
vs. tumor-free) and the differences in the expression of the
aforementioned miRNAs between the two groups were analyzed by an
independent t-test. OC samples were staged or graded according to
the International Federation of Gynecology and Obstetrics (FIGO)
staging (17) or a universal
histological grading system (18).
The samples with survival data were assigned to two groups based on
the expression of each miRNA (low or high expression level). The
threshold for the expression group was the median miRNA expression
in each samples (high-expression group ≥median; low-expression
group <median). The Kaplan-Meier method with the log-rank test
was performed using GraphPad Prism software (version 5; GraphPad
Software, Inc., La Jolla, CA, USA) to estimate the difference in
DFS and OS between the high and low expression groups. P<0.05
was considered to indicate a statistically significant
difference.
Furthermore, the clinical associations of miRNAs and
mRNA, and the association between miRNA and target genes, were also
examined by searching the LinkedOmics database (http://www.linkedomics.org/), which contains
multi-omics data and clinical data for 32 cancer types and a total
of 11,158 patients from the TCGA project (19). In the LinkedOmics database, the
clinical associations of miRNAs and mRNAs, and the association
between miRNAs and target genes was directly calculated using Cox's
Regression test and Pearson's correlation test, respectively
(19).
Results
Identification of DE-miRNAs between OC
and normal control cells
For the exosomal samples, a total of 661 DE-miRNAs
were identified between SKOV3_ip1 and HIO180 cells, according to
the threshold of P<0.05 and |logFC| >1, including 494
upregulated and 167 downregulated; 141 DE-miRNAs were identified
between A2780 _PAR and HIO180 cells, including 74 upregulated and
66 downregulated; and 492 DE-miRNAs were identified between HEYA8
and HIO180 cells, including 262 upregulated and 230 downregulated.
These data indicated different profiles of exosomal miRNAs in
different cancer cell lines compared with the normal controls
(10). To investigate the underlying
mechanisms in the development of OC, common miRNAs among the 3 OC
cell lines (SKOV3_ip1, A2780 _PAR, and HEYA8, selected as they were
not influenced by chemotherapy) were screened by a Venn diagram
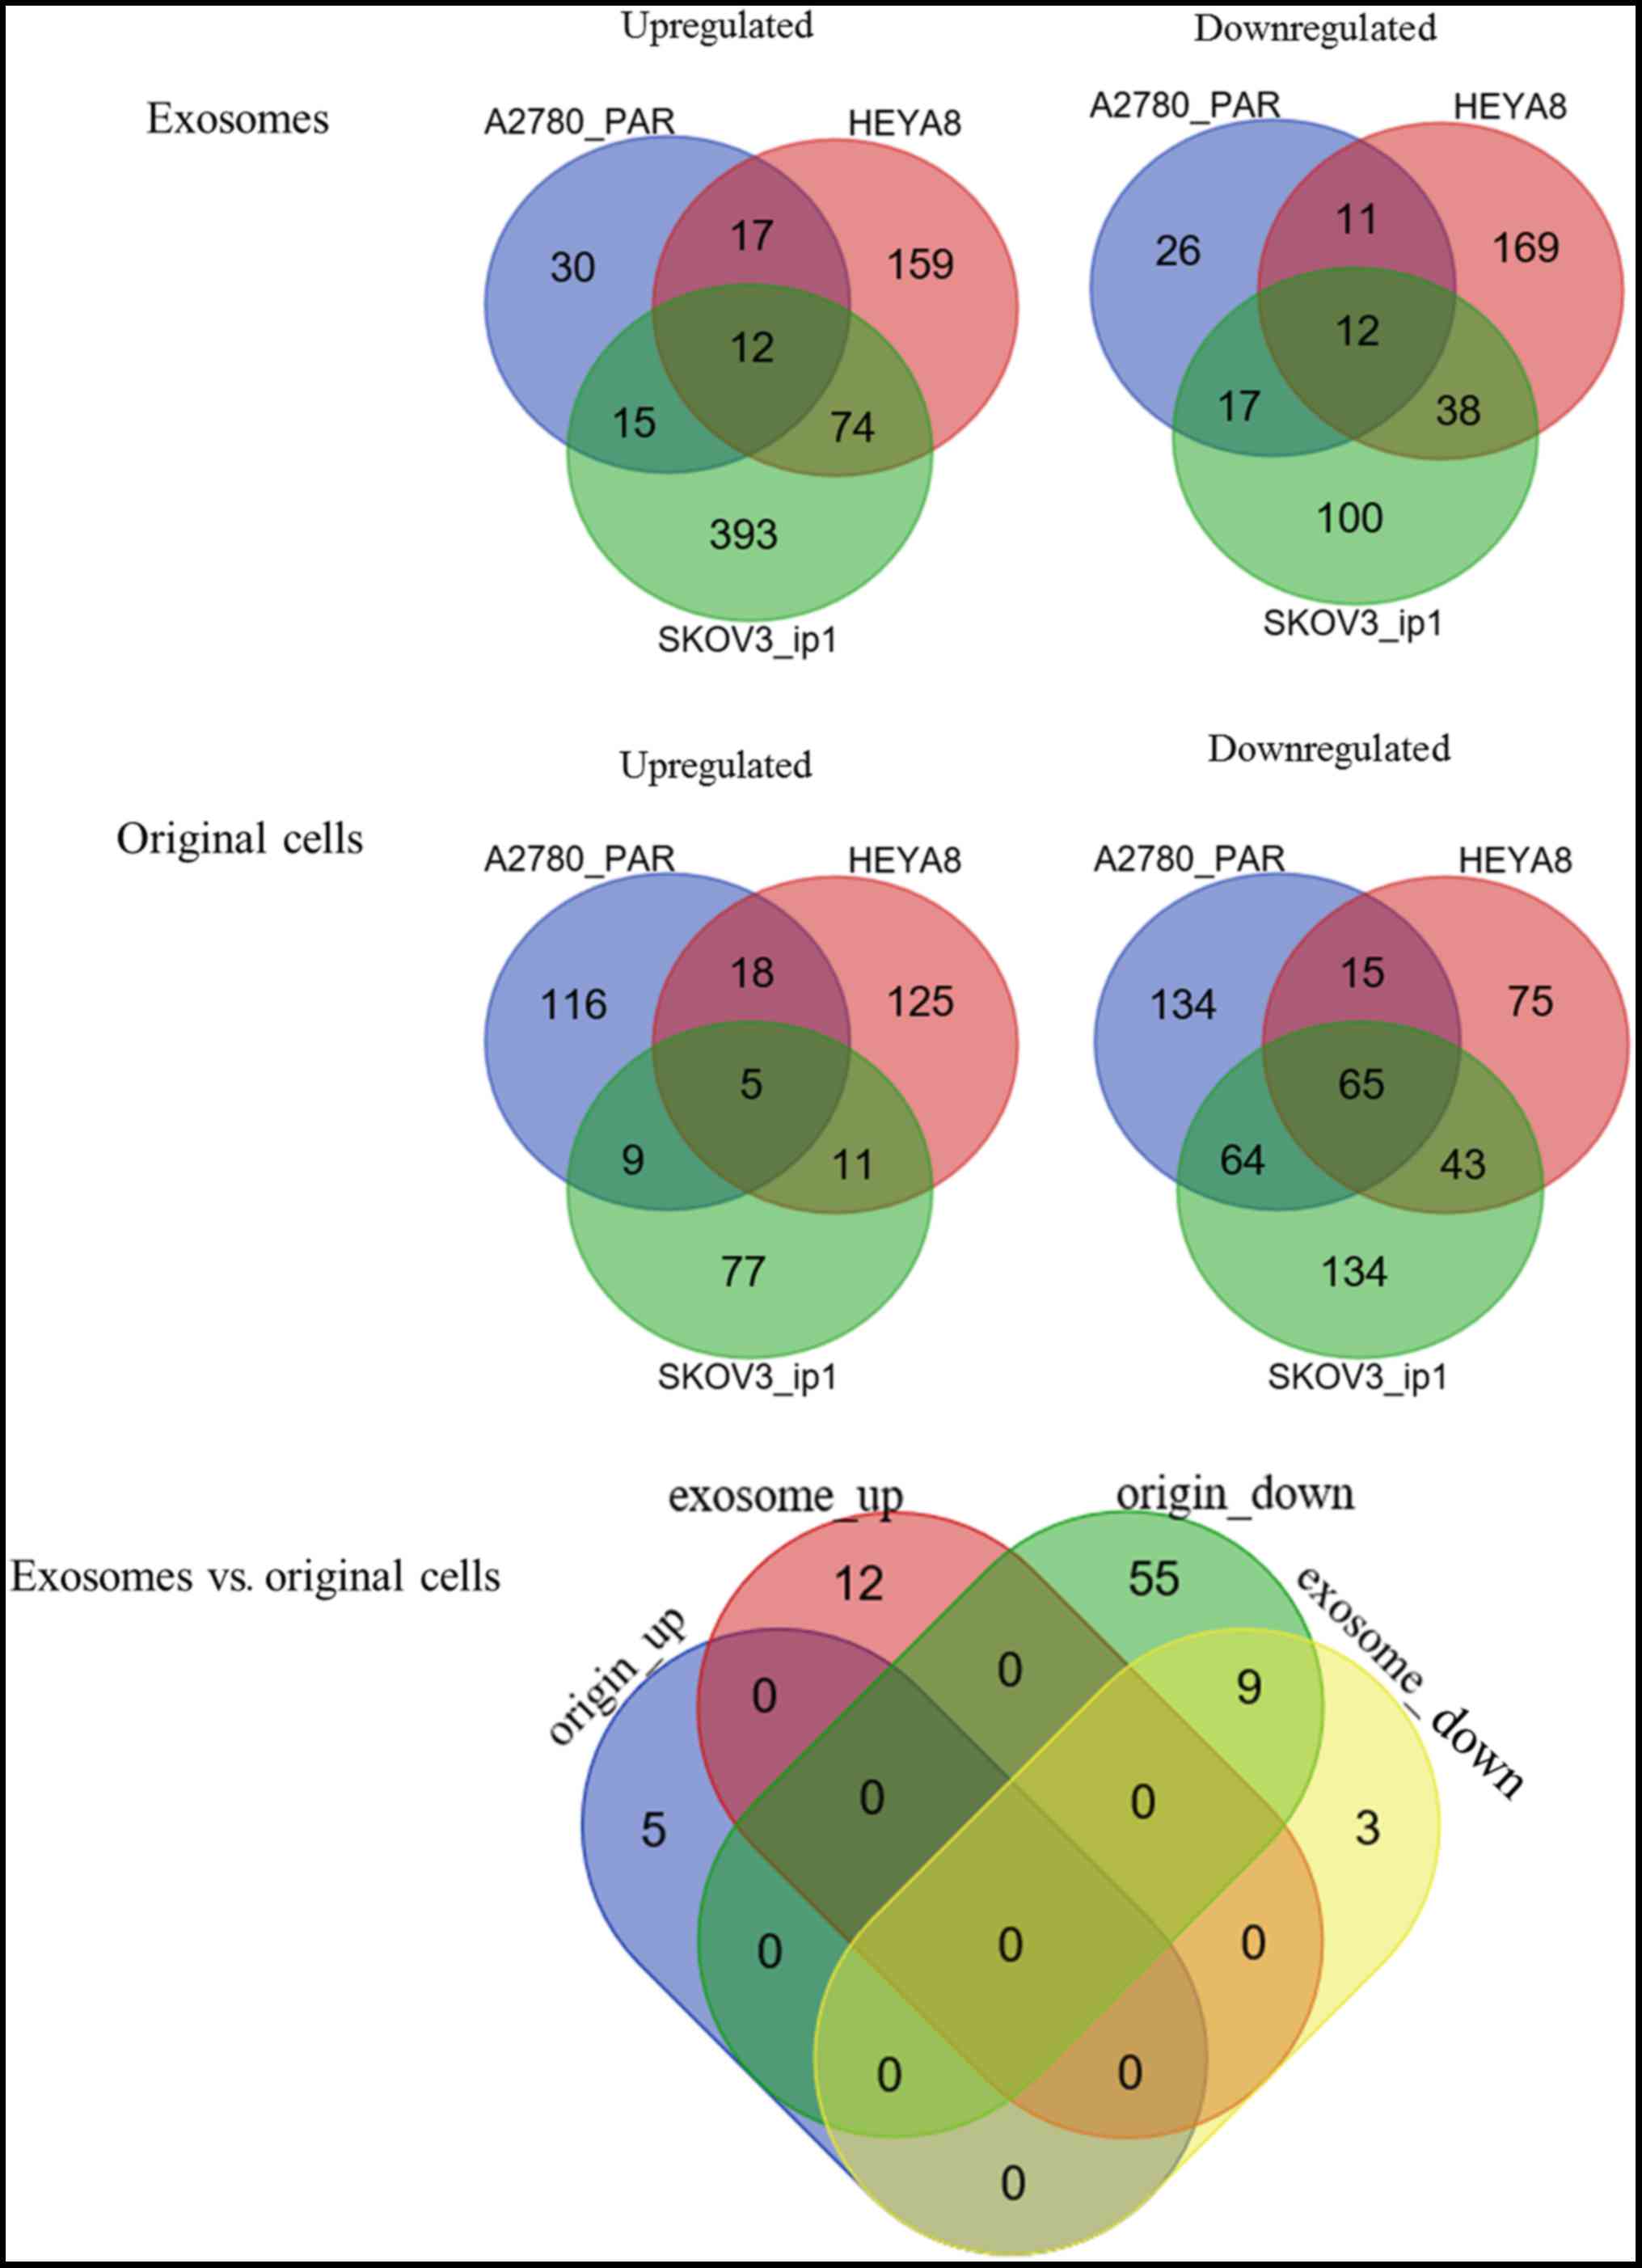
analysis (Fig. 1). As a result, 12
upregulated and 12 downregulated DE-miRNAs were respectively
identified to be shared by the exosomes of these 3 OC cell lines
(Table I).
 | Table I.Shared DE-microRNAs of exosomes from
3 ovarian cancer A2780_PAR, HEYA8 and SKOV3_ip1 cell lines and the
normal ovarian HIO180 cell line. |
Table I.
Shared DE-microRNAs of exosomes from
3 ovarian cancer A2780_PAR, HEYA8 and SKOV3_ip1 cell lines and the
normal ovarian HIO180 cell line.
|
|
| SKOV3_ip1 vs.
HIO180 | A2780_PAR vs.
HIO180 | HEYA8 vs.
HIO180 |
|---|
|
|
|
|
|
|
|---|
| Expression | Symbol | LogFC | P-value | LogFC | P-value | LogFC | P-value |
|---|
| Upregulated |
hsa-miR-6503-3p | 1.5452 | 0.0318 | 4.2537 | 0.0107 | 2.2433 | 0.0018 |
|
|
hsa-miR-6732-5p | 2.2215 | 0.0052 | 2.2282 | 0.0467 | 1.5404 | 0.0248 |
|
| hsa-miR-1825 | 4.3538 | 0.0001 | 4.6936 | 0.0037 | 3.7560 |
3.72×10⁻⁶ |
|
| hsa-miR-1281 | 3.7577 | 0.0003 | 3.8823 | 0.0033 | 3.0166 |
8.30×10⁻⁵ |
|
| hsa-miR-345-3p | 2.7003 | 0.0016 | 2.1740 | 0.0259 | 2.2642 | 0.0017 |
|
|
hsa-miR-6865-3p | 1.8265 | 0.0112 | 4.5809 | 0.0069 | 2.0420 | 0.0042 |
|
|
hsa-miR-3613-5p | 1.7880 | 0.0142 | 3.7595 | 0.0232 | 2.5406 | 0.0006 |
|
| hsa-miR-940 | 3.3506 | 0.0005 | 4.6717 | 0.0095 | 3.2752 |
2.71×10⁻⁵ |
|
|
hsa-let-7f-1-3p | 2.3675 | 0.0032 | 4.2317 | 0.0081 | 2.8521 | 0.0008 |
|
| hsa-miR-3921 | 1.2914 | 0.0452 | 4.6335 | 0.0102 | 2.7964 | 0.0002 |
|
|
hsa-miR-6877-3p | 1.4481 | 0.0326 | 4.1303 | 0.0205 | 1.7630 | 0.0112 |
|
| hsa-miR-214-3p | 3.3959 | 0.0005 | 7.3116 | 0.0001 | 1.5850 | 0.0235 |
| Downregulated | hsa-miR-127-3p | −3.2732 | 0.0006 | −3.8741 | 0.0024 | −2.7713 | 0.0002 |
|
| hsa-miR-654-3p | −2.4874 | 0.0087 | −2.7430 | 0.0103 | −2.8694 | 0.0002 |
|
|
hsa-miR-376c-3p | −2.0892 | 0.0059 | −1.8348 | 0.0462 | −2.6451 | 0.0006 |
|
|
hsa-miR-487b-3p | −2.0324 | 0.0069 | −3.0766 | 0.0073 | −3.1350 |
6.73×10⁻⁵ |
|
| hsa-miR-224-5p | −3.1803 | 0.0008 | −2.5920 | 0.0131 | −4.1790 |
1.06×10⁻⁶ |
|
| hsa-miR-6074 | −1.9951 | 0.0332 | −2.1982 | 0.0303 | −2.4949 | 0.0007 |
|
| hsa-miR-339-5p | −4.6015 |
7.85×10⁻⁵ | −2.2480 | 0.0377 | −3.3341 |
2.03×10⁻⁵ |
|
| hsa-miR-409-3p | −3.5353 | 0.0005 | −2.4868 | 0.0176 | −2.5549 | 0.0006 |
|
| hsa-miR-22-3p | −3.1810 | 0.0008 | −5.8766 | 0.0135 | −1.9292 | 0.0061 |
|
| hsa-miR-152-3p | −4.0552 | 0.0002 | −3.8035 | 0.0117 | −2.2327 | 0.0019 |
|
|
hsa-miR-193a-3p | −2.5431 | 0.0026 | −2.9552 | 0.0075 | −2.3664 | 0.0021 |
|
| hsa-miR-381-3p | −2.6255 | 0.00195 | −2.2307 | 0.0234 | −2.0432 | 0.0040 |
From the original cell samples, a total of 408
DE-miRNAs were identified between SKOV3_ip1 and HIO180 cell lines,
including 102 upregulated and 306 downregulated; 426 DE-miRNAs were
identified between A2780 _PAR and HIO180 cell lines, including 148
upregulated and 278 downregulated; and 357 DE-miRNAs were
identified between HEYA8 and HIO180 cell lines, including 159
upregulated and 198 downregulated. Following the Venn diagram
analysis (Fig. 1), 5 upregulated and
65 downregulated DE-miRNAs were identified to be common among the 3
OC cell lines (Table II).
| Table II.Shared DE-miRNAs of original cells
from 3 ovarian cancer A2780_PAR, HEYA8, SKOV3_ip1 cell lines and
the normal ovarian HIO180 cell line. The top 20 downregulated
miRNAs were listed. |
Table II.
Shared DE-miRNAs of original cells
from 3 ovarian cancer A2780_PAR, HEYA8, SKOV3_ip1 cell lines and
the normal ovarian HIO180 cell line. The top 20 downregulated
miRNAs were listed.
|
|
| SKOV3_ip1 vs.
HIO180 | A2780_PAR vs.
HIO180 | HEYA8 vs.
HIO180 |
|---|
|
|
|
|
|
|
|---|
| Expression | Symbol | LogFC | P-value | LogFC | P-value | LogFC | P-value |
|---|
| Upregulated | hsa-miR-17-5p | 2.2198 | 0.0008 | 1.8453 | 0.0020 | 1.2775 | 0.0163 |
|
| hsa-miR-8057 | 1.3228 | 0.0116 | 1.0111 | 0.0382 | 1.1279 | 0.0340 |
|
| hsa-miR-20b-5p | 3.7411 |
2.93×10⁻⁵ | 2.5826 | 0.0002 | 1.2728 | 0.0167 |
|
| hsa-miR-20a-5p | 2.3927 | 0.0005 | 1.9455 | 0.0011 | 1.3961 | 0.0087 |
|
|
hsa-miR-106a-5p | 2.2889 | 0.0006 | 1.7874 | 0.0019 | 1.2947 | 0.0149 |
| Downregulated | hsa-miR-140-5p | −1.1008 | 0.0319 | −1.4803 | 0.0074 | −2.8567 |
8.16×10⁻⁸ |
|
|
hsa-miR-487a-3p | −1.7013 | 0.0040 | −1.6719 | 0.0050 | −2.0394 | 0.0001 |
|
| hsa-miR-381-3p | −1.7169 | 0.0062 | −1.8955 | 0.0088 | −2.2111 |
3.27×10⁻⁵ |
|
| hsa-miR-377-5p | −1.8697 | 0.0158 | −1.0028 | 0.0477 | −1.3828 | 0.0093 |
|
|
hsa-miR-1306-5p | −2.0760 | 0.0020 | −1.8761 | 0.0019 | −1.7115 | 0.0013 |
|
| hsa-miR-370-5p | −1.5049 | 0.0180 | −2.0784 | 0.0010 | −1.5561 | 0.0034 |
|
|
hsa-miR-6839-5p | −1.1913 | 0.0186 | −1.0604 | 0.0473 | −1.1274 | 0.0340 |
|
| hsa-miR-337-5p | −2.1739 | 0.0024 | −2.5794 | 0.0024 | −2.4266 |
5.17×10⁻⁶ |
|
| hsa-miR-604 | −1.1959 | 0.0249 | −1.6227 | 0.0032 | −1.049 | 0.0486 |
|
| hsa-miR-493-3p | −2.7845 | 0.0002 | −2.5499 | 0.0038 | −3.3224 |
4.54×10⁻¹⁰ |
|
| hsa-miR-758-3p | −2.2183 | 0.0039 | −2.0373 | 0.0008 | −1.8360 | 0.0006 |
|
| hsa-miR-127-5p | −2.5959 | 0.0028 | −2.3487 | 0.0015 | −1.9215 | 0.0003 |
|
| hsa-mir-381 | −1.5770 | 0.0089 | −1.7904 | 0.0045 | −1.6309 | 0.0022 |
|
|
hsa-miR-6508-5p | −1.1225 | 0.0339 | −1.0228 | 0.0309 | −1.2049 | 0.0235 |
|
| hsa-miR-134-5p | −4.5744 |
2.96×10⁻⁵ | −3.7451 |
1.36×10⁻⁵ | −4.2165 |
2.76×10⁻¹⁵ |
|
|
hsa-miR-487b-3p | −5.1189 |
4.09×10⁻⁶ | −5.5027 |
8.78×10⁻⁷ | −5.3287 |
2.17×10⁻²³ |
|
|
hsa-miR-323a-3p | −1.4376 | 0.0090 | −1.1565 | 0.0203 | −1.8147 | 0.0006 |
|
| hsa-miR-411-3p | −1.9974 | 0.0022 | −1.6534 | 0.0029 | −1.4233 | 0.0075 |
|
|
hsa-miR-196b-5p | −3.2357 | 0.0017 | −2.2388 | 0.0005 | −3.5772 | 1.95
×10−11 |
|
| hsa-miR-370-3p | −1.6817 | 0.0223 | −1.3440 | 0.0090 | −2.1430 |
5.66×10⁻⁵ |
In addition, the number of upregulated genes was
increased compared with the number of downregulated genes in the
exosomes in each cell line, but the opposite was identified in
their original cells, suggesting an overexpression of oncogenes and
a decreased expression of tumor-suppressor genes may be the primary
mechanisms for exosomal and original cells, respectively, to
promote the development and progression of OC. This appeared to be
consistent with the established theory that exosomes may transfer
certain oncogenic DE-miRNAs into the extracellular environment to
maintain and promote tumorigenesis (9). To additionally investigate the
differences or similarities in DE-miRNAs between exosomes and their
original cells during cancer development, a Venn diagram analysis
was performed. The results demonstrated that only 9 downregulated
DE-miRNAs were shared between the exosomes and original cells
(Fig. 1; Table III), and the others were
exosomal-(n=15) or original cell-specific (n=61). These data
suggested that these 9 DE-miRNAs may be particularly crucial for OC
development in an exosomal or non-exosomal manner.
| Table III.Shared DE-microRNAs between exosomes
and original cells. |
Table III.
Shared DE-microRNAs between exosomes
and original cells.
|
|
| SKOV3_ip1 vs.
HIO180 | A2780_PAR vs.
HIO180 | HEYA8 vs.
HIO180 |
|---|
|
|
|
|
|
|
|---|
| Source | Symbol | LogFC | P-value | LogFC | P-value | LogFC | P-value |
|---|
| Exosomes | hsa-miR-127-3p | −3.2732 | 0.0006 | −3.8741 | 0.0024 | −2.7712 | 0.0002 |
|
| hsa-miR-654-3p | −2.4874 | 0.0087 | −2.7430 | 0.0103 | −2.8694 | 0.0002 |
|
|
hsa-miR-376c-3p | −2.0893 | 0.0059 | −1.8348 | 0.0462 | −2.6451 | 0.0006 |
|
|
hsa-miR-487b-3p | −2.0324 | 0.0069 | −3.0766 | 0.0073 | −3.1350 |
6.73×10⁻⁵ |
|
| hsa-miR-224-5p | −3.1803 | 0.0008 | −2.5920 | 0.0131 | −4.1790 |
1.06×10⁻⁶ |
|
| hsa-miR-339-5p | −4.6015 |
7.85×10⁻⁵ | −2.2480 | 0.0377 | −3.3341 |
2.03×10⁻⁵ |
|
| hsa-miR-409-3p | −3.5353 | 0.0005 | −2.4868 | 0.0176 | −2.5549 | 0.0006 |
|
| hsa-miR-152-3p | −4.0552 | 0.0002 | −3.8035 | 0.0117 | −2.2327 | 0.0019 |
|
| hsa-miR-381-3p | −2.6255 | 0.0020 | −2.2307 | 0.0234 | −2.0432 | 0.0040 |
| Original | hsa-miR-127-3p | −6.8163 |
5.78×10−37 | −6.5228 |
1.42×10⁻⁶ | −7.0302 |
3.31×10⁻⁷ |
|
| hsa-miR-654-3p | −3.4292 |
1.25×10⁻¹⁰ | −3.1935 | 0.0006 | −4.0444 |
6.68×10⁻⁵ |
|
|
hsa-miR-376c-3p | −2.6295 |
7.89×10⁻⁷ | −2.0037 | 0.0062 | −1.6068 | 0.0039 |
|
|
hsa-miR-487b-3p | −5.3287 |
2.17×10⁻²³ | −5.1189 |
4.09×10⁻⁶ | −5.5027 |
8.78×10⁻⁷ |
|
| hsa-miR-224-5p | −2.6302 |
7.84×10⁻⁷ | −5.7820 |
1.89×10⁻⁶ | −4.4687 |
8.52×10⁻⁶ |
|
| hsa-miR-339-5p | −2.0021 | 0.0002 | −1.2081 | 0.0175 | −1.3532 | 0.0118 |
|
| hsa-miR-409-3p | −6.0879 |
6.24×10⁻³⁰ | −6.4526 |
7.75×10⁻⁷ | −5.2779 |
3.65×10⁻⁶ |
|
| hsa-miR-152-3p | −4.7885 |
3.13×10⁻¹⁹ | −2.8237 | 0.0003 | −2.8109 | 0.0002 |
|
| hsa-miR-381-3p | −2.2111 |
3.27×10−05 | −1.7169 | 0.0062 | −1.8955 | 0.0088 |
Target genes for DE-miRNAs between OC
cells and normal controls
Following the use of 6 algorithms, only the target
genes for 1 upregulated (hsa-miR-940) and 4 shared downregulated
(hsa-miR-127-3p, hsa-miR-339-5p, hsa-miR-409-3p and hsa-miR-654-3p)
DE-miRNAs of exosomes from 3 OC cells were obtained. From the
original cells of the 3 OC cell lines, only the target genes for 1
upregulated (hsa-miR-17-5p) and 19 shared downregulated
(hsa-miR-127-3p, hsa-miR-127-5p, hsa-miR-140-3p, hsa-miR-140-5p,
hsa-miR-184, hsa-miR-299-3p, hsa-miR-299-5p, hsa-miR-337-5p,
hsa-miR-339-5p, hsa-miR-409-3p, hsa-miR-409-5p, hsa-miR-485-5p,
hsa-miR-543, hsa-miR-574-3p, hsa-miR-604, hsa-miR-654-3p,
hsa-miR-654-5p, hsa-miR-767-5p and hsa-miR-935) DE-miRNAs were
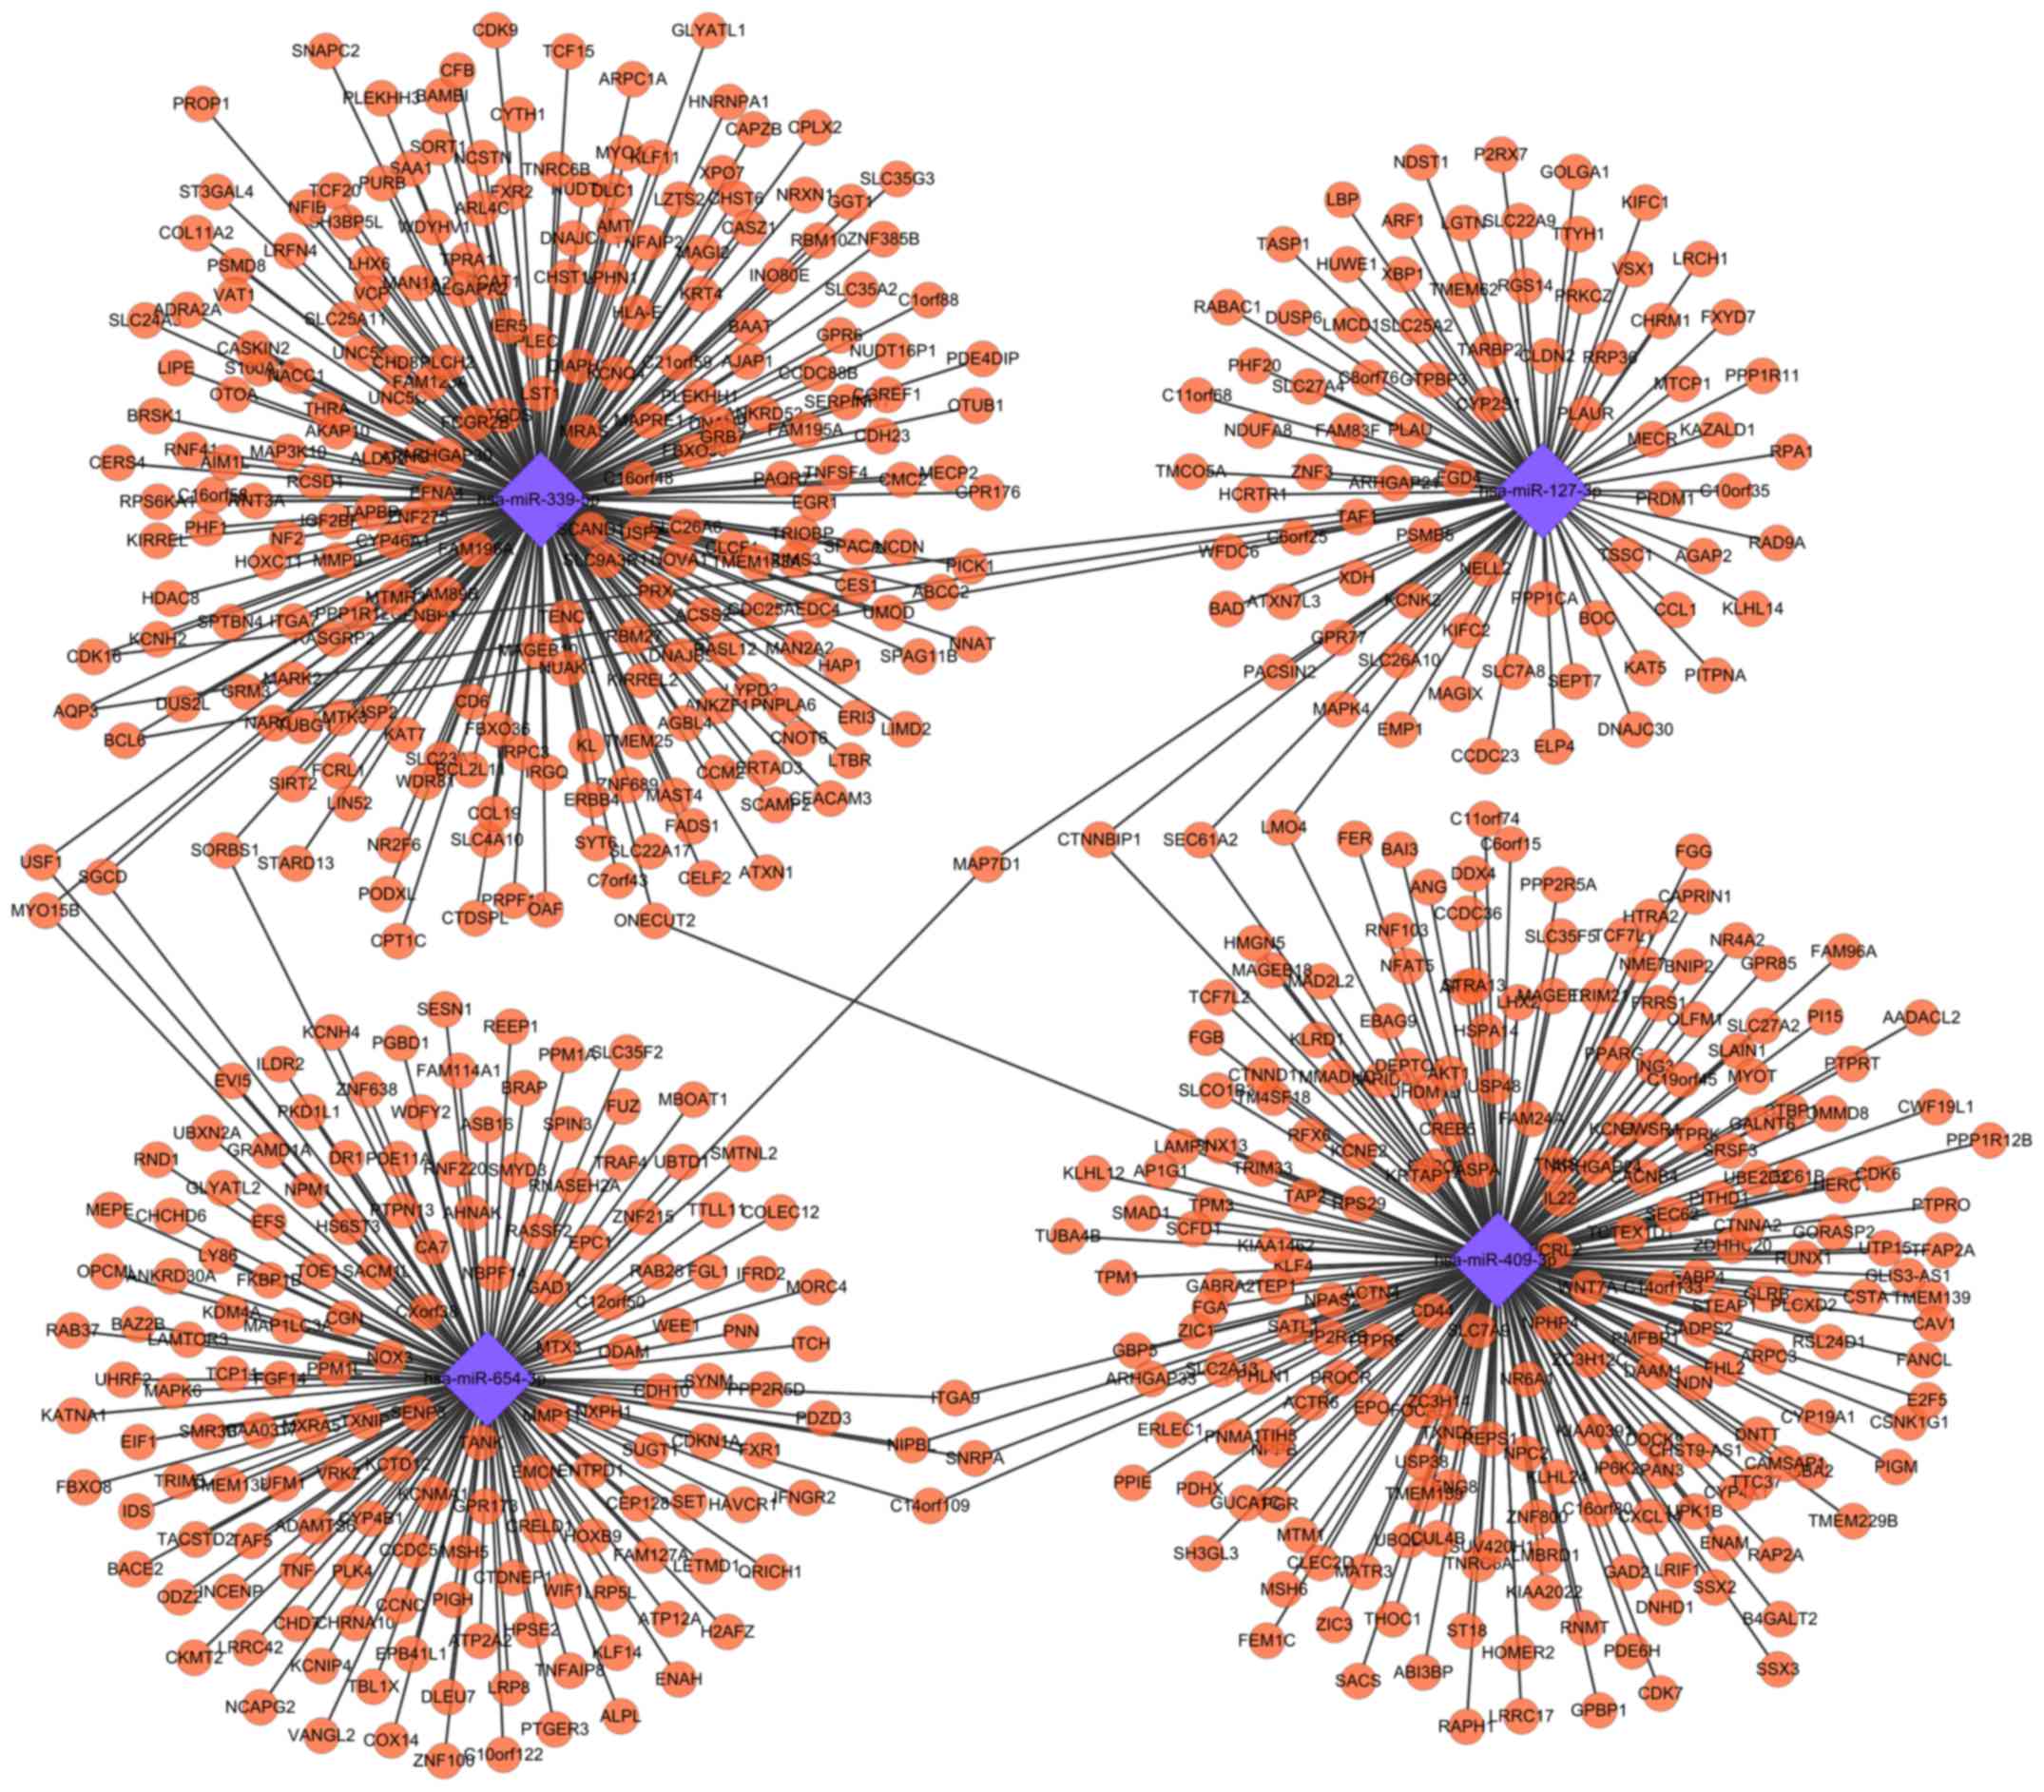
predicted. Among them, downregulated hsa-miR-127-3p,
hsa-miR-339-5p, hsa-miR-409-3p and hsa-miR-654-3p were common
between exosomes and their original cells. The regulatory network
of these common miRNAs and their target genes is presented in
Fig. 2.
Functional enrichment analysis of
common DE-miRNAs in exosomes and their original cells
The target genes of the 4 shared downregulated
DE-miRNAs between exosomes and their corresponding original cells
were analyzed using DAVID for functional enrichment analysis. It
was revealed that 6 KEGG pathways were enriched, including the Wnt
signaling pathway [hsa-miR-409-3p-Wnt family member 7A (WNT7A),
hsa-miR-339-5p-Wnt family member 3A (WNT3A), hsa-miR-654-3p-VANGL
planar cell polarity protein 2 (VANGL2), hsa-miR-409-3p-C-terminal
binding protein 1 (CTBP1) and hsa-miR-339-5p-chromodomain helicase
DNA-binding protein 8 (CHD8)], Proteoglycans in cancer
[hsa-miR-127-3p- serine/threonine-protein phosphatase PP1α
catalytic subunit (PPP1CA), hsa-miR-127-3p-urokinase (PLAU)], and
Insulin resistance (hsa-miR-654-3p-ribosomal protein S6 kinase α1;
Table IV).
| Table IV.Function enrichment for target genes
of 4 common differentially-expressed microRNAs in exosomes and
their original cells of ovarian cancer. |
Table IV.
Function enrichment for target genes
of 4 common differentially-expressed microRNAs in exosomes and
their original cells of ovarian cancer.
| KEGG IDs | Pathway name | P-value | Genes |
|---|
| hsa00430 | Taurine and
hypotaurine metabolism | 0.0068 | GAD2, BAAT, GGT1,
GAD1 |
| hsa05205 | Proteoglycans in
cancer | 0.0077 | CAV1, TNF, ERBB4,
MRAS, PPP1R12B, MMP9, WNT3A, PPP1R12C, PLAUR, AKT1, PPP1CA, CDKN1A,
HPSE2, CD44, WNT7A, PLAU |
| hsa04310 | Wnt signaling
pathway | 0.0139 | CTNNBIP1, CHD8,
CTBP1, WNT3A, VANGL2, WIF1, BAMBI, DAAM1, TBL1X, WNT7A, TCF7L2,
TCF7L1 |
| hsa05412 | Arrhythmogenic
right ventricular cardiomyopathy | 0.0162 | ITGA9, ACTN4,
ITGA7, SGCD, CACNB4, TCF7L2, TCF7L1, CTNNA2 |
| hsa04931 | Insulin
resistance | 0.0483 | AKT1, PRKCZ,
PPP1CA, TNF, PTPRF, RPS6KA1, CREB5, SLC27A2, SLC27A4 |
| hsa04520 | Adherens
junction | 0.0485 | PTPRF, ACTN4,
SORBS1, CTNND1, TCF7L2, TCF7L1, CTNNA2 |
Validation of the association between
crucial miRNAs, target genes and clinical characteristics
To validate the clinical importance of the
identified miRNAs of the present study, the miRNA expression and
clinical data associated with OC were also extracted from the TCGA
database. As a result, miRNA expression data were available for 489
patients, but clinical data for age, tumor stage, tumor grade,
residual tumor, OS and DFS were obtained from only 481, 281, 472,
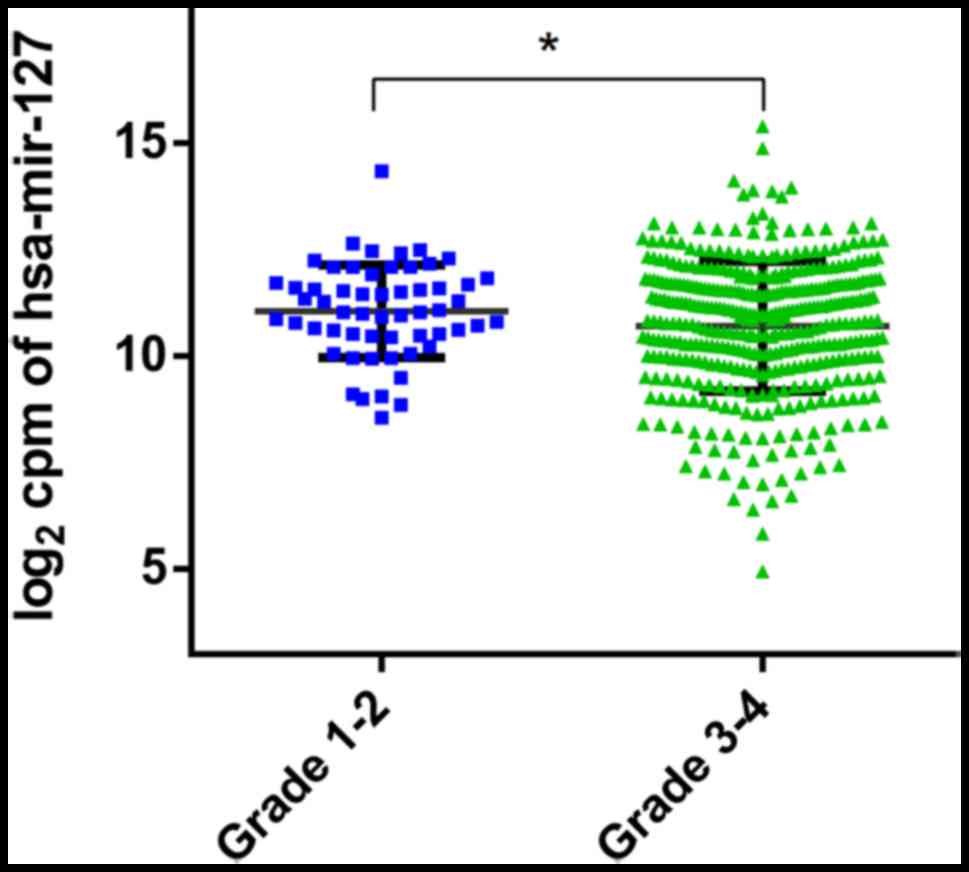
431, 485 and 410 women, respectively. The results indicated that
the expression of hsa-miR-127 in patients with higher-grade tumors
(G3-G4) was significantly decreased compared with that in patients
with lower grades (G1-G2) (11.06±1.09 vs. 10.71±1.53; P=0.03;
Fig. 3). However, no significant
difference in miRNA expression was observed when patients were
stratified by age, tumor stage and presence of residual tumors
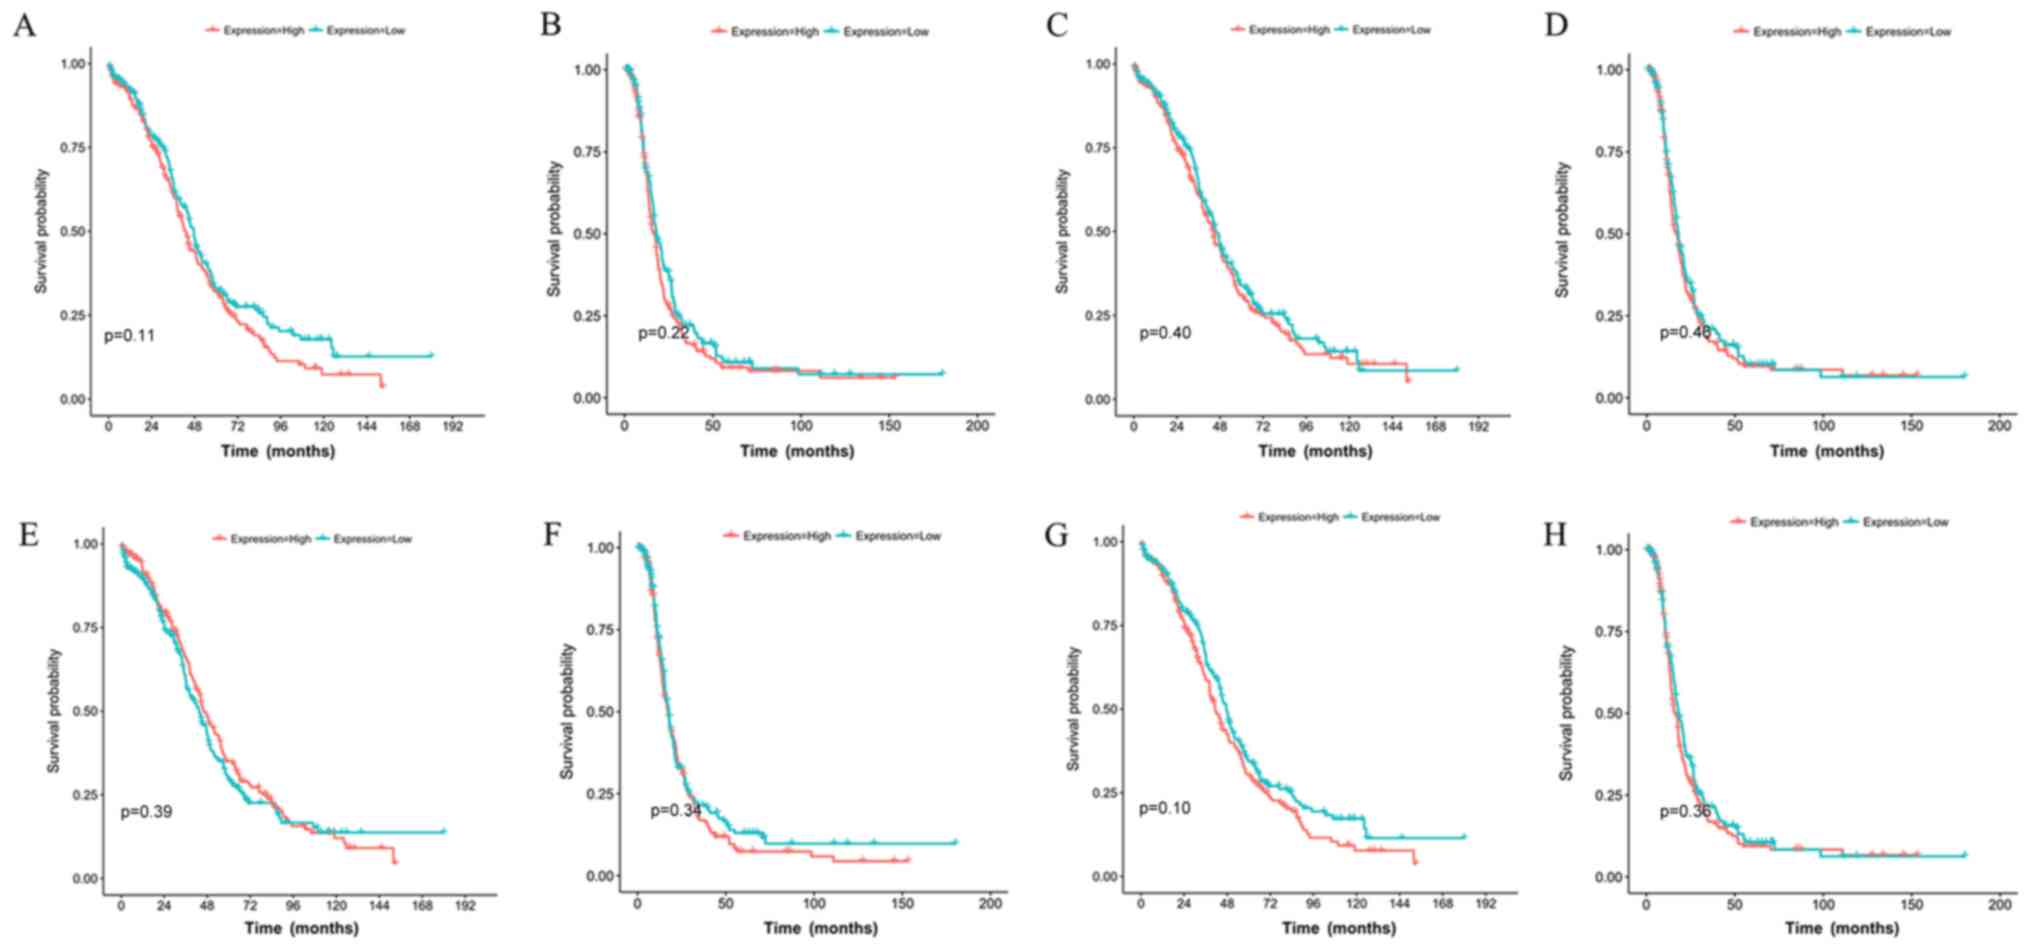
(Table V). Kaplan-Meier analysis also
indicated that these miRNAs were not suitable for use as prognostic
factors for survival outcomes in patients with OC (Fig. 4), which was also confirmed by
LinkedOmics analysis using 453 overlapping samples from the
miRNASeq and clinical datasets (hsa-miR-409-3p, P=0.296;
hsa-miR-339-5p, P=0.426; hsa-miR-127-3p, P=0.122; has-miR-654,
P=0.071).
| Table V.Associations between miRNAs and
clinical characteristics analyzed using data from The Cancer Genome
Atlas data. |
Table V.
Associations between miRNAs and
clinical characteristics analyzed using data from The Cancer Genome
Atlas data.
|
Characteristics | hsa-miR-127 | P-value | hsa-miR-339 | P-value | hsa-miR-409 | P-value | hsa-miR-654 | P-value |
|---|
| Age |
|
|
|
|
|
|
|
|
| ≥60
(n=28) | 10.74±1.49 | 0.97 | 6.88±0.92 | 0.63 | 5.31±1.40 | 0.82 | 4.73±1.47 | 0.92 |
| <60
(n=453) | 10.75±1.46 |
| 6.83±0.98 |
| 5.29±1.32 |
| 4.74±1.49 |
|
| FIGO
stagea |
|
|
|
|
|
|
|
|
| I–II
(n=28) | 10.10±1.98 | 0.08 | 6.61±1.32 | 0.16 | 4.81±1.43 | 0.05 | 4.18±1.79 | 0.95 |
| III–IV
(n=253) | 10.79±1.43 |
| 6.87±0.92 |
| 5.33±1.35 |
| 4.77±1.46 |
|
| Histological
gradea |
|
|
|
|
|
|
|
|
| 1–2
(n=57) | 11.06±1.09 | 0.03 | 6.64±0.82 | 0.06 | 5.58±1.15 | 0.11 | 4.98±1.20 | 0.19 |
| 3–4
(n=415) | 10.71±1.53 |
| 6.88±0.95 |
| 5.26±1.40 |
| 4.70±1.53 |
|
| Residual
tumora |
|
|
|
|
|
|
|
|
| Present
(n=317) | 10.80±1.39 | 0.27 | 6.85±0.96 | 0.65 | 5.35±1.33 | 0.45 | 4.81±1.36 | 0.26 |
| Absent
(n=114) | 10.61±1.71 |
| 6.80±1.01 |
| 5.24±1.42 |
| 4.63±1.81 |
|
A Pearson correlation test using 287 overlapping
samples from the miRNASeq and RNAseq datasets validated the
significant negative correlation between hsa-miR-409-3p and CTBP1
(r=−0.150, P=0.011), hsa-miR-339-5p and CHD8 (r=−0.125, P=0.033)
and hsa-miR-127-3p and PPP1CA (r=−0.201, P=0.0006), but not the
others. These target genes were also not significantly associated
with survival outcomes (CTBP1, P=0.966; CHD8, P=0.224; PPP1CA,
P=0.333), as demonstrated by a cox regression test using 303
overlapping samples from the RNAseq and clinical datasets.
Discussion
Although all 3 DE-miRNAs (hsa-miR-127-3p,
hsa-miR-339-5p and hsa-miR-409-3p) have been demonstrated to have a
tumor-suppressive role in cancer (20), only miR-127-3p (21) and miR-339-5p (22) had been identified in OC cells in
previous studies. miR-127-3p was demonstrated to be downregulated
in OC cell lines and OC tumor tissues; lentiviral-mediated
miR-127-3p reduced the proliferation and invasion of OVCAR-3 and
Caov-3 cells by directly inhibiting the Bcl-associated athanogene 5
(BAG5) gene, and subsequent BAG5 upregulation ameliorated the
tumor-suppressive effects of miR-127-3p overexpression in OC
(21). Although downregulated
compared with normal cells, the expression of miR-339-5p was
identified to be differentially expressed in different cell types,
with the highest expression in OVCAR5 cells and lowest expression
in SKOV3 cells (21). Inhibition of
miR-339-5p expression increased the migration and invasion of
OVCAR5 cells, while upregulated miR-339-5p attenuated this effect
in SKOV3 cells (22). The validated
targets of miR-339-5p were nucleus accumbens associated 1 and
B-cell lymphoma-6 (22). In
accordance with these aforementioned studies, hsa-miR-127-3p,
hsa-miR-339-5p and hsa-miR-409-3p were also identified to be
downregulated in the 3 OC cell lines in the present study. Among
them, hsa-miR-127-3p may be particularly important in OC due to its
significantly negative correlations with high tumor grades, which
were identified in the present study, a key malignant
characteristic of cancer.
Previous evidence has indicated that the Wnt
signaling pathway is crucial for cancer progression (23). Yoshioka et al (24) identified abundant WNT7A in the
epithelium of serous OC, but not in borderline and benign tumors,
normal ovary or endometrioid carcinomas (24). In vitro analysis revealed that
WNT7A may promote the malignant transformation of ovarian
epithelial cells by stimulating the β-catenin/T-cell factor
(TCF)-matrix metalloproteinase 7 (MMP7) signaling pathway (24). Stimulation of primary ovarian surface
epithelium cells (OSE) in vitro with WNT3A also inhibited
glycogen synthase kinase-3β and destabilized the adherens junction
through the downregulation of epithelial (E)-cadherin and nuclear
translocation of β-catenin, promoting the increased proliferative
rate of OSE cells (25). The
archetypal Wnt/planar cell polarity protein VANGL2 has been
demonstrated to be overexpressed in basal breast cancer and
implicated in tumor growth by activating the VANGL2-nucleoporin
p62/sequestosome 1-c-Jun N-terminal kinase pathway, ultimately
inducing a poor prognosis (26).
CTBP1 was demonstrated to activate the expression of Wnt genes and
downregulate their downstream E-cadherin in a TCF-independent
manner (27). Small interfering RNA
knockdown of CTBP1 restored E-cadherin expression in cancer cell
lines, inhibiting their proliferation and invasion (28). CHD8 was previously demonstrated to
inhibit the transcription of β-catenin target genes through
chromatin compaction (29) and it may
be a tumor suppressor gene (30).
However, multiple previous studies have identified an increased
expression of CHD8 in cancer cells compared with that in normal
tissues (31,32). Subsequent in vitro and in
vivo analysis confirmed that CHD8 depletion may be detrimental
to the growth of B-acute lymphoblastic leukemia cells and promote
its apoptosis (33). The upregulation
of Wnt pathway genes in cancer may be due to the downregulation of
their corresponding miRNAs, which was confirmed previously: WNT7A
has been demonstrated to be a direct target of miR-15b in OC using
a luciferase reporter assay. The inverse correlation of a high
expression of WNT7A and low-expression of miR-15b in OC was
observed to be associated with decreased survival rates in patients
with OC (34). miR-137 has been
revealed to suppress the 3′ UTR luciferase-reporter activity of
CTBP1, reducing its mRNA expression levels followed by increasing
the expression of immediate downstream effectors of CtBP1,
including E-cadherin (35). In the
present study, it was identified that WNT7A/CTBP1, WNT3A/CHD8, and
VANGL2 were respectively regulated by hsa-miR-409-3p,
hsa-miR-339-5p and hsa-miR-654-3p, thereby indirectly explaining
the roles of these miRNAs in OC. However, only negative regulatory
associations between hsa-miR-409-3p and CTBP1, and hsa-miR-339-5p
and CHD8, were verified using the OC data in TCGA, which had not
been demonstrated in previous studies, to the best of our
knowledge. These data indicate that these 2 miRNAs may be novel
effectors in OC.
PLAU encodes for the urokinase-type plasminogen
activator (uPA), which has been demonstrated to be critical for OC
development and progression (36,37). uPA
is overexpressed in the majority of patients with OC (36). The overexpression of uPA has been
significantly associated with poorer degrees of differentiation,
higher clinical stages (III–IV), lymph node or omental metastasis
and decreased survival (36,37). Mechanistic studies suggested that uPA
may promote the migration and invasion of OC cells by inducing the
formation of vasculogenic mimicry via the Protein kinase
B/mechanistic target of rapamycin/MMP2/Laminin5γ2 signaling
pathway, while the use of an uPA antagonist,
cyclic-arginine-glycine-aspartic acid, weakened these processes
(38). In addition, the upregulated
expression of uPA in OC cells was demonstrated to be p38 mitogen
activated protein kinase (MAPK) signal-pathway dependent: The
utility of p38 MAPK inhibitor SB203580 almost decreased the
expression of uPA to an absolute count of 0 (39). Furthermore, uPA may be a target gene
of miR-193b: Overexpression of miR-193b was demonstrated to
negatively regulate uPA expression and thereby inhibit the
invasiveness of breast (40),
pancreatic (41) and prostate cancer
(42) cells. However, to the best of
our knowledge, there have been no prior studies investigating
uPA-associated miRNAs in OC cells. In the present study, it was
predicted that the upregulation of uPA in OC may be attributed to
the downregulation of hsa-miR-127-3p. This was not verified by
subsequent TCGA analysis, and therefore additional experiments may
be required.
PPP1CA, encoding PP1α, is suggested to regulate
critical cellular events, including cell cycle and apoptosis
(43,44); therefore, it may be a potential
tumor-associated gene. This hypothesis has been confirmed by
previous studies: For example, Hsu et al (45) identified that PPP1CA was amplified and
overexpressed in oral squamous cell carcinomas cells (OSCC), and
that knockdown of PP1α suppressed OSCC cell G0 growth arrest by
modulating retinoblastoma phosphorylation. Nohata et al
(46) also observed the
overexpression of PPP1CA in clinical specimens with maxillary sinus
squamous cell carcinoma (MSSCC). Silencing of the PPP1CA gene
significantly inhibited cancer cell proliferation and invasion.
Shastry et al (47) revealed
that patients with glioblastoma with positive PP1A and p53
expression exhibited a poorer overall median time (14 months)
compared with PP1A-negative cases (21 months). Accordingly, we
hypothesize that PPP1CA is also highly expressed in OC.
Furthermore, PP1CA was revealed to be expressed at high levels due
to a frequent downregulation of miR-874 in MSSCC (46). However, to the best of our knowledge,
no previous studies have investigated PPP1CA-associated miRNAs in
OC cells. In the present study, it was predicted that the
upregulation of PPP1CA in OC may be attributed to the
downregulation of hsa-miR-127-3p. This negative association was
also verified in the TCGA analysis.
Notably, it has been suggested that co-culture with
OC ES-2 cells and incubation with ES-2-conditioned medium induced
the expression of uPA mRNA in fibroblastic stromal LEP cells
~2-fold (48), indicating that OC
cells may externally secret certain signals, including miRNAs, to
regulate the expression of uPA and induce tumorigenesis. As
expected, hsa-miR-127-3p was also identified to be downregulated in
the exosomes of OC cells in the present study, and therefore the
addition of hsa-miR-127-3p-containing exosomes may be a novel
approach to the treatment of OC. Similarly, Lin et al
(49) observed that exosomes derived
from the conditional supernatant of the esophageal cancer KYSE410
cell line induced an increase in the cell migratory and invasive
abilities of KYSE410 and 2 other esophageal carcinoma KYSE510 and
YES2 cell lines, in which the Wnt/β-catenin signaling pathway was
activated. Accordingly, miRNAs that regulate Wnt pathway genes in
exosomes may also be downregulated. This hypothesis may be
indirectly supported by data from Dempsey et al (50), who indicated that platelet exosomes
were enriched for miRNAs that regulated WNT pathways. By
transfecting miRs into endothelial cells, these platelet exosomal
miRNAs were able to inhibit WNT signaling in endothelial cells and
affect cell motility (50). In the
present study, the expressions of hsa-miR-339-5p and hsa-miR-409-3p
that regulated Wnt pathways genes were also significantly decreased
in the exosomes of OC cells, indicating their potential for OC
treatment through overexpression.
There are certain limitations to be acknowledged
when interpreting these results. Firstly, only 3 OC cell lines were
selected for screening crucial miRNAs. Therefore, the miRNAs
identified here may not represent miRNA candidates that are
potentially associated with all types of OC. Secondly, only 2
repeats were included in each sample of the microarray data used
(12), which may affect the results
of the statistical analysis. However, it may be acceptable to
perform bioinformatics analyses, as demonstrated by several
previous studies (51,52). Thirdly, the TCGA data did not include
the normal control, which led to several unexpected,
non-significant associations between the miRNAs identified in OC
cells and clinical characteristics. Additional clinical trials are
required to confirm the conclusions. Fourthly, although the
analysis of the present study has preliminarily demonstrated a
negative association between miRNAs and their target genes
(hsa-miR-409-3p and CTBP1, hsa-miR-339-5p and CHD8, and
hsa-miR-127-3p and PPP1CA) in clinical samples, in vitro and
in vivo experiments are necessary. Fifthly, the exosomal
mechanisms of these 3 miRNAs remain uninvestigated, which require
additional confirmation by using an exosome inhibitor, GW4869
(53).
In conclusion, the present study preliminarily
revealed that hsa-miR-127-3p, hsa-miR-339-5p and hsa-miR-409-3p may
be crucial for the development of OC in exosomal- and
non-exosomal-based pathways. They may be involved in OC by targeted
modulation of WNT (CTBP1 and CHD8) or the Proteoglycans in cancer
pathway (PPP1CA) genes. Upregulation of these genes may be a
potential therapeutic strategy for OC.
Acknowledgements
Not applicable.
Funding
No funding was received.
Availability of data and materials
The datasets generated and/or analyzed during the
current study are available in the NCBI database repository
(https://www.ncbi.nlm.nih.gov/geo/query/acc.cgi?acc=GSE76449).
Authors' contributions
SZ and YY participated in the design of this study.
XZ and XF performed the statistical and bioinformatics analyses.
SZ, WL, SX and YY contributed to the acquisition and interpretation
of data. SZ and YY drafted and revised the manuscript. All authors
read and approved the final manuscript.
Ethics approval and consent to
participate
Not applicable.
Consent for publication
Not applicable.
Competing interests
The authors declare that they have no competing
interests.
References
|
1
|
Chen W, Zheng R, Baade P, Zhang S, Zeng H,
Bray F, Jemal A, Yu XQ and He J: Cancer statistics in China, 2015.
CA-Cancer J Clin. 66:115–132. 2016. View Article : Google Scholar : PubMed/NCBI
|
|
2
|
Cliby WA, Powell MA, Al-Hammadi N, Chen L,
Miller Philip J, Roland PY, Mutch DG and Bristow RE: Ovarian cancer
in the United States: Contemporary patterns of care associated with
improved survival. Gynecol Oncol. 136:11–17. 2015. View Article : Google Scholar : PubMed/NCBI
|
|
3
|
Hausser J and Zavolan M: Identification
and consequences of miRNA-target interactions-beyond repression of
gene expression. Nat Rev Genet. 15:599–612. 2014. View Article : Google Scholar : PubMed/NCBI
|
|
4
|
Yang Z, Wang XL, Bai R, Liu WY, Li X, Liu
M and Tang H: miR-23a promotes IKKα expression but suppresses ST7L
expression to contribute to the malignancy of epithelial ovarian
cancer cells. Br J Cancer. 115:731–740. 2016. View Article : Google Scholar : PubMed/NCBI
|
|
5
|
Shen W, Song M, Liu J, Qiu G, Li T, Hu Y
and Liu H: MiR-26a promotes ovarian cancer proliferation and
tumorigenesis. PLoS One. 9:e868712014. View Article : Google Scholar : PubMed/NCBI
|
|
6
|
Dong P, Xiong Y, Watari H, Hanley SJ,
Konno Y, Ihira K, Yamada T, Kudo M, Yue J and Sakuragi N: MiR-137
and miR-34a directly target Snail and inhibit EMT, invasion and
sphere-forming ability of ovarian cancer cells. J Exp Clin Cancer
Res. 35:1322016. View Article : Google Scholar : PubMed/NCBI
|
|
7
|
Neviani P and Fabbri M: Exosomic microRNAs
in the tumor microenvironment. Front Med (Lausanne).
2:472015.PubMed/NCBI
|
|
8
|
Baroni S, Romero-Cordoba S, Plantamura I,
Dugo M, D'Ippolito E, Cataldo A, Cosentino G, Angeloni V, Rossini
A, Daidone MG and Iorio MV: Exosome-mediated delivery of miR-9
induces cancer-associated fibroblast-like properties in human
breast fibroblasts. Cell Death Dis. 7:e23122016. View Article : Google Scholar : PubMed/NCBI
|
|
9
|
Singh R, Pochampally R, Watabe K, Lu Z and
Mo YY: Exosome-mediated transfer of miR-10b promotes cell invasion
in breast cancer. Mol Cancer. 13:2562014. View Article : Google Scholar : PubMed/NCBI
|
|
10
|
Kobayashi M, Salomon C, Tapia J, Illanes
SE, Mitchell MD and Rice GE: Ovarian cancer cell invasiveness is
associated with discordant exosomal sequestration of Let-7 miRNA
and miR-200. J Transl Med. 12:42014. View Article : Google Scholar : PubMed/NCBI
|
|
11
|
Ying X, Wu Q, Wu X, Zhu Q and Wang X,
Jiang L, Chen X and Wang X: Epithelial ovarian cancer-secreted
exosomal miR-222-3p induces polarization of tumor-associated
macrophages. Oncotarget. 7:43076–43087. 2016. View Article : Google Scholar : PubMed/NCBI
|
|
12
|
Kanlikilicer P, Rashed MH, Bayraktar R,
Mitra R, Ivan C, Aslan B, Zhang X, Filant J, Silva AM,
Rodriguez-Aguayo C, et al: Ubiquitous release of exosomal tumor
suppressor miR-6126 from ovarian cancer cells. Cancer Res.
76:7194–7207. 2016. View Article : Google Scholar : PubMed/NCBI
|
|
13
|
De A, Powers B, De A, Zhou J, Sharma S,
Van Veldhuizen P, Bansal A, Sharma R and Sharma M: Emblica
officinalis extract downregulates pro-angiogenic molecules via
upregulation of cellular and exosomal miR-375 in human ovarian
cancer cells. Oncotarget. 7:31484–31500. 2016. View Article : Google Scholar : PubMed/NCBI
|
|
14
|
Smyth GK: Limma: Linear models for
microarray dataBioinform Comput Biol Solut Using R Bioconduct.
Gentleman R, Carey V, Dudoit S, Irizarry R and Huber W: Springer;
New York, NY: pp. 397–420. 2005
|
|
15
|
Kohl M, Wiese S and Warscheid B:
Cytoscape: Software for visualization and analysis of biological
networks. Methods Mol Biol. 696:291–303. 2011. View Article : Google Scholar : PubMed/NCBI
|
|
16
|
da Huang W, Sherman BT and Lempicki RA:
Systematic and integrative analysis of large gene lists using DAVID
bioinformatics resources. Nat Protoc. 4:44–57. 2009. View Article : Google Scholar : PubMed/NCBI
|
|
17
|
Kosary CL: FIGO stage, histology,
histologic grade, age and race as prognostic factors in determining
survival for cancers of the female gynecological system: An
analysis of 1973–87 SEER cases of cancers of the endometrium,
cervix, ovary, vulva, and vagina. Semin Surg Oncol. 10:31–46. 1994.
View Article : Google Scholar : PubMed/NCBI
|
|
18
|
Shimizu Y, Kamoi S, Amada S, Akiyama F and
Silverberg SG: Toward the development of a universal grading system
for ovarian epithelial carcinoma: Testing of a proposed system in a
series of 461 patients with uniform treatment and follow-up.
Cancer. 82:893–901. 1998. View Article : Google Scholar : PubMed/NCBI
|
|
19
|
Vasaikar SV, Straub P, Wang J and Zhang B:
LinkedOmics: Analyzing multi-omics data within and across 32 cancer
types. Nucleic Acids Res. 46(D1): D956–D963. 2018. View Article : Google Scholar : PubMed/NCBI
|
|
20
|
Zhang G, Liu Z, Xu H and Yang Q:
miR-409-3p suppresses breast cancer cell growth and invasion by
targeting Akt1. Biochem Biophys Res Commun. 469:189–195. 2016.
View Article : Google Scholar : PubMed/NCBI
|
|
21
|
Bi L, Yang Q, Yuan J, Miao Q, Duan L, Li F
and Wang S: MicroRNA-127-3p acts as a tumor suppressor in
epithelial ovarian cancer by regulating the BAG5 gene. Oncol Rep.
36:2563–2570. 2016. View Article : Google Scholar : PubMed/NCBI
|
|
22
|
Shan W, Li J, Bai Y and Lu X: miR-339-5p
inhibits migration and invasion in ovarian cancer cell lines by
targeting NACC1 and BCL6. Tumour Biol. 37:5203–5211. 2016.
View Article : Google Scholar : PubMed/NCBI
|
|
23
|
Arend RC, Londoño-Joshi AI, Straughn JM Jr
and Buchsbaum DJ: The Wnt/β-catenin pathway in ovarian cancer: A
review. Gynecol Oncol. 131:772–779. 2013. View Article : Google Scholar : PubMed/NCBI
|
|
24
|
Yoshioka S, King ML, Ran S, Okuda H,
MacLean JA II, Mcasey ME, Sugino N, Brard L, Watabe K and Hayashi
K: WNT7A regulates tumor growth and progression in ovarian cancer
through the WNT/β-catenin pathway. Mol Cancer Res. 10:469–482.
2012. View Article : Google Scholar : PubMed/NCBI
|
|
25
|
Usongo M, Li X and Farookhi R: Activation
of the canonical WNT signaling pathway promotes ovarian surface
epithelial proliferation without inducing β-catenin/Tcf-mediated
reporter expression. Dev Dyn. 242:291–300. 2013. View Article : Google Scholar : PubMed/NCBI
|
|
26
|
Puvirajesinghe TM, Bertucci F, Jain A,
Scerbo P, Belotti E, Audebert S, Sebbagh M, Lopez M, Brech A,
Finetti P, et al: Identification of p62/SQSTM1 as a component of
non-canonical Wnt VANGL2-JNK signalling in breast cancer. Nat
Commun. 7:103182016. View Article : Google Scholar : PubMed/NCBI
|
|
27
|
Deng Y, Deng H, Liu J, Han G, Malkoski S,
Liu B, Zhao R, Wang XJ and Zhang Q: Transcriptional down-regulation
of Brca1 and E-cadherin by CtBP1 in breast cancer. Mol Carcinog.
51:500–507. 2012. View
Article : Google Scholar : PubMed/NCBI
|
|
28
|
Wang R, Asangani IA, Chakravarthi BV,
Ateeq B, Lonigro RJ, Cao Q, Mani RS, Camacho DF, McGregor N,
Schumann TE, et al: Role of transcriptional corepressor CtBP1 in
prostate cancer progression. Neoplasia. 14:905–914. 2012.
View Article : Google Scholar : PubMed/NCBI
|
|
29
|
Nishiyama M, Skoultchi AI and Nakayama KI:
Histone H1 recruitment by CHD8 is essential for suppression of the
Wnt-β-catenin signaling pathway. Mol Cell Biol. 32:501–512. 2012.
View Article : Google Scholar : PubMed/NCBI
|
|
30
|
Sawada G, Ueo H, Matsumura T, Uchi R,
Ishibashi M, Mima K, Kurashige J, Takahashi Y, Akiyoshi S, Sudo T,
et al: CHD8 is an independent prognostic indicator that regulates
Wnt/β-catenin signaling and the cell cycle in gastric cancer. Oncol
Rep. 30:1137–1142. 2013. View Article : Google Scholar : PubMed/NCBI
|
|
31
|
Menon T, Yates JA and Bochar DA:
Regulation of androgen-responsive transcription by the chromatin
remodeling factor CHD8. Mol Endocrinol. 24:1165–1174. 2010.
View Article : Google Scholar : PubMed/NCBI
|
|
32
|
Jones DH and Lin DI: Amplification of the
NSD3-BRD4-CHD8 pathway in pelvic high-grade serous carcinomas of
tubo-ovarian and endometrial origin. Mol Clin Oncol. 7:301–307.
2017.PubMed/NCBI
|
|
33
|
Shingleton JR and Hemann MT: The chromatin
regulator CHD8 is a context-dependent mediator of cell survival in
murine hematopoietic malignancies. PLoS One. 10:e01432752015.
View Article : Google Scholar : PubMed/NCBI
|
|
34
|
MacLean JA II, King ML, Okuda H and
Hayashi K: WNT7A regulation by miR-15b in ovarian cancer. PLoS One.
11:e01561092016. View Article : Google Scholar : PubMed/NCBI
|
|
35
|
Deng Y, Deng H, Bi F, Liu J, Bemis LT,
Norris D, Wang XJ and Zhang Q: MicroRNA-137 targets
carboxyl-terminal binding protein 1 in melanoma cell lines. Int J
Biol Sci. 7:133–137. 2011. View Article : Google Scholar : PubMed/NCBI
|
|
36
|
Wang L, Madigan MC, Chen H, Liu F,
Patterson KI, Beretov J, O'Brien PM and Li Y: Expression of
urokinase plasminogen activator and its receptor in advanced
epithelial ovarian cancer patients. Gynecol Oncol. 114:265–272.
2009. View Article : Google Scholar : PubMed/NCBI
|
|
37
|
Dorn J, Harbeck N, Kates R, Gkazepis A,
Scorilas A, Soosaipillai A, Diamandis E, Kiechle M, Schmalfeldt B
and Schmitt M: Impact of expression differences of
kallikrein-related peptidases and of uPA and PAI-1 between primary
tumor and omentum metastasis in advanced ovarian cancer. Ann Oncol.
22:877–883. 2011. View Article : Google Scholar : PubMed/NCBI
|
|
38
|
Tang J, Wang J, Fan L, Li X, Liu N, Luo W,
Wang J and Wang Y and Wang Y: cRGD inhibits vasculogenic mimicry
formation by down-regulating uPA expression and reducing EMT in
ovarian cancer. Oncotarget. 7:24050–24062. 2016.PubMed/NCBI
|
|
39
|
Estrella VC, Eder AM, Liu S, Pustilnik TB,
Tabassam FH, Claret FX, Gallick GE, Mills GB and Wiener JR:
Lysophosphatidic acid induction of urokinase plasminogen activator
secretion requires activation of the p38MAPK pathway. Int J Oncol.
31:441–449. 2007.PubMed/NCBI
|
|
40
|
Li XF, Yan PJ and Shao ZM: Downregulation
of miR-193b contributes to enhance urokinase-type plasminogen
activator (uPA) expression and tumor progression and invasion in
human breast cancer. Oncogene. 28:3937–3948. 2009. View Article : Google Scholar : PubMed/NCBI
|
|
41
|
Li J, Kong F, Wu K, Song K, He J and Sun
W: miR-193b directly targets STMN1 and uPA genes and suppresses
tumor growth and metastasis in pancreatic cancer. Mol Med Rep.
10:2613–2620. 2014. View Article : Google Scholar : PubMed/NCBI
|
|
42
|
Xie C, Jiang XH, Zhang JT, Sun TT, Dong
JD, Sanders AJ, Diao RY, Wang Y, Fok KL, Tsang LL, et al: CFTR
suppresses tumor progression through miR-193b targeting urokinase
plasminogen activator (uPA) in prostate cancer. Oncogene.
32(2282–2291): 2291. e1–e7. 2013.
|
|
43
|
Kawabe T, Muslin AJ and Korsmeyer SJ:
HOX11 interacts with protein phosphatases PP2A and PP1 and disrupts
a G2/M cell-cycle checkpoint. Nature. 385:454–458. 1997. View Article : Google Scholar : PubMed/NCBI
|
|
44
|
Dessauge F, Cayla X, Albar JP, Fleischer
A, Ghadiri A, Duhamel M and Rebollo A: Identification of PP1alpha
as a caspase-9 regulator in IL-2 deprivation-induced apoptosis. J
Immunol. 177:2441–2451. 2006. View Article : Google Scholar : PubMed/NCBI
|
|
45
|
Hsu LC, Huang X, Seasholtz S, Potter DM
and Gollin SM: Gene amplification and overexpression of protein
phosphatase 1alpha in oral squamous cell carcinoma cell lines.
Oncogene. 25:5517–5526. 2006. View Article : Google Scholar : PubMed/NCBI
|
|
46
|
Nohata N, Hanazawa T, Kikkawa N, Sakurai
D, Fujimura L, Chiyomaru T, Kawakami K, Yoshino H, Enokida H,
Nakagawa M, et al: Tumour suppressive microRNA-874 regulates novel
cancer networks in maxillary sinus squamous cell carcinoma. Br J
Cancer. 105:833–841. 2011. View Article : Google Scholar : PubMed/NCBI
|
|
47
|
Shastry AH, Thota B, Srividya MR,
Arivazhagan A and Santosh V: Nuclear Protein Phosphatase 1 α (PP1A)
expression is associated with poor prognosis in p53 expressing
glioblastomas. Pathol Oncol Res. 22:287–292. 2016. View Article : Google Scholar : PubMed/NCBI
|
|
48
|
Noskova V, Ahmadi S, Asander E and Casslén
B: Ovarian cancer cells stimulate uPA gene expression in
fibroblastic stromal cells via multiple paracrine and autocrine
mechanisms. Gynecol Oncol. 115:121–126. 2009. View Article : Google Scholar : PubMed/NCBI
|
|
49
|
Lin F, Wang HJ, Li CX, Li H, Wang T, Nan
P, Qian HL and Zhan QM: Effects of esophageal cancer cell-derived
exosomes on cancer cell migration and invasion and its mechanism
research. Med J Chin PLA. 42:307–313. 2017.
|
|
50
|
Dempsey E, Dervin F and Maguire PB:
Platelet derived exosomes are enriched for specific microRNAs which
regulate WNT signalling in endothelial cells. Blood.
124:27602014.PubMed/NCBI
|
|
51
|
Zhang P, Garnett J, Creighton CJ, Al
Sannaa GA, Igram DR, Lazar A, Liu X, Liu C and Pollock RE:
EZH2-miR-30d-KPNB1 pathway regulates malignant peripheral nerve
sheath tumour cell survival and tumourigenesis. J Pathol.
232:308–318. 2014. View Article : Google Scholar : PubMed/NCBI
|
|
52
|
Li B, Jiang S, Yu X, Cheng C, Chen S,
Cheng Y, Yuan JS, Jiang D, He P and Shan L: Phosphorylation of
trihelix transcriptional repressor ASR3 by MAP KINASE4 negatively
regulates Arabidopsis immunity. Plant Cell. 27:839–856. 2015.
View Article : Google Scholar : PubMed/NCBI
|
|
53
|
Rashed MH, Kanlikilicer P,
Rodriguez-Aguayo C, Pichler M, Bayraktar R, Bayraktar E, Ivan C,
Filant J, Silva A, Aslan B, et al: Exosomal miR-940 maintains
SRC-mediated oncogenic activity in cancer cells: A possible role
for exosomal disposal of tumor suppressor miRNAs. Oncotarget.
8:20145–20164. 2017. View Article : Google Scholar : PubMed/NCBI
|