Introduction
Hepatocellular carcinoma (HCC) is a global health
problem, and it is a major cause of mortality in cirrhotic patients
(1–3).
Patients with liver cirrhosis are strongly recommended to undergo
routine liver imaging for surveillance of HCC (4). According to current guidelines, HCC can
be diagnosed using typical imaging criteria, including
hypervascularity in the hepatic arterial phase and washout in a
later phase on dynamic contrast-enhanced computed tomography (CT)
and/or magnetic resonance imaging (MRI) (5–8). To
improve the consistency of imaging diagnosis of HCC, the American
College of Radiology has released a standardized reporting and data
collection system known as Liver Imaging Reporting and Data System
(LI-RADS) in 2011 (9). When the
guideline was updated in 2014, hepatobiliary contrast agents,
including gadoxetate acid (Gd-EOB-DTPA) and gadobenate dimeglumine
(Gd-BOPTA) were incorporated into the system (10). However, findings in the hepatobiliary
phase (HBP) are ancillary features that can be applied to upgrade
or downgrade categories using tie-breaking rules (11). This can be used up to LI-RADS 4 but
not beyond (12).
Recently, Chen et al (13) reported that hypointensity in HBP may
be a criterion that can improve the sensitivity of LI-RADS in HCC
diagnosis where Gd-EOB-DTPA-enhanced MR with HBP imaging and a
modified 2014 version of the LI-RADS were used. Although LI-RADS is
essential for the diagnosis of HCC (14), the diagnostic performance of
Gd-EOB-DTPA-enhanced MRI in nodules of different diameter has not
been addressed. The definition of LI-RADS 4 category nodules is
probably HCC. The most important factor when diagnosing a focal
liver lesion is to differentiate between LI-RAD category 4 and 5
nodules, where LI-RADS category 5 is definitely HCC and LI-RADS
category 4 is probably HCC (15).
Therefore, the present study aims to evaluate the diagnostic
performance of Gd-EOB-DTPA dynamic contrast-enhanced MRI of LI-RADS
4 hepatic nodules of various diameters.
Materials and methods
Patient selection
This retrospective study was approved by the
Institutional Review Board in accordance with the approved
guidelines from the Second Xiangya Hospital of Central South
University (Hunan, China) and was compliant with Health Insurance
Portability and Accountability Act (HIPAA). Written informed
consent was obtained from all patients.
A search of the Picture Archiving and Communication
Systems (the Second Xiangya Hospital of Central South University)
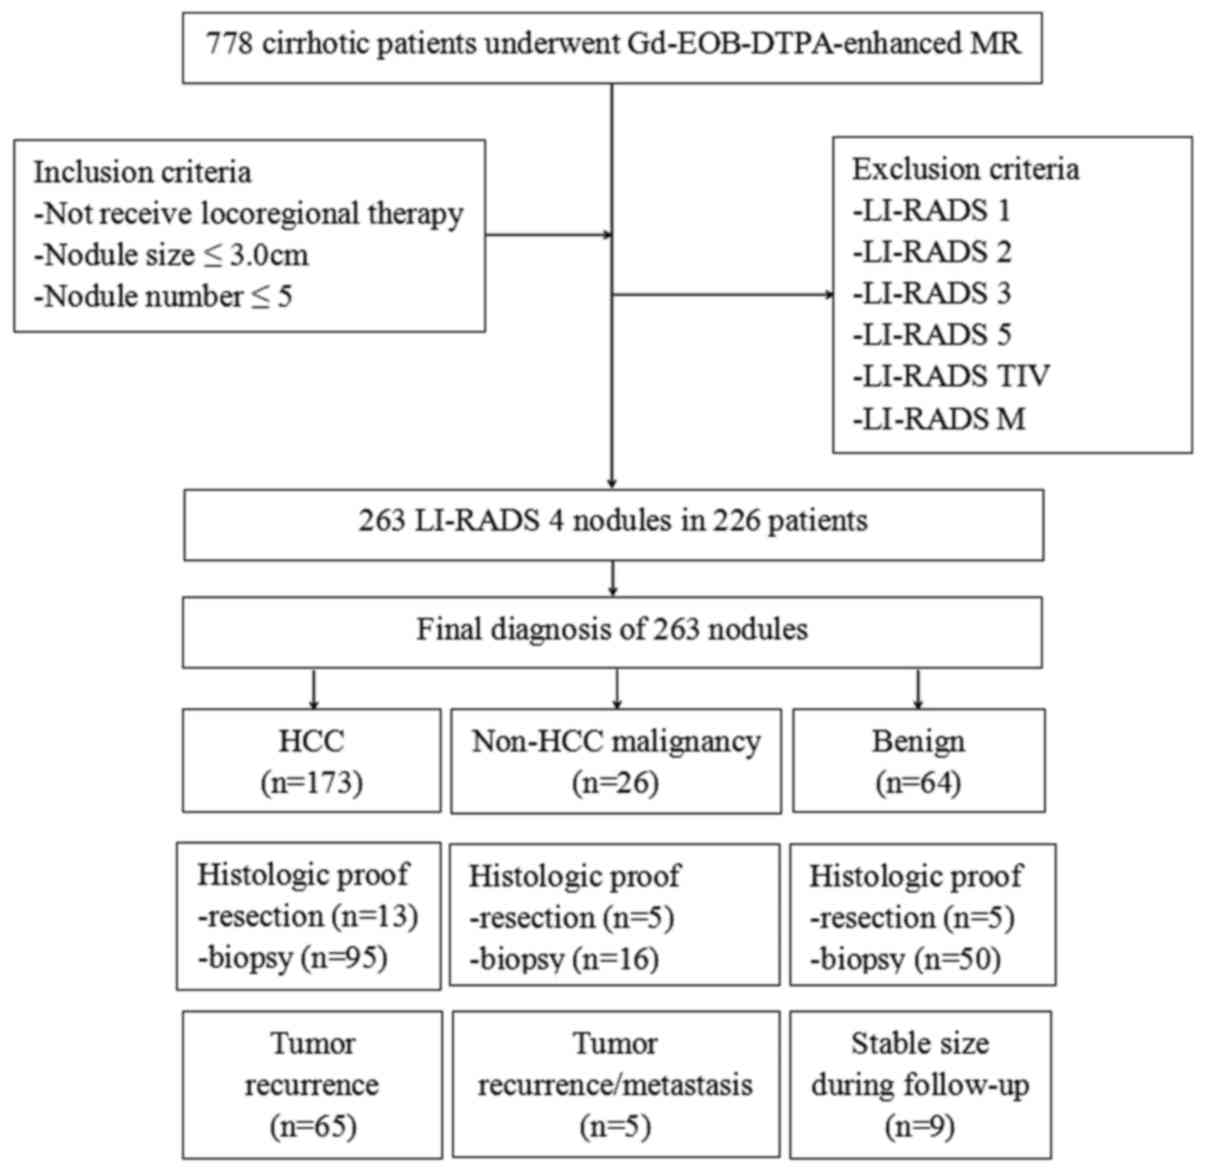
was performed between October 2012 and June 2016. A total of 778
patients with chronic liver cirrhosis who underwent
Gd-EOB-DTPA-enhanced MRI for the detection of suspected liver
lesions were enrolled. As one of the primary criteria of using
LI-RADS is that the patients are of cirrhotic background, only
patients with liver cirrhosis were included (16). The inclusion criteria were as follows:
i) Patients have not received locoregional therapy, including
transarterial chemoembolization or radiofrequency ablation (RFA),
ii) nodule size was ≤30 mm, iii) and number of nodules was ≤5 on
MRI. Each nodule was assigned to a LI-RADS category according to
the 2017 version of LI-RADS: LI-RADS 1, definitely benign; LI-RADS
2, probably benign; LI-RADS 3, intermediate probability of HCC;
LI-RADS 4, probably HCC, LI-RADS 5, definitely HCC, LI-RADS TIV,
definitely tumor in vein and LI-RADS M, probably malignant, not
specific for HCC (17). Only LI-RADS
4 nodules were included in the present study. After applying the
inclusion criteria, the study population comprised 224 patients
with 263 nodules. The study population consisted of 138 males and
86 females with an age range of 26–81 years and a mean age of
53.3±17.1 years.
MR imaging technique
MR imaging was performed using a clinical 3.0 Tesla
superconducting MR system (MAGNETOM Skyra; Siemens Healthineers,
Erlangen, Germany) with an 18-channel body matrix coil and an
inbuilt 24-channel spine matrix coil. The comprehensive MRI
protocol, including T1-weighted fat saturation gradient recalled
echo sequence and T2-weighted half-Fourier acquisition single-shot
turbo spin-echo sequence, were obtained prior to the administration
of Gd-EOB-DTPA (Bayer Schering Pharma, Berlin, Germany). Dynamic
contrast-enhanced MRI was performed using a combination of volume
interpolated breath-hold examination (VIBE) with controlled
aliasing in parallel imaging results in higher acceleration
(CAIPIRINHA), view-sharing time-resolved imaging with interleaved
stochastic trajectories (TWIST), Dixon fat suppression
(CAIPIRINHA-Dixon-TWIST-VIBE and CDT-VIBE) in the unenhanced phase,
arterial phase, portovenous phase (90 secs), transitional phase
(180 secs) and HBP (20 min). In order to ensure that the same
contrast-enhanced phase is attained in each patient, a MR automated
injector pump was used to administer Gd-EOB-DTPA through an
18-gauge cubital intravenous access at a dose of 0.1 ml/kg body
weight and an injection rate of 1 ml/sec. The MR parameters are
listed in Table I.
 | Table I.Magnetic resonance sequence
parameters. |
Table I.
Magnetic resonance sequence
parameters.
| Parameters | CDT-VIBE | T2 HASTE |
|---|
| TR/TE, msec | 3.8/1.2 | 2,000/80 |
| Subphases | 5 | 1 |
| Sequence type | TWIST-VIBE | HASTE |
| Voxel size,
mm3 | 1.3×1.3×3.0 | 1.3×1.3×3.0 |
| FOV, mm | 380 | 380 |
| Slice number | 72 | 72 |
| Flip angle,
degree | 9 | 180 |
| Respiratory
control | Breath hold | Triggered |
| Fat
suppression | Dixon | Spectral
saturation |
| Temporal
resolution, s | 2.6 | – |
| TWIST size of
k-center, % | 20 | – |
| TWIST size of
k-periphery, % | 25 | – |
| Breath-holding
time, sec | 20 | 10–15 |
Imaging analysis
A total of two radiologists with 20-years and
12-years liver imaging experience randomly and independently
reviewed all images. Both radiologists were blinded to the LI-RADS
category and the final diagnosis of each nodule. The major criteria
of LI-RADS, including arterial phase enhancement patterns, nodule
diameter, presence or absence of washout in the portal venous
phase, presence or absence of capsule and threshold growth, were
evaluated. Due to early liver parenchymal enhancement following the
administration of Gd-EOB-DTPA, only portal venous phase
hypo-intensity and not transitional phase hypo-intensity was
considered as a washout appearance. Ancillary features that favored
malignancy, including transitional phase hypo-intensity,
mild-moderate T2 hyper-intensity, restricted diffusion, mosaic
architecture, nodule-in-nodule architecture, corona enhancement and
intralesional fat were also reviewed. The images were reviewed
independently, and the diagnosis of each nodule was made in
consensus between the two radiologists.
Statistical analysis
Statistical analysis was performed using software
SPSS (version 20.0; IBM Corp., Armonk, NY, USA). A Cohen's kappa
test was performed to evaluate the inter-reader agreement of
LI-RADS major criteria, including arterial phase enhancement
patterns, presence or absence of washout in the portal venous
phase, presence or absence of capsule and HBP enhancement patterns.
Intraclass correlation coefficient (ICC) was performed to evaluate
the inter-reader agreement of nodules diameter measurement.
Agreement was classified as poor (K, 0–0.40), fair to good (K,
0.40–0.75) or excellent (K, >0.75). According to the results by
the two radiologists, nodules diagnosed as probably or definitely
HCC were positive results, and probably or definitely not HCC
nodules were negative results. The sensitivity, specificity,
positive predictive value (PPV) and negative predictive value (NPV)
for the diagnosis of HCC nodules of different diameters using
LI-RADS 4 were calculated and expressed with 95% confidence
intervals (CI). The false positive rate (FPR) was also
calculated.
Results
Patient characteristics
The study population consisted of 138 males and 86
females, with an age range of 26–81 years and a mean age of
53.3±17.1 years. Of the 263 nodules, the diameter of the 173 HCC
nodules was 22.4±7.1 mm. The diameter of the 26 non-HCC malignant
nodules was 16.6±6.5 mm, and the diameter of the remaining 64
benign nodules was 12.7±4.3 mm. The HCC nodules were significantly
larger compared with the non-HCC malignant nodules (P<0.05) and
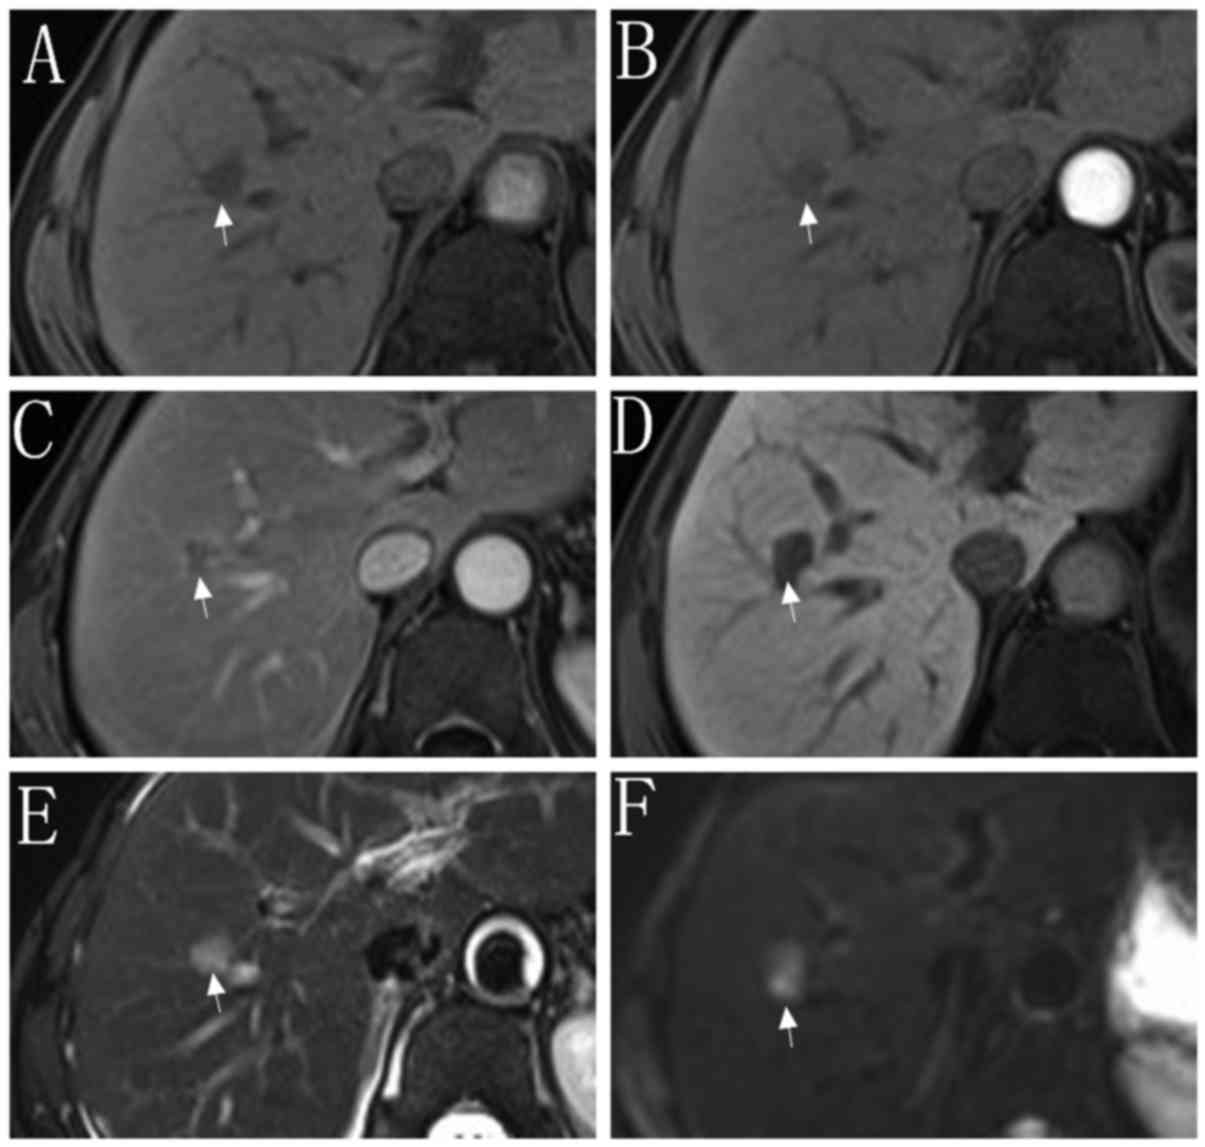
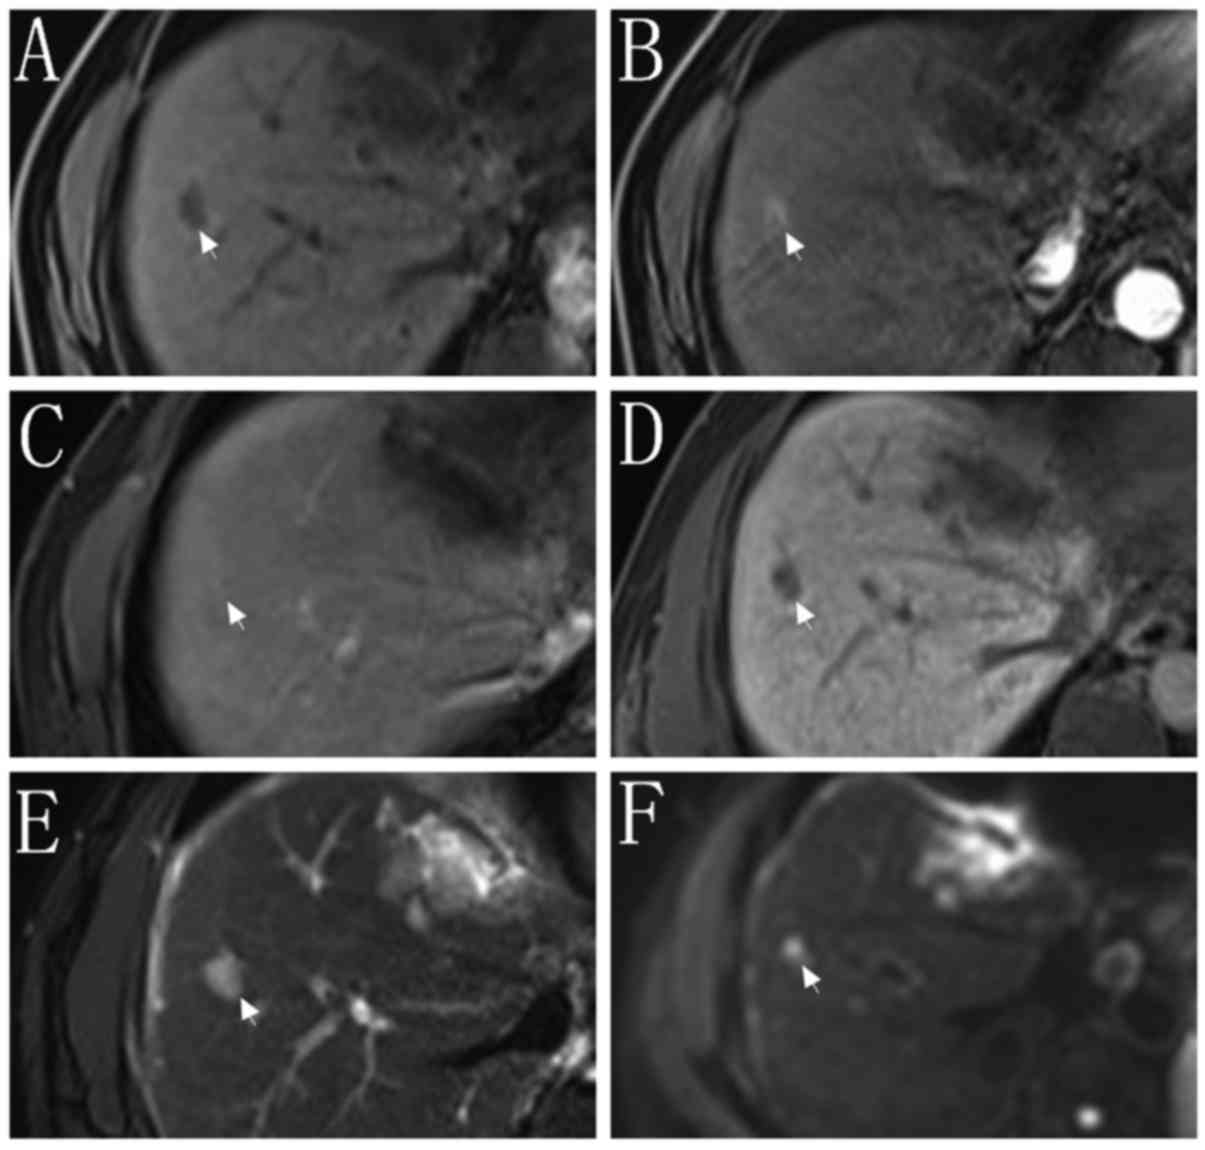
benign nodules (P<0.05). The 2017 version of LI-RADS categorizes
nodules primarily based on the arterial phase enhancement patterns
(17). In accordance with LI-RADS,
the data on 263 nodules were divided into two datasets: Set 1
(n=86) that contain nodules with iso/hypo-intensity at the arterial
phase (HCC, n=42; non-HCC, n=44) and set 2 (n=177) that contain
nodules with hyper-intensity at the arterial phase (HCC, n=131;
non-HCC, n=46). The typical imaging appearance of sets 1 and 2 are
indicated in Figs. 1 and 2, respectively. Of the 86 nodules in set 1,
37 nodules were <20 mm in diameter (set 1A), and 49 nodules were
20–30 mm in diameter (set 1B). Of the 177 nodules in set 2, 68
nodules were <10 mm in diameter (set 2A) and 73 nodules were
10–19 mm in diameter (set 2B). A further 36 nodules were 20–30 mm
in diameter (set 2C). The detailed information is listed in
Table II.
| Table II.Clinical characteristics of 263
nodules. |
Table II.
Clinical characteristics of 263
nodules.
| Variables | Total (n=263) |
|---|
| Diameter of
nodules, mm | – |
|
HCC | 22.4±7.1 |
| Non-HCC
malignancy | 16.6±6.5 |
|
Benign | 12.7±4.3 |
| Number of nodules,
HCC/non-HCC | – |
| Set
1 | 42/44 |
| Set
1A | 15/22 |
| Set
1B | 27/22 |
| Set 2 | 131/46 |
| Set
2A | 50/18 |
| Set
2B | 53/20 |
| Set
2C | 28/8 |
Inter-reader agreement between two
reviewers
Cohen's Kappa test and the ICC indicated that
inter-reader agreement of the LI-RADS major criteria and HBP
imaging ranged from fair to good to excellent. Specifically, the
measurements for nodule diameter exhibited excellent agreement
between LI-RADS and HBP imaging with an ICC value of 0.951. Other
characteristics, including HBP enhancement patterns, arterial phase
enhancement patterns and presence or absence of washout, exhibited
excellent inter-reader agreement with K values of 0.937, 0.814 and
0.762, respectively. Finally, the presence or absence of capsule
exhibited fair to good agreement with a K value of 0.681.
Final diagnosis of the nodules
Each of the 263 nodules in 224 patients was
conclusively diagnosed as HCC (173 nodules in 146 patients) or
non-HCC (90 nodules in 78 patients). The 90 non-HCC nodules were
further diagnosed as follows: High-grade dysplastic nodules (HGDN),
22 nodules in 22 patients; low-grade dysplastic nodules (LGDN), 16
nodules in 16 patients; regenerative nodules, 14 nodules in 13
patients; liver metastasis, 14 nodules in 9 patients; atypical
hemangioma, 7 nodules in 6 patients; atypical intrahepatic
cholangiocarcinoma, 10 nodules in 7 patients; combined
cholangiocarcinoma/HCC (cHCC-CCCs), 2 nodules in 2 patients and
hepatocellular adenoma, 5 nodules in 3 patients. The final
diagnosis of the nodules was made based on histologic proof
(surgical resection, n=23; biopsy, n=161), follow-up >12 months
(n=9) or tumor recurrence/metastasis following treatment (n=70). Of
the 173 HCC nodules, 108 nodules were confirmed by histologic proof
(surgical resection, n=13; biopsy, n=95), while 65 nodules appeared
during tumor recurrence following treatment. Of the 90 non-HCC
nodules, 76 nodules were confirmed by histologic proof (surgical
resection, n=10; biopsy, n=66), 9 nodules were of a stable size
during follow-up, and 5 nodules appeared during tumor
recurrence/metastasis following treatment. A flowchart of the study
population is shown in Fig. 3.
Diagnostic performance in each
subgroup
Based on the final diagnosis of all 263 nodules, the
diagnosis of 123 nodules were true positive (TP), 40 nodules were
false positive (FP) and 50 nodules were false negative (FN)
results. The remaining 50 nodules were true negative (TN) results.
The detailed results are listed in Table III.
| Table III.Results of nodules according to the
final diagnosis. |
Table III.
Results of nodules according to the
final diagnosis.
| Groups | TP | FP | FN | TN |
|---|
| Set 1A, n | 9 | 14 | 6 | 8 |
| Set 1B, n | 20 | 9 | 7 | 13 |
| Set 2A, n | 31 | 9 | 19 | 9 |
| Set 2B, n | 37 | 7 | 16 | 13 |
| Set 2C, n | 26 | 1 | 2 | 7 |
| Entire population,
n | 123 | 40 | 50 | 50 |
For the diagnosis of HCC, the sensitivity,
specificity, PPV and NPV of Gd-EOB-DTPA-enhanced MR for the entire
study population were 71.1% (95% CI, 63.6–77.6), 55.6% (95% CI,
44.7–65.9), 75.5% (95% CI, 68.0–81.7) and 50% (95% CI, 39.9–60.1),
respectively. For set 1B, the sensitivity, specificity, PPV and NPV
were 74.1% (20/27), 59.1% (13/22), 69.0% (20/29) and 65.0% (13/20),
respectively. For set 2C, the sensitivity, specificity, PPV and NPV
were 92.8% (26/28), 87.5% (7/8), 96.3% (26/27) and 77.8% (7/9),
respectively. When the diagnostic performance of set 1 and set 2
was compared, set 2 exhibited relatively higher sensitivity,
specificity, PPV, and NPV compared with set 1 in each subgroup. The
diagnostic performance of Gd-EOB-DTPA-enhanced MR of nodules with
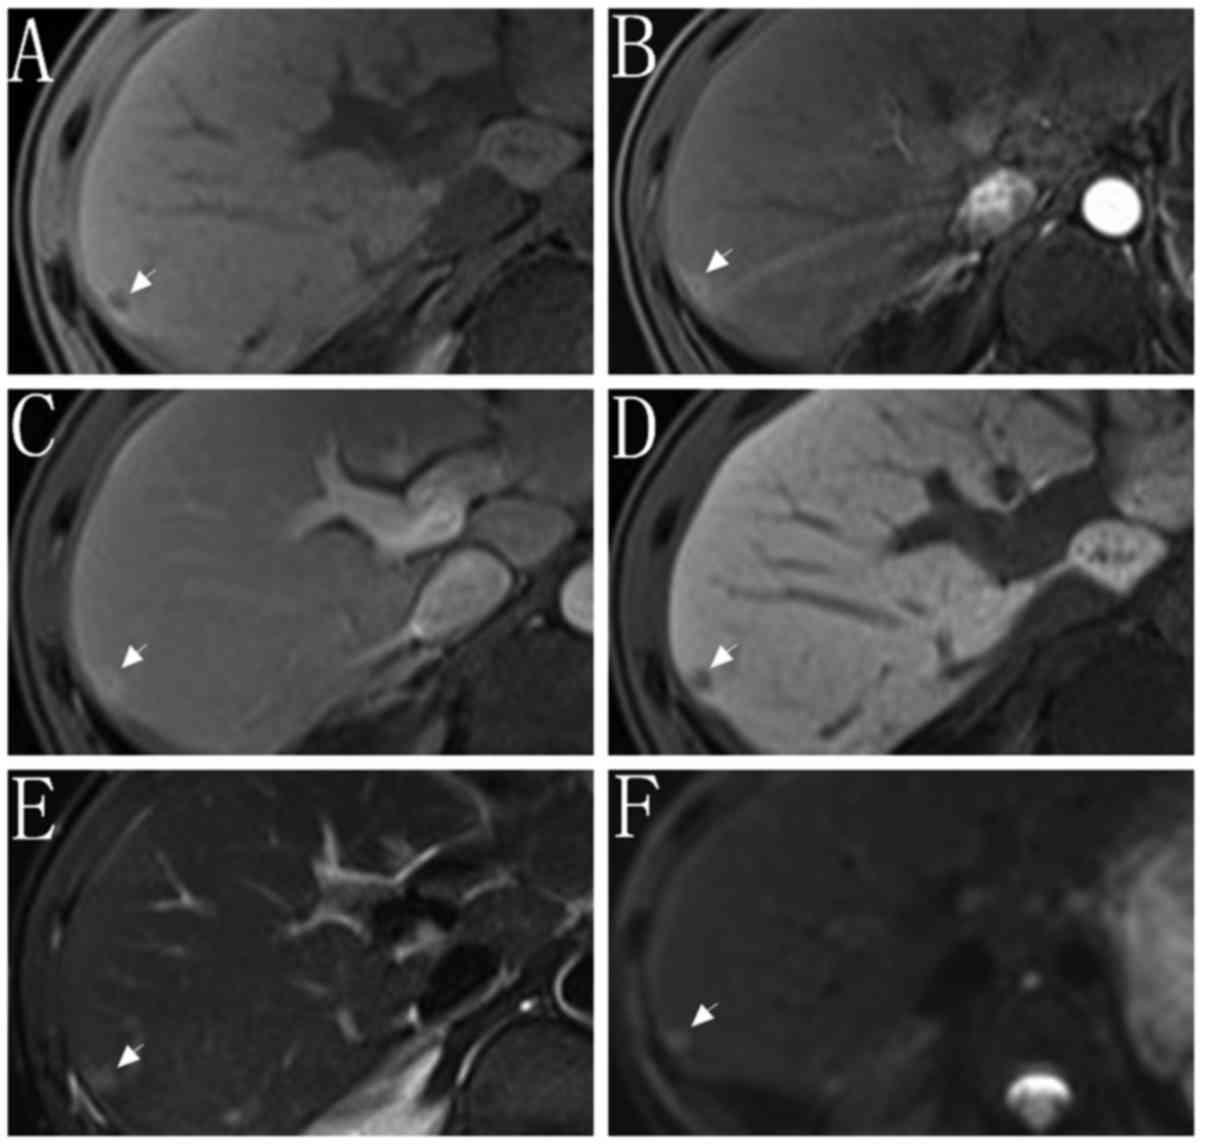
different diameters in set 1 and set 2 are summarized in Table IV. For FPR, the nodules in set 2C
exhibited the lowest FPR within all subgroups (12.5%, 1/8). A MRI
image of a false positive result is indicated in Fig. 4.
| Table IV.Diagnostic performance of
Gd-EOB-DTPA-enhanced MR for LI-RADS 4 nodules. |
Table IV.
Diagnostic performance of
Gd-EOB-DTPA-enhanced MR for LI-RADS 4 nodules.
|
| Set 1, % (95%
CI) | Set 1B, % | Set 2A, % | Set 2B, % | Set 2C, % |
|---|
| Sensitivity | 60.0
(32.9–82.5) | 74.1
(53.4–88.1) | 62.0
(47.2–75.0) | 69.8
(55.5–81.3) | 92.8
(75.0–98.7) |
| Specificity | 36.4
(18.0–59.1) | 59.1
(36.7–78.5) | 50.0
(26.8–73.2) | 65.0
(40.9–83.7) | 87.5
(46.7–99.3) |
| PPV | 39.1
(20.5–61.2) | 69.0
(49.0–84.0) | 77.5
(66.1–88.6) | 84.1
(69.3–92.8) | 96.3
(79.1–99.8) |
| NPV | 57.1
(29.6–81.2) | 65.0
(40.9–83.7) | 32.1
(16.6–52.4) | 44.8
(26.9–64.0) | 77.8
(40.2–96.0) |
Discussion
Small hepatic lesions can be more challenging to
characterize. Several studies have shown that small intrahepatic
cholangiocarcinoma, hemangioma, and metastases may mimic the
enhancement characteristics of HCC (18–20).
Unlike the LI-RADS 5 category, which has a low cut-off value for
diameter (1 cm), LI-RADS 4 applies the same high probability of HCC
for lesions of varying sizes, including those with a diameter of
<1 cm. It is unclear if the malignancy rate and predictive
ability of LI-RADS 4 should apply to small (<2 cm) and large
lesions (>2 cm) or whether specific features such as a
combination of HBP hypointensity and arterial phase
hyper-enhancement may provide a means for improving
specificity.
The results indicated that, Gd-EOB-DTPA-enhanced MR
provides higher diagnostic performance for nodules of a larger size
(>2 cm) than a smaller size (<2 cm). In a previous study on
the diagnosis of HCC, Chen et al (13) showed that HBP hypointensity was a
major criterion of LI-RADS that could provide sensitivity,
specificity, PPV, and NPV of 95, 96, 99 and 87%, respectively. The
results in the present study differ from the findings of Chen et
al (13). In the present study,
the diagnostic performance is as high as the values reported in
Chen et al (13) but only for
nodules with a diameter of 20–30 mm with sensitivity, specificity,
PPV, and NPV of 92.8, 87.5, 96.3 and 77.8%, respectively.
Differences in the inclusion criteria used in the two studies may
account for this discrepancy. The study by Chen et al
(13) included LI-RADS 1–5 category
nodules, while only the LI-RADS 4 category nodules are included in
the present study, which may affect sensitivity and specificity
calculation. Notably, a previous study conducted by Darnell et
al (21) revealed that in
cirrhosis patients for the diagnosis of HCC, the MRI findings of
LI-RADS 4 and 5 category nodules have a sensitivity of 65.4% and
specificity of 98.2%. However, the sensitivity value in the present
study is higher than the value reported by Darnell et al
(21) (92.8% vs. 65.4%). Conversely,
the specificity is lower in the present study (87.5% vs. 98.2%),
which may be due to the different contrast agents used in the two
studies (Gd-EOB-DTPA vs. gadodiamide.
We analyzed FPR to determine which types of nodules
were more easily misdiagnosed as HCC. It was detected that nodules
with a diameter of 20–30 mm with a hypervascular pattern exhibited
the lowest FPR (12.5%, 1/8). However for nodules with a diameter of
<10 mm, the FPR was as high as 63.6% (14/22). Although it has
been reported that Gd-EOB-DTPA-enhanced MRI is able to detect
hypovascular lesions (22–24), nodules with arterial phase enhancement
remains a primary element for HCC. One of the main false positive
results for hypovascular nodules is dysplastic nodule. A high HGDN,
in its initial phase of carcinogenesis, can present as
hypo-intensity in the arterial phase with gradual enhancement in
portal venous phase due to the presence of portal perfusion
(25). With the increase of
intra-nodular arterial vascularity, the enhancement pattern for
HGDN tends to be hypervascularity (26). This is the main reason that HGDN
mimicked HCC in the present study. The other main false positive
result is intrahepatic cholangiocarcinoma. It has been reported
that the most frequent enhancement pattern for intrahepatic
cholangiocarcinoma in normal liver is a thin peripheral rim with
internal heterogeneous enhancement during the dynamic phase
(27). However, intrahepatic
cholangiocarcinoma in patients with or without liver cirrhosis may
differ in enhancement pattern (28).
In patients with liver cirrhosis, intrahepatic cholangiocarcinoma
is often characterized as a stable enhancement pattern,
particularly for nodules <20 mm in diameter (29,30). In
the present study, the majority of intrahepatic cholangiocarcinoma
cases present a similar enhancement pattern to the previous studies
(31). Hemangioma is another notable
false positive result. The typical enhancement pattern for
hemangioma is delayed phase enhancement on extracellular contrast
agent based-enhanced imaging (32).
However, previous studies report that a ‘pseudo washout’ sign can
be observed in hemangioma during the transitional phase using
Gd-EOB-DTPA as the contrast agent, probably owing to the excellent
liver to lesion contrast when compared to extracellular contrast
agent (33,34). In the present study, ‘pseudo washout’
sign is also observed in some cases. This false appearance may lead
to the misdiagnosis of HCC. In order to avoid misdiagnosis, only
hypo-intensity in the portal venous phase was considered as a
‘washout’.
There are several limitations in the present study.
Firstly, as the study was performed retrospectively, there may have
been selection bias in the study population. In addition, the study
sample was relatively small, which may lead to statistical error.
Secondly, the histological proof for HCC diagnosis was not obtained
for the entire study population, particularly for benign nodules,
including hemangioma and adenoma, which were diagnosed by clinical
observation and imaging features (35). Clinical diagnostic references,
including tumor recurrence following treatment, may not be adequate
for HCC diagnosis. Therefore, a prospective study with a large
sample size and histologic proof for all nodules should be
performed in the future. In addition, the imaging features of
nodules with different diameters were not evaluated. Further
studies may focus on this issue. Finally, receiver operating
characteristic curves were not used to evaluate the diagnostic
performance of Gd-EOB-DTPA-enhanced MRI for LI-RADS 4 category
nodules, as this method is often used for continuous variables
(36).
In conclusion, Gd-EOB-DTPA-enhanced MRI is useful
for the diagnosis of HCC LI-RADS 4 category nodules. However, the
diagnostic performance of Gd-EOB-DTPA-enhanced MRI for LI-RADS 4
category nodules of different diameters is variable. For
hypervascular LI-RADS 4 category nodules with diameter >20 mm,
Gd-EOB-DTPA-enhanced MRI is useful for the diagnosis of HCC.
However, for hypovascular LI-RADS 4 category nodules with diameter
<20 mm, Gd-EOB-DTPA-enhanced MRI may be of limited use due to
low diagnostic performance and high FPR.
Acknowledgements
Not applicable.
Funding
No funding was received.
Availability of data and materials
The datasets used and/or analyzed during the current
study are available from the corresponding author on reasonable
request.
Authors' contributions
QT and CM analyzed and interpreted the patient data.
CM was a major contributor in writing the manuscript, and agreed to
be accountable for all aspects of the work ensuring that questions
related to the accuracy or integrity of any part of the work are
appropriately investigated and resolved. All authors read and
approved the final manuscript.
Ethics approval and consent to
participate
This retrospective study was approved by the
Institutional Review Board in accordance with the approved
guidelines from The Second XiangYa Hospital of Central South
University (Hunan, China) and was compliant with Health Insurance
Portability and Accountability Act (HIPAA).
Consent for publication
Written informed consent was obtained from all
patients.
Competing interests
The authors declare that they have no competing
interests.
Glossary
Abbreviations
Abbreviations:
|
MR
|
magnetic resonance
|
|
LI-RADS
|
Liver Imaging Reporting and Data
System
|
|
HCC
|
hepatocellular carcinoma
|
|
PPV
|
positive predictive value
|
|
NPV
|
negative predictive value
|
|
FPR
|
false positive rate
|
|
CT
|
computed tomography
|
|
Gd-EOB-DTPA
|
gadoxetate acid
|
|
HBP
|
hepatobiliary phase
|
|
RFA
|
radiofrequency ablation
|
|
ICC
|
intraclass correlation coefficient
|
|
HGDN
|
high-grade dysplastic nodules
|
|
LGDN
|
low-grade dysplastic nodules
|
|
cHCC-CCCs
|
combined cholangiocarcinoma and
hepatocellular carcinoma
|
|
TP
|
true positive
|
|
FP
|
false positive
|
|
FN
|
false negative
|
|
TN
|
true negative
|
References
|
1
|
Purysko AS, Remer EM, Coppa CP, Leao HM,
Thupili CR and Veniero JC: LI-RADS: A case-based review of the new
categorization of liver findings in patients with end-stage liver
disease. Radiographics. 32:1977–1995. 2012. View Article : Google Scholar : PubMed/NCBI
|
|
2
|
Wallace MC, Preen D, Jeffrey GP and Adams
LA: The evolving epidemiology of hepatocellular carcinoma: A global
perspective. Expert Rev Gastroenterol Hepatol. 9:765–779.
2015.PubMed/NCBI
|
|
3
|
Yan M, Ha J, Aguilar M, Bhuket T, Liu B,
Gish RG, Cheung R and Wong RJ: Birth cohort-specific disparities in
hepatocellular carcinoma stage at diagnosis, treatment, and
long-term survival. J Hepatol. 64:326–332. 2016. View Article : Google Scholar : PubMed/NCBI
|
|
4
|
Goldberg DS, Valderrama A, Kamalakar R,
Sansgiry SS, Babajanyan S and Lewis JD: Hepatocellular carcinoma
surveillance among cirrhotic patients with commercial health
insurance. J Clin Gastroenterol. 50:258–265. 2016. View Article : Google Scholar : PubMed/NCBI
|
|
5
|
Bruix J and Sherman M: Management of
hepatocellular carcinoma: An update. Hepatology. 53:1020–1022.
2011. View Article : Google Scholar : PubMed/NCBI
|
|
6
|
Davenport MS, Khalatbari S, Liu PS,
Maturen KE, Kaza RK, Wasnik AP, Al-Hawary MM, Glazer DI, Stein EB,
Patel J, et al: Repeatability of diagnostic features and scoring
systems for hepatocellular carcinoma by using MR imaging.
Radiology. 272:132–142. 2014. View Article : Google Scholar : PubMed/NCBI
|
|
7
|
Leoni S, Piscaglia F, Golfieri R, Camaggi
V, Vidili G, Pini P and Bolondi L: The impact of vascular and
nonvascular findings on the noninvasive diagnosis of small
hepatocellular carcinoma based on the EASL and AASLD criteria. Am J
Gastroenterol. 105:599–609. 2010. View Article : Google Scholar : PubMed/NCBI
|
|
8
|
Khalili K, Kim TK, Jang HJ, Haider MA,
Khan L, Guindi M and Sherman M: Optimization of imaging diagnosis
of 1–2 cm hepatocellular carcinoma: An analysis of diagnostic
performance and resource utilization. J Hepatol. 54:723–728. 2011.
View Article : Google Scholar : PubMed/NCBI
|
|
9
|
Santillan C, Chernyak V and Sirlin C:
LI-RADS categories: Concepts, definitions, and criteria. Abdom
Radiol (NY). 43:101–110. 2018. View Article : Google Scholar : PubMed/NCBI
|
|
10
|
Santillan C, Fowler K, Kono Y and Chernyak
V: LI-RADS major features: CT, MRI with extracellular agents, and
MRI with hepatobiliary agents. Abdom Radiol (NY). 43:75–81. 2018.
View Article : Google Scholar : PubMed/NCBI
|
|
11
|
Cha DI, Jang KM, Kim SH, Kang TW and Song
KD: Liver imaging reporting and data system on CT and gadoxetic
acid-enhanced MRI with diffusion-weighted imaging. Eur Radiol.
27:4394–4405. 2017. View Article : Google Scholar : PubMed/NCBI
|
|
12
|
Granata V, Fusco R, Avallone A, Catalano
O, Filice F, Leongito M, Palaia R, Izzo F and Petrillo A: Major and
ancillary magnetic resonance features of LI-RADS to assess HCC: An
overview and update. Infect Agent Cancer. 12:232017. View Article : Google Scholar : PubMed/NCBI
|
|
13
|
Chen NX, Motosugi U, Morisaka H, Ichikawa
S, Sano K, Ichikawa T Matsuda M, Fujii H and Onishi H: Added value
of a gadoxetic acid-enhanced hepatocyte-phase image to the LI-RADS
system for diagnosing hepatocellular carcinoma. Magn Reson Med Sci.
15:49–59. 2016. View Article : Google Scholar : PubMed/NCBI
|
|
14
|
Abd Alkhalik Basha M, Abd El, Aziz El,
Sammak D and El Sammak AA: Diagnostic efficacy of the liver
imaging-reporting and data system (LI-RADS) with CT imaging in
categorising small nodules (10–20 mm) detected in the cirrhotic
liver at screening ultrasound. Clin Radiol. 72:901.e1–901.e11.
2017. View Article : Google Scholar
|
|
15
|
Mitchell DG, Bruix J, Sherman M and Sirlin
CB: LI-RADS (Liver Imaging Reporting and Data System): Summary,
discussion, and consensus of the LI-RADS management working group
and future directions. Hepatology. 61:1056–1065. 2015. View Article : Google Scholar : PubMed/NCBI
|
|
16
|
Santillan CS, Tang A, Cruite I, Shah A and
Sirlin CB: Understanding LI-RADS: A primer for practical use. Magn
Reson Imaging Clin N Am. 22:337–352. 2014. View Article : Google Scholar : PubMed/NCBI
|
|
17
|
Elsayes KM, Hooker JC, Agrons MM, Kielar
AZ, Tang A, Fowler KJ, Chernyak V, Bashir MR, Kono Y, Do RK, et al:
2017 Version of LI-RADS for CT and MR Imaging: An Update.
Radiographics. 37:1994–2017. 2017. View Article : Google Scholar : PubMed/NCBI
|
|
18
|
Qian H, Li S, Ji M and Lin G: MRI
characteristics for the differential diagnosis of benign and
malignant small solitary hypovascular hepatic nodules. Eur J
Gastroen Hepat. 28:749–756. 2016. View Article : Google Scholar
|
|
19
|
Joo I, Lee JM, Lee SM, Lee JS, Park JY and
Han JK: Diagnostic accuracy of liver imaging reporting and data
system (LI-RADS) v2014 for intrahepatic mass-forming
cholangiocarcinomas in patients with chronic liver disease on
gadoxetic acid-enhanced MRI. J Magn Reson Imaging. 76:1330–1338.
2016. View Article : Google Scholar
|
|
20
|
Motosugi U, Ichikawa T, Onohara K, Sou H,
Sano K, Muhi A and Araki T: Distinguishing hepatic metastasis from
hemangioma using gadoxetic acid-enhanced magnetic resonance
imaging. Invest Radiol. 46:359–365. 2011. View Article : Google Scholar : PubMed/NCBI
|
|
21
|
Darnell A, Forner A, Rimola J, Reig M,
Garcia-Criado A, Ayuso C and Bruix J: Liver imaging reporting and
data system with MR imaging: Evaluation in nodules 20 mm or smaller
detected in cirrhosis at screening US. Radiology. 275:698–707.
2015. View Article : Google Scholar : PubMed/NCBI
|
|
22
|
Di Pietropaolo M, Briani C, Federici GF,
Marignani M, Begini P, Delle Fave G and Iannicelli E: Comparison of
diffusion-weighted imaging and gadoxetic acid-enhanced MR images in
the evaluation of hepatocellular carcinoma and hypovascular
hepatocellular nodules. Clin Imag. 39:468–475. 2015. View Article : Google Scholar
|
|
23
|
Motosugi U, Bannas P, Sano K and Reeder
SB: Hepatobiliary MR contrast agents in hypovascular hepatocellular
carcinoma. J Magn Reson Imaging. 41:251–265. 2015. View Article : Google Scholar : PubMed/NCBI
|
|
24
|
Ichikawa S, Ichikawa T, Motosugi U, Sano
K, Morisaka H, Enomoto N, Matsuda M, Fujii H and Araki T: Presence
of a hypovascular hepatic nodule showing hypointensity on
hepatocyte-phase image is a risk factor for hypervascular
hepatocellular carcinoma. J Magn Reson Imaging. 39:293–297. 2014.
View Article : Google Scholar : PubMed/NCBI
|
|
25
|
Golfieri R, Renzulli M, Lucidi V, Corcioni
B, Trevisani F and Bolondi L: Contribution of the hepatobiliary
phase of Gd-EOB-DTPA-enhanced MRI to dynamic MRI in the detection
of hypovascular small (<=2 cm) HCC in cirrhosis. Eur Radiol.
21:1233–1242. 2011. View Article : Google Scholar : PubMed/NCBI
|
|
26
|
Quaia E, de Paoli L, Pizzolato R, Angileri
R, Pantano E, Degrassi F, Ukmar M and Cova MA: Predictors of
dysplastic nodule diagnosis in patients with liver cirrhosis on
unenhanced and gadobenate dimeglumine-enhanced MRI with dynamic and
hepatobiliary phase. AJR Am J Roentgenol. 200:553–562. 2013.
View Article : Google Scholar : PubMed/NCBI
|
|
27
|
Kang Y, Lee JM, Kim SH, Han JK and Choi
BI: Intrahepatic mass-forming cholangiocarcinoma: Enhancement
patterns on gadoxetic acid-enhanced MR images. Radiology.
264:751–760. 2012. View Article : Google Scholar : PubMed/NCBI
|
|
28
|
Xu J, Igarashi S, Sasaki M, Matsubara T,
Yoneda N, Kozaka K, Ikeda H, Kim J, Yu E, Matsui O, et al:
Intrahepatic cholangiocarcinomas in cirrhosis are hypervascular in
comparison with those in normal livers. Liver Int. 32:1156–1164.
2012. View Article : Google Scholar : PubMed/NCBI
|
|
29
|
Rimola J, Forner A, Reig M, Vilana R, de
Lope CR, Ayuso C and Bruix J: Cholangiocarcinoma in cirrhosis:
Absence of contrast washout in delayed phases by magnetic resonance
imaging avoids misdiagnosis of hepatocellular carcinoma.
Hepatology. 50:791–798. 2009. View Article : Google Scholar : PubMed/NCBI
|
|
30
|
Joo I, Lee JM, Lee DH, Jeon JH, Han JK and
Choi BI: Noninvasive diagnosis of hepatocellular carcinoma on
gadoxetic acid-enhanced MRI: Can hypointensity on the hepatobiliary
phase be used as an alternative to washout? Eur Radiol.
25:2859–2868. 2015. View Article : Google Scholar : PubMed/NCBI
|
|
31
|
Loyer EM, Chin H, DuBrow RA, David CL,
Eftekhari F and Charnsangavej C: Hepatocellular carcinoma and
intrahepatic peripheral cholangiocarcinoma: Enhancement patterns
with quadruple phase helical CT-a comparative study. Radiology.
212:866–875. 1999. View Article : Google Scholar : PubMed/NCBI
|
|
32
|
Goshima S, Kanematsu M, Kondo H, Yokoyama
R, Kajita K, Tsuge Y, Shiratori Y, Onozuka M and Moriyama N:
Hepatic hemangioma: Correlation of enhancement types with
diffusion-weighted MR findings and apparent diffusion coefficients.
Eur J Radiol. 70:325–330. 2009. View Article : Google Scholar : PubMed/NCBI
|
|
33
|
Tateyama A, Fukukura Y, Takumi K, Shindo
T, Kumagae Y and Nakamura F: Hepatic hemangiomas: factors
associated with pseudo washout sign on Gd-EOB-DTPA-enhanced MR
imaging. Magn Reson Med Sci. 15:73–82. 2016. View Article : Google Scholar : PubMed/NCBI
|
|
34
|
Kim B, Byun JH, Kim HJ, Won HJ, Kim SY,
Shin YM and Kim PN: Enhancement patterns and pseudo-washout of
hepatic haemangiomas on gadoxetate disodium-enhanced liver MRI. Eur
Radiol. 26:191–198. 2016. View Article : Google Scholar : PubMed/NCBI
|
|
35
|
Grazioli L, Ambrosini R, Frittoli B,
Grazioli M and Morone M: Primary benign liver lesions. Eur J
Radiol. 95:378–398. 2017. View Article : Google Scholar : PubMed/NCBI
|
|
36
|
Kumar R and Indrayan A: Receiver operating
characteristic (ROC) curve for medical researchers. Indian Pediatr.
48:277–287. 2011. View Article : Google Scholar : PubMed/NCBI
|