Introduction
[18F]fluorodeoxyglucose
([18F]FDG) positron emission tomography (PET)/computed
tomography (CT) is a novel imaging technique that integrates
functional metabolism imaging and anatomical form imaging. Imaging
foci of malignant tumors is based on the increased glucose uptake
of malignant tumor cells, which display morphology and sizes of
foci, and, more importantly, the absence/presence and levels of
activity of malignant tumor foci (1).
PET/CT has been extensively used in diagnosis of malignant tumors.
Aplastic anemia (AA) is a common hematological disease
characterized by bone marrow hypoproliferation and is, in certain
cases, difficult to differentiate from myelodysplastic syndrome
(MDS). According to the working mechanism of PET/CT, it is
hypothesized that this technique is potentially useful in diagnosis
of AA and differential diagnosis from MDS.
To the best of our knowledge, the function of
systemic PET/CT in AA has only previously been investigated in
individual cases (2–4). No literature is available that
systemically introduces characteristics of PET/CT manifestations in
patients with AA and its value in the clinical setting. In the
present study, characteristics of systemic PET/CT of 24 patients
with AA were compared with those of healthy individuals and
patients with acute leukemia (AL) or MDS to investigate the value
of systemic PET/CT in diagnosis and differential diagnosis of AA
and reveal its functionin indicating treatment responses when the
T/B cell ratio was taken into account.
Patients and methods
Study population
In total, 24 patients were included who had been
diagnosed with AA and undergone systemic PET/CT examination in The
First Affiliated Hospital of Sun Yat-Sen University between May
2011 and August 2014. All patients were diagnosed according to the
2009 British guidelines for the diagnosis and management of AA
(5). Of these patients, 17 presented
with severe aplastic anemia (SAA) and the other 7 presented with
chronic aplastic anemia (CAA). The general features of the 24
patients with AA at the onset of the disease are presented in
Table I. The median age at diagnosis
was 38.3 years (range, 13.0–75.0 years).
 | Table I.General characteristics of the 24
patients with AA at onset of disease. |
Table I.
General characteristics of the 24
patients with AA at onset of disease.
| Factors | n (%) |
|---|
| Male | 14 (58.3) |
| Disease
classification |
| CAA | 7 (29.2) |
| SAA | 17 (70.8) |
| White blood cell
count, cells/l |
|
≥2.0×10⁹ | 9 (37.5) |
|
<2.0×10⁹ | 15 (62.5) |
| Neutrophil cell
count, cells/l |
|
≥0.5×10⁹ | 11 (45.8) |
|
<0.5×10⁹ | 13 (54.2) |
| Hemoglobin, g/l |
| ≥90 | 5 (20.8) |
|
<90 | 19 (79.2) |
| Net woven red blood
cell count, cells/l |
|
≥24×109 | 9 (37.5) |
|
<24×109 | 15 (62.5) |
| Platelet,
cells/l |
|
≥50×109 | 2 (8.3) |
|
<50×109 | 22 (91.7) |
| Alanine
aminotransferase, U/l |
| ≥40 | 5 (20.8) |
|
<40 | 19 (79.2) |
| Albumin, g/l |
| ≥35 | 17 (70.8) |
|
<35 | 7 (29.2) |
| Lactate
dehydrogenase, U/l |
| ≥240 | 3 (12.5) |
|
<240 | 21 (87.5) |
| Serum creatinine,
µmol/l |
| ≥115 | 0 (0) |
|
<115 | 24 (100) |
| Infection |
| Yes | 8 (33.3) |
| No | 16 (66.7) |
The present study also included 16 healthy
individuals, 6 patients with AL and 4 patients with MDS. Patients
with AL were diagnosed according to the 2008 revision of the World
Health Organization (WHO) classification of myeloid neoplasms and
acute leukemia (6), and patients with
MDS were diagnosed according to the 2007 version of the Vienna
minimal diagnostic criteria (7) and
the 2008 version of the WHO classification criteria (6). Of the 6 patients with AL, 4 presented
with acute myelocytic leukemia and 2 presented with acute
lymphoblastic leukemia; of the 4 patients with MDS, 1 presented
with MDS-refractory anemia with excess blasts (RAEB) type I, 1
presented with MDS-RAEB type II and the other 2 presented with
MDS-refractory cytopenia with multilineage dysplasia. Of the 16
healthy individuals, 11 were male and 5 were female. The present
study was approved by the ethics committee of the First Affiliated
Hospital of Sun Yat-sen University, and study participants provided
written informed consent.
Therapeutic regimens and
follow-up
Of the 7 patients with CAA, 1 discontinued
treatment, and the other 6 received ciclosporin A (CsA) treatment;
of the 17 patients with SAA, 5 discontinued treatment, 5 underwent
allogeneic hematopoetic stem cell transplantation (allogeneic bone
marrow transplantation from a human leucocyte antigen-identical
sibling donor), 3 received antithymocyte globulin (ATG) sequential
CsA treatment and 4 accepted only CsA treatment. The 2009 British
guidelines for the diagnosis and management of AA (5) were used as the reference. The responses
of patients were evaluated following treatment for 6 weeks. The
response rate was the sum of complete remission (CR) rate and
partial remission (PR) rate.
Methods
Prior to examination, all patients fasted for >6
h. Following intravenous injection of [18F]FDG, patients
rested in the supine position for between 50 and 60 min in a quiet
and warm indoor environment. Following complete evacuation of
urine, with each patient lying in the supine position on the
examination bed, spiral CT scanning was first performed from the
roof of the skull to the upper end of the femoral bone, prior to
performing systemic 2D PET section imaging. The cross-sectional
image underwent attenuation correction using the CT cross-sectional
image at the same layer as emission imaging; PET image
reconstruction was performed by ordered subset expectation
maximization iterative reconstruction method. The reconstructed
image and the CT image were fused to obtain coronal, sagittal,
cross-sectional CT, PET and PET/CT images, respectively. Two
nuclear medicine physicians, who were blinded to the clinical
disease of the patients, analyzed the patient images and, using
semi-quantitative analysis, selected all parts with hypermetabolism
and sketched the region of interest for the workstation to
automatically generate the maximum standardized uptake values
(SUVmax).
Statistical analysis
Statistical analysis of the results was performed
using the χ2 test, non-parametric rank sum test,
Fisher's exact test, and Pearson' scorrelation coefficient using
SPSS software (version 19.0; IBM Corp., Armonk, NY, USA). P<0.05
was considered to indicate a statistically significant
difference.
Results
Characteristics of systemic PET/CT
manifestations of healthy individuals
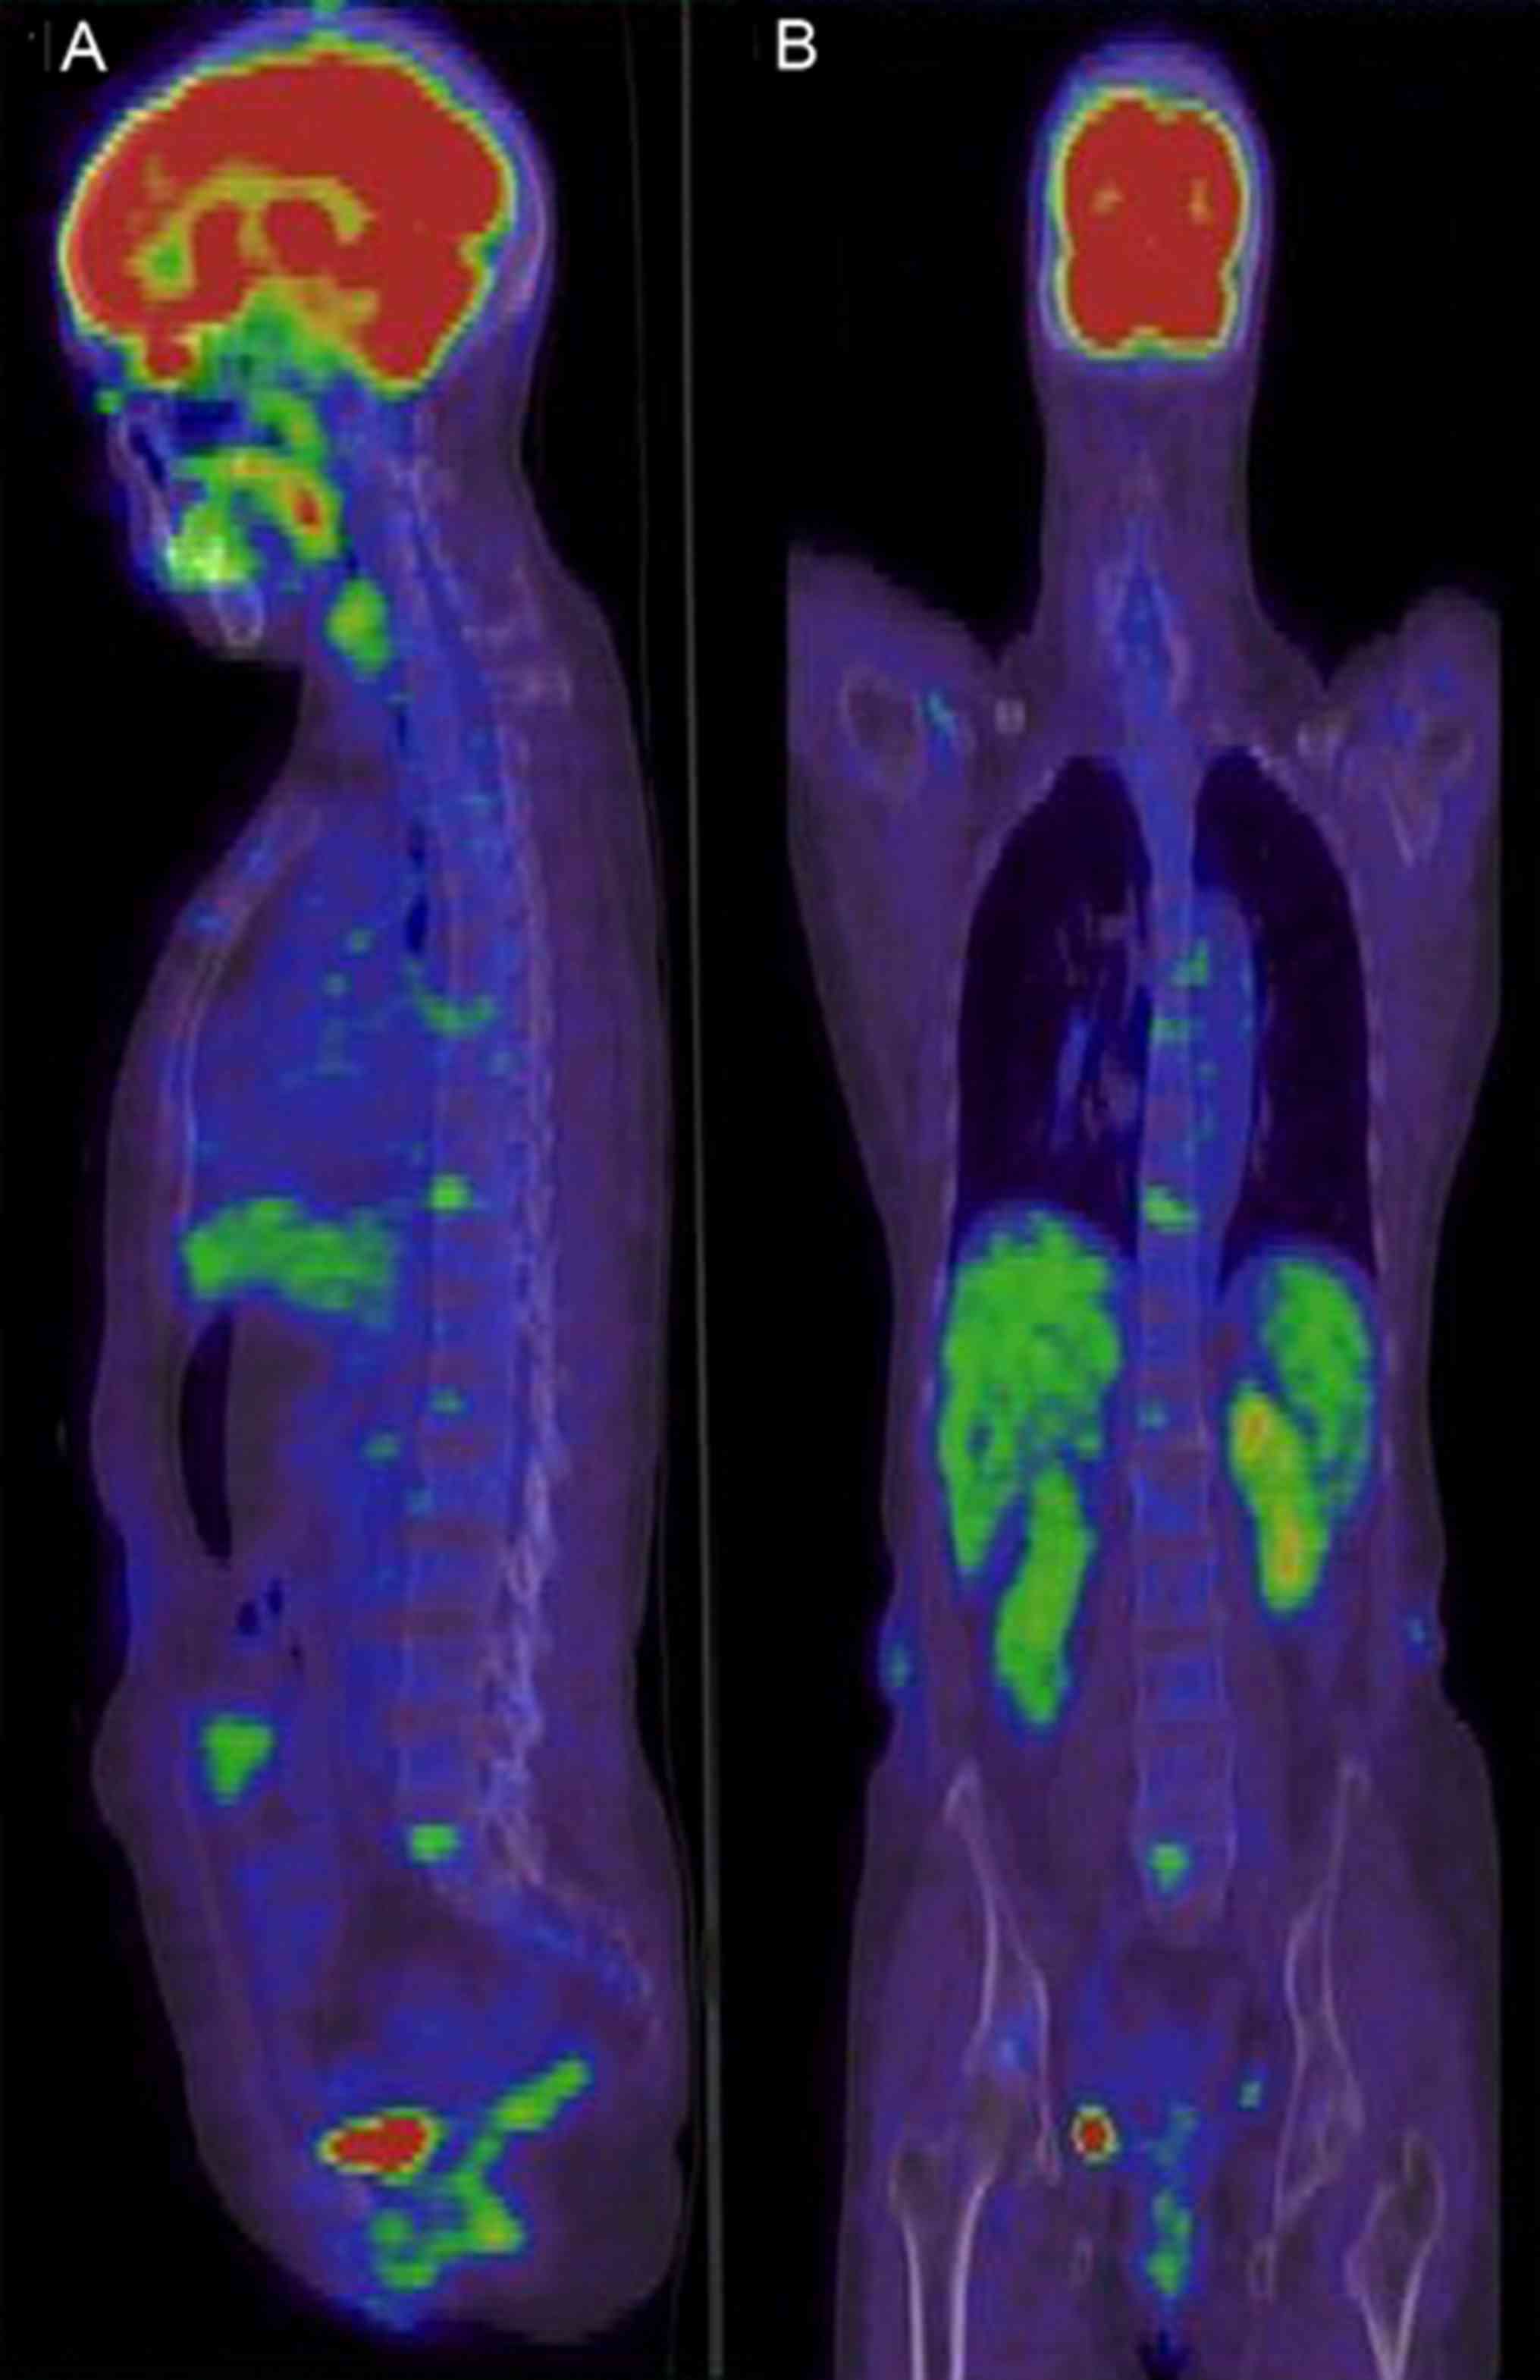
The 16 healthy individuals included 11 males and 5
females, whose median age was 50.0 years (range, 36–72 years). They
underwent systemic PET/CT examination for the purpose of routine
physical examination. No marked abnormality in bone marrow
metabolism or abnormal [18F]FDG concentration was
identified in the 16 individuals (Fig. 1A
and B).
Characteristics of systemic PET/CT
manifestations of patients with AA
Bone marrow PET/CT manifestations of
patients with AA
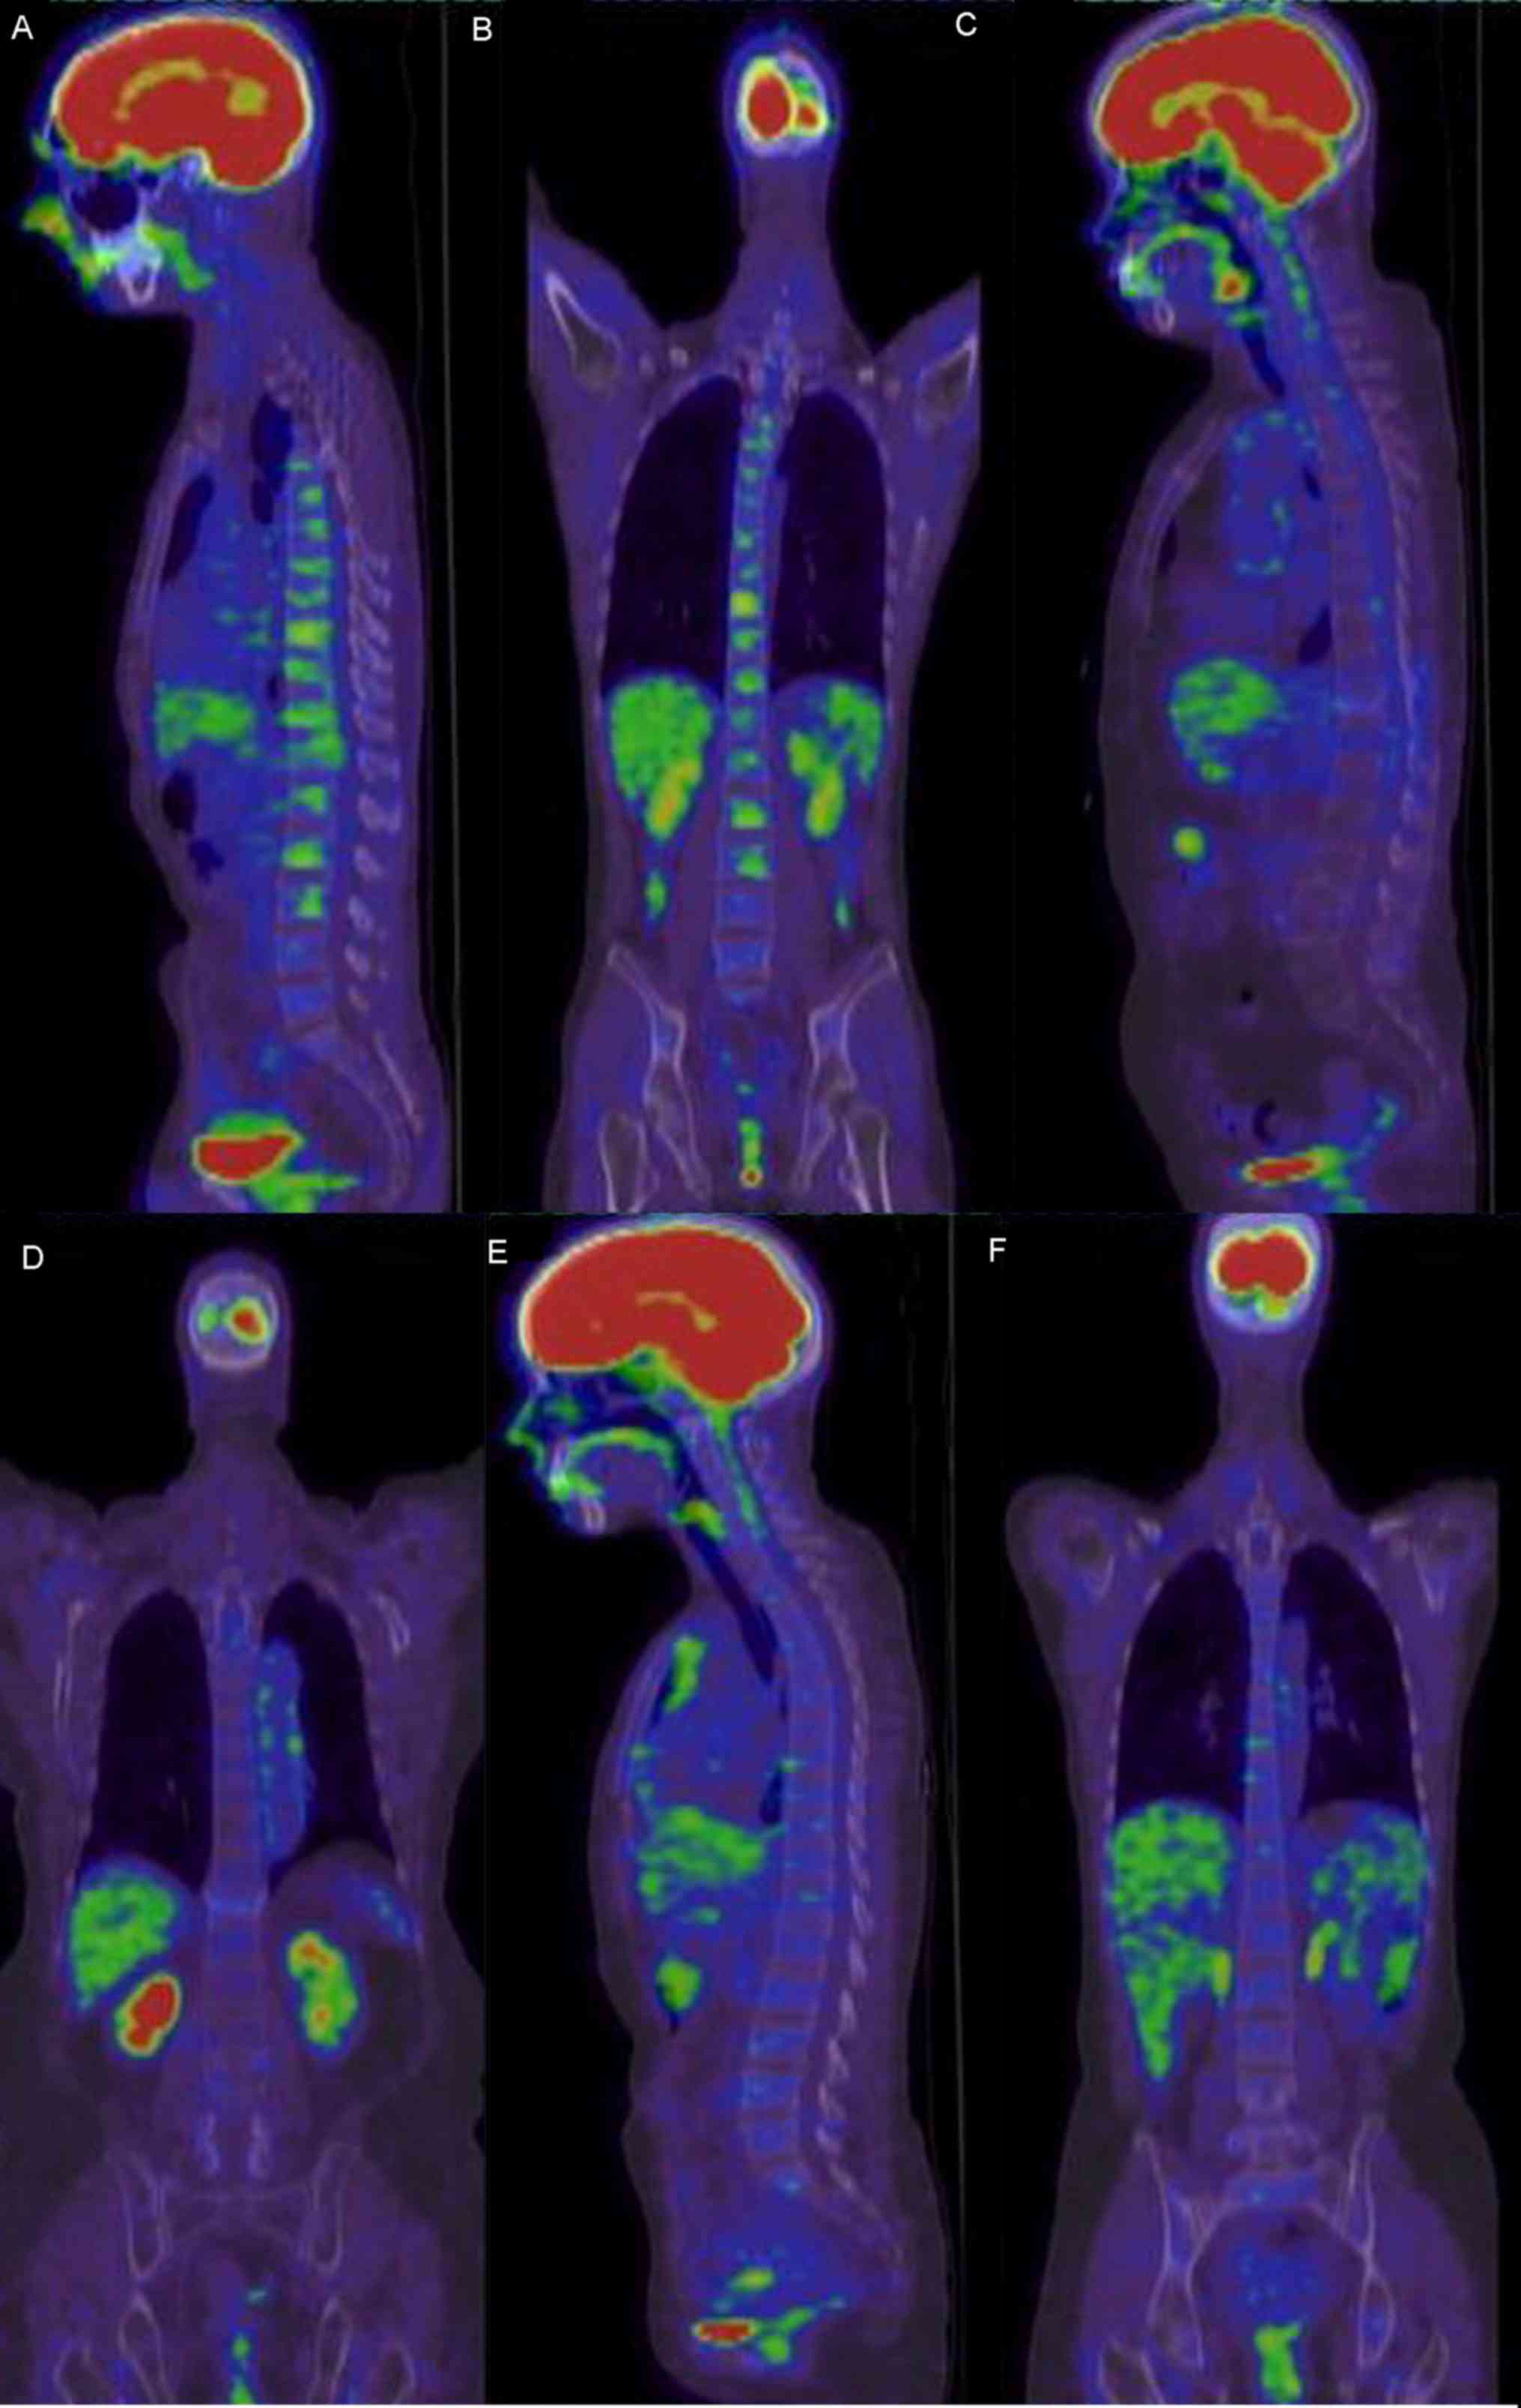
Bone marrow PET/CT manifestations of patients with
AA were classified into the following three types (Table II): Hypometabolism complicated by
focal hyperproliferation (Fig. 2A and
B), hypometabolism (Fig. 2C and
D) and normal bone marrow metabolism (Fig. 2E and F). Of the 24 patients with AA, 1
(4.2%) presented with normal bone marrow metabolism, 9 (37.5%)
presented with hypometabolism and 14 (58.3%) presented with
hypometabolism complicated by focal hyperproliferation.
| Table II.Characteristics of bone marrow PET/CT
manifestations of patients with different types of AA. |
Table II.
Characteristics of bone marrow PET/CT
manifestations of patients with different types of AA.
| Bone marrow
manifestation in PET/CT | SAA, n (%) | CAA, n (%) | Total, n (%) |
|---|
| Normal
metabolism | 1/17 (5.9) | 0/7 (0) | 1/24 (4.2) |
| Hypometabolism | 7/17 (41.2) | 2/7 (28.6) | 9/24 (37.5) |
| Hypometabolism
complicated by focal hyperproliferation | 9/17 (52.9) | 5/7 (71.4) | 14/24 (58.3) |
Differences in bone marrow PET/CT
manifestations in patients with AA
Differences in the bone marrow PET/CT manifestations
of patients with different types of AA were observed. Of the 17
patients with SAA, 1 (5.9%) presented with normal bone marrow
metabolism, 7 (41.2%) presented with hypometabolism and 9 (52.9%)
presented with hypometabolism complicated by focal
hyperproliferation; of the 7 patients with CAA, none presented with
normal bone marrow metabolism, 2 (28.6%) presented with
hypometabolism and 5 (71.4%) presented with hypometabolism
complicated by focal hyperproliferation.
Commonality in focal proliferation in
PET/CT of patients with AA
Of the 24 patients with AA, 14 (58.3%) presented
with diffuse hypometabolism complicated by focal hyperproliferation
and increased uptake in systemic PET/CT. The SUVmax of
parts with hyperproliferation were between 2.2 and 8.8; parts with
focal hyperproliferation included (in descending order): Vertebral
body (54.2%), breast bones (41.7%), ilial bones (25.0%), ribs
(16.7%), upper segment of femoral bone (16.7%), sacral bone
(16.7%), scapular bones (12.5%), collar bones (8.3%), ischial bones
(4.2%) and upper segments of humeral bones (4.2%).
Association between presence/absence
of concurrent infections and PET/CT focal hyperproliferation
SUVmax in patients with AA
Owing to marked leukopenia and neutropenia,
infections are common complications of patients with AA (5). In the present study, 8/24 patients with
AA presented with concurrent infections, which affected lungs, gums
and the upper respiratory tracts. In total, 3/8 patients with
concurrent infections presented with bone marrow hypometabolism
complicated by focal hyperproliferation
(SUVmax=5.70±1.92). In total, 11/16 patients without
concurrent infections presented with bone marrow hypometabolism
complicated by focal hyperproliferation
(SUVmax=3.10±0.28). A statistically significant
difference was identified between the two groups (P=0.028). Only
1/24 patients developed concurrent infections at onset of the
disease (bone marrow SUVmax=8.30) and thus was first
administered active anti-infective therapy. Later, the patient's
infection was controlled. After 1 month, the bone marrow
SUVmax decreased to 1.70 in systemic PET/CT
re-examination.
Association between bone marrow
SUVmax and the T/B cell ratio
All of the 24 patients with AA underwent bone marrow
flow cytometric examination to determine the ratio between T
lymphocytes and B lymphocytes (T/B ratio). High values of the T/B
ratio indicate abnormal activation of T cells. Depending on the
bone marrow SUVmax, the patients were divided into two
groups, one group with SUVmax≥3.00 and the other group
with SUVmax<3.00. T/B ratios of the two groups were
calculated. The T/B cell ratios of the group with
SUVmax≥3.00 and the group with SUVmax<3.00
were 3.37 (2.49–6.39) and 8.74 (7.22–13.96), respectively; the
difference between the two groups was statistically significant
(P=0.014).
Association between the degree of bone
marrow proliferation and [18F]FDG uptake activity in
PET/CT
Each of the 24 patients with AA underwent iliac bone
marrow smear examination at least twice, ilial bone biopsy once and
sternal bone marrow smear examination once. It was identified that
the PET/CT metabolic activity was positively correlated with the
degree of proliferation at this part (including ilial bones and
breast bones) (P<0.001), with Pearson's correlation coefficient,
R, of 0.572. Therefore, metabolic activity shown in PET/CT may
indicate, to a certain extent, the degree of bone marrow
proliferation.
Characteristics of systemic PET/CT
manifestations of patients with AL and MDS
Characteristics of systemic PET/CT
manifestations of patients with AL
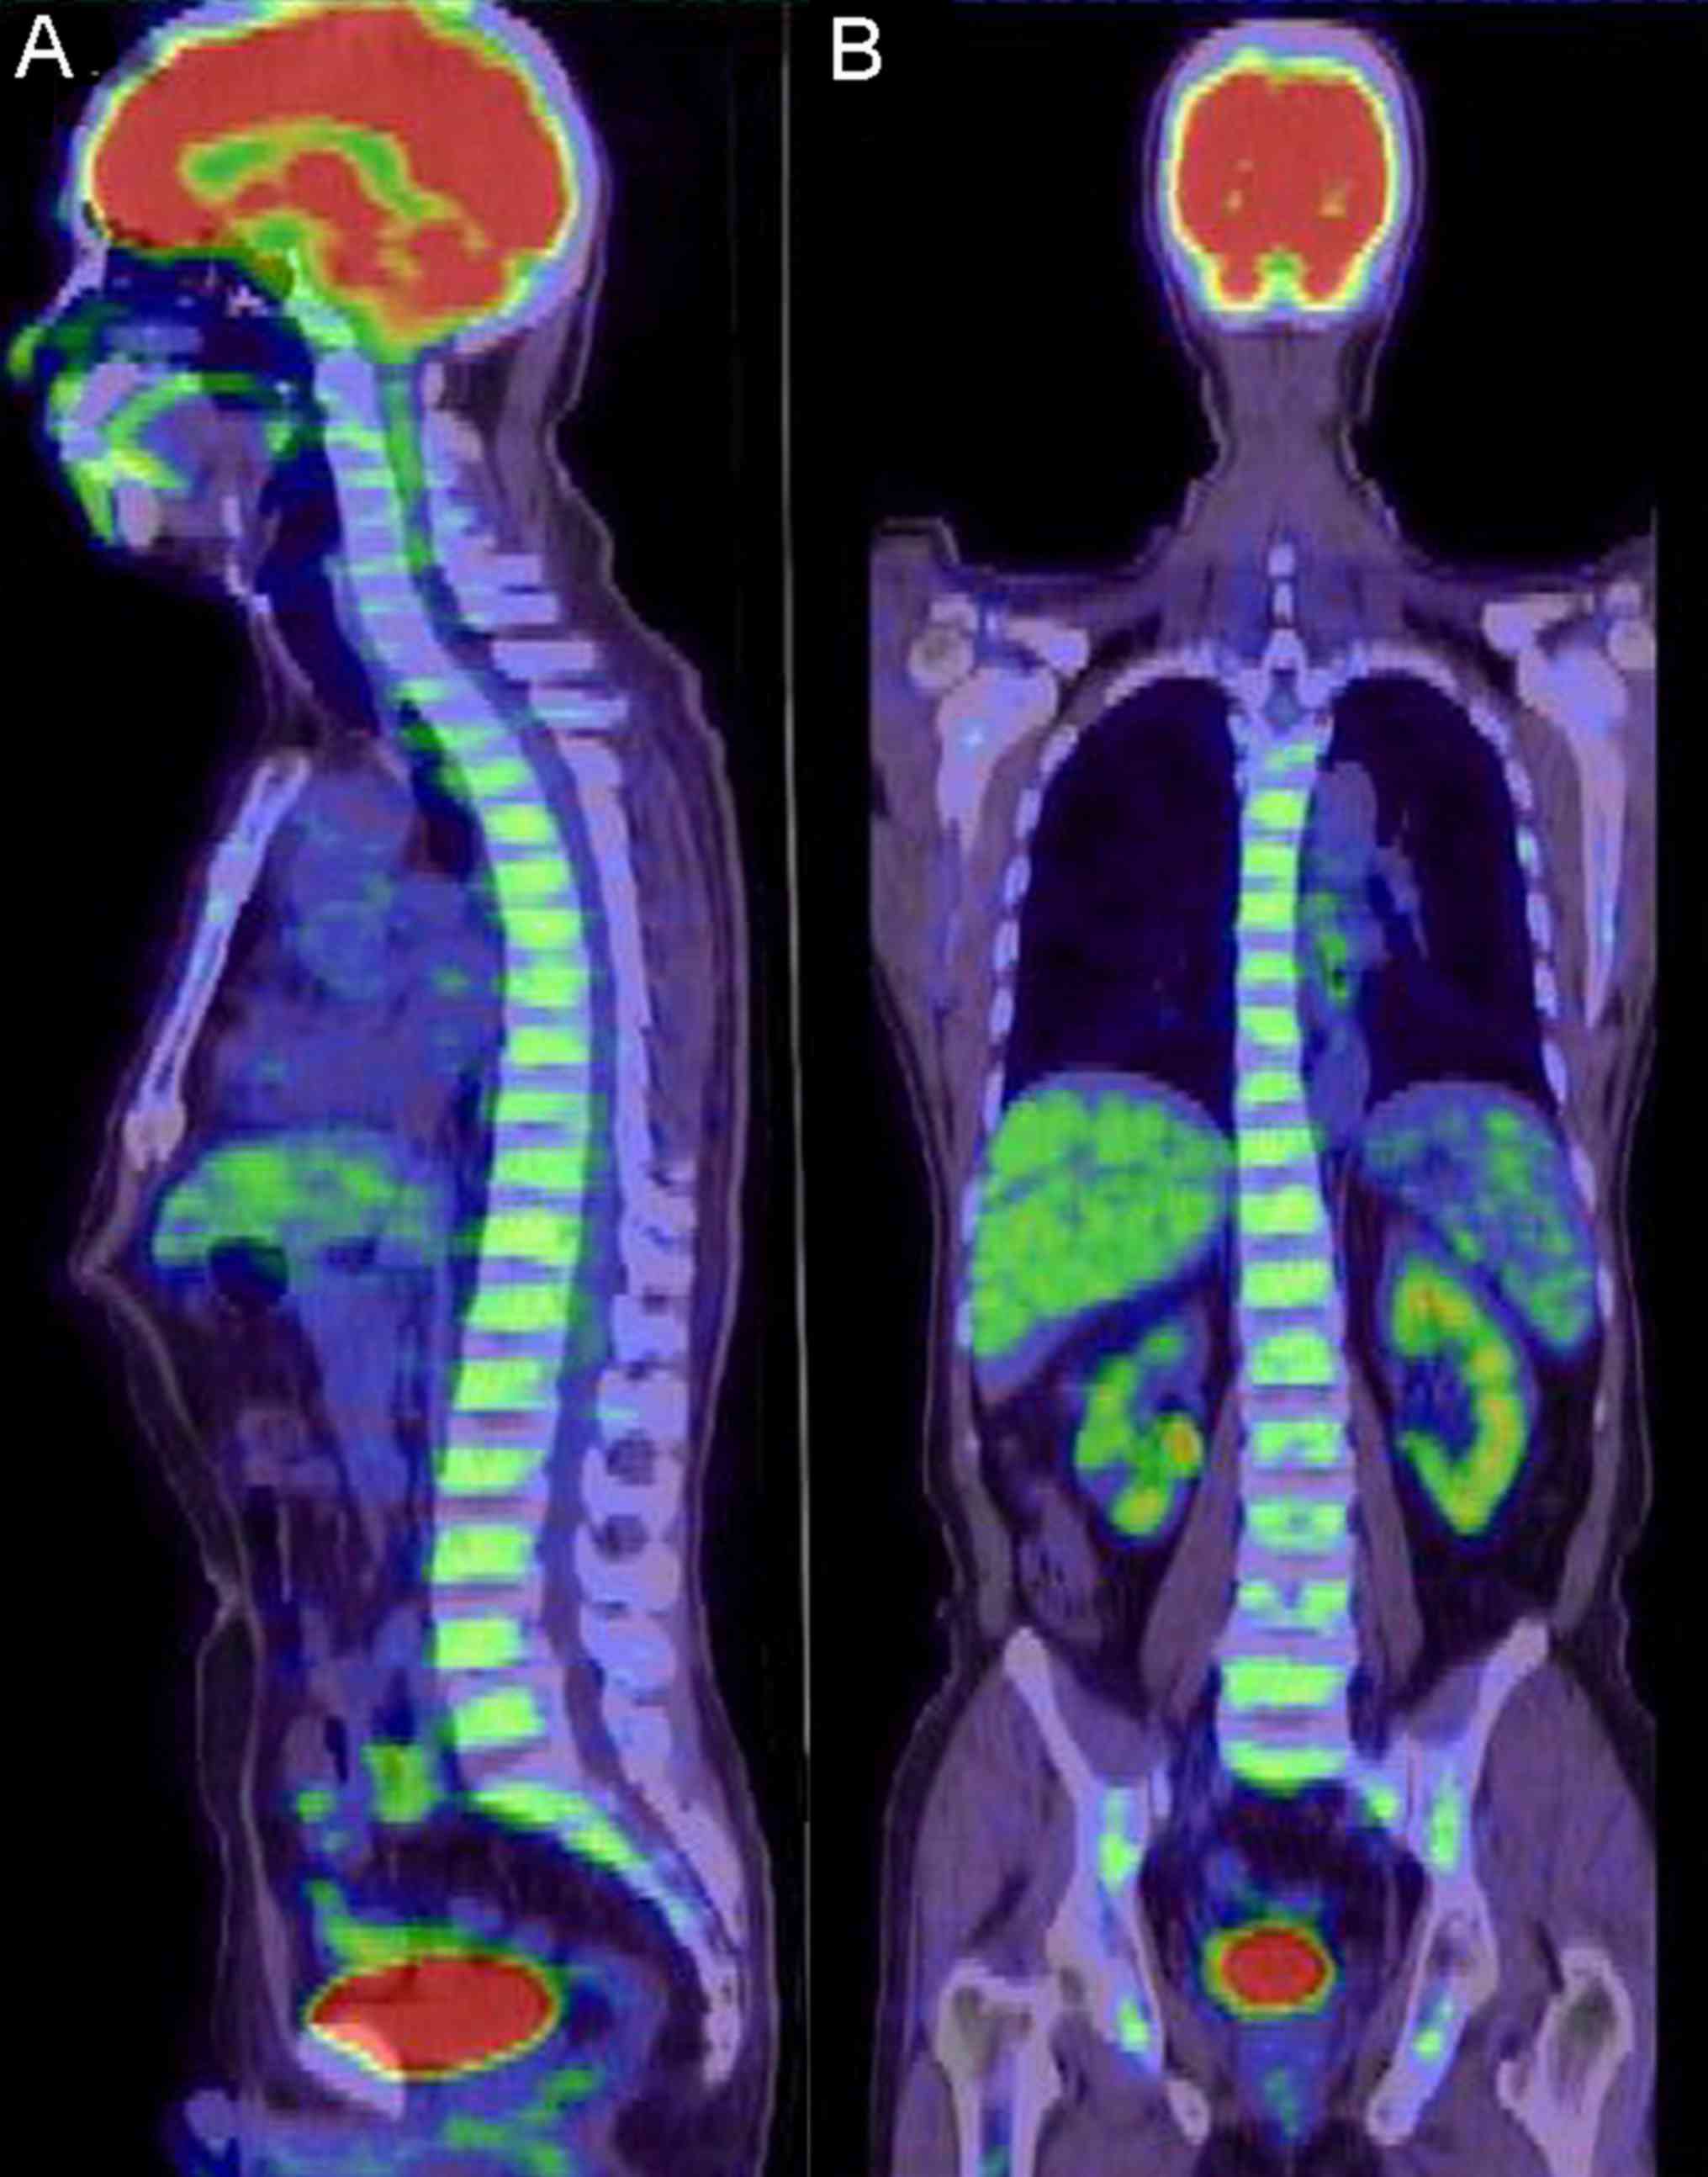
The 6 patients with AL included 4 males and 2
females, whose median age was 53 years (range, 18–75 years).
Systemic PET/CT of all 6 patients revealed diffuse hypermetabolism
in the axial skeleton and limb bones (Fig. 3), and the SUVmax were
between 2.50 and 5.60. In total, 2 patients presented with spleen
enlargement and active metabolism, and the spleen SUVmax
were 2.30 and 3.60, respectively.
Characteristics of systemic PET/CT
manifestations of patients with MDS
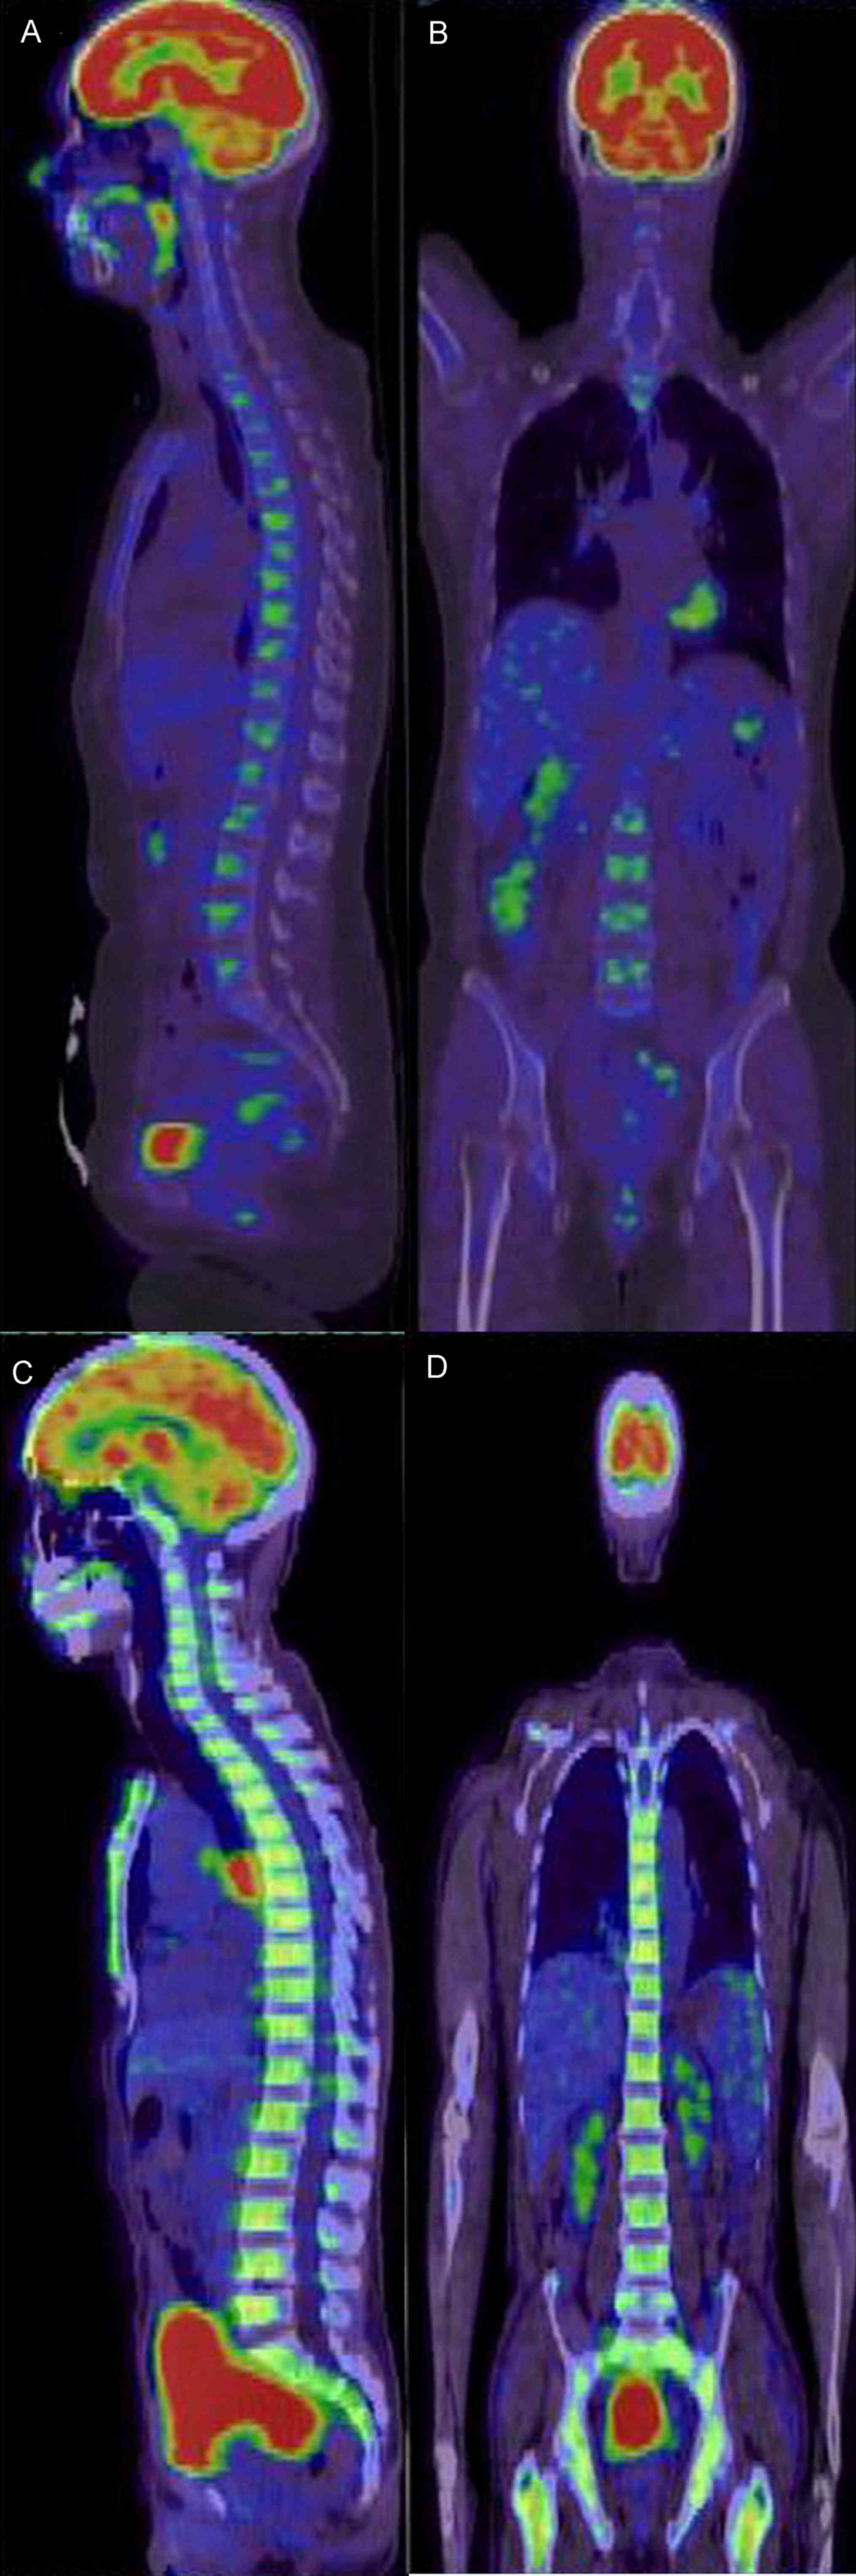
The 4 patients with MDS included 2 males and 2
females, whose median age was 58.7 years (49–69 years). In total, 1
patient presented with generalized hypometabolism complicated by
focal hypermetabolism (breast bones) (Fig. 4A and B); 3/4 patients presented with
diffuse and uniform hypermetabolism in the axial skeleton and limb
bones (Fig. 4C and D), and the
SUVmax were between 2.60 and 8.50. In total, 1/4
patients with MDS presented with mild spleen enlargement; spleens
of the other 3 patients were the normal size.
Comparison of overall bone marrow and
extramedullar SUV of patients with AA and healthy individuals or
patients with AL or MDS
As presented in Table
III, the differences between bone marrow SUV of patients with
AA and healthy individuals or patients with AL or MDS were all
statistically significant (P<0.01), indicating that the overall
bone marrow metabolism of patients with AA was low. Spleen SUV of
patients with MDS and patients with AL were higher compared with
those of patients with AA, and the differences were statistically
significant (P=0.020 and 0.026, respectively). No statistically
significant difference was identified in liver and mediastinal
blood pool SUV between patients with AA and healthy individuals,
patients with AL or patients with MDS (P>0.05).
| Table III.Comparison of standardized uptake
values of different parts of patients with AA and healthy
individuals, patients with AL and patients with MDS. |
Table III.
Comparison of standardized uptake
values of different parts of patients with AA and healthy
individuals, patients with AL and patients with MDS.
| Disease type | Bone marrow (median,
quartile) | Liver (median,
quartile) | Spleen (median,
quartile) | Mediastinum (median,
quartile) |
|---|
| AA | 0.90 (0.65–1.30) | 2.00 (1.78–2.06) | 1.80 (1.63–2.15) | 1.30
(1.24–1.49) |
| Healthy | 1.65
(1.36–1.80)b | 2.00
(1.84–2.40) | 1.68
(1.50–2.00) | 1.30
(1.20–1.56) |
| MDS | 2.75
(2.43–5.65)b | 1.90
(1.30–2.50) | 2.10
(2.00–3.10)a | 1.25
(0.85–1.65) |
| AL | 3.09
(2.68–3.55)b | 2.15
(1.84–2.53) | 2.11
(1.93–2.63)a | 1.52
(1.15–1.70) |
AA association between patient
treatment responses and PET/CT
Of the 24 patients with AA, 6 discontinued
treatment. Treatment responses of the other 18 patients are
presented in Table IV. Of the 6
patients with CAA treated with CsA, 5 responded and the other did
not. Bone marrow of the non-responder presented with hypometabolism
was complicated by focal hyperproliferation, the SUVmax
was 2.90, and the T/B cell ratio was 2.22. Of the 4 patients with
SAA treated with CsA, 2 responded and the other 2 did not.
SUVmax of both respondents were not high, and the T/B
cell ratios were also lower compared with those of the 2
non-respondents; of the 2 non-respondents, SUVmax were
high, and the T/B cell ratios were also significantly higher. All 3
patients treated with ATG responded.
| Table IV.PET/CT manifestations, T/B cell
ratios and treatment responses of 18 treated patients with AA. |
Table IV.
PET/CT manifestations, T/B cell
ratios and treatment responses of 18 treated patients with AA.
| No. | Sex | Age, years | Diagnosis | PET/CT
manifestation |
SUVmax | T/B cell ratio | Therapeutic
regimen | Efficacy |
|---|
| 1 | Male | 24 | CAA | Hypometabolism
complicated by focal hyperproliferation | 6.10 | 5.62 | CsA | CR |
| 2 | Male | 50 | CAA | Hypometabolism
complicated by focal hyperproliferation | 8.80 | 13.86 | CsA | PR |
| 3 | Female | 59 | CAA | Diffuse
hypometabolism | 1.80 | 16.85 | CsA | PR |
| 4 | Female | 60 | CAA | Hypometabolism
complicated by focal hyperproliferation | 2.90 | 2.22 | CsA | NC |
| 5 | Male | 23 | CAA | Hypometabolism
complicated by focal hyperproliferation | 3.20 | 8.74 | CsA | PR |
| 6 | Female | 54 | CAA | Hypometabolism
complicated by focal hyperproliferation | 2.20 | 7.61 | CsA | PR |
| 7 | Female | 34 | SAA | Normal
metabolism | 2.00 | 3.02 | ATG | PR |
| 8 | Male | 14 | SAA | Hypometabolism
complicated by focal hyperproliferation | 2.50 | 2.53 | ATG | PR |
| 9 | Male | 27 | SAA | Hypometabolism
complicated by focal hyperproliferation | 2.70 | 5.62 | ATG | CR |
| 10 | Female | 75 | SAA | Diffuse
hypometabolism | 1.10 | 3.07 | CsA | CR |
| 11 | Female | 26 | SAA | Hypometabolism
complicated by focal hyperproliferation | 3.10 | 8.99 | CsA | NC |
| 12 | Male | 36 | SAA | Hypometabolism
complicated by focal hyperproliferation | 5.00 | 5.86 | CsA | NC |
| 13 | Male | 48 | SAA | Diffuse
hypometabolism | 1.50 | 5.28 | CsA | PR |
| 14 | Male | 13 | SAA | Diffuse
hypometabolism | 1.3 | 10.51 | Allo-BMT | CR |
| 15 | Female | 43 | SAA | Hypometabolism
complicated by focal hyperproliferation | 4.5 | 7.43 | Compatriots | CR |
| 16 | Male | 43 | SAA | Hypometabolism
complicated by focal hyperproliferation | 2.8 | 3.66 | Compatriots | CR |
| 17 | Male | 43 | SAA | Hypometabolism
complicated by focal hyperproliferation | 3.0 | 7.22 | Compatriots | CR |
| 18 | Male | 37 | SAA | Hypometabolism
complicated by focal hyperproliferation | 3.0 | 16.75 | Compatriots | CR |
Discussion
The results of present study have suggested that
systemic PET/CT of patients with AA has specific manifestations,
and may assist in differentiating from atypical MDS and, with the
T/B cell ratio taken into account, may predict treatment
responses.
Systemic PET/CT has been increasingly used in
diagnosis and treatment of tumor patients. [18F]FDG is a
glucose analog identical with glucose in terms of the approach and
method of entering cells. The quantity of glucose transporters on
the surface of tumor cells has increased, so the glucose metabolic
rate of tumor cells is high. However, [18F]FDG is not a
tumor-specific tracer. In certain benign lesions, infections,
inflammatory reactions or diseased parts with markedly active
proliferation, glucose uptake and metabolism are also enhanced
(8,9),
manifesting as increased SUVmax in PET/CT.
The results of the present study indicate that
systemic PET/CT manifestations of patients with AA may be
classified into three types: Hypometabolism complicated by focal
hyperproliferation, hypometabolism and normal bone marrow
metabolism. In SAA or CAA, the most common systemic PET/CT
manifestation is hypometabolism complicated by focal
hyperproliferation, followed by hypometabolism, and the most common
parts with focal hypermetabolism are the vertebral body, chest
bones and ilial bones. Cicone et al (2) reported focal hypermetabolism in PET/CT
of a patient with AA, whose SUVmax was 2.80 and in whom
focal hypermetabolism was primarily identified in the vertebral
body, and these results were essentially consistent with those of
the present study. The results of the present study also indicated
that the metabolic activity identified using PET/CT is positively
correlated with the degree of bone marrow proliferation at the
corresponding part. According to the working mechanism of PET/CT,
it is considered that the increase in SUVmax is
associated with active focal bone marrow-compensated proliferation
and increased glucose uptake in bone marrow cells, so metabolic
activity shown in PET/CT may indicate, to a certain extent, the
degree of bone marrow proliferation (10–12).
Additionally, systemic PET/CT may reveal the metabolic activity of
bone marrow of the whole body and thus may more comprehensively
reflect the situation of bone marrow proliferation compared with
bone marrow aspiration or biopsy of individual parts.
Infections are common complications of patients with
AA (5). SUVmax of parts
with focal hypermetabolism of patients with AA with concurrent
infections were higher compared with those of patients with AA
without infections, indicating that infection is another factor
that influences SUVmax.
According to previously published studies, the
pathogenesis of AA involves inherent defects in hematopoietic stem
cells, supportive function defects of hematopoietic
microenvironments and immune function disorders; in particular,
abnormal T lymphocyte immunity serves an important function in
development and progression of AA (13). Peripheral blood and bone marrow T
lymphocytes of patients are abnormally activated, producing soluble
cytokines to inhibit hematopoiesis. In the present study, the
association between the T/B cell ratio and the SUVmax of
bone marrow has been preliminarily investigated. The results
indicate that bone marrow SUVmax of patients with high
T/B cell ratios are also high; an abnormal increase in the T/B cell
ratio reflects, to a certain extent, abnormal activation of T
cells. Therefore, bone marrow SUVmax of patients with AA
indicate compensated proliferation of bone marrow and reflect
abnormal activation of T cells.
Differences between overall bone marrow SUV of
patients with AA and healthy individuals, patients with AL and
patients with MDS were statistically significant; however, bone
marrow metabolism of patients with AA has decreased overall. In the
clinic, it is occasionally difficult to differentiate AA with
atypical manifestations from MDS (5).
In the present study, diffuse bone marrow hypermetabolism was not
identified using systemic PET/CT of any patient with AA, but was
identified in 75% of patients with MDS. Additionally, patients with
MDS presented with more active spleen metabolism compared with
patients with AA. These two points may be considered for
differential diagnosis of AA and MDS. According to the working
mechanism of PET/CT, enhanced spleen metabolism of patients with
MDS, as indicated by increased SUV, is ascribed to the marked
increased glucose metabolism in tumor cells that are disseminated
with blood to the spleen. Whereas in the pathogenesis of AA,
inherent defects of hematopoietic stem cells and supportive
function defects of hematopoietic microenvironments are independent
of the spleen, and immune function disorders primarily originate
from abnormal activation of T cells, T cells are primarily
lymphocytes occurring and maturing in the thymus gland, so spleen
SUV of patients with AA are not high.
In regard to the association between systemic PET/CT
manifestations and treatment responses of patients with AA, the
results of the present study reveal that, in patients with CAA, if
neither the SUVmax in PET/CT nor the T/B cell ratio is
high, it potentially indicates poorly compensated bone marrow
metabolism and unapparent abnormal activation of T cells, and the
immunosuppressant CsA may not respond well in patients with SAA; if
the SUVmax and the T/B cell ratio have increased, it
potentially indicates marked abnormal activation of T cells, and
using CsA alone will be insufficient to control immune disorders
and more potent immunosuppressants, e.g. antilymphocyte globulin or
ATG, have to be administered for an improved response.
For the first time, to the best of our knowledge,
the present study has systematically expounded the characteristics
of systemic PET/CT manifestations of patients with AA. It is
concluded that PET/CT may assist in differential diagnosis of
clinically atypical AA and MDS, and the T/B cell ratio may predict
treatment efficacy.
Acknowledgements
Not applicable.
Funding
No funding was received.
Availability of data and materials
All data generated or analyzed during this study are
included in this published article.
Authors' contributions
MC performed the data analyses and wrote the
manuscript. LL contributed significantly to data analysis and
manuscript preparation, JL contributed to the conception of the
study and reviewed the manuscript. BZ performed image examination
of patients. JRL, JG, DZ, XT and HW collected and analyzed the
patient data.
Ethics approval and consent to
participate
The present study was approved by the ethics
committee of the First Affiliated Hospital of Sun Yat-sen
University and study participants provided written informed
consent.
Patient consent for publication
Study participants provided their consent for the
publication of any data and associated images and all identifying
patient data was removed.
Competing interests
The authors declare that they have no competing
interests.
References
|
1
|
Inoue K, Goto R, Okada K, Kinomura S and
Fukuda H: A bone marrow F-18 FDG uptake exceeding the liver uptake
may indicate bone marrow hyperactivity. Ann Nucl Med. 23:643–649.
2009. View Article : Google Scholar : PubMed/NCBI
|
|
2
|
Cicone F, Stalder M, Geiger D, Cairoli A,
Delaloye AB and Prior JO: Visual and quantitative approach to bone
marrow foci of increased glucose uptake on PET/CT in a case of
aplastic anaemia. Nuklearmedizin. 49:N10–N12. 2010.PubMed/NCBI
|
|
3
|
Harisankar C, Mittal BR, Bhattacharay A
and Singh B: FDG-PET/CT in diagnose and early response evaluation
of extra-pulmonary tuberculosis in a patient with aplastic anemia.
J Postgrad Med. 56:219–221. 2010. View Article : Google Scholar : PubMed/NCBI
|
|
4
|
Liu Y, Wu H, Huang F, Fan Z and Xu B:
Utility of 18F-FDG PET/CT in diagnosis and management of
mucormycosis. Clin Nucl Med. 38:e370–e371. 2013. View Article : Google Scholar : PubMed/NCBI
|
|
5
|
Marsh JC, Ball SE, Cavenagh J, Darbyshire
P, Dokal I, Gordon-Smith EC, Keidan J, Laurie A, Martin A, Mercieca
J, et al: Guidelines for the diagnosis and management of aplastic
anaemia. Br J Haematol. 147:43–70. 2009. View Article : Google Scholar : PubMed/NCBI
|
|
6
|
Vardiman JW, Thiele J, Arber DA, Brunning
RD, Borowitz MJ, Porwit A, Harris NL, Le Beau MM,
Hellström-Lindberg E, Tefferi A and Bloomfield CD: The 2008
revision of the World Health Organization (WHO) classification of
myeloid neoplasms and acute leukemia: Rationale and important
changes. Blood. 114:937–951. 2009. View Article : Google Scholar : PubMed/NCBI
|
|
7
|
Valent P, Horny HP, Bennett JM, Fonatsch
C, Germing U, Greenberg P, Haferlach T, Haase D, Kolb HJ, Krieger
O, et al: Definitions and standards in the diagnosis and treatment
of the myelodysplastic syndromes: Consensus statements and report
from a working conference. Leuk Res. 31:727–736. 2007. View Article : Google Scholar : PubMed/NCBI
|
|
8
|
Bakheet SM, Saleem M, Powe J, Al-Amro A,
Larsson SG and Mahassin Z: F-18 fluorodeoxyglucose chest uptake in
lung inflammation and infection. Clin Nucl Med. 25:273–278. 2000.
View Article : Google Scholar : PubMed/NCBI
|
|
9
|
Goo JM, Im JG, Do KH, Yeo JS, Seo JB, Kim
HY and Chung JK: Pulmonary tuberculoma evaluated by means of FDG
PET: Findings in 10 cases. Radiology. 216:117–121. 2000. View Article : Google Scholar : PubMed/NCBI
|
|
10
|
Huang SC: Anatomy of SUV. Standardized
uptake value. Nucl Med Biol. 27:643–646. 2000. View Article : Google Scholar : PubMed/NCBI
|
|
11
|
Krause BJ, Beyer T, Bockisch A, Delbeke D,
Kotzerke J, Minkov V, Reiser M and Willich N: FDG-PET/CT in
oncology. German guideline. Nuklearmedizin. 46:291–301. 2007.(In
German). View Article : Google Scholar : PubMed/NCBI
|
|
12
|
Stergar H, Bockisch A, Eschmann SM, Krause
BJ, Rödel R, Tiling R and Weckesser M: Influence of
PET/CT-introduction on PET scanning frequency and indications.
Results of a multicenter study. Nuklearmedizin. 46:57–64. 2007.
View Article : Google Scholar : PubMed/NCBI
|
|
13
|
Young NS: Hematopoietic cell destruction
by immune mechanisms in acquired aplastic anemia. Semin Hematol.
37:3–14. 2000. View Article : Google Scholar : PubMed/NCBI
|