Introduction
Thyroid cancer is the most commonly diagnosed type
of endocrine tumor in the USA and its incidence has been rapidly
increasing from 1975 to 2014 (1).
Thyroid cancer is considered to be among the 10 most common types
of malignant tumors (2). According to
2016 data from the National Cancer Institute (National Institutes
of Health, Bethesda, MA, USA), the total of newly diagnosed cases
of thyroid cancer increased by an average of >5% annually in the
USA, and papillary thyroid carcinoma (PTC) was the fastest growing
malignancy (3). Although the majority
of PTC cases have a good prognosis, with a 10-year survival rate of
>90% (1), ~50% of these patients
are diagnosed with cervical lymph node metastasis alongside the
initial diagnosis of PTC (4). Between
10 and 20% of patients with PTC experience recurrent and distant
metastasis (4). Once distant
metastasis is identified, the 10-year survival rate of the patients
is reduced to ~40% (4).
At present, the main treatment approach for PTC is
surgical resection since chemotherapy is often ineffective in
patients with PTC (5). However,
surgical resection has been the subject of debate among academic
researchers in recent years. Certain scientists believe that due to
the low degree of PTC malignancy and its slow disease progression,
patients with <1 cm papillary thyroid microcarcinoma (PTMC)
should be temporarily monitored during follow-up (6). Other scientists have recommended
surgical resection and believe that PTMC is not necessarily
equivalent to low-risk cancer; indeed, a number of patients with
microcarcinomas have very rapid disease progression and early
emergence of local and distant metastasis (7). Therefore, in the absence of an effective
means of identification, the early diagnosis and treatment of PTC
remains necessary. Nevertheless, the underlying molecular
mechanisms of PTC onset and progression have not yet been
elucidated. Therefore, the study of high-risk molecular events in
PTC and the screening of molecular markers for the characterization
of high-risk PTC and those associated with PTC metastasis may aid
in identifying high-risk individuals at an early stage among
numerous patients with PTC to achieve an effective and early
diagnosis and prognosis as well as to conduct stratified treatments
in patients with important theoretical significance and clinical
value.
Long non-coding RNA (lncRNA) is a class of >200
base pair non-coding RNAs, and prior research has identified that
lncRNA serves an important function in gene transcription,
modification and post-transcriptional regulation (8). Previous studies have identified that
lncRNA serves a crucial function in the progression of a number of
solid tumors, including gastric, colon, kidney and pancreatic
cancer (9–13). LncRNA is involved in tumor suppressor
gene and oncogene activity via regulation of the chromosomal
structure and the expression of the downstream genes (14). Therefore, lncRNAs are hypothesized to
be important molecular markers and potential targets for the
diagnosis and treatment of cancer in the future.
The IHH4 cell line has been determined to have a
highly metastatic nature (15). The
present study screened highly metastatic IHH4 cell sub-strains and
used lncRNA and mRNA microarray chips to screen the lncRNA and mRNA
expression profiles associated with IHH4 metastasis. The objective
of the present study was to provide a molecular basis for the
future study of high-risk molecular markers of PTC.
Materials and methods
Cell culture
Since PTMC was defined as PTC with a maximum
diameter ≤1 cm, the genetic backgrounds of PTMC and PTC are the
same (16), and no specific PTMC cell
lines were identified to be available, the human PTC IHH4 cell line
was selected for use in the present study. IHH4 cells were derived
from a 75-year-old male patient with PTC and purchased from Health
Science Research Resources Bank (Osaka, Japan). This cell line was
cultured in 1:1 Dulbecco's modified Eagle's medium (DMEM:RPMI-1640
medium containing 10% fetal bovine serum; Gibco; Thermo Fisher
Scientific, Inc., Waltham, MA, USA). The IHH4 cell line was
passaged for >60 generations prior to purchase and was
stabilized. The IHH4 metastatic tumor model was used in the present
study to confirm the characteristics of PTC in metastatic pulmonary
tumors.
Screening of highly metastatic thyroid
cancer cell sub-strains
A Transwell chamber (8 µm; Corning Incorporated,
Corning, NY, USA) was used in the present study to screen the
highly metastatic IHH4 cell sub-strains according to previous
studies (17–19). A Transwell polycarbonate membrane
insert was coated with artificial Matrigel (BD Biosciences, San
Jose, CA, USA). IHH4 cells at a density of 2×10⁴ cells
were inoculated into each Transwell chamber and incubated at 37°C
with 5% CO2 for 24 h. A 1:1 mixture of DMEM:RPMI-1640 medium was
added in the upper chamber and a 1:1 mixture of DMEM:RPMI-1640
medium with 10% fetal bovine serum was added in the lower chamber.
After washed twice with PBS, the chamber was stained by 0.1%
crystal violet for 30 min at room temperature and viewed under a
light microscope (×200). Cells that migrated through the Transwell
membrane and into the lower chamber were collected to further
culture and passage. Sub-strain cell lines collected from the
passage were screened repeatedly according to the aforementioned
procedures. In order to ensure the reliability of the results,
wild-type IHH4 cells were divided into three groups (Group 1, Group
2 and Group 3) and Transwell assays were used to screen the cells
of three groups independently. The cells in the upper Transwell
chamber that did not migrate through the Matrigel membrane were
collected to further culture (DMEM:RPMI-1640 medium containing 10%
fetal bovine serum at 37°C with 5% CO2) to obtain the IHH4-C1,
IHH4-C2 and IHH4-C3 as the controls. The cells that passed the
membrane and were harvested from the lower chamber were cultured
for additional screening. Following 15 repeats of screening, three
relatively stable cell sub-strains, IHH4-M1, IHH4-M2 and IHH4-M3,
were obtained. Furthermore, the proliferation of IHH4-M and IHH4-C
cells was detected using a Cell Counting kit-8 (450 nm; Dojindo
Molecular Technologies, Inc., Kumamoto, Japan).
In vivo and in vitro metastatic
experiments
The animal experiments in the present study have
been reviewed and approved by the Animal Ethical and Welfare
Committee of Zhejiang Cancer Hospital (Zhejiang, China). The
present study used male BALB/c nude mice (purchased from the
Research Center of Laboratory Animal Science, Zhejiang Chinese
Medical University, Hangzhou, China) weighing 20-25 g at 6–8 weeks
of age. Mice were housed in clear polycarbonate cages with
controlled environment (20–24°C, 40–60% relative humidity, 12/12 h
light/dark cycles and food and water was available ad libitum). A
total of 18 nude mice were randomly divided into six groups,
namely, the IHH4-C1, IHH4-C2, IHH4-C3, IHH4-M1, IHH4-M2 and IHH4-M3
groups, and were maintained in a specific pathogen-free
environment. The IHH4 and IHH4-M cells were dissociated by 0.25%
trypsin-EDTA solution (1 ml at 37°C, for 1 min) and harvested by
centrifugation (300 × g at 37°C for 3 min) in the logarithmic
growth phase and prepared for single-cell suspension. Following
centrifugation (300 × g at 37°C, for 3 min) and PBS washing twice
(37°C for 15 sec), the number of cells in each group was counted.
The cell pellets were resuspended in serum-free RPMI-1640:DMEM
culture medium, followed by adjusting the cells at a density of
2×10⁵, which were used to inoculate the nude mice
through a caudal vein injection. All the animals in the present
study were observed individually once daily and the conditions of
the animals were recorded. The duration of the in vivo
experiment was 45 days, based on the experience of a preliminary
experiment (data not shown). On the 45th day, the tumors in the
lungs of the mice were not large. The maximum permitted tumor
diameter was 10 mm. Under these circumstances, tumors in the lung
may not increase the discomfort or pain, or affect activities of
the mice. Therefore, humane endpoints were established that the
mice would be humanely sacrificed on the 45th day of experiment or
when one of the following conditions was observed in mice according
to the Guidance published by The Organization for Economic
Co-operation and Development (20):
i) Prolonged or irreversible inability to eat or drink, including
immobility, obstruction of the oral cavity and missing or abnormal
teeth; ii) indication of severe pain, distress or suffering,
including fractures, self-induced trauma, abnormal vocalization,
abnormal posture or movements, and open wounds or ulcers; iii)
rapid or continuing weight loss, e.g., loss of ≥20% body weight
over a few days, or gradual but continued weight loss; iv) general
decrease in grooming and an abnormal appearance over an extended
time period, including rough coat, extensive alopecia, prolonged
diarrhea, urine-stained coat, swollen limbs, paralysis, or other
central or peripheral nervous disturbances (including convulsions,
circling behavior or prostration); v) severe or continuing
respiratory distress, including coughing, sneezing, nasal
discharge, or bloody nares or mouth; vi) bleeding, anemia or
unusual discharges; or vii) microbial infections or other diseases,
including those that interfere with the experimental protocol or
cause any of the above. In total, 17 mice (94.44%) were humanely
sacrificed on the 45th day of the experiment and only one mouse
(5.56%) in group IHH4-M3 was humanely sacrificed on the 38th day
since tumors formed in the lung and thyroid of the mouse and the
tumor in the thyroid had broken out through the skin. All the mice
were sacrificed by cervical dislocation in order to collect the
lung and thyroid tissues, which were fixed in 10% formalin solution
(48 h at 25°C). All the tissues were paraffin-embedded and
sectioned into 4-µm thickness for hematoxylin (5 min at 37°C) and
eosin (2 min at 37°C) staining to observe the tumor metastasis
under a light microscope and captured images was analyzed by
NIS-Elements D 3.0 (Nikon Corporation, Tokyo, Japan) with
magnification, ×200. The paraffin sections (4-µm thickness) in were
placed a 70°C oven for 30 min. As soon as the wax got melt,
deparaffinized with xylene and rehydrated. After microwave antigen
retrieval performed by 0.01 mol/l sodium citrate buffer (pH=6.0),
5% hydrogen peroxide (H2O2) was used to block the endogenous
peroxidase activity (5 min at 37°C). Anti-keratin 19 (CK19)
antibody (cat. no. ab52625; Abcam, Cambridge, MA, USA) was used to
detect the human-specific CK19 protein content in the tumor cells
(1:800 for 1 h at room temperature). Rinsed with PBS buffer three
times (5 min each), the sections were incubated with biotinylated
goat anti-rabbit IgG-HRP secondary antibody (1:1,000 for 30 min at
room temperature cat. no. ab136817, Abcam). The unbound secondary
antibody was washed out with PBS buffer (three times, 5 min each).
Followed by DAB coloration (2 min at 37°C), nuclear staining with
hematoxylin (2 min at 37°C), Scott tapwater bluing (2 min at 37°C)
and graded ethanol dehydration (50% ethanol for 30 sec at room
temperature; 75% ethanol for 30 sec at room temperature; 80%
ethanol for 30 sec at room temperature; 100% ethanol I for 3 min at
room temperature and 100% ethanol II for 3 min at room
temperature), and sections were sealed with neutral balsam and
observed under the light microscope at magnification, ×200 (Nikon
Corporation, Tokyo, Japan).
lncRNA chip assays
TRIzol® reagent (Thermo Fisher
Scientific, Inc.) was used to extract the total RNA from the IHH4-M
and IHH4-C cells. A MirVana miRNA Isolation kit (Ambion; Thermo
Fisher Scientific, Inc.) was used to purify the extracted total
RNA. A NanoDrop ND-1000 spectrophotometer was used to detect the
OD260/280 ratio to detect RNA purity, followed by 1% agarose gel
electrophoresis to examine the RNA integrity (2 µg/loading slot).
cDNA labeled with a fluorescent dye (Cy5 and Cy3-dCTP) was produced
by Eberwine's linear RNA amplification method (21), and the subsequent enzymatic reaction
and procedure was optimized by using CapitalBio cRNA Amplification
and Labeling kit (Beijing CapitalBio Technology Co., Inc., Beijing,
China) for producing higher yields of labeled cDNA according to the
manufacturer's protocol. The labeled cDNA was purified using a PCR
NucleoSpin Extract II kit (Macherey-Nagel, Duren, Germany) and
resuspended according to the manufacturer's protocol. DNA in
hybridization solution was denatured at 95°C for 3 min prior to
loading onto a microarray. Arrays were hybridized in an Agilent
Hybridization Oven (Agilent Technologies, Inc., Santa Clara, CA,
USA) overnight at a rotation speed of 10 × g and a temperature of
42°C and washed with two consecutive solutions (0.2% SDS and 2× SSC
at 42°C for 5 min, and 0.2× SSC for 5 min at room temperature). An
Agilent Microarray Scanner (Agilent Technologies, Santa Clara, CA,
USA) was used to collect the data from the microarray chips.
GeneSpring software (version 13.0; Agilent Technologies) was used
to collect the data for calibration and quality control. For the
selection of the differentially expressed genes, the expression
difference ≥2-fold and the P-value of the T-analysis <0.05 was
considered as differentially expressed (all the data were Log2
transformed) (22).
Gene function analysis
The differentially expressed genes were submitted to
the Database for Annotation, Visualization and Integrated Discovery
(version 6.8; http://david.abcc.ncifcrf.gov/), and Gene Ontology
(GO; http://www.geneontology.org/) and
enrichment-based cluster analysis was used to study the molecular
function of the differentially expressed genes. Pathway cluster
analysis was used to study the potential functions of the
differentially expressed genes in the signaling pathways.
Reverse transcription-quantitative
polymerase chain reaction (RT-qPCR) analysis
To further verify the results of the chip screening,
10 lncRNAs (NR_037676.1, ENST00000586841.1, TCONS_00029723,
ENST00000510284.1, XR_428320.1, TCONS_00019374, ENST00000504773.1,
ENST00000558696.1, ENST00000445300.1 and ENST00000594721.1) and 10
mRNAs [collagen and calcium binding EGF domains 1 (CCBE1), cluster
of differentiation (CD)82, frizzled class receptor 4 (FZD4),
thyroid receptor-interacting protein 14 (OASL), epithelium-specific
ets transcription factor 1 (ELF3), thrombin receptor-like 2
(F2RL2), family with sequence similarity 110 member C (FAM110C),
myelodysplasia syndrome-associated protein 1 (MECOM), pappalysin 2
(PAPPA2) and thyroid peroxidase (TPO)] were randomly selected for
RT-qPCR. The primers were designed by Primer Premier 5.0 software
(Premier Biosoft International, Palo Alto, CA, USA) and the
sequences of the primers used in the RT-qPCR are listed in Table I. GAPDH was used as the internal
reference for the RT-qPCR to detect the expression of 10 lncRNAs
and 10 mRNAs in the IHH4-M1, IHH4-M2, IHH4-M3, IHH4-C1, IHH4-C2 and
IHH4-C3 cell sub-strains. The expression levels of target
lncRNA/genes were detected using a 7500 Real-Time PCR system
(Applied Biosystems; Thermo Fisher Scientific, Inc.) using the SYBR
Premix Ex Taq II (Takara Bio, Inc., Otsu, Japan). The fold-change
of target lncRNA and gene expression intensity was calculated using
the 2−ΔΔCq method (23). The thermocycling conditions used in
RT-qPCR were as follows: Initial denaturation, 95°C for 30 sec,
followed by 40 cycles of 95°C for 5 sec and 60°C for 34 sec.
 | Table I.Primers used for reverse
transcription-quantitative polymerase chain reaction. |
Table I.
Primers used for reverse
transcription-quantitative polymerase chain reaction.
| lncRNA | mRNA |
|---|
| NR_037676.1 | Forward
GACTTTGCTGACCCAATGAC | CCBE1 | Forward
TGTGCCCACATCTGCATCAA |
|
| Reverse
AGTAGAGACGGGGTTTCACC |
| Reverse
GGCTTTCACCATGTTCTCAGACTTC |
|
ENST00000586841.1 | Forward
TCGTGATCATAACCCCAAAT | CD82 | Forward
AGCTGCACTGGTTTCGTGGA |
|
| Reverse
TTACAACAGGGCAGAACCTC |
| Reverse
CAGGACAGAGATGAAACTGCTCTTG |
| TCONS_00029723 | Forward
TCACCTGAGGTCAGGAGTTC | FZD4 | Forward
TGCCAGAACCTCGGCTACAAC |
|
| Reverse
TGATCTCCATAGCCTGCTTC |
| Reverse
GTGCACATTGGCACATAAACAGAAC |
|
ENST00000510284.1 | Forward
CAATTCAAGGCAGCAAGAAG | OASL | Forward
GCGGGTGCTGAAGGTAGTCAA |
|
| Reverse
TCGAACTCCTGACCTCAAGT |
| Reverse
GAAGCTGTGGAAACAGCTCAGAAAC |
| XR_428320.1 | Forward
AACCAGACCTTCTCCTGCTT | ELF3 | Forward
GACTTGGTACTGACCCTGAGCAAC |
|
| Reverse
ATGGAGGGGAAAACTAGCTG |
| Reverse
CTTGGTAGCTGATCCAGTCCAGAA |
| TCONS_00019374 | Forward
CTCATCACCTGGATCATCGT | F2RL2 | Forward
CCCTGATTCTCAGGCTAGAAGTGTC |
|
| Reverse
GCAGGTGCATCATCTCTCTC |
| Reverse
GGCATCCCCAGAAGCTCAA |
|
ENST00000504773.1 | Forward
TACAGGCCAGTGTAGGGAAA | FAM110C | Forward
CATCATCAAGTGGCTGTACACCTG |
|
| Reverse
GAACCTCTTCCTCCTTCCAG |
| Reverse
GCACACTAGCCAAATGGTCCTG |
|
ENST00000558696.1 | Forward
GCCTCCAAAAGAGACCTTTC | MECOM | Forward
GGAATCCAGTGCTATCCAGTCCA |
|
| Reverse
AGTGGCTCATGCCTGTAATC |
| Reverse
GCAGGTTTATAAGGCATTCTGCTCA |
|
ENST00000445300.1 | Forward
GGGTGCCTCCCACTTACTAT | PAPPA2 | Forward
GTGCGCAAGACCTGCTTTGA |
|
| Reverse
CAGGACCCCTTTCCTGTTAT |
| Reverse
GTGAGTGACAGCGTCCTTGTCC |
|
ENST00000594721.1 | Forward
TCCCTATGTTGCCTAAGCTG | TPO | Forward
AAACACTTGCCTGGCGAACA |
|
| Reverse
GGGGAATTATTTGGAAGACC |
| Reverse
GCTGACTGAAGCCGTCCTCATA |
Statistical analysis
In the present study the lncRNA and mRNA array data
were analyzed for data summarization, normalization and quality
control by using the GeneSpring software (version 13.0; Agilent
Technologies). An lncRNA or mRNA expression difference of ≥2-fold
was defined as differential expression. SPSS software (version
22.0; IBM Corp., Armonk, NY, USA) was used for data analysis. All
the data are presented as the mean ± standard deviation and
differences between means were analyzed using Student's t-test.
Student's t-test was used to examine the difference in expression
of genes/lncRNA between IHH4-M and IHH4-C groups. Graphical
representations were designed using GraphPad Prism 5 (GraphPad
Software, Inc., La Jolla, CA, USA) software. P<0.05 was
considered to indicate a statistically significant difference.
Results
Selection of highly invasive IHH4-M
cell sub-strains
Subsequent to 15 screenings with the Transwell
chamber, IHH4 and highly invasive IHH4-M cell sub-strains were
successfully obtained and cultured. Transwell invasion assays
confirmed that the invasive capacity of the IHH4-M cells was
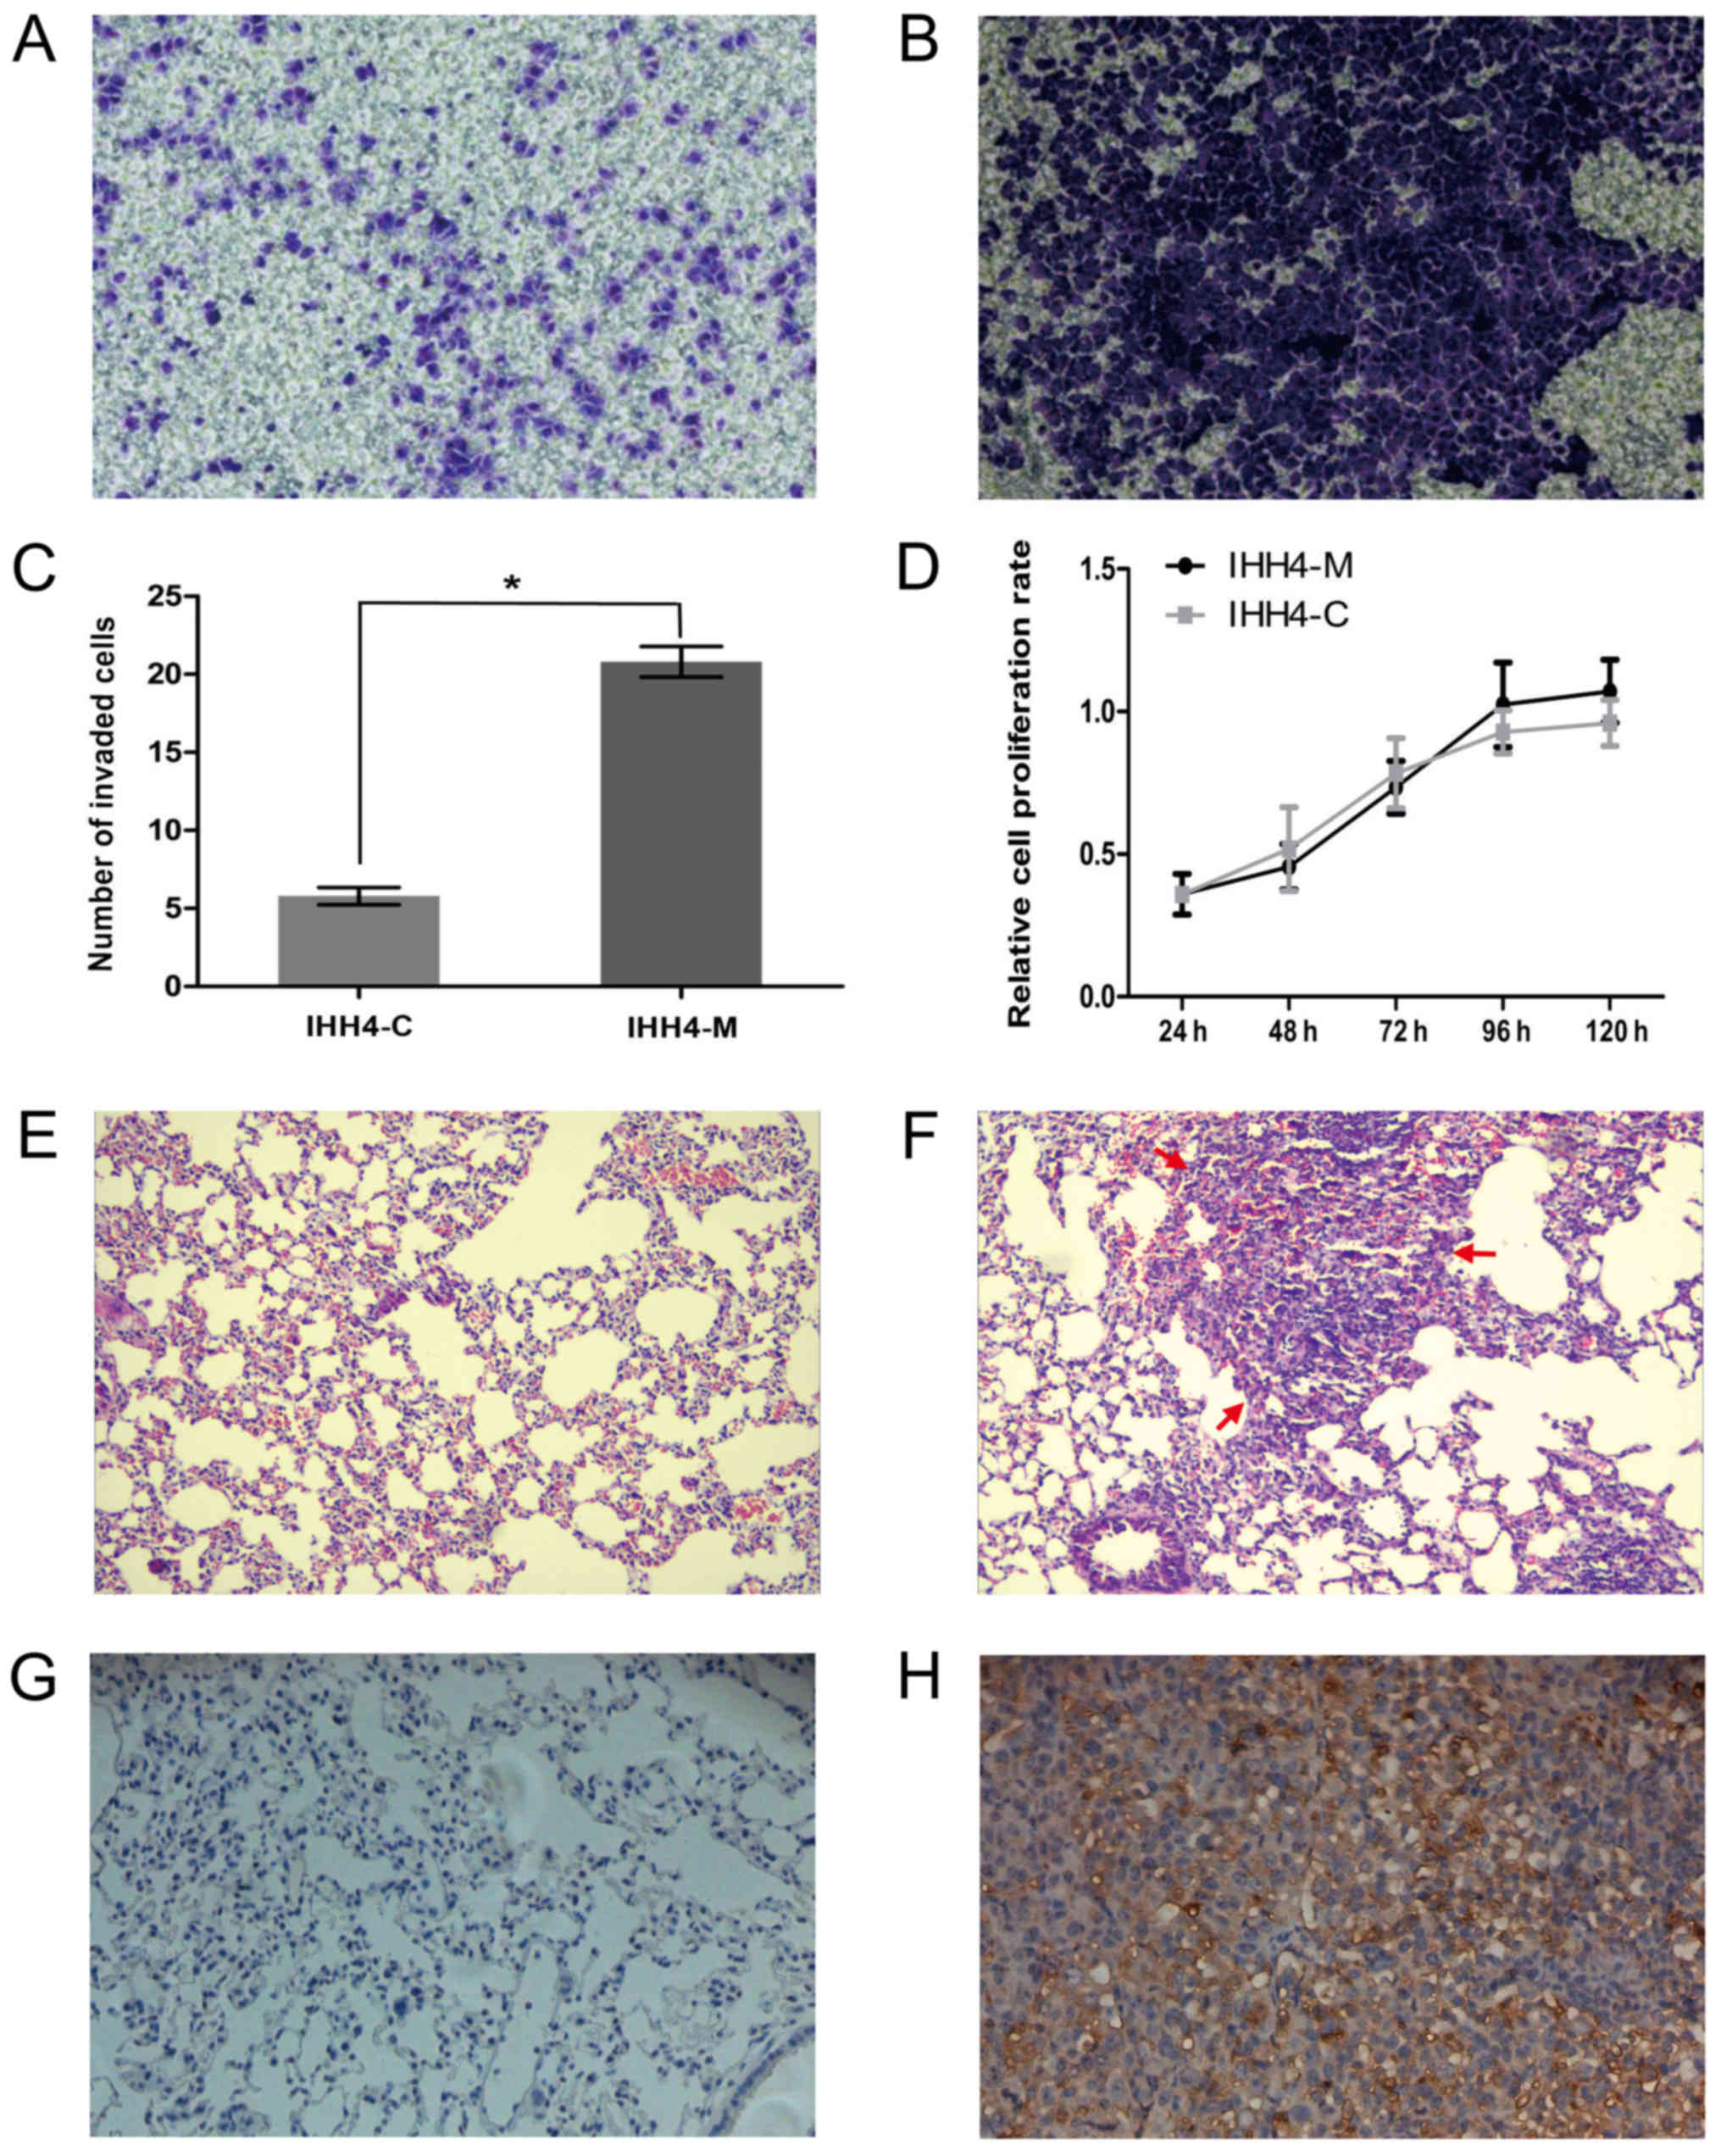
significantly higher than that of the IHH4-C cells (Fig. 1A and B) and the number of cells passed
Transwell membrane in IHH4-M group were significantly higher than
the IHH4-C group (Fig. 1C). The
results of a CCK-8 assay demonstrated that no significant
difference between the proliferation of IHH4-M and IHH4-C cells
(Fig. 1D; P>0.05). The
experimental results of the tumor-bearing nude mice revealed that
lung tumor formation in all the mice of the IHH4-M groups was
apparent, and only one mouse exhibited thyroid tumor formation,
while no lung tumor formation or smaller tumor formation was
observed in the mice of the IHH4-C groups compared with the IHH4-M
groups (Fig. 1E and F). The results
of immunohistochemistry examination demonstrated that all the
tumors had a relatively high expression of the human-specific
keratin CK19 protein, confirming that the tumor cells from the
lungs of nude mice originated from human thyroid tumor cells
(Fig. 1G and H). These results
confirmed that the IHH4-M cell sub-strains were highly invasive and
metastatic in the mice.
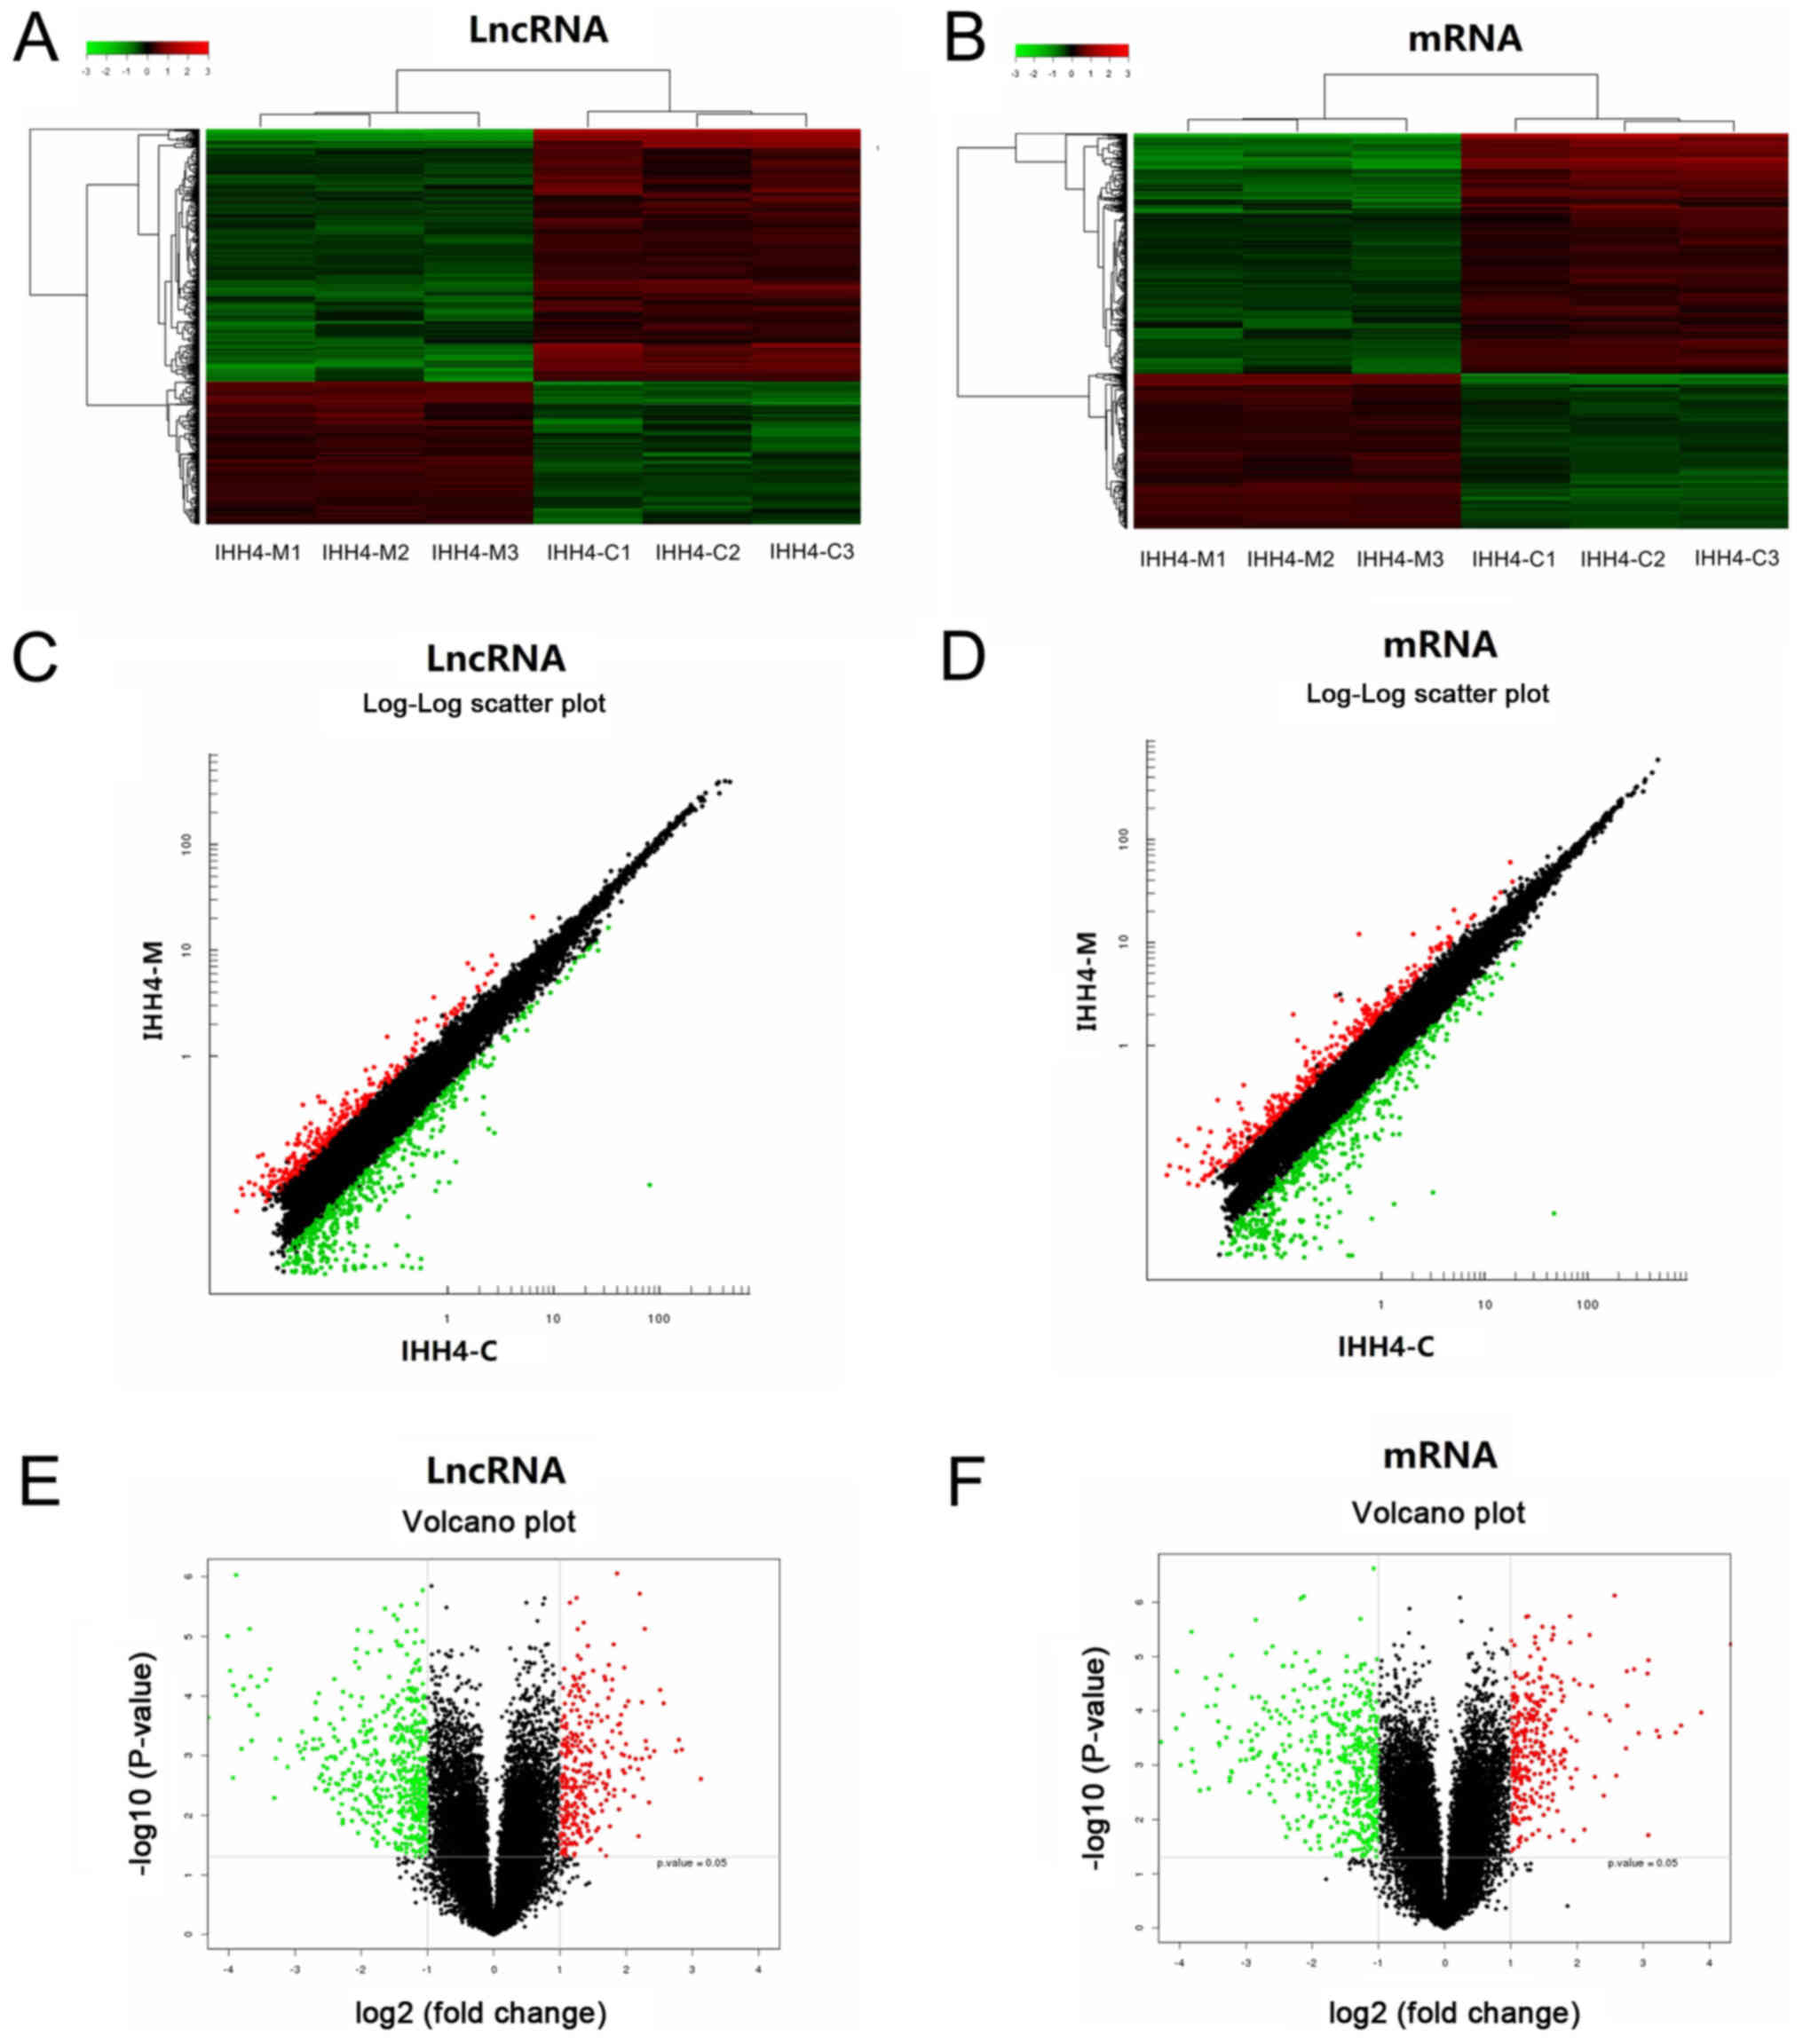
Differentially expressed lncRNAs and
mRNAs
To further clarify the association between PTC
metastasis and the relevant lncRNA and mRNA expression, a
microarray chip was used to analyze the differential expression
profile of the complete genome of lncRNAs and mRNAs in the IHH4-C
and IHH4-M cells. It identified that 795 lncRNAs had an expression
difference in the IHH4-C and IHH4-M cells; 286 lncRNAs had a high
expression in the IHH4-M cells, and 509 lncRNAs had a low
expression in the IHH4-M cells. Table
II presents the 20 lncRNAs with the largest expression
differences; XR_429061.1 had the largest difference among the
upregulated lncRNAs, and CDR1AS had the largest difference among
the downregulated lncRNAs. Additionally, 788 mRNAs had an
expression difference in the IHH4-C and IHH4-M cells; 309 mRNAs had
a high expression in the IHH4-M cells and 479 mRNAs had a low
expression in the IHH4-M cells. Table
III presents the 20 mRNAs with the largest expression
differences. Peptidase inhibitor had the highest difference among
the upregulated mRNAs, and CDR1 had the highest difference among
the downregulated mRNAs. For further cluster analysis, the in
vitro samples were divided into two large groups according to
the results of arrays. The first group included IHH4-C1, IHH4-C2
and IHH4-C3, and the second group included IHH4-M1, IHH4-M2 and
IHH4-M3, indicating that IHH4-M cells had more systematic changes
in lncRNA and mRNA expression levels than the IHH4-C cells. It also
indicated that these differentially expressed lncRNAs and mRNAs
were representative (Fig. 2).
| Table II.The 20 lncRNAs with the largest
expression differences. |
Table II.
The 20 lncRNAs with the largest
expression differences.
| Upregulated
lncRNAs | Downregulated
lncRNAs |
|---|
|
|
|---|
| lncRNA | Fold-change | P-value | lncRNA | Fold-change | P-value |
|---|
| XR_429061.1 | 8.745 |
2.462×10⁻³ | CDR1AS | 1,376.528 |
1.131×10⁻⁶ |
|
ENST00000565748.1 | 7.165 |
7.926×10⁻⁴ | NR_104228.1 | 55.781 |
6.841×10⁻⁶ |
|
ENST00000416341.1 | 6.949 |
5.430×10⁻⁴ |
ENST00000551210.1 | 48.202 |
6.483×10⁻⁵ |
|
ENST00000418029.1 | 6.745 |
8.403×10⁻⁴ | TCONS_00000982 | 47.740 |
7.044×10⁻⁵ |
| XR_245800.1 | 5.921 |
1.327×10⁻⁴ | TCONS_00010079 | 36.509 |
9.476×10⁻⁶ |
|
ENST00000504773.1 | 5.709 |
7.930×10⁻⁵ |
RNA95223|RNS_305_181 | 29.865 |
2.015×10⁻³ |
|
RNA95432|RNS_514_159 | 5.370 |
8.411×10⁻⁴ |
ENST00000552046.1 | 23.515 |
2.133×10⁻⁵ |
|
ENST00000591257.1 | 5.120 |
1.053×10⁻³ | uc022atw.1 | 20.679 |
1.348×10⁻⁴ |
|
ENST00000523030.1 | 5.082 |
6.101×10⁻³ |
ENST00000598149.1 | 19.948 |
2.281×10⁻⁴ |
| TCONS_00022574 | 4.948 |
7.618×10⁻⁴ | TCONS_00017468 | 16.193 |
9.872×10⁻⁶ |
|
ENST00000567668.1 | 4.911 |
5.678×10⁻⁴ | NR_028345.2 | 15.800 |
3.786×10⁻⁵ |
|
ENST00000569313.1 | 4.863 |
7.475×10⁻⁶ |
ENST00000445908.1 | 15.342 |
2.350×10⁻³ |
| uc021wad.1 | 4.757 |
2.416×10⁻³ |
ENST00000473756.1 | 15.283 |
6.667×10⁻⁵ |
| TCONS_00022572 | 4.723 |
1.272×10⁻⁴ | NR_048567.1 | 14.843 |
9.668×10⁻⁵ |
|
ENST00000459633.1 | 4.720 |
1.130×10⁻³ |
ENST00000515416.2 | 14.838 |
9.362×10⁻⁹ |
|
ENST00000553668.1 | 4.612 |
1.927×10⁻⁶ | TCONS_00013896 | 14.024 |
7.672×10⁻³ |
| TCONS_00008360 | 4.556 |
2.244×10⁻² | NR_028345.1 | 13.722 |
7.640×10⁻³ |
|
ENST00000453688.1 | 4.540 |
1.702×10⁻³ |
ENST00000456722.1 | 12.883 |
1.440×10⁻³ |
| TCONS_00010097 | 4.421 |
1.137×10⁻³ |
ENST00000549058.1 | 12.883 |
7.502×10⁻⁶ |
|
ENST00000469312.2 | 4.328 |
4.838×10⁻³ |
ENST00000555023.1 | 1,376.528 |
1.131×10⁻⁶ |
| Table III.The 20 mRNAs with the largest
expression differences. |
Table III.
The 20 mRNAs with the largest
expression differences.
| Upregulated
mRNAs | Downregulated
mRNAs |
|---|
|
|
|---|
| Genbank
accession | mRNA | Fold-change | P-value | Genbank
accession | mRNA | Fold-change | P-value |
|---|
| NM_002638 | PI3 | 20.060 |
5.963×10⁻⁶ | NM_004065 | CDR1 | 2,097.717 |
3.607×10⁻⁶ |
| NM_014505 | KCNMB4 | 14.685 |
1.076×10⁻⁴ | NM_007102 | GUCA2B | 85.694 |
2.864×10⁻⁵ |
| NM_006512 | SAA4 | 11.880 |
1.864×10⁻⁴ | NR_104228 | LINC00632 | 51.887 |
5.167×10⁻⁶ |
| NM_018689 | CEMIP | 11.246 |
2.511×10⁻⁴ | NM_138411 | FAM71E1 | 47.223 |
2.703×10⁻⁴ |
| NM_020980 | AQP9 | 9.459 |
3.002×10⁻⁴ | NM_003022 | SH3BGRL | 41.409 |
1.597×10⁻⁴ |
| NM_016529 | ATP8A2 | 9.220 |
2.326×10⁻⁴ | NM_080872 | UNC5D | 31.602 |
2.634×10⁻⁵ |
| NM_030754 | SAA2 | 8.459 |
1.171×10⁻⁵ | NM_001191323 | GREM1 | 21.488 |
1.474×10⁻³ |
| NM_020641 | EQTN | 8.365 |
2.062×10⁻⁵ | NM_024867 | SPEF2 | 19.466 |
3.762×10⁻⁴ |
| NM_018689 | CEMIP | 7.628 |
2.568×10⁻⁴ | NM_017697 | ESRP1 | 16.618 |
2.114×10⁻⁴ |
| NM_001127380 | SAA2 | 7.276 |
1.717×10⁻⁵ | NM_001164000 | MECOM | 16.489 |
1.888×10⁻⁵ |
| NM_052862 | RCSD1 | 6.766 |
8.038×10⁻⁵ | NR_045985 | ALOX15P1 | 15.885 |
1.000×10⁻³ |
| NM_152637 | METTL7B | 6.744 |
1.867×10⁻⁵ | NM_080872 | UNC5D | 15.465 |
1.184×10⁻⁴ |
| NM_012193 | FZD4 | 6.680 |
4.910×10⁻⁴ | NM_003253 | TIAM1 | 14.180 |
3.511×10⁻⁶ |
| NM_004751 | GCNT3 | 6.033 |
1.559×10⁻³ | NM_014790 | JAKMIP2 | 14.094 |
5.079×10⁻⁴ |
| NM_000331 | SAA1 | 5.930 |
7.545×10⁻⁷ | NM_020455 | GPR126 | 14.019 |
8.583×10⁻⁴ |
| NM_016529 | ATP8A2 | 5.630 |
1.503×10⁻⁴ | NM_033071 | SYNE1 | 13.644 |
1.333×10⁻³ |
| NM_004433 | ELF3 | 5.418 |
1.218×10⁻⁴ | NM_014491 | FOXP2 | 12.174 |
2.486×10⁻⁵ |
| NM_014228 | SLC6A7 | 4.821 |
1.650×10⁻³ | NM_032405 | TMPRSS3 | 12.021 |
8.291×10⁻⁵ |
| NM_000675 | ADORA2A | 4.673 |
3.503×10⁻⁵ | NM_005241 | MECOM | 11.033 |
7.952×10⁻⁵ |
| NM_001191055 | ERVV-2 | 4.585 | 1.116
×10−4 | NM_001033953 | CALCA | 10.850 |
3.999×10⁻⁵ |
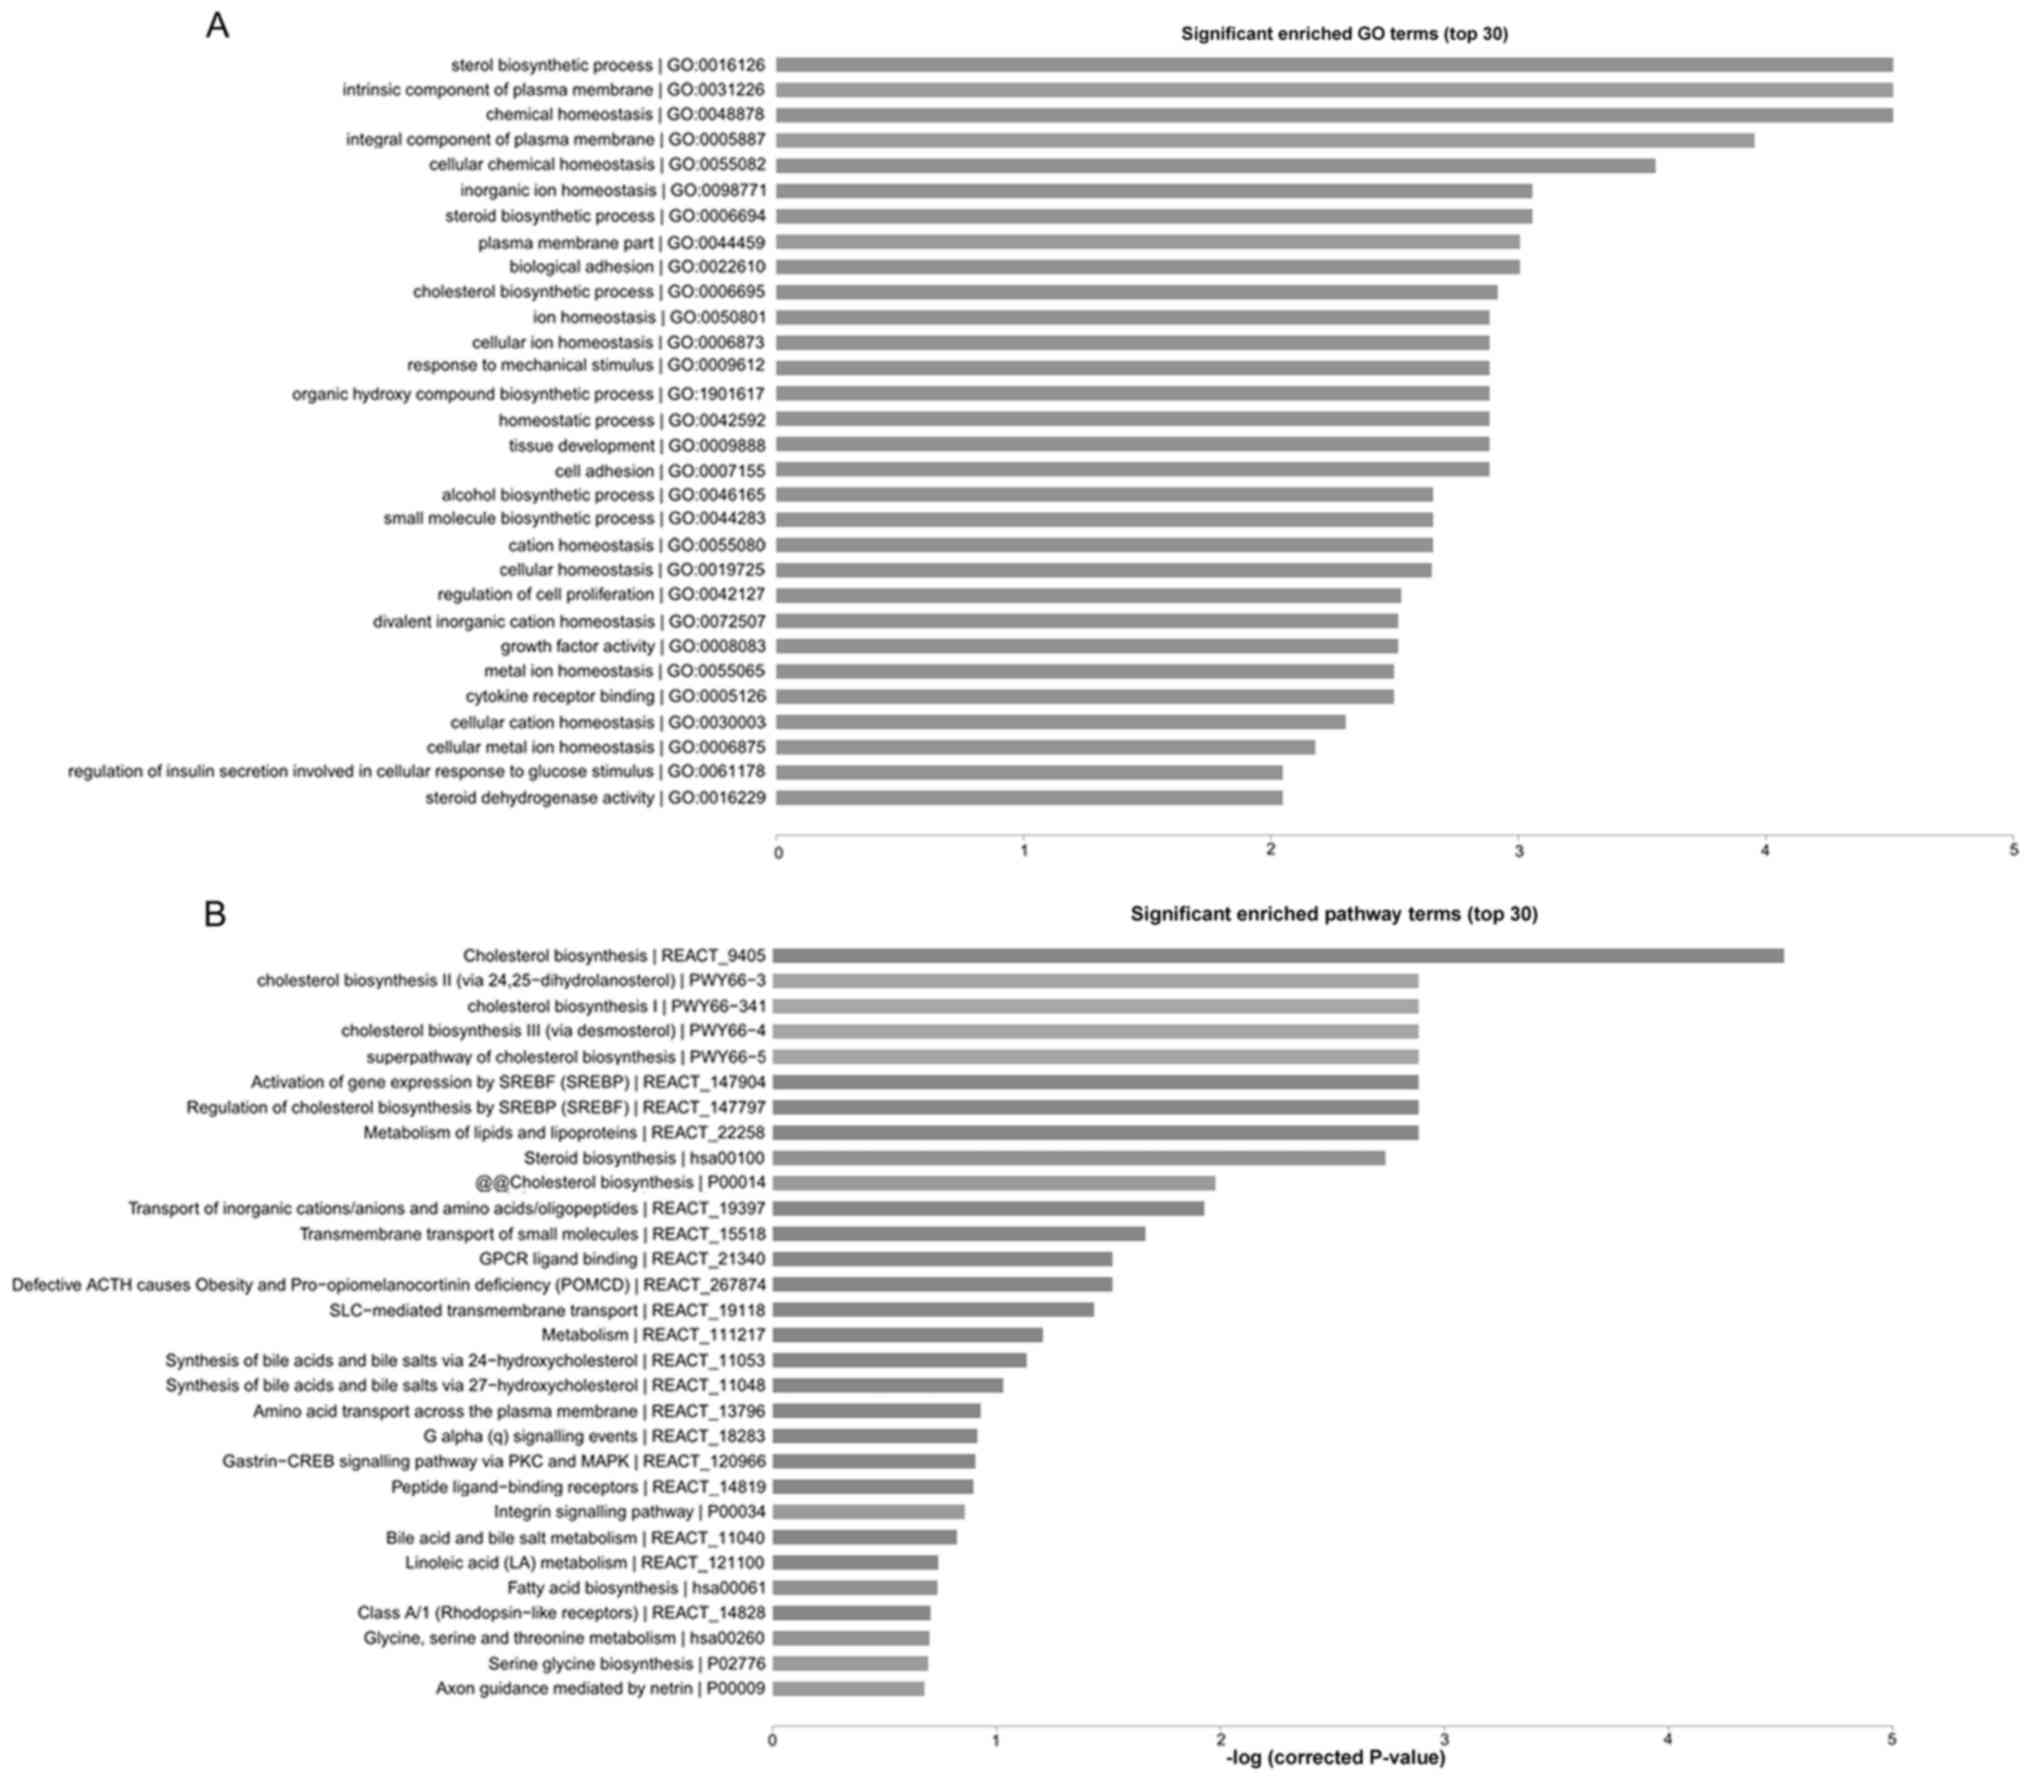
Functional analysis of differentially
expressed genes
GO cluster analysis and pathway cluster analysis
were performed on all the differentially expressed genes to further
analyze the function of these genes. The results of GO cluster
analysis revealed that the differentially expressed genes were
mainly associated with steroid biosynthesis, bioadhesion,
intercellular adhesion and other tumor metastasis-associated
biological processes (Fig. 3A). The
results of pathway cluster analysis revealed that the
differentially expressed genes were associated with tumor
metastasis-associated signaling pathways, including the cholesterol
metabolic signaling pathway, the sterol regulatory element-binding
protein signaling pathway and the integrin signaling pathway,
suggesting that lncRNAs may regulate PTC metastasis through various
signaling pathways (Fig. 3B).
RT-qPCR
The results of RT-qPCR revealed that the expression
of lncRNA ENST00000586841.1, TCONS_00029723, ENST00000510284.1,
XR_428320.1, TCONS_00019374, ENST00000504773.1 and
ENST00000594721.1 in IHH4-M cells was lower than that in the IHH4-C
cells, while the expression of lncRNA NR_037676.1,
ENST00000558696.1 and ENST00000445300.1 in IHH4-M cells was higher
than that in the IHH4-C cells. Fig.
4A presents the results of RT-qPCR analysis, and the expression
of the CCBE1, CD82, FZD4, OASL and ELF3 genes in the IHH4-M cells
was lower than that in the IHH4-C cells, while the expression of
F2RL2, FAM110C, MECOM, PAPPA2 and TPO in IHH4-M cells was higher
than that in the IHH4-C cells. As presented in Fig. 4B, the results were consistent with the
findings in the microarray chips, indicating that the chip results
were reliable.
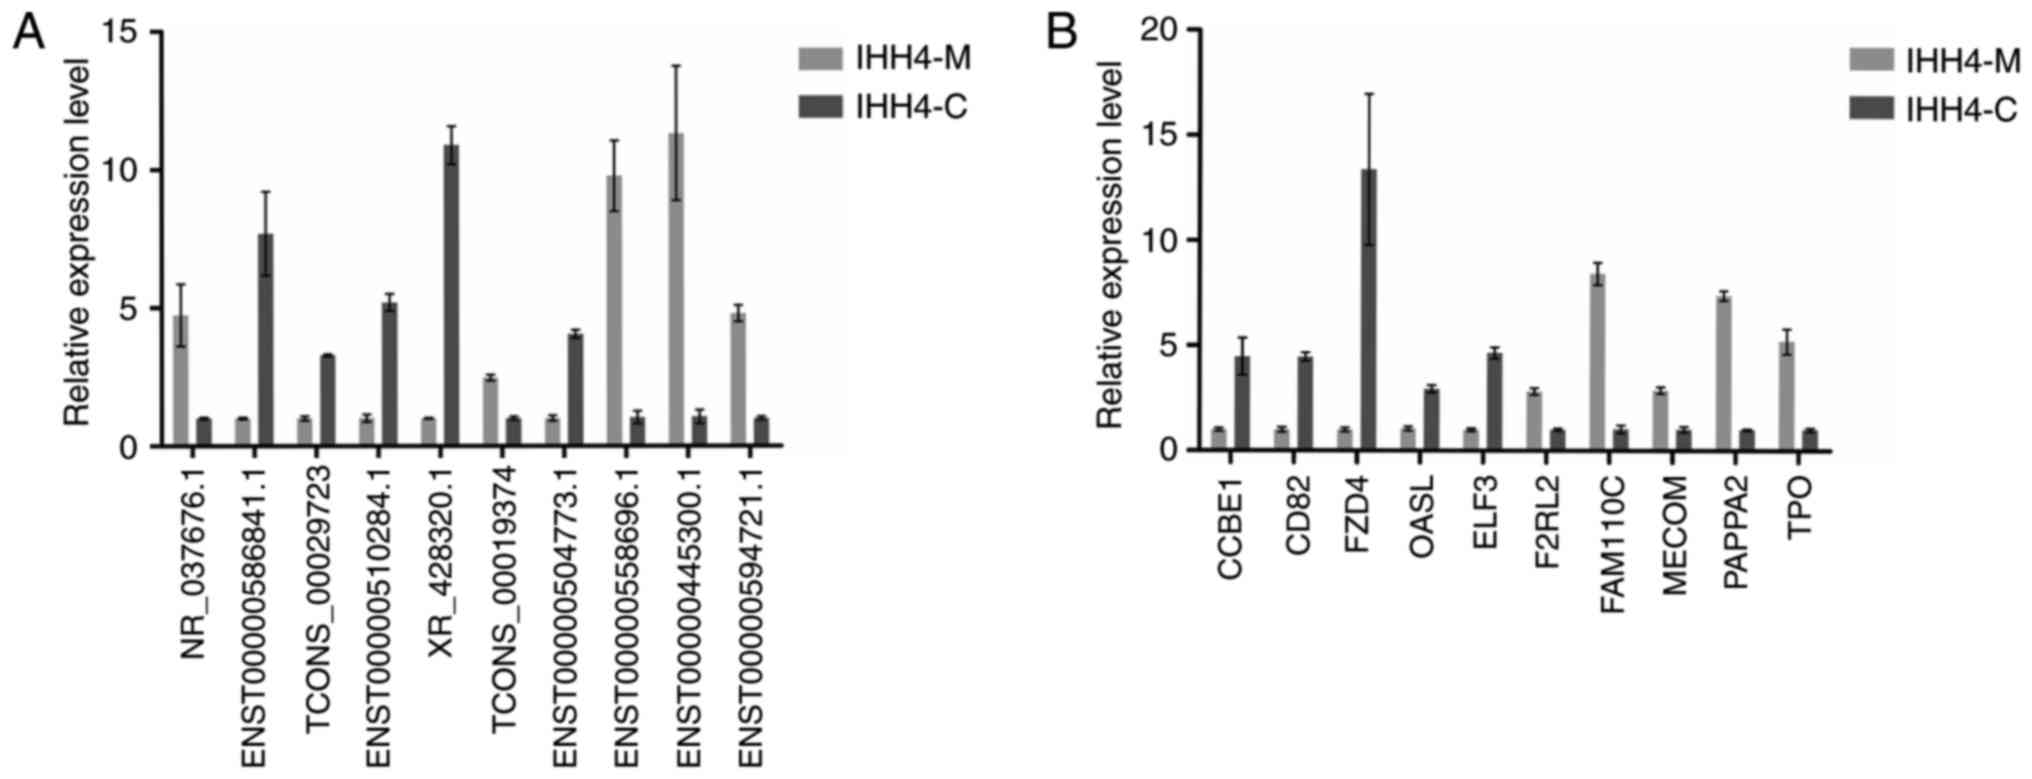 | Figure 4.RT-qPCR validation of 10
differentially expressed lncRNAs and mRNAs. (A) RT-qPCR validation
of 10 differentially expressed lncRNAs. (B) RT-qPCR validation of
10 differentially expressed mRNAs. RT-qPCR, reverse
transcription-quantitative polymerase chain reaction; CCBE1,
collagen and calcium binding EGF domains 1; CD, cluster of
differentiation; FZD4, frizzled class receptor 4; OASL, thyroid
receptor-interacting protein 14; ELF3, epithelium-specific ets
transcription factor 1; F2RL2, thrombin receptor-like 2; FAM110C,
family with sequence similarity 110 member C; MECOM, myelodysplasia
syndrome-associated protein 1; PAPPA2, pappalysin 2; TPO, thyroid
peroxidase; GO, gene ontology. |
Discussion
Previous studies have identified that proto-oncogene
B-Raf (BRAF), telomerase reverse transcriptase, phosphatase
and tensin homolog, runt-related transcription factor 2, S100
calcium binding protein A4, RAS (NRAS, HRAS and KRAS), Akt
serine/threonine kinase 1, ALK receptor tyrosine kinase, RET
proto-oncogene, paired box 8/peroxisome proliferator activated
receptor γ and galectin 3 genes serve certain functions in local
invasion, lymph node metastasis and distant metastasis of PTC
(24–27). BRAFV600E has been
considered as the most classic gene mutation in PTC and it is
associated with lymph node metastasis, recurrence and adenoid
tissue invasion of PTC (28).
Although some of these markers have been used in the auxiliary
diagnosis of thyroid cancer, no breakthrough has been made.
Detection of the majority of the markers depends on the acquisition
of surgical specimens and therefore cannot facilitate risk
stratification in patients preoperatively. This results in a
relatively significant challenge in the risk-stratified treatment
of PTC. The present study aimed to preliminarily elucidate the role
of certain regulatory genes (e.g., lncRNAs) in PTC invasion and
metastasis, and to provide a molecular basis for the screening and
risk-stratified treatment of high-risk patients with PTC in future
studies.
LncRNA was selected as the main research object as
it was hypothesized that lncRNA was a more distinctive marker for
diagnostic evaluation than traditional molecular markers. LncRNA is
abundantly present in the plasma. The detection of lncRNA directly
from the patient's plasma for the diagnostic evaluation may
effectively avoid the direct stimulation of the primary tumor
during examinations (e.g., puncture or biopsy collection), which is
more suitable for preoperative diagnosis and risk stratification
assessment (29). Furthermore, lncRNA
detection depends on RT-qPCR technology, and it requires relatively
less time and has a higher sensitivity compared with the
semi-quantitative analysis using immunohistochemistry, a
traditional detection method of protein molecular markers.
Therefore, quantitative lncRNA detection effectively avoids the
impact of human factors on the interpretation of the results.
LncRNA has previously been considered as the noise
of genomic transcription. However, an increasing number of studies
have recognized that lncRNA serves an important function in cell
proliferation, differentiation and malignant transformation
processes (30,31). Similar to the protein-coding gene,
lncRNA may regulate target gene expression and serve a function in
oncogene or tumor suppressor gene activity (32). LncRNA research in PTC has been rarely
reported. Yoon et al (33)
identified that the expression of an lncRNA, non-coding RNA
associated with MAP kinase pathway and growth arrest, was
downregulated in PTC with a BRAF mutation that was also
associated with cell growth arrest. Similarly, BRAF-activated long
non-coding RNA expression in PTC cells is significantly higher than
that in normal tissues. This overexpression significantly promotes
and activates PTC cell proliferation and autophagy (34). The results of these studies suggested
that abnormal lncRNA expression in PTC may serve an important
function; however, the sample sizes and details of the study
designs in the existing literature are limited and require further
in-depth study.
To ensure the reliability of the results of the
present study, independent cell sub-strains (i.e., IHH4-M1, IHH4-M2
and IHH4-M3) with a high invasive capacity and their corresponding
controls were selected to perform chip screening. These three cell
sub-strains originated from the IHH4 cell line, but they were
screened independently from the beginning of the experiment for 15
generations to ensure a similar genetic background with different
invasive and metastatic capacities in the sub-strains. Further
application of lncRNA microarray chips to screen the cell
sub-strains with differentially expressed lncRNA and mRNA profiles
compared with the control cells and the application of GO cluster
analysis and pathway cluster analysis for the functional prediction
of those lncRNAs and mRNAs revealed that certain genes were
associated with bioadhesion, intercellular adhesion and steroid
metabolic pathways. This suggested that lncRNAs may regulate PTC
metastasis through the regulation of steroid metabolic pathways. To
further verify the reliability of the microarray results, 10
differentially expressed lncRNAs and 10 differentially expressed
mRNAs were selected and their expression patterns in the IHH4-M and
IHH4-C cells was assessed using RT-qPCR. The results were
consistent with the microarray, indicating the reliability of the
microarray results. In conclusion, abnormal lncRNA expression may
serve an important function in the onset and development of PTC.
There may be an lncRNA regulatory network in PTC that regulates the
downstream target gene expression, thereby affecting thyroid cancer
cell proliferation, invasion and metastasis. In the present study,
a portion of the lncRNAs associated with PTC metastasis were
screened. These lncRNAs may be involved in PTC invasion, metastasis
and malignant transformation processes. These data provided an
important molecular basis for future screening, stratified
diagnosing and treating high-risk patients with PTC in the clinic.
Further investigation and study of the mechanism of lncRNA and the
cause of abnormal lncRNA expression is required.
However, there are certain limitations to the
present study, which require to be expanded upon in further
studies. PTC cells were used rather than PTMC cells in the present
study due to the lack of PTMC cell lines, resulting in the absence
of data on lncRNA and mRNA expression in highly-vs. lowly-invasive
PTMC cells. Additionally, a Transwell assay was used rather than
in vivo selection to obtain the sub-strains with different
invasiveness, as the wild-type IHH4 cells were difficult to develop
into a tumor under the skin of the nude mice in preliminary
experiments. This may affect the reliability of the results to a
certain extent and further studies using in vivo selection
are required. Furthermore, Transwell assays and in vivo
experiments were used to detect the invasiveness of different
sub-strains in the present study. However, certain features,
including proliferation and cell death were only preliminarily
examined using a CCK-8 assay. This may influence the reliability of
the results and additional experiments on proliferation and cell
death, including colony formation experiments are required.
Immunohistochemical analysis of the 20 genes that were examined was
not performed in tissue samples taken from patients with PTMC. The
use of tissue samples over cultured cell lines would further
validate these data.
Acknowledgements
The authors would like to thank Dr Ke-xin Yin
(Second Clinical Medical College, Zhejiang Chinese Medical
University, Hangzhou, China) for her technical assistance for cell
culture and in vivo experiment support.
Funding
The present study was supported by the National
Natural Science Foundation of China (grant no. 81702644), the
National Natural Science Foundation of China (grant no. 81672642),
the Major Science and Technology Project of Zhejiang Province
(grant no. 2015C03027) and the Project of Administration of
Traditional Chinese Medicine of Zhejiang Province of China (grant
no. 2017ZA037).
Availability of data and materials
The datasets used and analyzed during the current
study are available from the corresponding author on reasonable
request.
Authors' contributions
MHG made substantial contributions to acquisition of
data and analysis and interpretation of data. LHJ made substantial
contributions to acquisition of data and analysis of data, and was
involved in drafting the manuscript and responsible for the
subsequent revision of the manuscript. QLW, ZT and CC provided
technical assistance. CMZ and XZ analyzed the data. JWC and ZYZ
interpreted the results. XJC made substantial contributions to
conception and design, and gave final approval of the version to be
published. All authors read and approved the final manuscript.
Ethics approval and consent to
participate
The animal experiments in the present study had been
reviewed and approved by the Animal Ethical and Welfare Committee
of Zhejiang Cancer Hospital.
Patient consent for publication
Not applicable.
Competing interests
The authors declare that they have no competing
interests.
References
|
1
|
Howlader N, Noone AM, Krapcho M, et al:
SEER Cancer Statistics Review, 1975–2014. National Cancer
Institute; Bethesda, MD: https://seer.cancer.gov/csr/1975_2014/based on
November 2016 SEER data submission, posted to the SEER web site.
April. 2017
|
|
2
|
Davies L and Welch HG: Current thyroid
cancer trends in the United States. JAMA Otolaryngol Head Neck
Surg. 140:317–322. 2014. View Article : Google Scholar : PubMed/NCBI
|
|
3
|
Siegel RL, Miller KD and Jemal A: Cancer
statistics, 2016. CA Cancer J Clin. 66:7–30. 2016. View Article : Google Scholar : PubMed/NCBI
|
|
4
|
Durante C, Haddy N, Baudin E, Leboulleux
S, Hartl D, Travagli JP, Caillou B, Ricard M, Lumbroso JD, De
Vathaire F and Schlumberger M: Long-term outcome of 444 patients
with distant metastases from papillary and follicular thyroid
carcinoma: Benefits and limits of radioiodine therapy. J Clin
Endocrinol Metab. 91:2892–2899. 2006. View Article : Google Scholar : PubMed/NCBI
|
|
5
|
American Thyroid Association (ATA)
Guidelines Taskforce on Thyroid Nodules and Differentiated Thyroid
Cancer, . Cooper DS, Doherty GM, Haugen BR, Kloos RT, Lee SL,
Mandel SJ, Mazzaferri EL, McIver B, Pacini F, et al: Revised
American Thyroid Association management guidelines for patients
with thyroid nodules and differentiated thyroid cancer. Thyroid.
19:1167–1214. 2009. View Article : Google Scholar : PubMed/NCBI
|
|
6
|
Ito Y and Miyauchi A: Nonoperative
management of low-risk differentiated thyroid carcinoma. Curr Opin
Oncol. 27:15–20. 2015. View Article : Google Scholar : PubMed/NCBI
|
|
7
|
Wada N, Duh QY, Sugino K, Iwasaki H,
Kameyama K, Mimura T, Ito K, Takami H and Takanashi Y: Lymph node
metastasis from 259 papillary thyroid microcarcinomas: Frequency,
pattern of occurrence and recurrence, and optimal strategy for neck
dissection. Ann Surg. 237:399–407. 2003. View Article : Google Scholar : PubMed/NCBI
|
|
8
|
Ponting CP, Oliver PL and Reik W:
Evolution and functions of long noncoding RNAs. Cell. 136:629–641.
2009. View Article : Google Scholar : PubMed/NCBI
|
|
9
|
Sun W, Wu Y, Yu X, Liu Y, Song H, Xia T,
Xiao B and Guo J: Decreased expression of long noncoding RNA
AC096655.1-002 in gastric cancer and its clinical significance.
Tumour Biol. 34:2697–2701. 2013. View Article : Google Scholar : PubMed/NCBI
|
|
10
|
Sun M, Jin FY, Xia R, Kong R, Li JH, Xu
TP, Liu YW, Zhang EB, Liu XH and De W: Decreased expression of long
noncoding RNA GAS5 indicates a poor prognosis and promotes cell
proliferation in gastric cancer. BMC Cancer. 14:3192014. View Article : Google Scholar : PubMed/NCBI
|
|
11
|
Ge X, Chen Y, Liao X, Liu D, Li F, Ruan H
and Jia W: Overexpression of long noncoding RNA PCAT-1 is a novel
biomarker of poor prognosis in patients with colorectal cancer. Med
Oncol. 30:5882013. View Article : Google Scholar : PubMed/NCBI
|
|
12
|
Qiao HP, Gao WS, Huo JX and Yang ZS: Long
non-coding RNA GAS5 functions as a tumor suppressor in renal cell
carcinoma. Asian Pac J Cancer Prev. 14:1077–1082. 2013. View Article : Google Scholar : PubMed/NCBI
|
|
13
|
Liu JH, Chen G, Dang YW, Li CJ and Luo DZ:
Expression and prognostic significance of lncRNA MALAT1 in
pancreatic cancer tissues. Asian Pac J Cancer Prev. 15:2971–2977.
2014. View Article : Google Scholar : PubMed/NCBI
|
|
14
|
Braconi C, Kogure T, Valeri N, Huang N,
Nuovo G, Costinean S, Negrini M, Miotto E, Croce CM and Patel T:
microRNA-29 can regulate expression of the long non-coding RNA gene
MEG3 in hepatocellular cancer. Oncogene. 30:4750–4756. 2011.
View Article : Google Scholar : PubMed/NCBI
|
|
15
|
Lv N, Shan Z, Gao Y, Guan H, Fan C, Wang H
and Teng W: Twist1 regulates the epithelial-mesenchymal transition
via the NF-kB pathway in papillary thyroid carcinoma. Endocrine.
51:469–477. 2016. View Article : Google Scholar : PubMed/NCBI
|
|
16
|
Leboulleux S, Tuttle RM, Pacini F and
Schlumberger M: Papillary thyroid microcarcinoma: Time to shift
from surgery to active surveillance? Lancet Diabetes Endocrinol.
4:933–942. 2016. View Article : Google Scholar : PubMed/NCBI
|
|
17
|
Fan YH, Ding J, Nguyen S, Liu XJ, Xu G,
Zhou HY, Duan NN, Yang SM, Zern MA and Wu J: Aberrant hedgehog
signaling is responsible for the highly invasive behavior of a
subpopulation of hepatoma cells. Oncogene. 35:116–124. 2016.
View Article : Google Scholar : PubMed/NCBI
|
|
18
|
Huang C: Abstract 426: Suppression of cell
invasion and migration by inhibitors to ROS level in human lung
cancer cells. Cancer Res. 70:426. 2010. View Article : Google Scholar
|
|
19
|
Lu KV, Jong KA, Rajasekaran AK, Cloughesy
TF and Mischel PS: Upregulation of tissue inhibitor of
metalloproteinases (TIMP)-2 promotes matrix metalloproteinase
(MMP)-2 activation and cell invasion in a human glioblastoma cell
line. Lab Invest. 84:8–20. 2004. View Article : Google Scholar : PubMed/NCBI
|
|
20
|
William S: Guidance document on the
recognition, assessment, and use of clinical signs as humane
endpoints for experimental animals used in safety evaluation. OECD
Environmental Health and Safety Publications, Series on Testing and
Assessment 19; 2000
|
|
21
|
Patterson TA, Lobenhofer EK,
Fulmer-Smentek SB, Collins PJ, Chu TM, Bao W, Fang H, Kawasaki ES,
Hager J, Tikhonova IR, et al: Performance comparison of one-color
and two-color platforms within the MicroArray quality control
(MAQC) project. Nat Biotechnol. 24:1140–1150. 2006. View Article : Google Scholar : PubMed/NCBI
|
|
22
|
Eisen MB, Spellman PT, Brown PO and
Botstein D: Cluster analysis and display of genome-wide expression
patterns. Proc Natl Acad Sci USA. 95:14863–14868. 1998. View Article : Google Scholar : PubMed/NCBI
|
|
23
|
Livak KJ and Schmittgen TD: Analysis of
relative gene expression data using real-time quantitative PCR and
the 2(-Delta Delta C(T)) method. Methods. 25:402–408. 2001.
View Article : Google Scholar : PubMed/NCBI
|
|
24
|
Xing M, Haugen BR and Schlumberger M:
Progress in molecular-based management of differentiated thyroid
cancer. Lancet. 381:1058–1069. 2013. View Article : Google Scholar : PubMed/NCBI
|
|
25
|
Liu R, Bishop J, Zhu G, Zhang T, Ladenson
PW and Xing M: Mortality risk stratification by combining BRAF
V600E and TERT promoter mutations in papillary thyroid cancer:
Genetic duet of BRAF and TERT promoter mutations in thyroid cancer
mortality. JAMA Oncol. Sep 1–2016.(Epub ahead of print).
|
|
26
|
Carr FE, Tai PW, Barnum MS, Gillis NE,
Evans KG, Taber TH, White JH, Tomczak JA, Jaworski DM, Zaidi SK, et
al: Thyroid hormone receptor-β (TRβ) mediates runt-related
transcription factor 2 (Run×2) expression in thyroid cancer cells:
A novel signaling pathway in thyroid cancer. Endocrinology.
157:3278–3292. 2016. View Article : Google Scholar : PubMed/NCBI
|
|
27
|
Joung JY, Kim TH, Jeong DJ, Park SM, Cho
YY, Jang HW, Jung YY, Oh YL, Yim HS, Kim YL, et al: Diffuse
sclerosing variant of papillary thyroid carcinoma: Major genetic
alterations and prognostic implications. Histopathology. 69:45–53.
2016. View Article : Google Scholar : PubMed/NCBI
|
|
28
|
Sidaway P: Thyroid cancer: BRAF and/or
TERT mutations increase mortality. Nat Rev Clin Oncol. 13:6522016.
View Article : Google Scholar
|
|
29
|
Gupta Chandra S and Tripathi Nandan Y:
Potential of long non-coding RNAs in cancer patients: From
biomarkers to therapeutic targets. Int J Cancer. 140:1955–1967.
2017. View Article : Google Scholar : PubMed/NCBI
|
|
30
|
Gibb EA, Brown CJ and Lam WL: The
functional role of long non-coding RNA in human carcinomas. Mol
Cancer. 10:382011. View Article : Google Scholar : PubMed/NCBI
|
|
31
|
Eades G, Zhang YS, Li QL, Xia JX, Yao Y
and Zhou Q: Long non-coding RNAs in stem cells and cancer. World J
Clin Oncol. 5:134–141. 2014. View Article : Google Scholar : PubMed/NCBI
|
|
32
|
Moran VA, Perera RJ and Khalil AM:
Emerging functional and mechanistic paradigms of mammalian long
non-coding RNAs. Nucleic Acids Res. 40:6391–6400. 2012. View Article : Google Scholar : PubMed/NCBI
|
|
33
|
Yoon H, He H, Nagy R, Davuluri R, Suster
S, Schoenberg D, Pellegata N and Ade Chapelle L: Identification of
a novel noncoding RNA gene, NAMA, that is downregulated in
papillary thyroid carcinoma with BRAF mutation and associated with
growth arrest. Int J Cancer. 121:767–775. 2007. View Article : Google Scholar : PubMed/NCBI
|
|
34
|
Wang Y, Guo Q, Zhao Y, Chen J, Wang S, Hu
J and Sun Y: BRAF-activated long non-coding RNA contributes to cell
proliferation and activates autophagy in papillary thyroid
carcinoma. Oncol Lett. 8:1947–1952. 2014. View Article : Google Scholar : PubMed/NCBI
|