Introduction
Breast cancer is the most common malignancy
diagnosed in women worldwide and is one of the leading causes of
cancer-associated mortality (1). The
incidence of breast cancer has been increasing every year and
although treatments for breast cancer have improved recently, the
clinical outcome of patients remains unsatisfactory (2). The majority of cancer-associated
mortalities are due to the metastasis of primary tumors (3). The epithelial-mesenchymal transition
(EMT) is a crucial step in cancer invasion and metastasis. Its
initiation corresponds with the loss of epithelial properties and
the acquisition of migratory mesenchymal characteristics, leading
to aggressive cancer progression (4).
Members of the transforming growth factor-β (TGF-β)
superfamily are multifunctional proteins that regulate various
cellular responses, including cell proliferation, differentiation,
migration and apoptosis (5).
Exogenous TGF-β1 may serve an important role in determining the
migration and invasion capabilities of breast cancer cells, as it
induces the EMT (6). Therefore,
inhibiting the induction of the EMT by TGF-β1 may be a novel
therapeutic strategy to treat patients with breast cancer.
Histone acetyltransferase GCN5 (GCN5; also known as
KAT2A) is essential for the development of multiple organs and
serves important roles in cell proliferation, differentiation, cell
cycle and DNA damage repair (7,8). Previous
studies have demonstrated that GCN5 dysfunction is linked to
different types of cancer, including breast cancer (9,10). It has
been demonstrated that GCN5 is a critical component of the
TGF-β/Smad signaling pathway in breast cancer cells and enhances
the transcriptional activity of TGF-β1 (6). However, the precise mechanism underlying
the TGF-β-induced EMT remains to be elucidated. Epigenetic
regulation is recognized as one driving force of the EMT.
Upregulation of GCN5, as well as the histone acetylation of certain
EMT genes, has been reported in lung cancer cells following
treatment with an epidermal growth factor receptor inhibitor
(11). Therefore, it is conceivable
that GCN5 may work downstream of the TGF-β/Smad signaling pathway
to epigenetically regulate the EMT in breast cancer. Thus, the
objective of the current study was to investigate the effect of
GCN5 on the TGF-β1-induced EMT in breast cancer cells and determine
its underlying mechanism of action.
Materials and methods
Cell culture and TGF-β treatment
The human breast cancer cell lines MDA-MB231, MCF-7
and Hs578T were purchased from Shanghai Cancer Institute (Shanghai,
China) and cultured in Dulbecco's Modified Eagle's medium (DMEM;
Gibco; Thermo Fisher Scientific, Inc., Waltham, MA, USA) containing
sodium bicarbonate, 10% fetal bovine serum (FBS), 2 mmol/l
L-glutamine, 100 U/ml penicillin and 100 µg/ml streptomycin
(Sigma-Aldrich; Merck KGaA, Darmstadt, Germany) in a humidified 5%
CO2 atmosphere at 37°C for 24 h. A total of
5×10³ cells/well were plated in 96-well plates. Cells
were incubated with or without 5 ng/ml TGF-β1. The protocol and
procedure of the experiment were approved by the Ethics Committee
of Linyi People's Hospital (Shandong, China). MDA-MB231 cells were
treated with TGF-β1 (5 ng/ml) with or without sorafenib (5 µM;
Bayer AG, Leverkusen, Germany), and incubated for 0, 1, 2 and 3
days.
Determination of cell viability
MDA-MB231, MCF-7 and Hs578T cells were seeded into a
96-well plate (1×10⁵ cells/well). When cells reached 90%
confluence, they were cultured in serum-free medium for 24 h and
then incubated with or without 5 ng/ml TGF-β1 for 24 h. MDA-MB231
cells were divided into three groups depending on different
treatments: TGF-β1, sorafenib and TGF-β1+sorafenib. In addition,
GCN5 siRNA was used to knockdown GCN5 expression in MDA-MB231
cells. Cell viability was measured using the MTT assay (American
Type Culture Collection, Manassas, VA, USA). A total of 10 µl of 12
mM MTT stock solution was added to each well and incubated at 37°C
for 4 h. Subsequently, 500 µl of dimethyl sulfoxide was added to
each well and incubated at 37°C for 10 min. The plate was
transferred to a plate reader (Beckman Coulter, Fullerton, CA, USA)
and the absorbance was measured at 550 nm. Cell viability was
estimated in triplicate.
Plasmid production
MDA-MB231 cells were used for the following
experiments. To induce GCN5 overexpression, the green fluorescent
protein-coding region in the lentiviral vector FUGW was replaced
with GCN5 coding sequences. The lentiviral vector pLKO.1 was used
for gene knockdown. Plasmids were obtained from Shanghai GenePharma
Co, Ltd. (Shanghai, China). The construction of the GCN5 mutant was
performed as described previously (12). DNA oligonucleotides for the GCN5-small
interfering (si)RNA were synthesized, annealed and cloned into
pLKO.1. The sequences of GCN5 siRNA (80 µg, 100 nM) used were as
follows: Forward, 5′-GCUCUACACAACCCUCAAATT-3′ and reverse,
5′-UUUGAGGGUUGUGUAGAGCTT-3′. MDA-MB231 cells were transfected with
GCN5 vector (GCN5-WT) or GCN5 mutant vector (GCN5-MUT), as well as
siRNA against GCN5 (GCN5 siRNA) or scramble siRNA (control siRNA)
using Lipofectamine™ 2000 (Thermo Fisher Scientific, Inc.),
following the manufacturer's instructions. Following 6 h incubation
at 37°C, the transfection medium was replaced with 2 ml DMEM
containing 10% FBS. Cells were subsequently harvested for the
assays.
GCN5 activity assay
MDA-MB231 cells were incubated with or without 5
ng/ml TGF-β1 for 24 h. GCN5 activity was determined using the GCN5
chemiluminescent assay kit (cat. no. 50079; BPS Bioscience, San
Diego, CA, USA) according to the manufacturer's instructions.
Briefly, 40 µl master mixture containing 5 µl cell supernatant, 5
µl 10× HAT assay buffer, 5 µl acetyl-coenzyme A (1 mM) as well as
25 µl water was placed in each well of a 96-well plate. The kit
included purified GCN5 as positive control. For the blank control,
5 µl 10× HAT Assay Buffer and 35 µl water were added to the wells.
Subsequently, each well was incubated with primary antibody for 1 h
at room temperature with slow shaking and then incubated with
secondary antibody for 30 min (antibodies were included in the
assay kit). A total of 100 µl horseradish peroxidase (HRP)
chemiluminescent substrate A and HRP chemiluminescent substrate B
with a 1:1 ratio were added to the mixture in each well. Any unused
chemiluminescent reagent was discarded following use. Samples were
measured using a luminometer or microtiter plate reader capable of
measuring chemiluminescence. The Blank value was subtracted from
all other values.
Cell migration and invasion
assays
In vitro Transwell migration and invasion
assays was performed in a modified Boyden chamber assay with a
Falcon™ Cell Culture Insert (BD Biosciences, San Jose, CA, USA) in
24-well plates. The membrane was coated with Matrigel to simulate
the typical matrices that cancer cells encounter during the
invasion process in vivo; for the migration assay, only the
membrane without coating was used. A total of 1×10⁵
cells/well were suspended in serum-free medium and plated in the
top chamber of the Transwell chambers. The lower chamber was filled
with medium containing 10% FBS, which acted as a chemoattractant.
Following 24 h, cells that migrated through the membrane were
subsequently fixed with 100% absolute alcohol at room temperature
for 30 min and stained with 0.05% crystal violet at room
temperature for 10 min. Following air drying, migrated cells were
quantified by counting the optical density of cells per four
high-power fields under a light microscope with ×40
magnification.
RNA extraction and reverse
transcription-quantitative polymerase chain reaction (RT-qPCR)
Total RNA was extracted from MDA-MB231 cells using
the TriPure Isolation Reagent (Roche Diagnostics, Indianapolis, IN,
USA) following the manufacturer's instructions. cDNA was
synthesized from 2 µg total RNA using the Transcriptor First Strand
cDNA Synthesis kit (Roche Diagnostics), according to the
manufacturer's instructions. mRNA levels were determined by qPCR
using SYBR Green I Master (Roche Diagnostics). Thermal cycling
conditions consisted of 2 min at 50°C, 10 min at 94°C, and followed
by 40 cycles of 94°C for 15 sec, 60°C for 15 sec, 72°C for 15 sec,
and 1 sec at 80.5°C for plate reading. Following the cycling
protocol, the final step was applied to all reactions by
continuously monitoring fluorescence through the dissociation
temperature of the PCR product at a temperature transition rate of
0.1°C/sec to generate a melting curve. Quantification was conducted
according to the 2−ΔCq method (12). Reactions were performed in triplicate
with GAPDH acting as an internal control. The sequences of primers
were used: GCN5 forward, 5′-TTCCGAGTGGAGAAGGACA-3′ and reverse,
5′-AGCATGGACAGGAATTTGG-3′; GAPDH forward,
5′-ACAACTTTGGTATCGTGGAAGG-3′ and reverse,
5′-GCCATCACGCCACAGTTTC-3′.
Western blot analysis
Total protein was extracted from cells using
radioimmunoprecipitation assay lysis buffer (Beyotime Institute of
Biotechnology, Haimen, China). Total cellular protein
concentrations were determined using a BCA assay kit (Beyotime
Institute of Biotechnology). A total of 30 µg protein was loaded
per lane and separated by 10% SDS-PAGE gel electrophoresis and
transferred onto a polyvinylidene fluoride membrane (EMD Millipore,
Billerica, MA, USA). Following being blocked in 5% milk at room
temperature for 2 h, the membrane was immunoblotted with primary
antibodies against E-cadherin (cat. no. sc-71008; 1:500),
N-cadherin (cat. no. sc-8424; 1:500), vimentin (cat. no. sc-73260;
1:500), snail family transcriptional repressor 1 (Snail; cat. no.
sc-271977; 1:1,000), snail family transcriptional repressor 2
(slug; cat. no. sc-166476; 1:1,000), fibronectin (cat. no.
sc-18825; 1:1,000), GCN5 (cat. no. sc-6303; 1:500), p-STAT3 (cat.
no. sc-293059; 1:1,000), p-21 (cat. no. sc-377515; 1:500), p-AKT
(cat. no. sc-7985-R; 1:1,000), MMP9 (cat. no. sc-137213; 1:500),
E2F1 (cat. no. sc-251; 1:1,000) and GAPDH (cat. no. sc-69778;
1:5,000) at 4°C overnight. The membranes were then incubated with
anti-rabbit secondary antibody (cat. no. Sc-2357; 1:2,000) or
anti-goat secondary antibody (cat. no. Sc-2354; 1:2,000) at 37°C
for 1 h. All antibodies were purchased from Santa Cruz
Biotechnology Inc. (Dallas, TX, USA). The visualization reagent was
Millipore Western Blot HRP-ECL reagent (cat. no. WBKLS0100;
Sigma-Aldrich; Merck KGaA). Western blot quantitative analysis was
performed using Scion Image software 4.03 (Scion Corp., Frederick,
MD, USA).
Immunohistochemistry
Cells were cultured on cover glass slides and fixed
with 4% paraformaldehyde (Sigma-Aldrich; Merck KGaA) at room
temperature for 15 min and then permeabilized in 0.1% Triton X-100
(Sigma-Aldrich; Merck KGaA). Cells were washed with 2% glycine
solution, then blocked with PBS containing 2% FBS and 0.5% saponin
for 30 min at 37°C. Anti-mouse antibodies against E-cadherin (4A2;
monoclonal; cat. no. 14472S; Cell Signaling Technology, Inc.,
Danvers, MA, USA) were diluted at 1:100 in PBS with 1.5% normal
goat serum (cat. no. C0265; Beyotime Institute of Biotechnology)
and incubated overnight at 4°C. Cells were then incubated with
Alexa Fluor 488-conjugated secondary antibodies (1:1,000 dilution,
cat. no. ab201540; Abcam, Cambridge, MA, USA) for 1 h at room
temperature. Cells were then stained with DAPI for 2–3 min at room
temperature. The slides were mounted with Mowiol solution
(SouthernBiotech, Birmingham, AL, USA). Immunofluorescence was
viewed using a Zeiss LSM-5Pa confocal microscope (magnification,
×40; Zeiss, Oberkochen, Germany).
Statistical analysis
All results are presented as the mean ± standard
error of the mean. Differences between groups were compared using
two-way analysis of variance followed by Dunnett's test. P<0.05
was considered to indicate a statistically significant difference.
All of the statistical analyses were performed using GraphPad Prism
v5.0 software (GraphPad Software, Inc., La Jolla, CA, USA).
Results
GCN5 activity is increased during the
EMT induced by TGF-β1 in breast cancer cells
A number of key growth factors are able to induce
the EMT, among which TGF-β1 is an important inducer during the
metastasis that occurs in breast cancer. Therefore, the effect of
TGF-β1 on the viability of breast cancer cells was assessed. Three
breast cell lines were treated with 5 ng/ml TGF-β1 for 0, 1, 2, 3
and 4 days to investigate the effect of TGF-β1 on EMT induction. An
MTT assay was performed to determine whether TGF-β1 induces
toxicity in breast cancer cells. Following incubation with 5 ng/ml
TGF-β1, cell viability was not markedly affected in any of the
three breast cancer cell lines (Fig.
1A). Thus, 5 ng/ml TGF-β1 was selected to induce the EMT in
breast cancer cells for 3 days. It was determined that TGF-β1
significantly increased GCN5 activity by 39.2, 38.9 and 41.3% in
MDA-MB231, MCF-7 and Hs578T cells, respectively (all P<0.05;
Fig. 1B). Furthermore, levels of GSN5
mRNA increased following treatment with TGF-β1 by 31, 35 and 32% in
MDA-MB231, MCF-7 and Hs578T cells, respectively (all P<0.05;
Fig. 1C). In addition, MDA-MB231,
MCF-7 and Hs578T cells treated with TGF-β1 for 3 days exhibited
increased mRNA levels of GSN5 and the mesenchymal cell markers
N-cadherin and vimentin (all P<0.05) but decreased levels of the
epithelial cell marker E-cadherin (all P<0.05; Fig. 1C). Furthermore, the expression of
N-cadherin, vimentin, fibronectin, snail and slug were increased
following treatment with TGF-β1, but the expression of E-cadherin
was decreased in the MDA-MB231, MCF-7 and Hs578T cell lines,
compared with controls (Fig. 1D). All
three cell lines exhibited similar responses to stimulation with
TGF-β1, any cell can be suitable for the next experiments and
represent the other two cells, thus MDA-MB231 were selected for all
subsequent experiments.
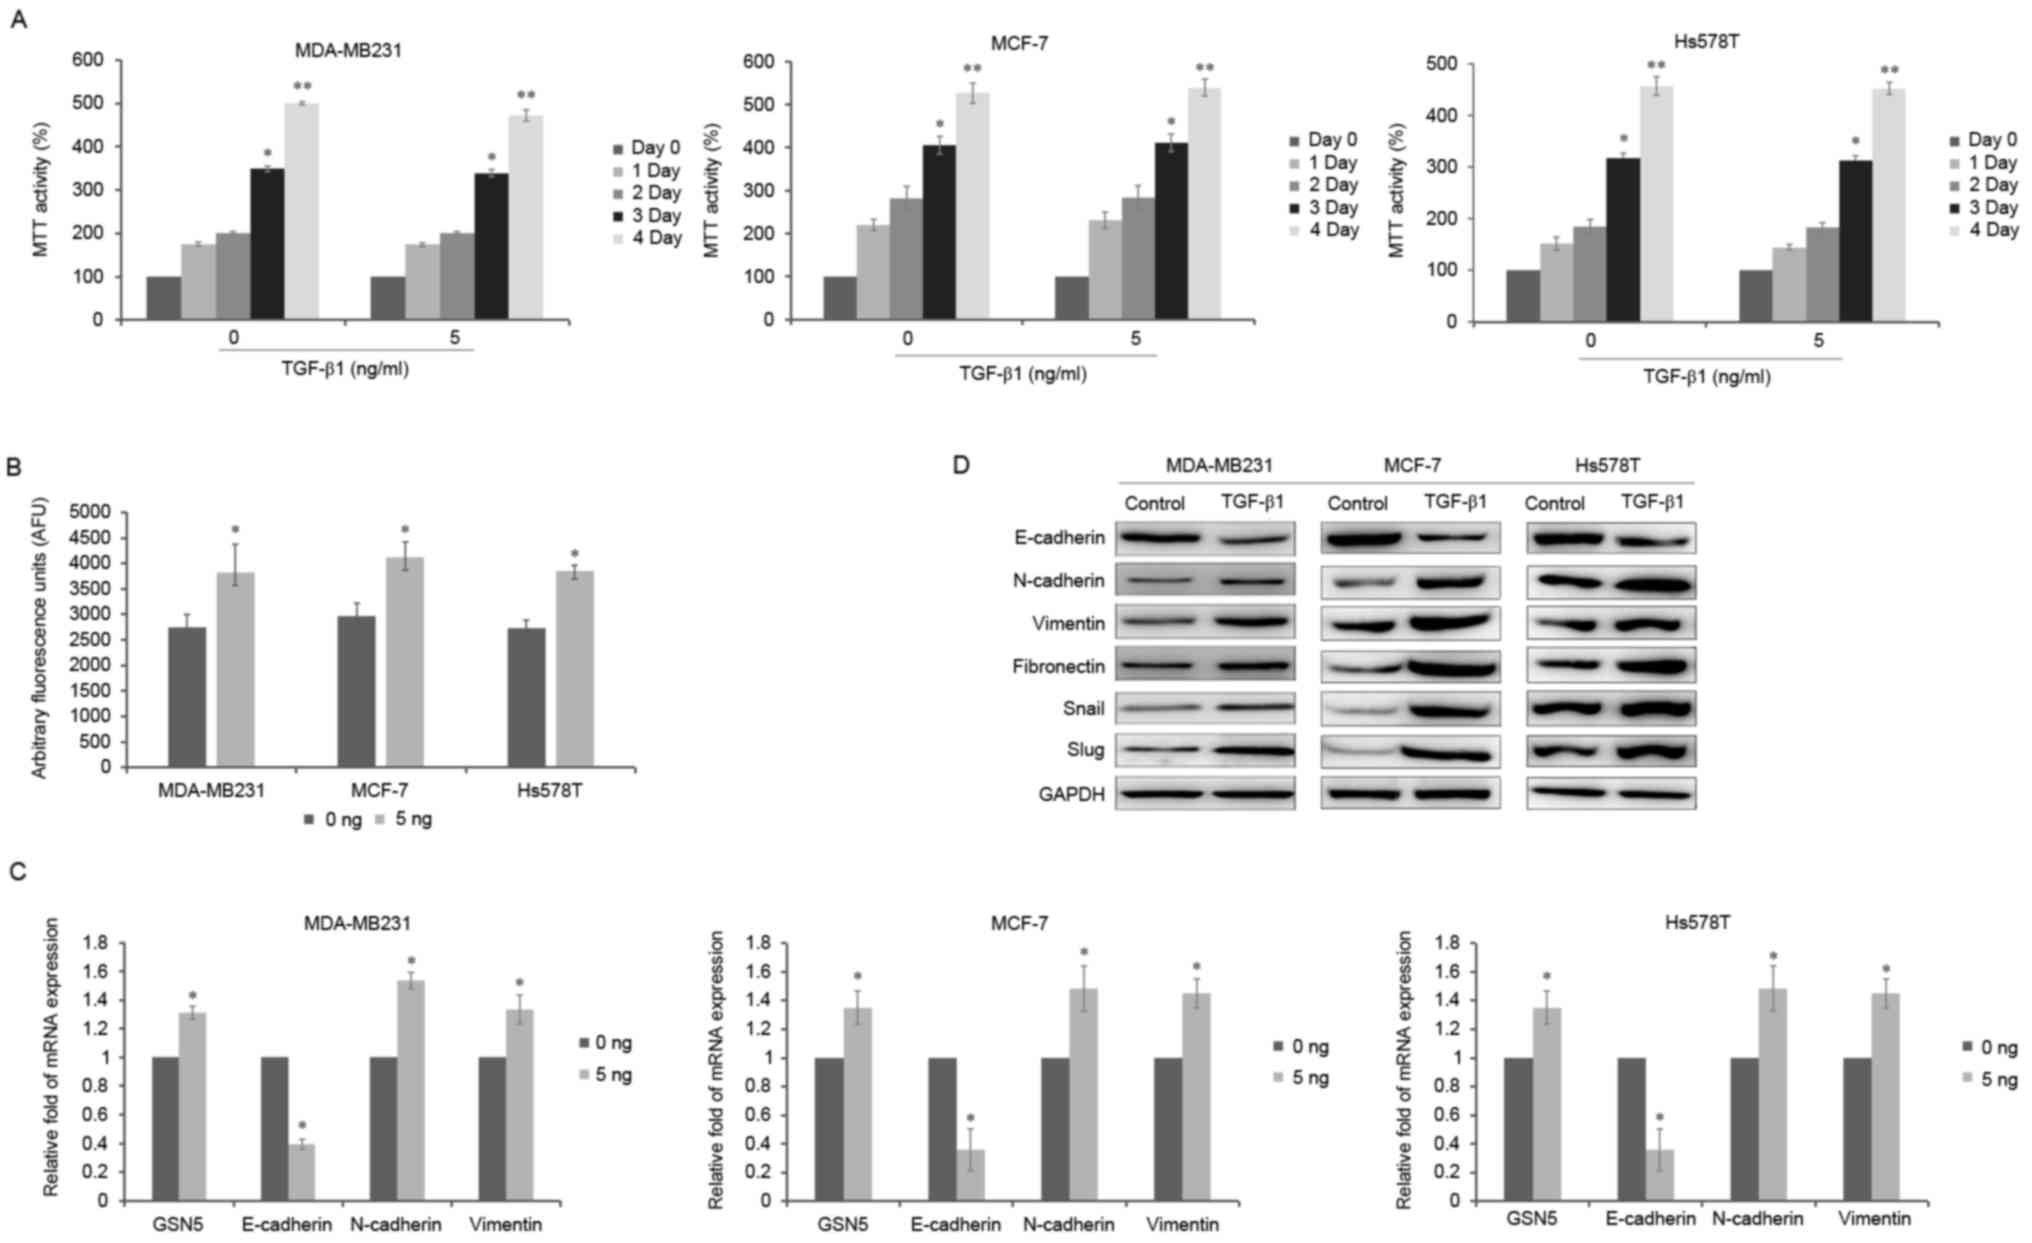 | Figure 1.Effects of TGF-β1 treatment on cell
viability, GCN5 activity and the expression of GSN5 and EMT markers
in MDA-MB231, MCF-7 and Hs578T cells. (A) MTT assay of cell
viability following incubation of MDA-MB231, MCF-7 and Hs578T cells
with 5 ng/ml TGF-β1 for 0, 1, 2, 3 and 4 days. (B) GCN5 activity
following stimulation with 5 ng/ml TGF-β1 was measured using a GCN5
chemiluminescent assay kit. (C) Reverse transcription-quantitative
polymerase chain reaction measured the levels of GSN5, E-cadherin,
N-cadherin and vimentin mRNA in MDA-MB231, MCF-7 and Hs578T cells
treated with or without 5 ng/ml TGF-β1 for 3 days. (D) Western blot
analysis of E-cadherin, N-cadherin, vimentin, fibronectin, snail
and slug expression in MDA-MB231 cells treated with 5 ng/ml TGF-β1
for 3 days compared with untreated cells. Values are presented as
the mean ± standard error of the mean (n=3). *P<0.05 vs. day 0
and **P<0.01 vs. day 0 or 0 ng. EMT, epithelial-mesenchymal
transition; TGF-β1, transforming growth factor-β1. |
Treatment with GCN5 inhibitor
counteracts the TGF-β1-induced EMT in breast cancer cells
Sorafenib (Nexavar or BAY 43–9006) is approved for
the treatment of many tumors and it has been reported that
sorafenib is able to attenuate the EMT and cell migration by
inhibiting TGF-β1 (11,13). To examine the effect of sorafenib on
cell viability following stimulation with TGF-β1, MDA-MB231 cells
were treated with TGF-β1 (5 ng/ml) with or without sorafenib (5
µM), and incubated for 0, 1, 2 and 3 days. Cell viability was
significantly decreased by 12.2% following treatment with sorafenib
compared with cells exposed to TGF-β1 alone (P<0.05; Fig. 2A). Sorafenib was demonstrated to
affect viability most significantly following treatment for 72 h,
thus, MDA-MB231 cells were exposed to sorafenib for 72 h in
subsequent experiments.
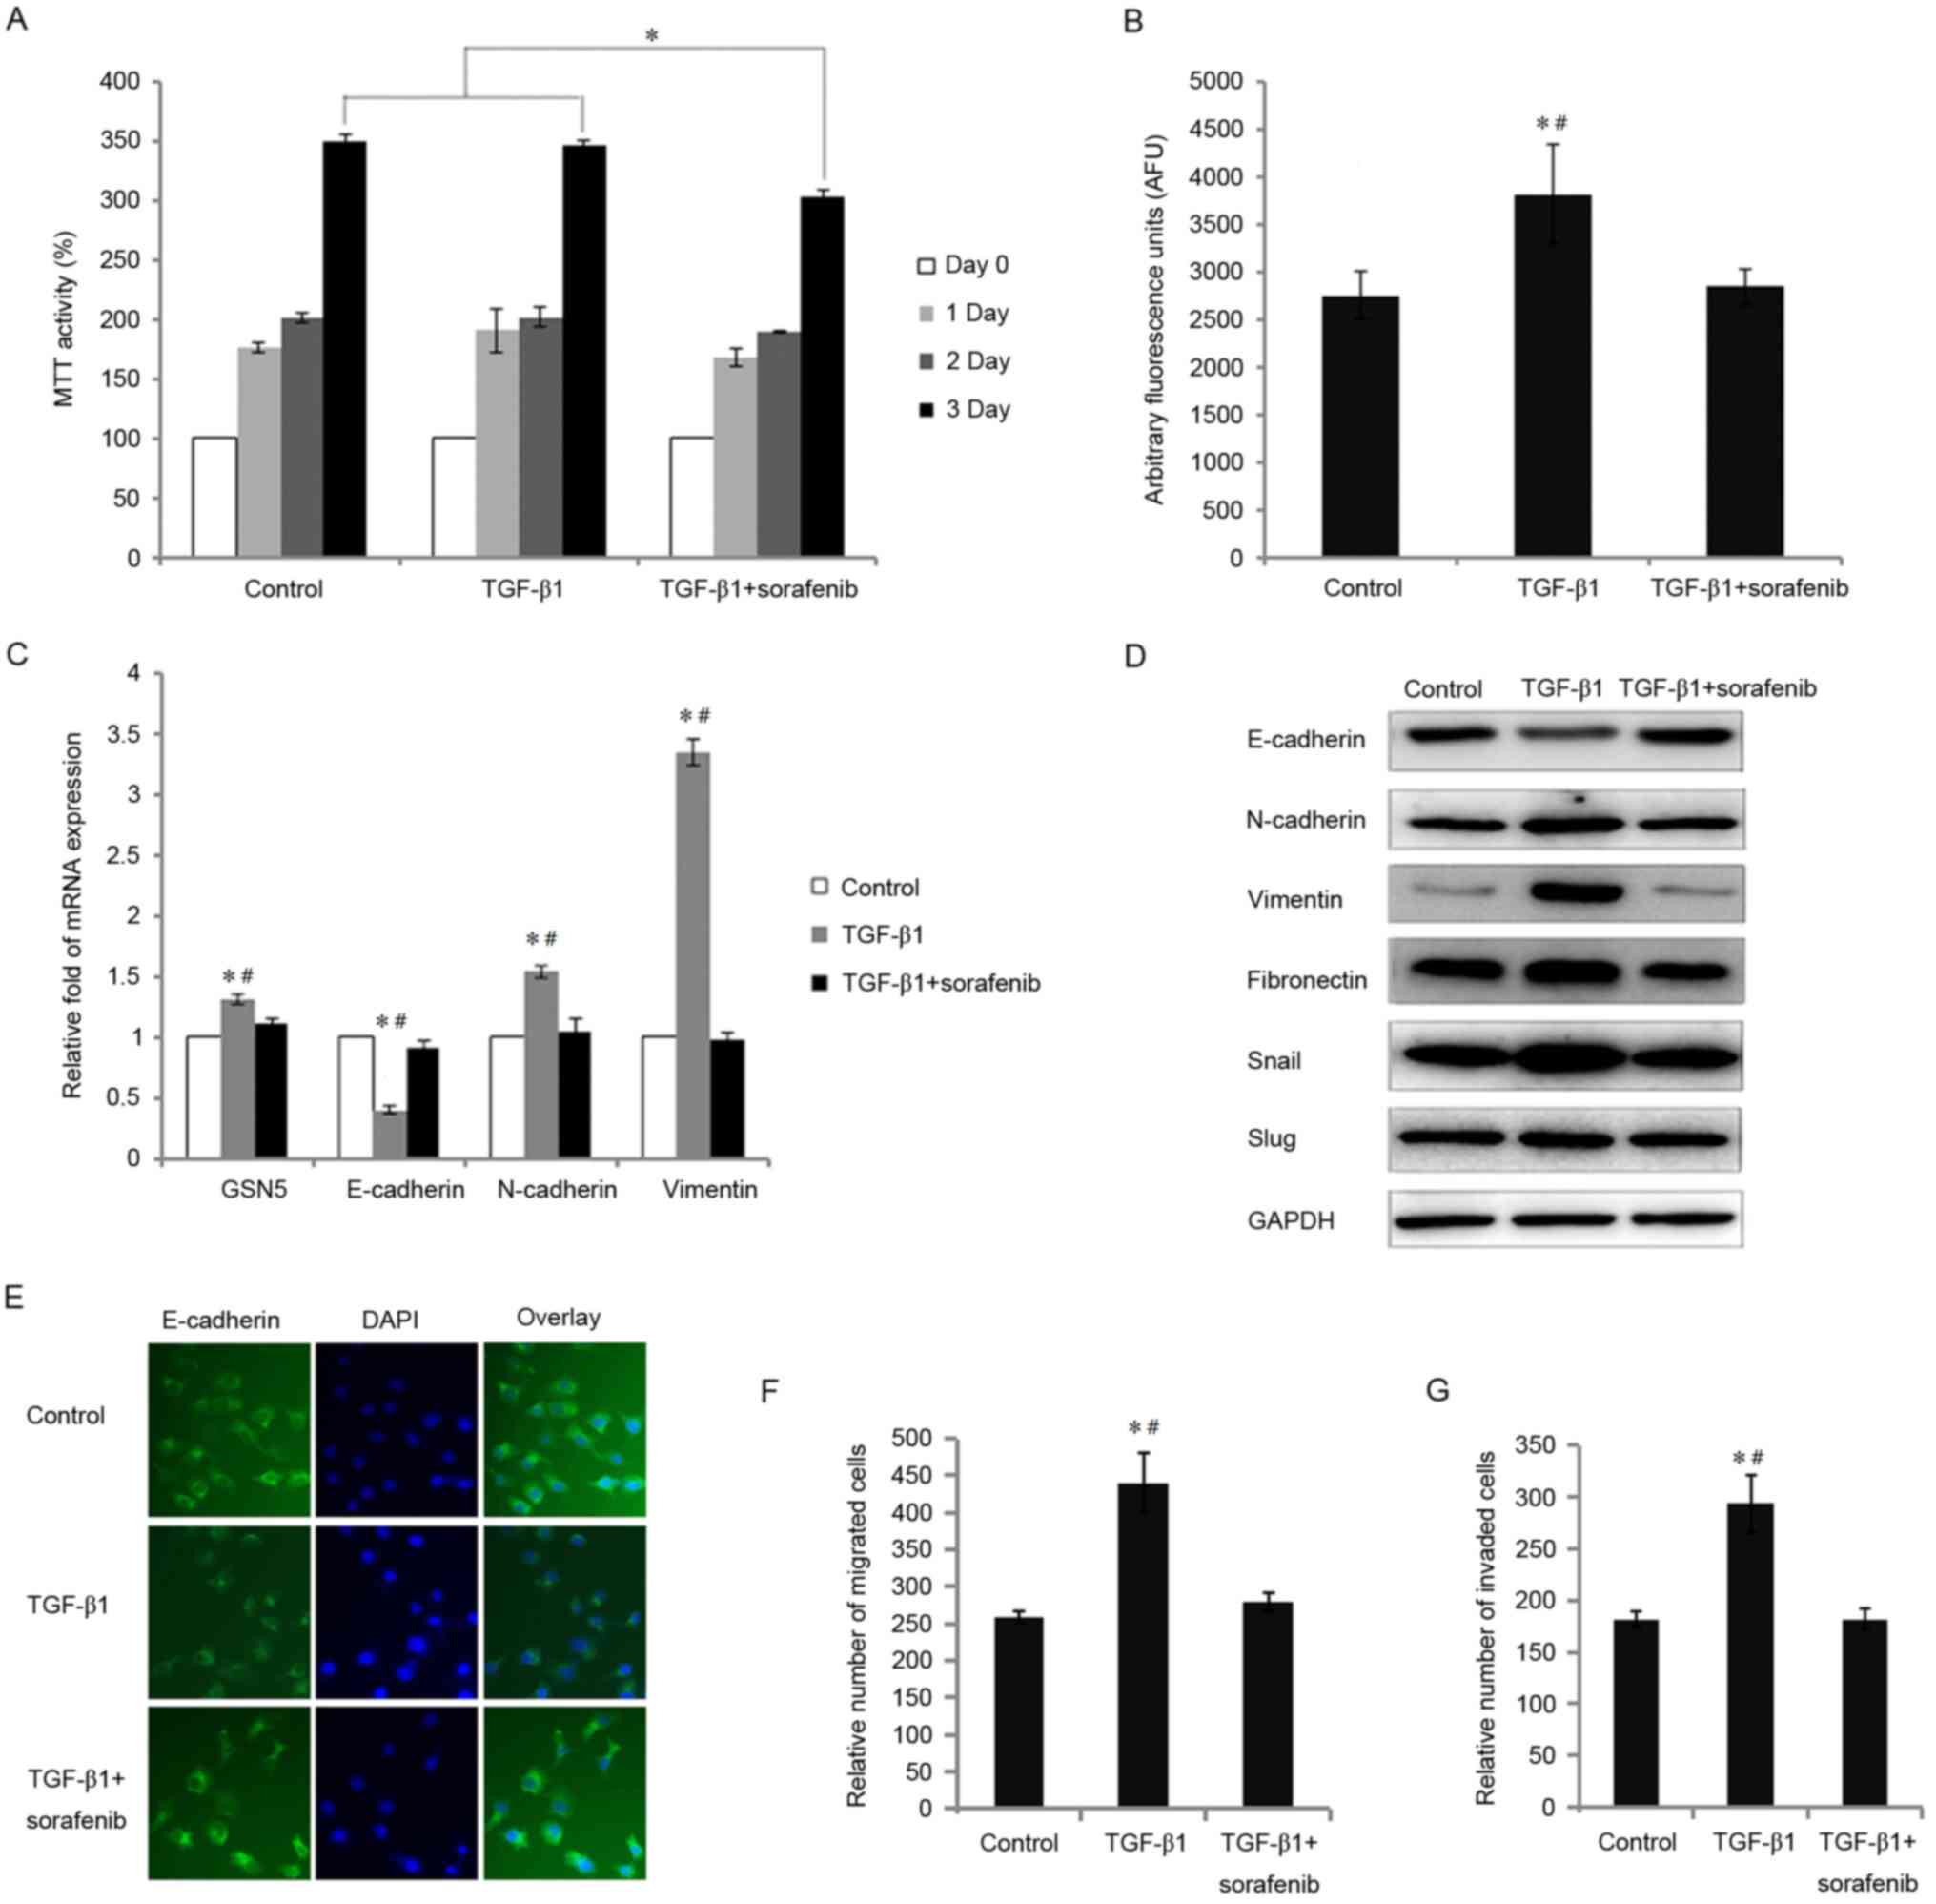 | Figure 2.Effects of treatment with sorafenib in
cells incubated with TGF-β1 on cell viability, GCN5 activity, the
expression of GSN5 and markers of the epithelial-mesenchymal
transition, and the migration and invasion of MDA-MB231 cells. (A)
MTT assay measuring cell viability following incubation with
sorafenib (5 µM) and stimulation with TGF-β1 for 0, 1, 2 and 3
days. (B) GCN5 activity in cells treated with sorafenib (5 µM) and
TGF-β1 was detected using a GCN5 chemiluminescent assay kit. (C)
Reverse transcription-quantitative polymerase chain reaction
measured levels of GSN5, E-cadherin, N-cadherin, and vimentin mRNA
in MDA-MB231 cells stimulated with TGF-β1 and treated with or
without sorafenib (5 µM) for 3 days. (D) Western blot analysis
measuring E-cadherin, N-cadherin, vimentin, fibronectin, snail and
slug expression in MDA-MB231 cells treated with sorafenib (5 µM)
and stimulated with TGF-β1 for 3 days. (E) Immunohistochemistry
results (magnification, ×40) indicating the expression of
E-cadherin in MDA-MB231 cells treated with sorafenib (5 µM) and
stimulated with TGF-β1 for 3 days. (F) The results of an in
vitro Transwell migration assay indicating the relative number
of migrated cells treated with TGF-β1 or TGF-β1+sorafenib compared
with the control group. (G) In vitro Transwell invasion
assay identifying the relative number of invaded cells treated with
TGF-β1 and TGF-β1+sorafenib treatment, compared with the control
group. Values are presented as the mean ± standard error of the
mean (n=3). *P<0.05 vs. control group and #P<0.05
vs. TGF-β1 group. TGF-β1, transforming growth factor-β1; GCN5,
histone acetyltransferase GCN5; snail, snail family transcriptional
repressor 1; slug, snail family transcriptional repressor 2. |
It was demonstrated that MDA-MB231 cells treated
with TGF-β1 exhibited significantly increased GCN5 activity
(P<0.05); however, this was significantly decreased by 25.5%
following treatment with sorafenib (P<0.05) (Fig. 2B). The expression of GSN5 mRNA was
also reversed to control levels in TGF-β1+sorafenib treated cells
(decreased by 14.8%, P<0.05; Fig.
2C). TGF-β1 stimulation significantly increased N-cadherin and
vimentin levels and decreased E-cadherin levels (all P<0.05).
However, following exposure to sorafenib under TGF-β1 induction,
E-cadherin expression recovered by 27.7%, whereas N-cadherin and
vimentin expression decreased by 31.9 and 70.7%, respectively (all
P<0.05).
Subsequently, the effect of sorafenib on the
expression of proteins associated with the TGF-β1-induced EMT in
breast cancer cells was evaluated. TGF-β1 treatment decreased the
expression of E-cadherin and increased the expression of
N-cadherin, vimentin, fibronectin, snail and slug in MDA-MB231
cells (Fig. 2D). However,
sorafenib-treated MDA-MB231 cells cultured with TGF-β1 exhibited
increased expression of E-cadherin and decreased expression of
vimentin, fibronectin, snail and slug. The same results were
identified by immunohistochemistry; E-cadherin expression was
decreased in cells treated with TGF-β1 but recovered to control
levels in TGF-β1 treated cells following treatment with sorafenib
(Fig. 2E).
It has been demonstrated that TGF-β1 induces the
invasion and migration of cancer cells (14). Therefore, to determine whether
sorafenib prevents the TGF-β1-induced migration and invasion of
breast cancer cells, cell migration and invasion assays were
performed. Compared with untreated MDA-MB231 cells, TGF-β1
significantly increased the number of migrating cells (P<0.05;
Fig. 2F). However, migration in
MDA-MB231 cells treated with sorafenib was significantly decreased
compared with cells treated with TGF-β1 alone (P<0.05). TGF-β1
also significantly increased the invasive capacity of MDA-MB231
cells (P<0.05), however, sorafenib significantly inhibited this
invasive capacity (P<0.05; Fig.
2G).
Knockdown of GCN5 by siRNA inhibits
the EMT induced by TGF-β1 in breast cancer cells
To further determine the biological functions of
GCN5 in the TGF-β1-induced EMT in breast cancer, GCN5 siRNA was
used to knockdown GCN5 expression in MDA-MB231 cells. Cell
viability was significantly decreased following GCN5 knockdown
following stimulation with TGF-β1 compared with the control
(P<0.05; Fig. 3A). By contrast,
the viability of cells treated with TGF-β1 and transfected with
control siRNA was similar to that of the control group. The
increases in GCN5 activity and GCN5 mRNA expression following
stimulation with TGF-β1 were significantly decreased to levels
similar to the control group following transfection with GCN5-siRNA
(all P<0.05 vs. transfection with control siRNA; Fig. 3B and C). Knockdown of GCN5 also
normalized the expression of EMT markers; following stimulation
with TGF-β1, E-cadherin mRNA levels were significantly increased
whereas N-cadherin and vimentin mRNA levels were significantly
decreased compared with cells transfected with control siRNA
(P<0.05; Fig. 3C).
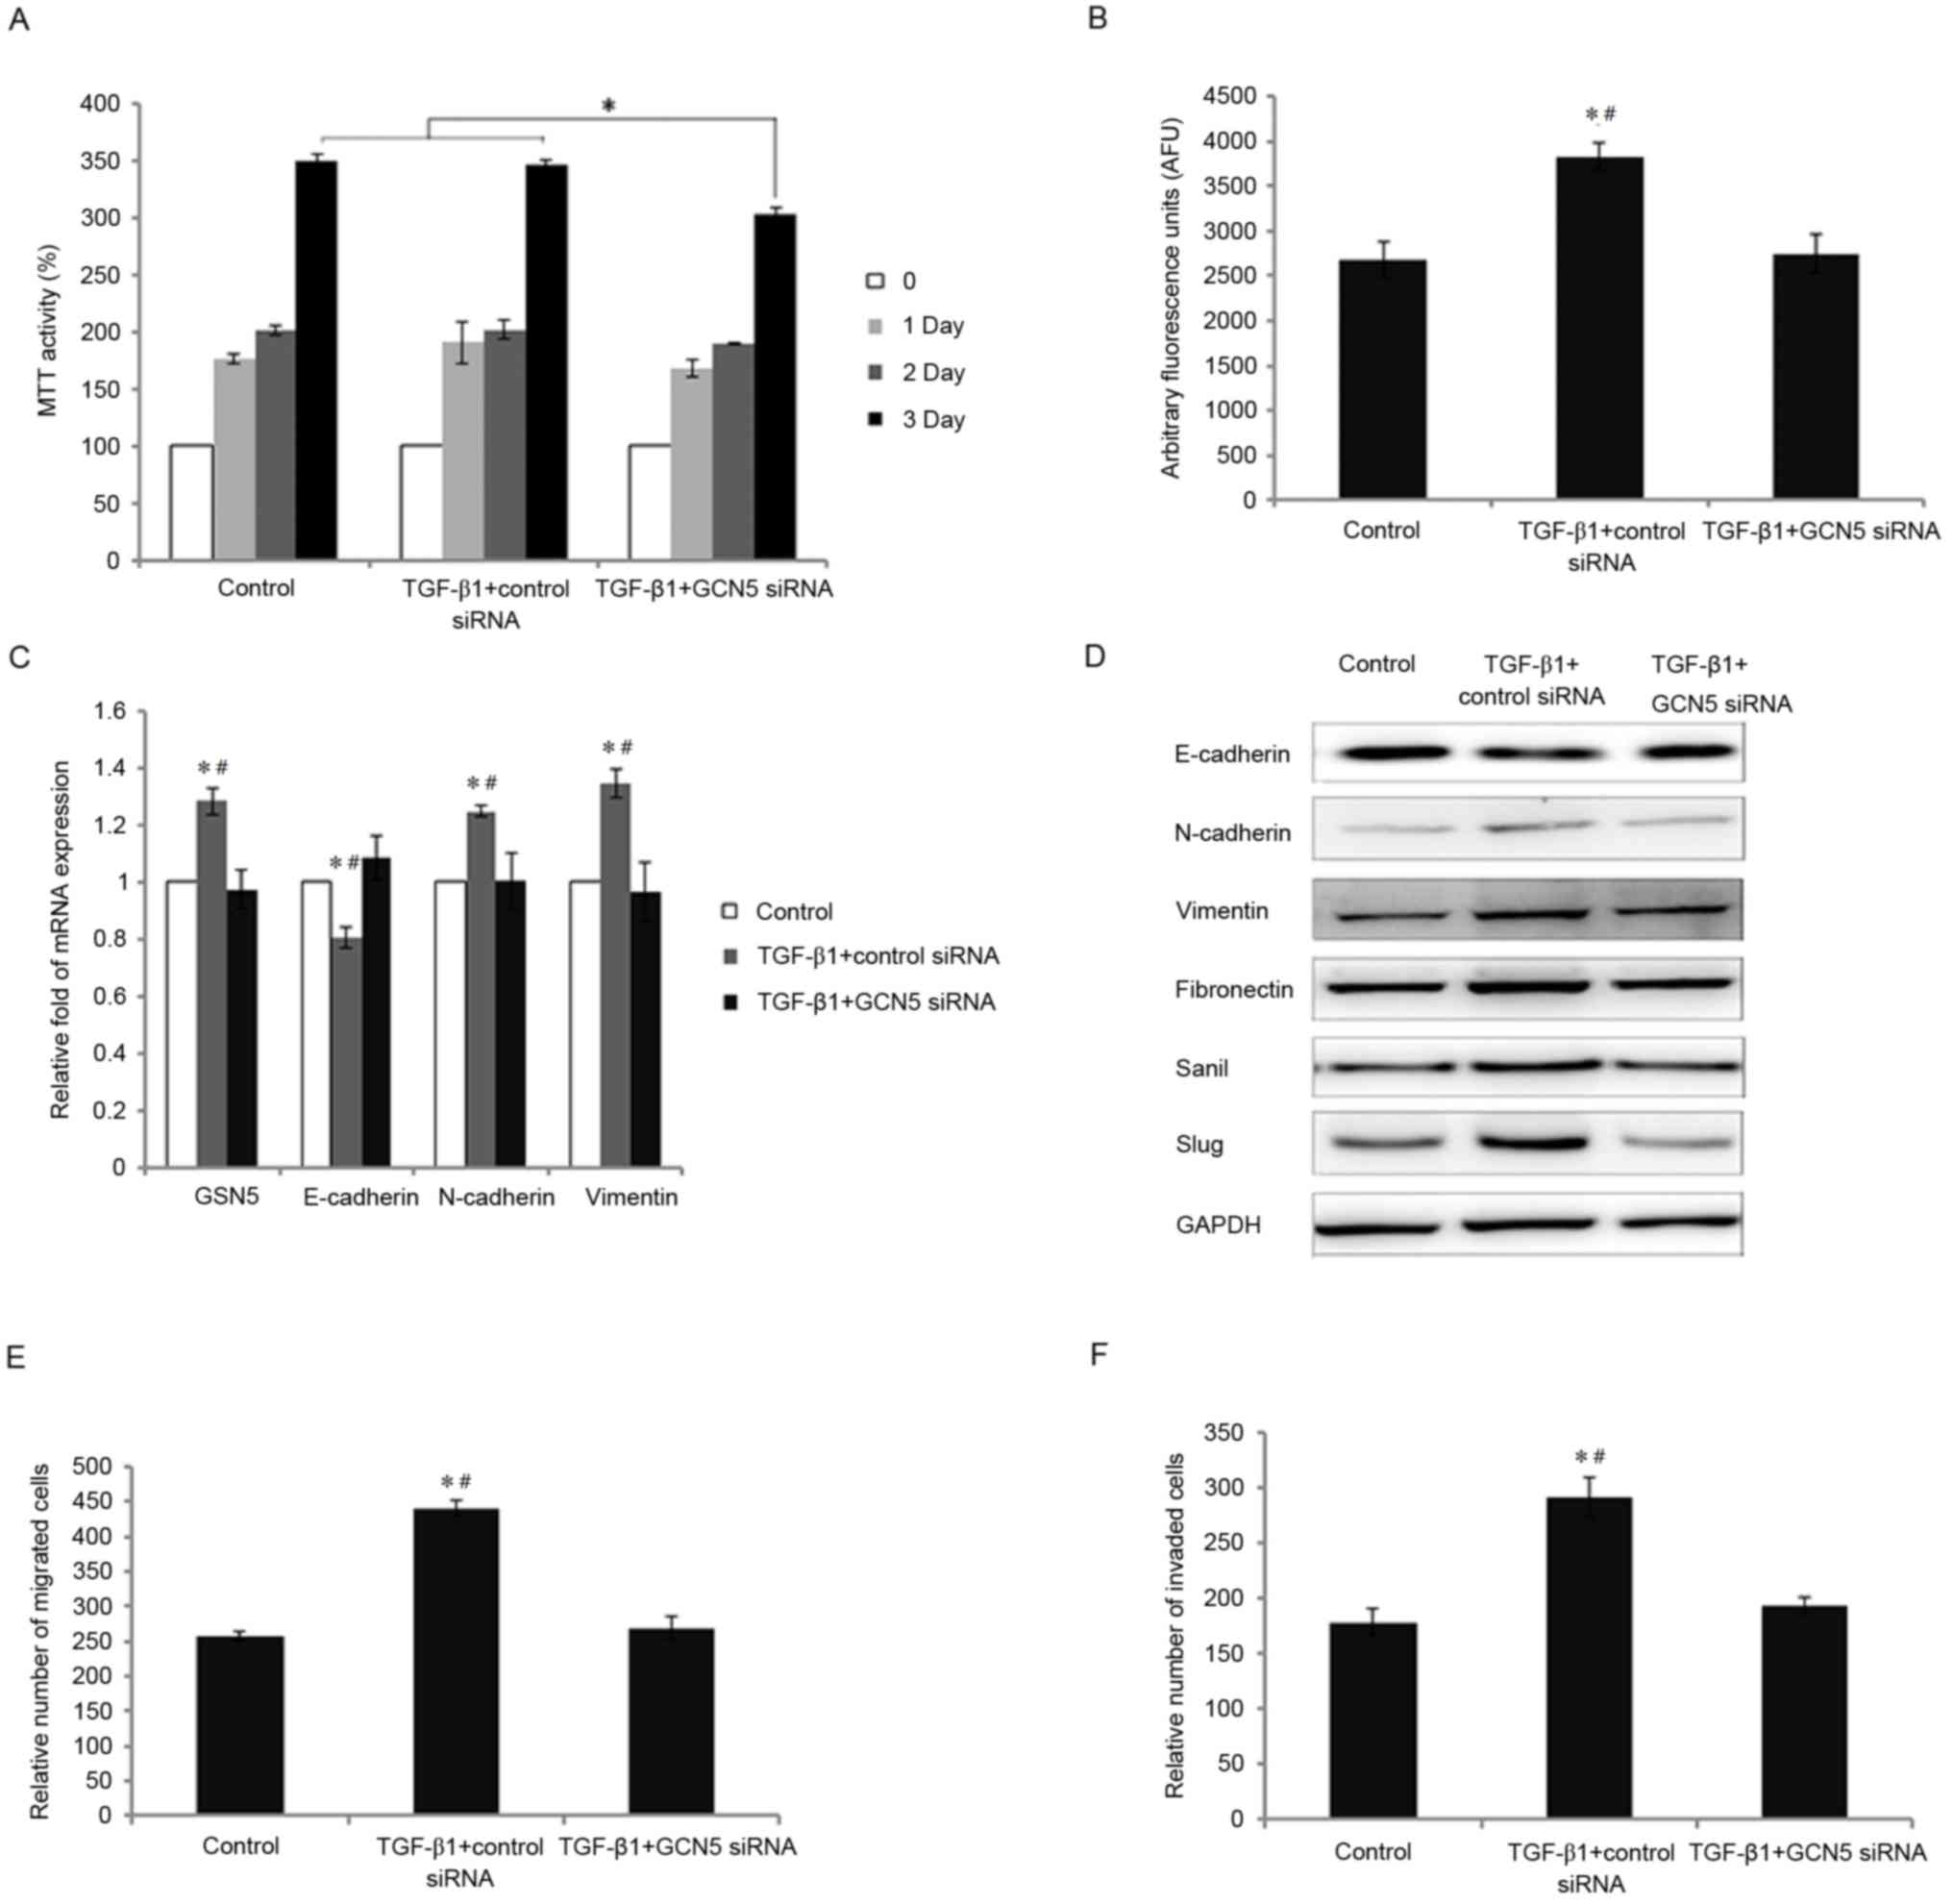 | Figure 3.Effects of GCN5 knockdown following
TGF-β1 treatment on cell viability, GCN5 activity, the expression
of GSN5 and markers of the epithelial-mesenchymal transition, and
the migration and invasion of MDA-MB231 cells. (A) MTT assay
measuring cell viability following transfection with GCN5 siRNA (40
nM) or control siRNA in cells treated with TGF-β1 for 0, 1, 2 and 3
days. (B) GCN5 activity following transfection with GCN5 siRNA (40
nM) or control siRNA in cells stimulated with TGF-β1 was detected
using a GCN5 chemiluminescent assay kit. (C) Reverse
transcription-quantitative polymerase chain reaction measured the
expression of GSN5, E-cadherin, N-cadherin and vimentin mRNA in
MDA-MB231 cells transfected with GCN5 siRNA or control siRNA
following stimulation with TGF-β1. (D) Western blot analysis of
E-cadherin, N-cadherin, vimentin, fibronectin, snail and slug
expression in MDA-MB231 cells transfected with GCN5 siRNA or
control siRNA following stimulation with TGF-β1. (E) An in
vitro Transwell migration assay identified the relative number
of migrated cells in cells transfected with TGF-β1+control siRNA or
TGF-β1+GCN5 siRNA, compared with the control group. (F) An in
vitro Transwell invasion assay identifying the relative number
of invading cells in cells transfected with TGF-β1+control siRNA or
TGF-β1+GCN5 siRNA, compared with the control group. All values are
presented as the mean ± standard error of the mean (n=3).
*P<0.05 vs. control group and #P<0.05 vs. TGF-β1
group. TGF-β1, transforming growth factor-β1; GCN5, histone
acetyltransferase GCN5; snail, snail family transcriptional
repressor 1; slug, snail family transcriptional repressor 2; siRNA,
small interfering RNA. |
Furthermore, the effect of GCN5 knockdown on the
TGF-β1-induced EMT in breast cancer cells was assessed. GCN5
knockdown reversed the decrease in E-cadherin expression induced by
TGF-β1 and reversed the increase in N-cadherin, vimentin,
fibronectin, snail and slug expression induced by TGF-β1 (Fig. 3D). As expected, GCN5 knockdown
significantly reversed the effects of exogenous TGF-β1 stimulation
on the migration and invasion capabilities of MDA-MB231 cells; the
migration and invasion of MDA-MB231 cells were decreased by 39.0
and 33.8%, respectively (P<0.05 vs. TGF-β1+contol siRNA group;
Fig. 3E and F).
GCN5 rescue confirms the roles of GCN5
in the TGF-β1-induced EMT in breast cancer cells
To ensure that the induction of the EMT by TGF-β1
requires GCN5 activity, a GCN5 vector (GCN5-WT) was used to induce
the overexpression of GCN5 to counteract the knockdown of GCN5
expression by transfection with GCN5 siRNA, leading to a recovery
of GCN5 activity and increase in the expression of GCN5 mRNA
(Fig. 4A and B). Furthermore, in the
GCN5 rescue experiments, it was determined that the expression of
GCN5, E-cadherin, N-cadherin and vimentin mRNA, and the expression
of GCN5, E-cadherin, N-cadherin, vimentin, fibronectin, snail and
slug protein were also significantly altered (P<0.05), compared
with the cells treated with GCN5 siRNA. The mRNA and protein
expression were as similar in the TGF-β1+GCN5 siRNA+GCN5-WT- and
the TGF-β1-treated groups, therefore it is suggested that the
function of GCN5 siRNA was counteracted by GCN5-WT-induced GCN5
overexpression (Fig. 4B and C).
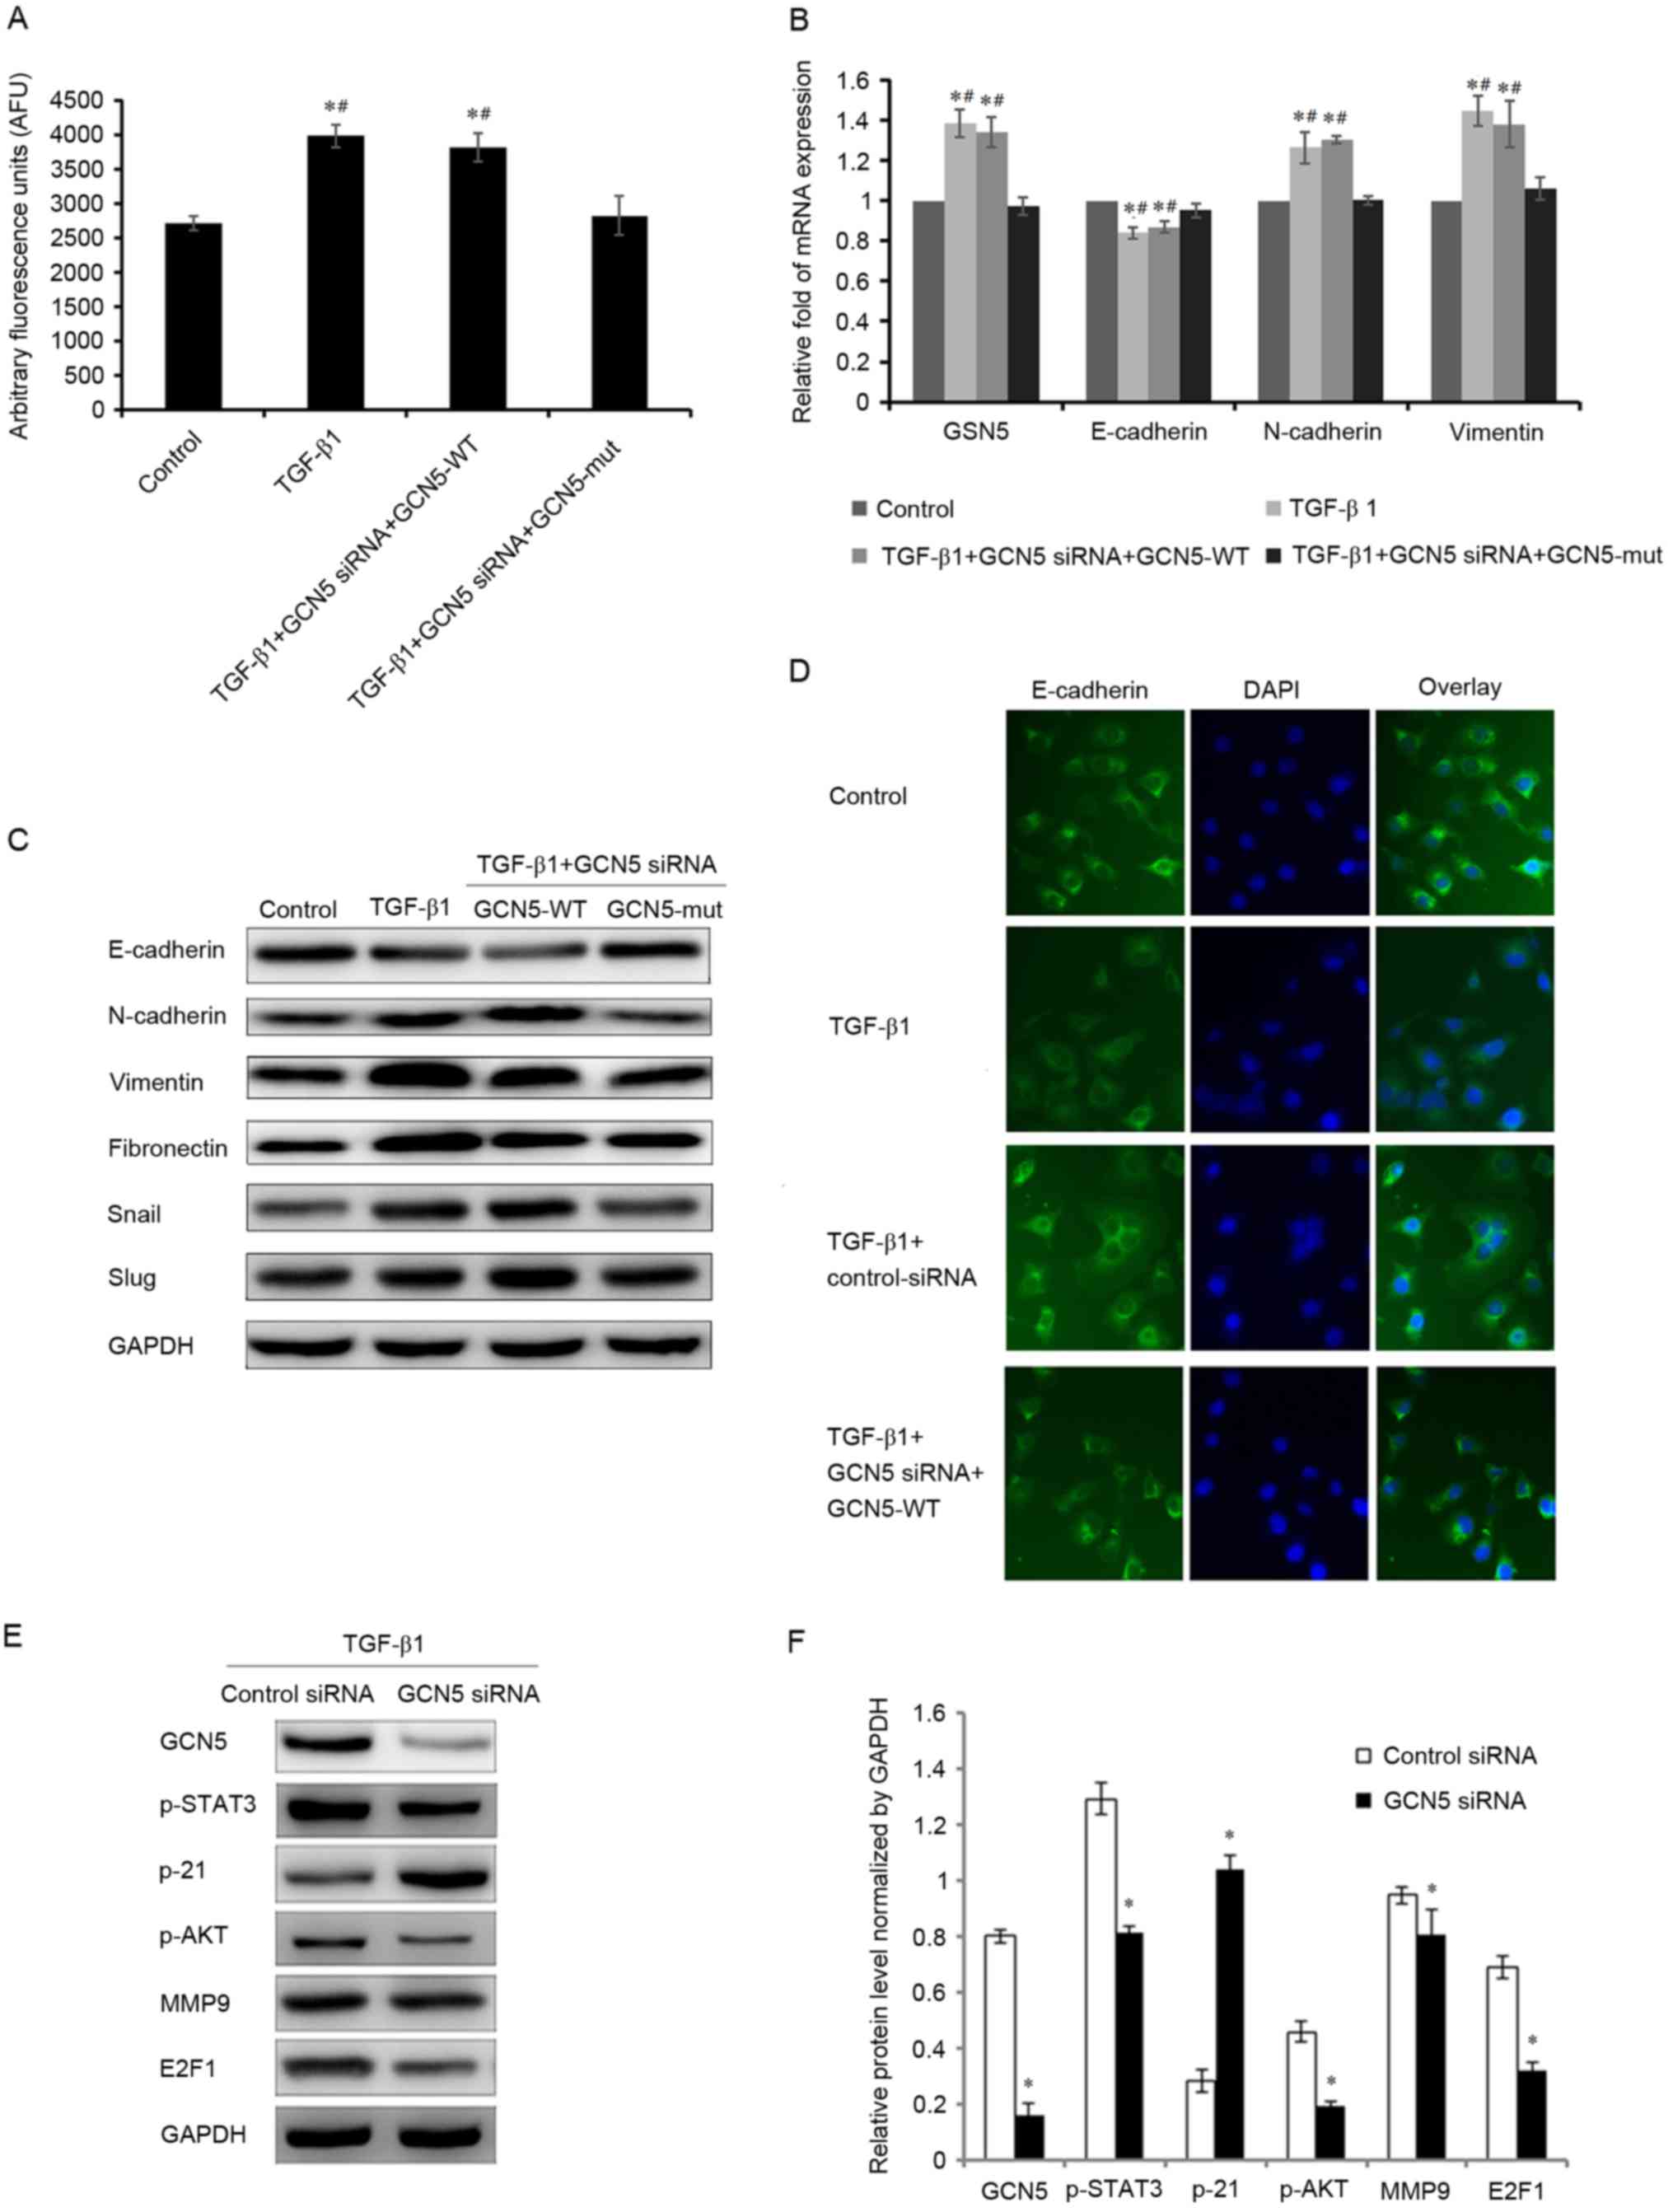 | Figure 4.Effects of GCN5 rescue in cells
stimulated with TGF-β1 on GCN5 activity and the expression of GSN5
and markers of the epithelial-mesenchymal transition. (A) GCN5
activity in cells transfected with GCN5 siRNA+GCN5-WT following
TGF-β1 stimulation was measured using a GCN5 chemiluminescent assay
kit. (B) Reverse transcription-quantitative polymerase chain
reaction analysis measured the expression of GSN5, E-cadherin,
N-cadherin, and vimentin mRNA in MDA-MB231 cells treated with GCN5
siRNA and GCN5-WT or GCN5-mut under TGF-β1 stimulation for 3 days.
(C) Western blotting measuring E-cadherin, N-cadherin, vimentin,
fibronectin, snail and slug levels in MDA-MB231 cells treated with
GCN5 siRNA and GCN5-WT or GCN5-MUT following stimulation with
TGF-β1 for 3 days. (D) Immunohistochemical staining (magnification,
×40) indicating the expression of E-cadherin in MDA-MB231 cells
treated with GCN5 siRNA and GCN5-WT or GCN5-MUT following
stimulation with TGF-β1 for 3 days. (E) Western blots with (F)
quantitative analyses of GCN5, p-STAT3, p-21, p-AKT, MMP9 and E2F1
levels in MDA-MB231 cells treated with GCN5 siRNA (40 nM) following
stimulation with TGF-β1 (5 ng/ml) for 3 days. GAPDH was used as an
internal control. *P<0.05 vs. control group and
#P<0.05 vs. TGF-B1+GCN5 siRNA+GCN5-mut group. TGF-β1,
transforming growth factor-β1; GCN5, histone acetyltransferase
GCN5; snail, snail family transcriptional repressor 1; slug, snail
family transcriptional repressor 2; MMP9, matrix metalloproteinase
9; p, phosphorylated; AKT, protein kinase B; STAT3, signal
transducer and activator of transcription 3; siRNA, small
interfering RNA; GCN5-WT, GCN5 vector; HCN5-MUT, GCN5 mutant
vector. |
Immunochemistry also demonstrated that E-cadherin
expression was decreased following treatment with TGF-β1, but its
expression increased to normal levels following GCN5 knockdown even
under treatment with TGF-β1. However, when GCN5-WT was transfected
with GCN5 siRNA, the expression of E-cadherin decreased (Fig. 4D).
GCN5 regulates the EMT by enhancing
the signal transducer and activator of transcription 3 (STAT3),
protein kinase B (AKT) and E2F1 signaling pathways
It has been reported that GCN5 can promote cell
proliferation by enhancing the expression of E2F1 in non-small cell
lung cancer (9) and that GCN5 can
regulate cell proliferation and invasion by stimulating the STAT3
and AKT signaling pathways (15). To
further explore the mechanism by which the downregulation of GCN5
inhibits TGF-β1-induced cell proliferation and invasion, the
expression of various genes that regulate cell molecular signaling
was measured. Compared with the group transfected with siRNA
control, GCN5 knockdown by GCN5 siRNA significantly decreased the
expression of phosphorylated (p)-STAT3, p-AKT, matrix
metalloproteinase 9 (MMP9) and E2F1, and significantly increased
the expression of p21 (Fig. 4E and
F). These results indicate that GCN5 promotes the
proliferation, migration and invasion of breast cancer cells, at
least in part, by enhancing the STAT3, AKT and E2F1 signaling
pathways.
Discussion
Histone acetylation serves a vital role in
establishing an active chromatin environment for transcriptional
regulation (16). Histone lysine
acetyltransferases (KATs) help to maintain the balance between
histone acetylation and deacetylation (17). GCN5 is a Smad-binding transcriptional
co-activator for TGF-β-specific R-Smads and stimulates TGF-β and
bone morphogenetic protein signaling; thus, GCN5 is considered to
be an essential component in the transcriptional regulation induced
by TGF-β/Smad in certain cells (6).
Although TGF-β may serve different roles during the different
stages of breast cancer progression, it is a strong inducer of the
EMT (18) and it has been
demonstrated that the TGF-β1 signaling pathway promotes cancer cell
proliferation, invasion and metastasis, thus stimulating the EMT in
breast cancer (5,8). GCN5 regulates breast cancer development
(7,9)
and it has been reported that following treatment with TGF-β1 for 3
days, the expression of GSN5 increases in MDA-MB231 cells,
increasing the expression of EMT markers, thus enhancing cell
migration and invasion (19). It has
been suggested that modifying GSN5 expression may affect the TGF-β1
signaling events required to induce the EMT in cancer cells,
leading to the increased migration and invasion of MDA-MB231 cells
(20).
The results of the present study demonstrate that
GCN5 promotes the induction of the EMT by TGF-β1, as well as the
migration and invasion of breast cancer MDA-MB231 cells. GCN5
activity was elevated following treatment with TGF-β1 and the
expression of GCN5 mRNA and protein were increased. TGF-β1
treatment decreased the expression of the epithelial cell marker
E-cadherin in MDA-MB231 cells and increased the expression of the
mesenchymal cell markers N-cadherin and vimentin. The expression of
other EMT markers, including snail and slug, were also increased
following TGF-β1 treatment. However, following the inhibition of
GCN5 activity, the expression of these EMT transition markers were
reversed to levels observed in cells that did not undergo TGF-β1
treatment. In MDA-MB231 cells, knockdown of GCN5 expression with
specific siRNA demonstrated that GCN5 downregulation effectively
suppressed cell growth, cell migration and cell invasion.
Furthermore, in a rescue experiment that utilized a GCN5-expressing
vector to overexpress GCN5 and neutralize the knockdown effects of
GCN5 siRNA, levels of EMT markers were increased to levels similar
to the TGF-β1 induced group. These results indicate that GCN5 may
be able to reverse the effects of TGF-β1 stimulation that serve
crucial roles during EMT, providing a possible epigenetic mechanism
for its clinical benefits in breast cancer metastasis.
To the best of our knowledge, the function of GCN5
in TGF-β signaling was previously unknown. It has previously been
demonstrated in glioma cells that STAT3 and AKT may be involved in
the GCN5-regulated migration and survival (15). Furthermore, it has been demonstrated
that STAT3 may help regulate cell proliferation, oncogenesis and
angiogenesis in tumors (21) and the
AKT pathway may regulate various cellular functions, including
migration and survival in cancer cells (22). Therefore, the present study examined
whether downregulation of GCN5 expression following TGF-β1
stimulation regulates the STAT3 and AKT signaling pathways. It was
demonstrated that GCN5 knockdown is able to significantly repress
the TGF-β1-induced elevation of p-STAT3 and p-AKT expression. This
indicates that GCN5 can promote the TGF-β1-induced EMT transition,
at least partly via the STAT3 and AKT signaling pathways (16). GCN5 and E2F1 may have synergistic
effect (23), and the results of the
current study also demonstrated that E2F1 is the downstream
targeted protein of the STAT3 and AKT pathways; there is an
interaction between GCN5 and E2F1 following GCN5 knockdown.
Furthermore, GCN5 potentiates lung cancer cell growth in
conjunction with the transcription factor E2F1 to regulate the cell
cycle (9) and it has been reported
that the expression of GCN5 promotes cell growth and the G1/S-phase
transition in multiple lung cancer cell lines. The results of the
current study indicated that GCN5 knockdown inhibits cell growth,
decreases the expression of E2F1, but increases the expression of
the cell cycle inhibitor p21 in MDA-MB231 cells, suggesting that
GCN5 also serves an important role in the E2F1 pathway.
Furthermore, it has been determined in glioma tissues that GCN5
expression is correlated with MMP9 (15), which has been implicated in cancer
progression, invasion and metastasis. The results of the present
study demonstrated that GCN5 knockdown significantly represses MMP9
levels and suggested that GCN5 may enhance the TGFβ1-induced EMT
process by increasing MMP9 levels.
In conclusion, the results of the current study
suggest that GCN5 may be involved in regulating the induction of
the EMT by TGF-β1 via mediation of the STAT3, AKT and E2F1
signaling pathways. These results indicate that GCN5 may be an
important inducer of EMT transition and may therefore be a
potential target of novel therapeutic strategies to treat breast
cancer.
References
|
1
|
Siegel R, Ma J, Zou Z and Jemal A: Cancer
statistics, 2014. CA Cancer J Clin. 64:9–29. 2014. View Article : Google Scholar : PubMed/NCBI
|
|
2
|
Naume B, Synnestvedt M, Falk RS, Wiedswang
G, Weyde K, Risberg T, Kersten C, Mjaaland I, Vindi L, Sommer HH,
et al: Clinical outcome with correlation to disseminated tumor cell
(DTC) status after DTC-guided secondary adjuvant treatment with
docetaxel in early breast cancer. J Clin Oncol. 32:3848–3857. 2014.
View Article : Google Scholar : PubMed/NCBI
|
|
3
|
Siegel R, Naishadham D and Jemal A: Cancer
statistics, 2012. CA Cancer J Clin. 62:10–29. 2012. View Article : Google Scholar : PubMed/NCBI
|
|
4
|
Thiery JP, Acloque H, Huang RY and Nieto
MA: Epithelial-mesenchymal transitions in development and disease.
Cell. 139:871–890. 2009. View Article : Google Scholar : PubMed/NCBI
|
|
5
|
Tian M, Neil JR and Schiemann WP:
Transforming growth factor-β and the hallmarks of cancer. Cell
Signal. 23:951–962. 2011. View Article : Google Scholar : PubMed/NCBI
|
|
6
|
Kahata K, Hayashi M, Asaka M, Hellman U,
Kitagawa H, Yanagisawa J, Kato S, Imamura T and Miyazono K:
Regulation of transforming growth factor-beta and bone
morphogenetic protein signalling by transcriptional coactivator
GCN5. Genes Cells. 9:143–151. 2004. View Article : Google Scholar : PubMed/NCBI
|
|
7
|
Jin Q, Yu LR, Wang L, Zhang Z, Kasper LH,
Lee JE, Wang C, Brindle PK, Dent SY and Ge K: Distinct roles of
GCN5/PCAF-mediated H3K9ac and CBP/p300-mediated H3K18/27ac in
nuclear receptor transactivation. EMBO J. 30:249–262. 2011.
View Article : Google Scholar : PubMed/NCBI
|
|
8
|
Li S and Shogren-Knaak MA: The Gcn5
bromodomain of the SAGA complex facilitates cooperative and
cross-tail acetylation of nucleosomes. J Biol Chem. 284:9411–9417.
2009. View Article : Google Scholar : PubMed/NCBI
|
|
9
|
Chen L, Wei T, Si X, Wang Q, Li Y, Leng Y,
Deng A, Chen J, Wang G, Zhu S and Kang J: Lysine acetyltransferase
GCN5 potentiates the growth of non-small cell lung cancer via
promotion of E2F1, cyclin D1, and cyclin E1 expression. J Biol
Chem. 288:14510–14521. 2013. View Article : Google Scholar : PubMed/NCBI
|
|
10
|
Germaniuk-Kurowska A, Nag A, Zhao X, Dimri
M, Band H and Band V: Ada3 requirement for HAT recruitment to
estrogen receptors and estrogen-dependent breast cancer cell
proliferation. Cancer Res. 67:11789–11797. 2007. View Article : Google Scholar : PubMed/NCBI
|
|
11
|
Zhang J, Chen YL, Ji G, Fang W, Gao Z, Liu
Y, Wang J, Ding X and Gao F: Sorafenib inhibits
epithelial-mesenchymal transition through an epigenetic-based
mechanism in human lung epithelial cells. PLoS One. 8:e649542013.
View Article : Google Scholar : PubMed/NCBI
|
|
12
|
Livak KJ and Schmittgen TD: Analysis of
relative gene expression data using real-time quantitative PCR and
the 2(-Delta Delta C(T)) method. Methods. 25:402–408. 2001.
View Article : Google Scholar : PubMed/NCBI
|
|
13
|
Lo WS, Trievel RC, Rojas JR, Duggan L, Hsu
JY, Allis CD, Marmorstein R and Berger SL: Phosphorylation of
serine 10 in histone H3 is functionally linked in vitro and in vivo
to Gcn5-mediated acetylation at lysine 14. Mol Cell. 5:917–926.
2000. View Article : Google Scholar : PubMed/NCBI
|
|
14
|
Ko H, Jeon H, Lee D, Choi HK, Kang KS and
Choi KC: Sanguiin H6 suppresses TGF-β induction of the
epithelial-mesenchymal transition and inhibits migration and
invasion in A549 lung cancer. Bioorg Med Chem Lett. 25:5508–5513.
2015. View Article : Google Scholar : PubMed/NCBI
|
|
15
|
Chen YL, Lv J, Ye XL, Sun MY, Xu Q, Liu
CH, Min LH, Li HP, Liu P and Ding X: Sorafenib inhibits
transforming growth factor β1-mediated epithelial-mesenchymal
transition and apoptosis in mouse hepatocytes. Hepatology.
53:1708–1718. 2011. View Article : Google Scholar : PubMed/NCBI
|
|
16
|
Liu K, Zhang Q, Lan H, Wang L, Mou P, Shao
W, Liu D, Yang W, Lin Z, Lin Q and Ji T: GCN5 potentiates glioma
proliferation and invasion via STAT3 and AKT signaling pathways.
Int J Mol Sci. 16:21897–21910. 2015. View Article : Google Scholar : PubMed/NCBI
|
|
17
|
Choudhary C, Kumar C, Gnad F, Nielsen ML,
Rehman M, Walther TC, Olsen JV and Mann M: Lysine acetylation
targets protein complexes and co-regulates major cellular
functions. Science. 325:834–840. 2009. View Article : Google Scholar : PubMed/NCBI
|
|
18
|
Peserico A and Simone C: Physical and
functional HAT/HDAC interplay regulates protein acetylation
balance. J Biomed Biotechnol. 2011:3718322011. View Article : Google Scholar : PubMed/NCBI
|
|
19
|
Schmierer B and Hill CS: TGFbeta-SMAD
signal transduction: Molecular specificity and functional
flexibility. Nat Rev Mol Cell Biol. 8:970–982. 2007. View Article : Google Scholar : PubMed/NCBI
|
|
20
|
Chen ZY, Wang PW, Shieh DB, Chiu KY and
Liou YM: Involvement of gelsolin in TGF-beta 1 induced epithelial
to mesenchymal transition in breast cancer cells. J Biomed Sci.
22:902015. View Article : Google Scholar : PubMed/NCBI
|
|
21
|
Niu G, Wright KL, Huang M, Song L, Haura
E, Turkson J, Zhang S, Wang T, Sinibaldi D, Coppola D, et al:
Constitutive Stat3 activity up-regulates VEGF expression and tumor
angiogenesis. Oncogene. 21:2000–2008. 2002. View Article : Google Scholar : PubMed/NCBI
|
|
22
|
Xie Y, Naizabekov S, Chen Z and Tokay T:
Power of PTEN/AKT: Molecular switch between tumor suppressors and
oncogenes. Oncol Lett. 12:375–378. 2016. View Article : Google Scholar : PubMed/NCBI
|
|
23
|
Guo R, Chen J, Mitchell DL and Johnson DG:
GCN5 and E2F1 stimulate nucleotide excision repair by promoting
H3K9 acetylation at sites of damage. Nucleic Acids Res.
39:1390–1397. 2011. View Article : Google Scholar : PubMed/NCBI
|


