Introduction
Despite advances in understanding the underlying
molecular mechanism of colorectal cancer (CRC), CRC remains a
leading cause of cancer-associated mortality worldwide (1). Patient survival has been reported to be
excessively dependent on clinical stage at the time of diagnosis,
and reduced sensitivity to chemotherapy remains a major challenge
in the effective management of CRC (2). Therefore, the identification of novel
molecules promoting CRC progression is required for the
identification of promising prognostic biomarkers and potential
therapeutic targets (3).
CRC is a complex bioprocess following the
adenoma-carcinoma multistage sequence. Therefore, understanding the
molecular dysregulations during the process of carcinogenesis,
particularly during the precancerous stage, may assist in
identifying potential prognostic biomarkers and candidate
therapeutic targets. Differentially expressed genes (DEGs)
consistently and continuously altered throughout the whole
carcinogenic process may reduce potential noise created by
large-scale heterogeneity in tumors.
Network-based analyses have been demonstrated to be
substantially effective in identifying causal cancer driver genes
(4,5).
Based on publicly accessible biological networks, a random walk
with restart (RWR) algorithm was used in the present study to
identify potential genes affected significantly by source genes.
RWR is a network-based mathematical model simulating a random
walker starting from seed nodes and advancing towards randomly
selected neighbors at each step (6).
Subsequently, once the network dynamics are stable, the probability
of walking to each node in the network is also inclined to be
stable. Therefore, novel candidate molecules receiving significant
information flow were regarded to be significantly affected by
source genes.
In the last decade, the rapid development of high
throughput technologies has greatly promoted modern studies of
molecular oncology (7). However,
expression-profiling datasets are short of systematic consistency
between different studies, probably due to different working
platforms and lab protocols (8,9). In order
to evaluate the robustness of identified prognostic genes, four
microarray datasets in the Gene Expression Omnibus (GEO) database
and one dataset from The Cancer Genome Atlas (TCGA) database
(https://tcga-data.nci.nih.gov/tcga/)
were used as independent testing cohorts in the present study,
increasing the accuracy and robustness of the analysis.
Materials and methods
Download of transcriptomic profile of
colorectal carcinogenesis
The processed expression profile of 117 colorectal
carcinogenesis samples and 52 samples with survival information was
downloaded from GEO database with the accession number GSE71187
(microarray platform ID, GPL6480) (10). Adenocarcinoma is pathologically
defined as submucosal invasion by tumors (11). The global expression profiles
contained the expression values of 18,986 genes. All associated
data were directly downloaded from the original publication
(10). Furthermore, TCGA RNA
sequencing data, GSE14333 (12),
GSE17536 (13), GSE39582 (14) and GSE28722 (15) were also downloaded from their original
publications in order to test the validity of the identified gene
signature.
Identifying consistent DEGs at
precancerous and cancer stages
An unpaired significance analysis of microarrays
(SAM) algorithm (16) was used to
identify the DEGs during the following two transitions, i.e.,
between precancerous progression of colorectal adenoma (n=58) and
normal mucosal tissues (n=12), and between CRC (n=47) and
precancerous progression [false discovery rate (FDR)<0.005].
Genes that were simultaneously and continuously upregulated or
downregulated at the aforementioned transitions were regarded as
consistent DEGs and used for further analysis.
Establishing a merged a priori
knowledge-based biological network
The gene-gene interaction information was obtained
from combining the a priori knowledge from the Human Protein
Reference Database (HPRD; http://www.hprd.org/) and Kyoto Encyclopedia of Genes
and Genomes (KEGG; http://www.kegg.jp/). The gene regulatory network was
subsequently established by merging HPRD and KEGG gene-gene
interactions, including 10,340 nodes and 60,642 edges. All
consistently dysregulated DEGs were projected onto this merged
network and the largest connected component comprised of consistent
DEGs and corresponding one-step neighbors was retrieved for further
analysis.
RWR to identify genes significantly
affected by carcinogenetic dysregulation
Consistent DEG i was weighted with zi as
follows:
Zi=Φ-1(1-Pi)
In this formula, pi represented
the P-value of Cox regression analysis between the expression value
of DEG i and the patients' overall survival (OS) rate;
Φ−1 represented the inverse standard normal cumulative
distribution function (17,18). Therefore, zi
increased monotonically along with OS association of DEG i,
following a standard normal distribution. Gene-gene interactions
were further weighted with corresponding co-expression values. For
example, for a particular gene x with the expression values
(x1,……, xn) and another gene
y with the values (y1,……,
yn), the formula for the interaction weight
Er was as follows:
Er=|∑i=1n(xi-x¯)(yi-y¯)∑i=1n(xi-x¯)2*∑i=1n(yi-y¯)2|
In RWR analysis, genes of interest were regarded as
the information source, such as the source nodes, while the
remaining genes were regarded as the target, such as the target
nodes. Subsequently, the information flow was iteratively and
randomly ‘walked’ from source nodes to their neighboring targets
with a probability constantly proportional to their connectivity.
Following considerable steps, the final steady-state probability
calculated for each gene denoted the integrated influence imposed
by source nodes, as well as network topology. The RWR algorithm was
defined as follows:
pt+1=(1-r)Wpt+rp0
In this formula, W is the column-normalized
adjacency matrix of the target network and pt is
the probability vector the genes hold at step t in the
iterative process. Source nodes were initially weighted with the
probability vector p°, with the sum of all elements being 1,
and r denoted the restart probability (r=0.7 in the
present study). All genes in the aforementioned network were ranked
according to the values in the steady-state probability vector
p∞. The iteration did not cease until the
difference between pt and pt+1
was <1×10⁻¹⁰, which was measured by the least
absolute deviations norm. To increase the robustness of RWR
analysis, 10,000 permutations of nodes were conducted to simulate
the null distribution. Therefore, the P-value was designated as the
ratio of random values greater than or equal to the observed final
probability and then corrected using the FDR method. Genes with FDR
of <0.001 were defined as the genes significantly affected by
carcinogenic dysregulation.
Statistical analysis
Kaplan-Meier survival analysis was used to determine
the OS difference between the two eigengene of the module
(EM)-assigned groups. The first principal component (PC1) captured
the greatest amount of total variance in the profiles and was
calculated for each patient. Patients were then divided into two
groups of equal size based on the rank order of PC1 across their
tumor profiles. Kaplan-Meier survival analysis and the log-rank
test were used to evaluate the prognostic difference between the
two groups (10,19). Cox regression model was conducted to
evaluate the independence of prognostic factors. Samples along with
their detailed information, including age, sex, stage and survival
time, were used and P<0.05 was considered to indicate a
statistically significant difference. All data analyses were
conducted using R programming (version 3.3.1; http://www.r-project.org/), Bioconducter packages
(version 3.5; http://www.bioconductor.org/) and Matlab (version
2015b; http://www.mathworks.com/products/matlab.html)
language. The network visualization and analysis were achieved
through Cytoscape (version 3.4.0; http://www.cytoscape.org/). DEG identification was
conducted with R package ‘samr’ (version 2.0; http://cran.r-project.org/web/packages/samr/index.html),
and meta-analysis was performed with R package ‘meta’ (version
4.8–2; http://cran.r-project.org/web/packages/meta/).
Results
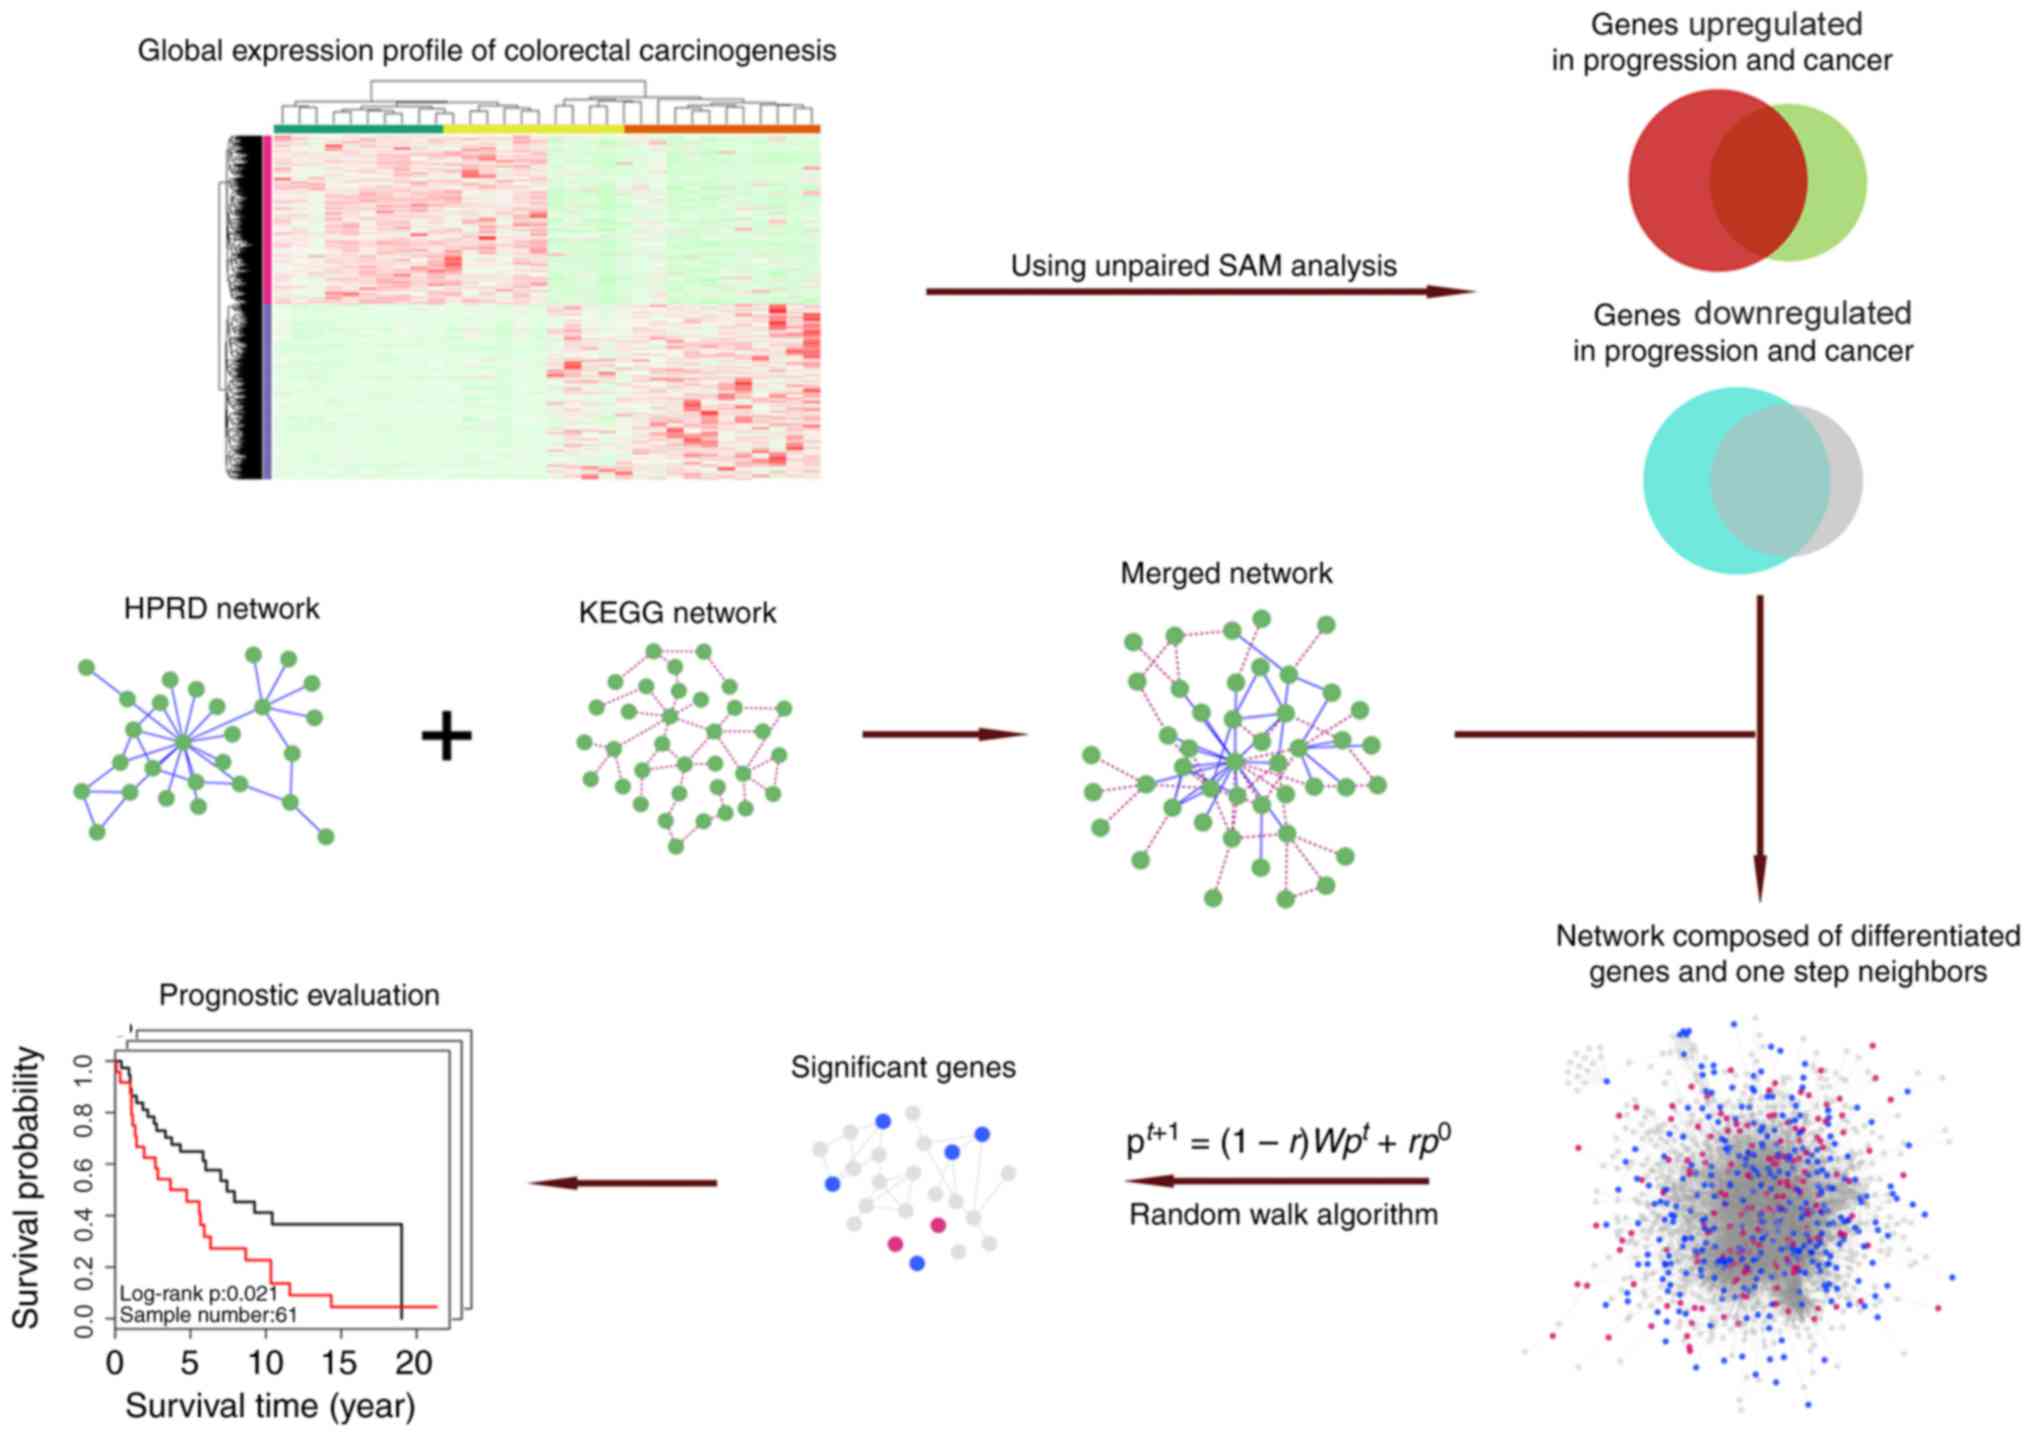
Schematic of methodology
The schematic adopted for the present study is
depicted in Fig. 1.
Consistently dysregulated DEGs in
precancerous and cancer stages identified to reduce noise
The global expression profiles of human healthy
colorectal mucosa, CRC precancerous (adenoma) and cancer
(adenocarcinoma) samples from the GEO database (GSE71187) were
downloaded. Using unpaired SAM analysis, 6,726 genes were
upregulated and 4,825 genes were downregulated in precancerous
samples compared with those in healthy tissues. A total of 2,404
genes were upregulated and 2,726 genes were downregulated in cancer
samples compared with those in precancerous samples. Furthermore,
DEGs that were simultaneously and continuously upregulated or
downregulated during carcinogenic transitions were referred to as
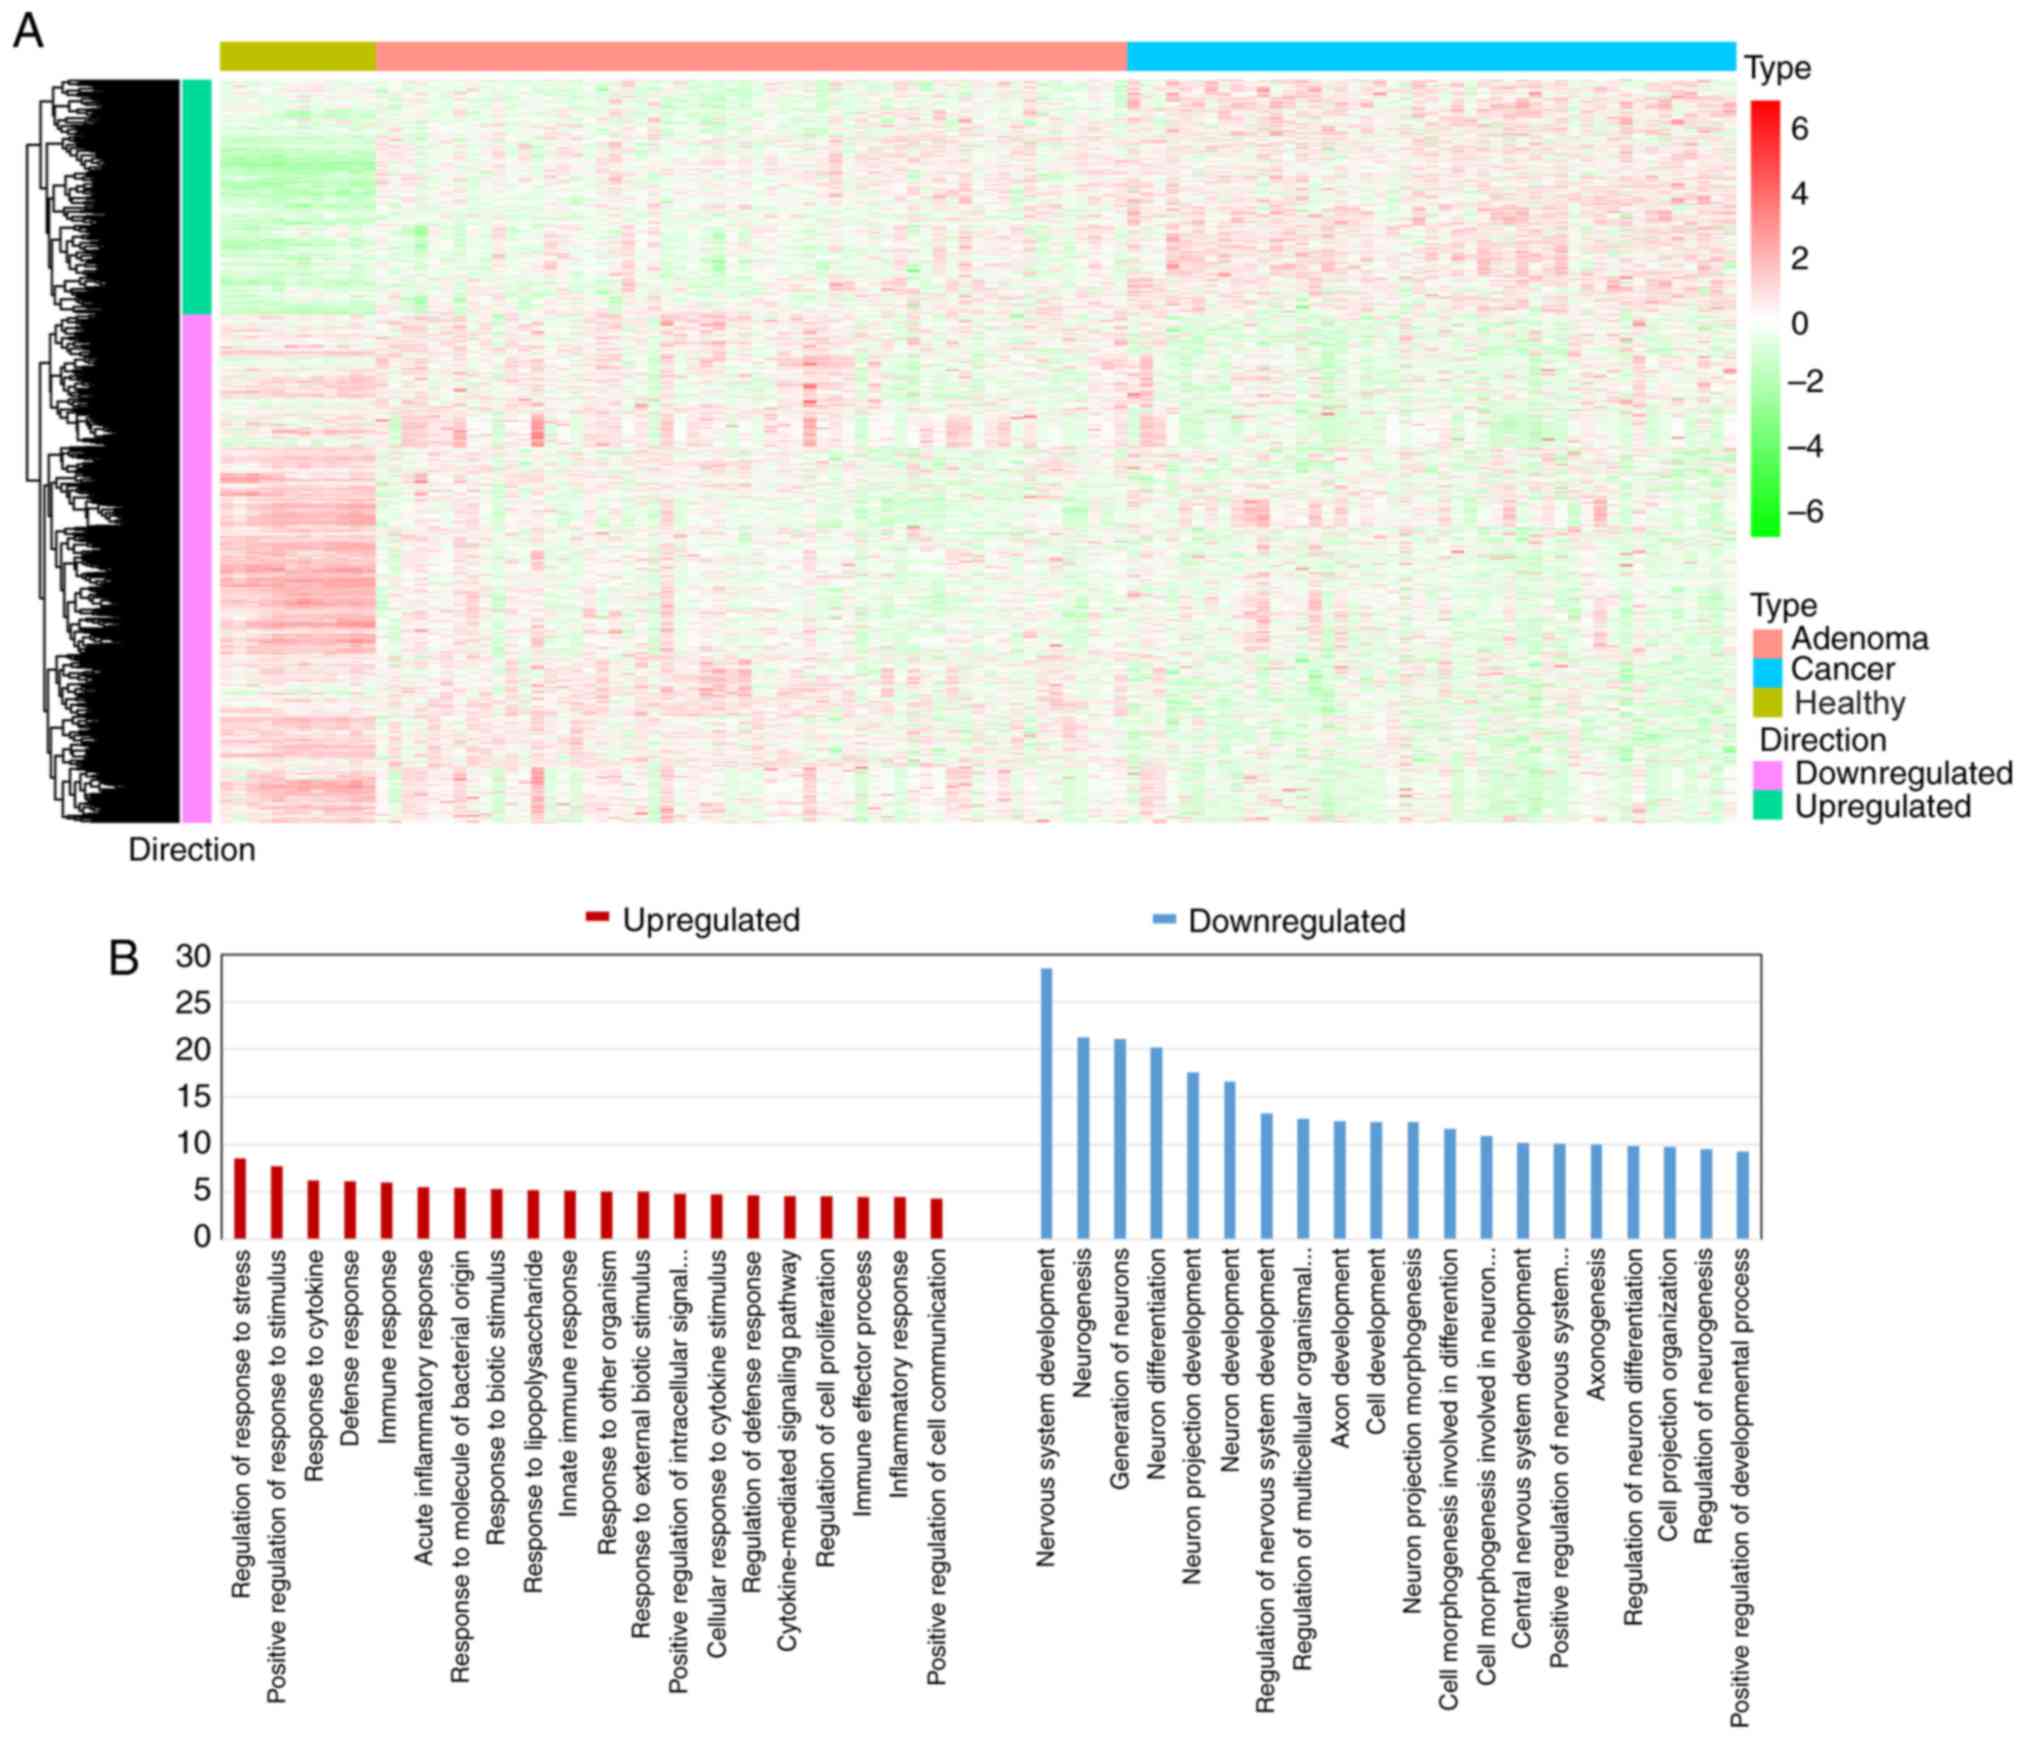
consistent DEGs. Therefore, 405 upregulated and 877 downregulated
consistent DEGs were identified (Fig.
2A). Gene ontology (GO) analysis was further conducted with the
Database for Annotation, Visualization and Integrated Discovery
bioinformatics tool (http://david.abcc.ncifcrf.gov/). The results of the GO
enrichment analysis indicated that the consistent downregulated
DEGs were associated with the ‘cell development’ process, while
consistent upregulated DEGs functionally concentrated upon the
‘immune response’ and the ‘defense response’ in CRC (Fig. 2B).
Consistent DEGs are also dysregulated
in the same direction in TCGA dataset
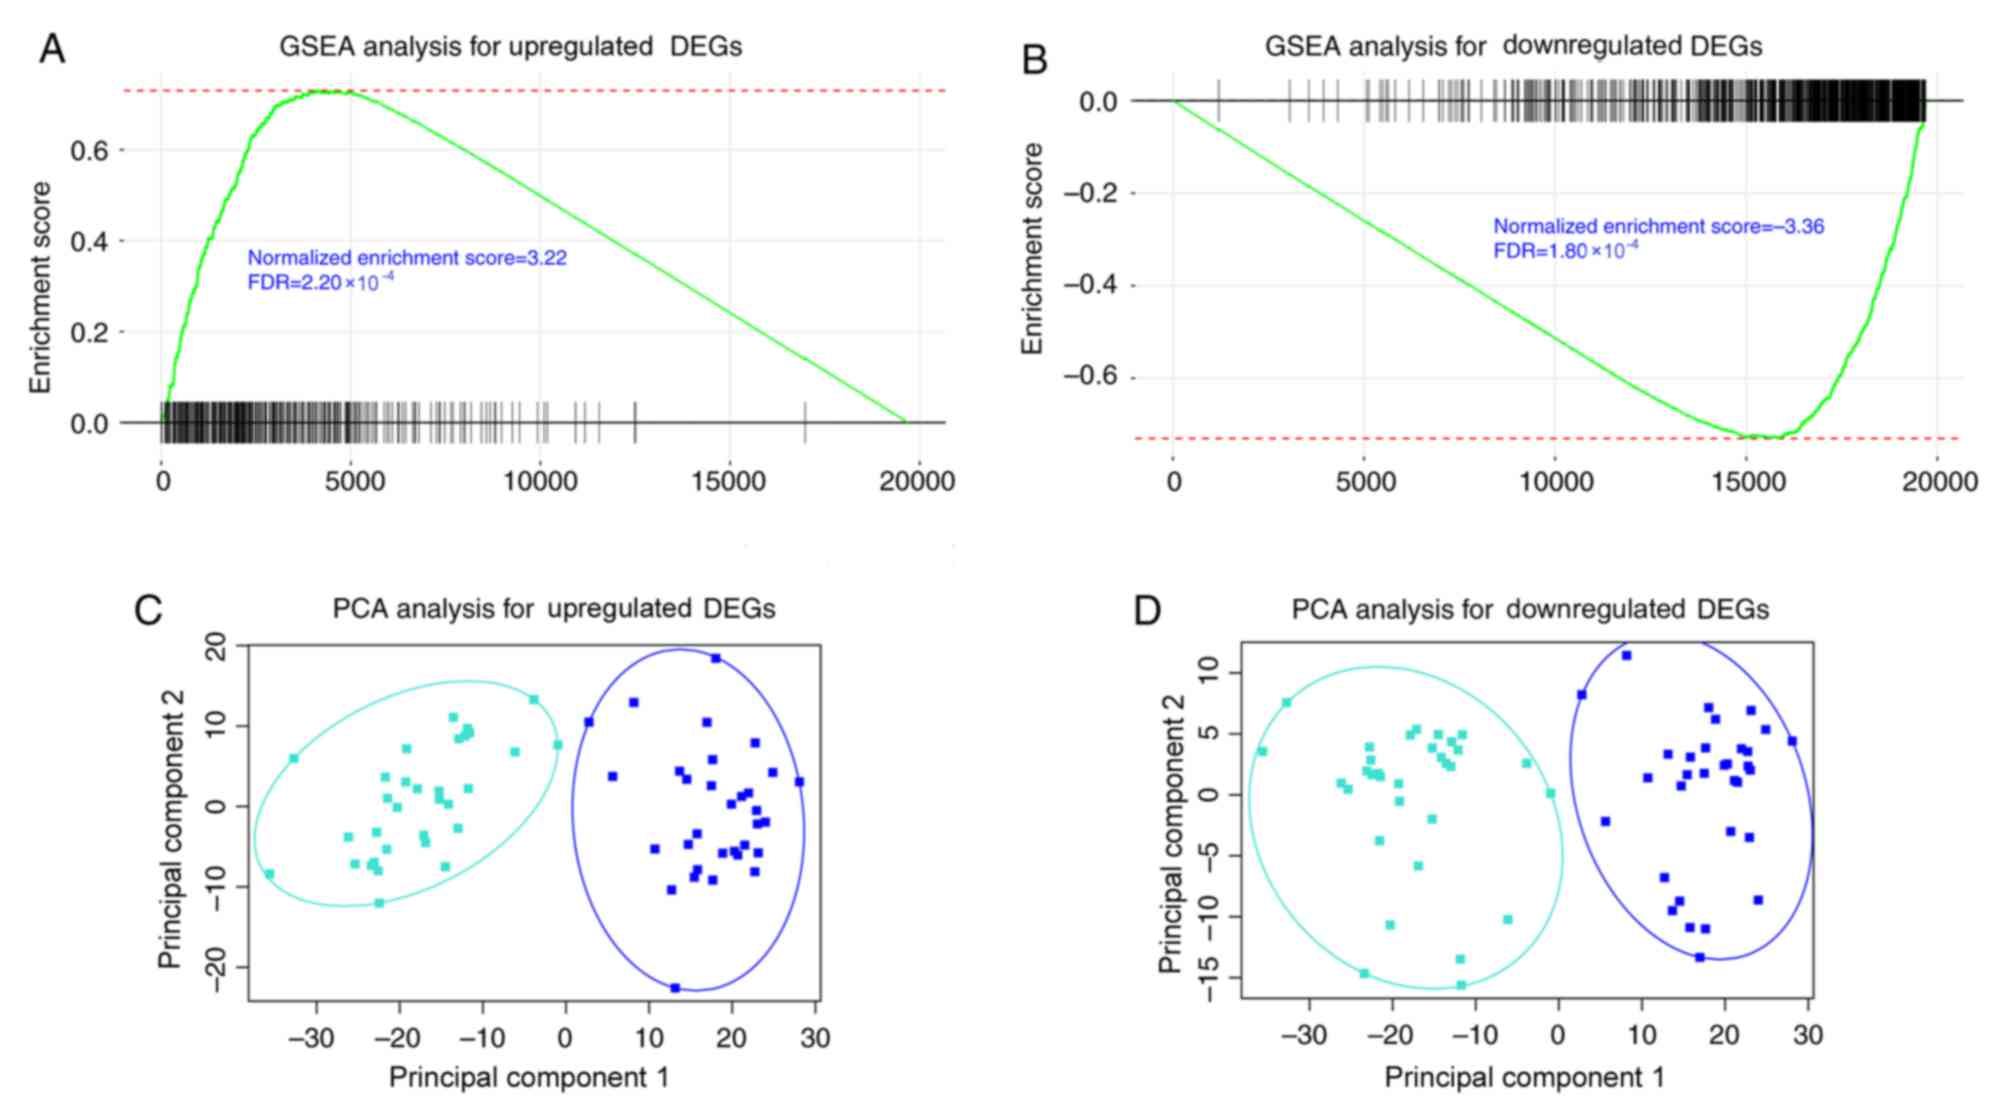
Gene set enrichment analysis using 32 paired RNA
sequencing data of cancer and adjacent healthy tissue in TCGA
database indicated that consistently upregulated DEGs were also
significantly upregulated [normalized enrichment score (NES)=3.22;
FDR=2.20×10⁻⁴; Fig. 3A]
and consistently downregulated DEGs were also significantly
downregulated (NES=−3.36; FDR=1.80×10⁻⁴; Fig. 3B) in TCGA dataset. Principal component
analysis indicated that consistent DEGs retrieved from GSE71187
were able to distinguish CRC samples from adjacent healthy tissues
in TCGA paired data (Fig. 3C and
D).
Random walk in merged biological
network to identify genes significantly affected by carcinogenic
dysregulation
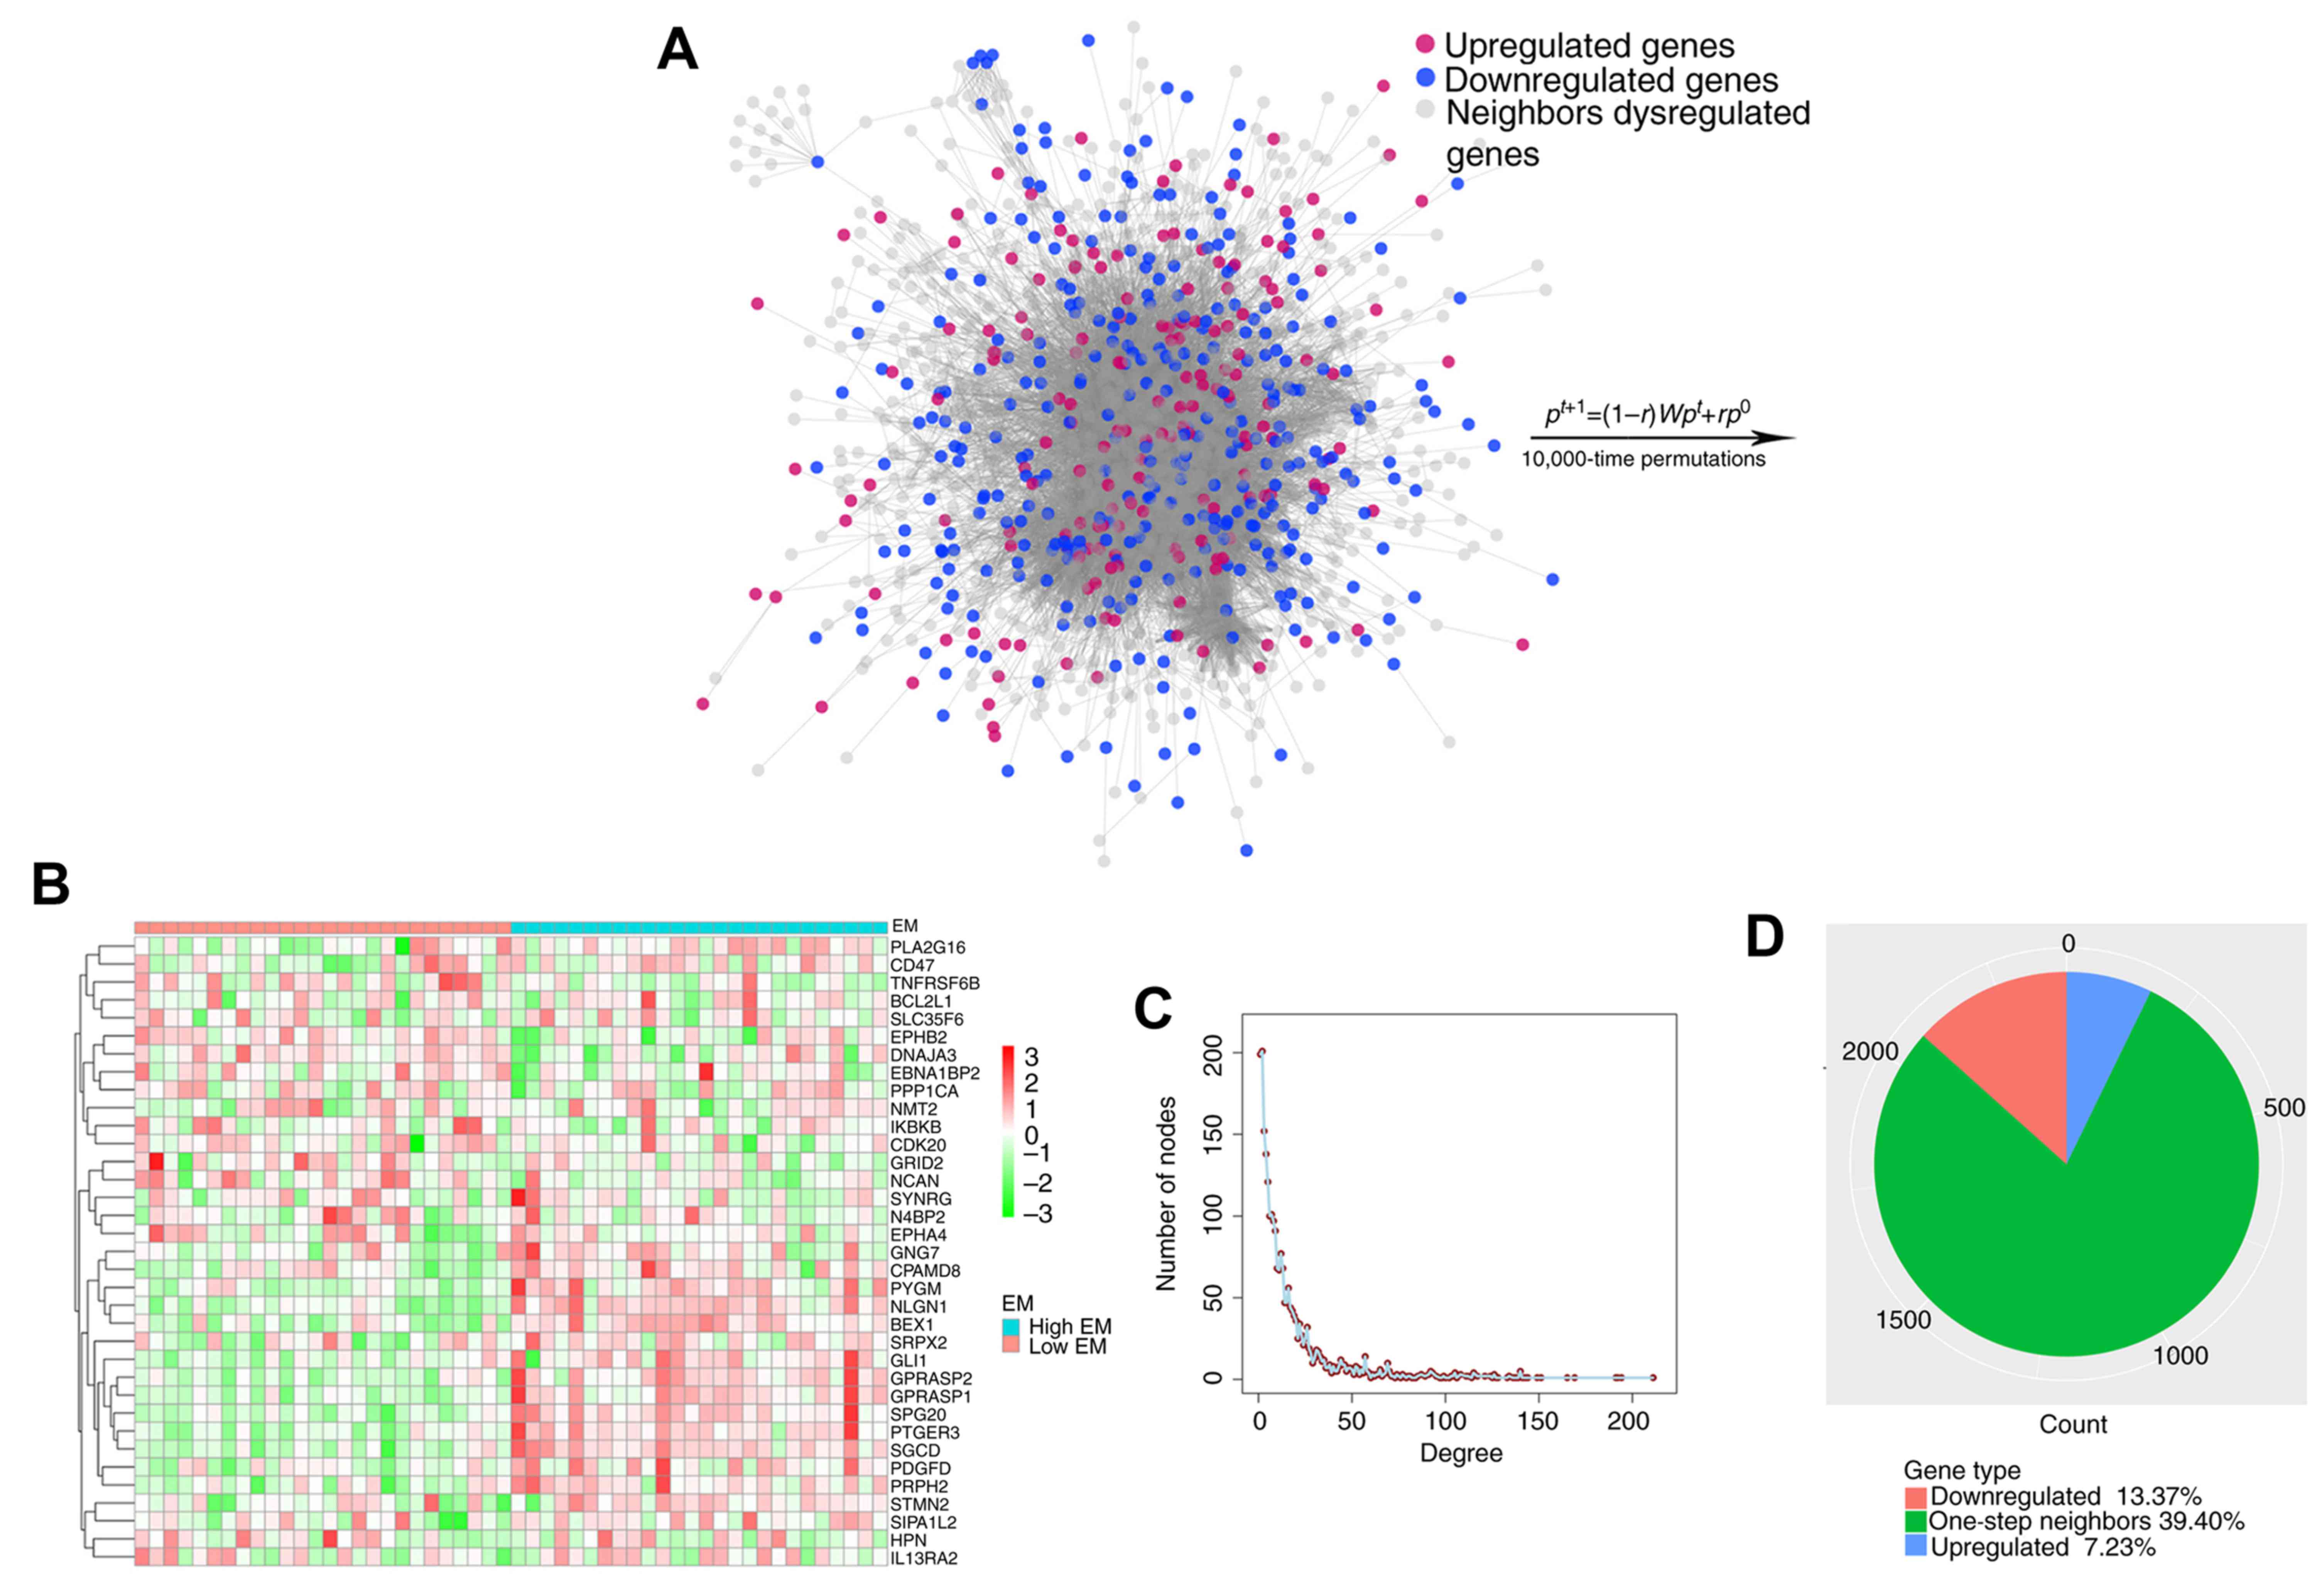
The identified consistent DEGs were projected onto
the merged a priori knowledge-based biological network and
subsequently, the largest connected component was obtained,
composed of these consistent DEGs and their one-step neighbors
(Fig. 4A). Finally, 35 genes
significantly affected by carcinogenic dysregulation were
successfully identified through the RWR algorithm (Fig. 4B). It was indicated that this network
approximated the scale-free network topology of a transcriptional
regulatory network (Fig. 4C),
indicating that the merged network functioned as a small-world
phenomenon (20). The largest
connected component contained 173 consistently upregulated DEGs,
320 downregulated DEGs, 1,901 one-step neighbors and 21,691
interactions (Fig. 4D). Furthermore,
DEGs and interactions were weighted with prognostic association by
quantifying the survival association and with gene-to-gene
co-expression by quantifying the biological affinity, using 52 CRC
microarray data and corresponding survival information in GSE71187.
The initial probability vector p0 was calculated
by normalizing score vector (n=493) so that the sum of the vector
equaled 1. When the steady state was achieved, genes in the
connected component, including 493 source nodes, were scored with
p∞ (n=2,394, output of random walk algorithm).
Genes with significantly high score were referred to as the most
affected ones by large-scale molecular dysregulations during
carcinogenesis. Therefore, 35 genes significantly affected by
carcinogenic dysregulation were collected through 10,000
permutations.
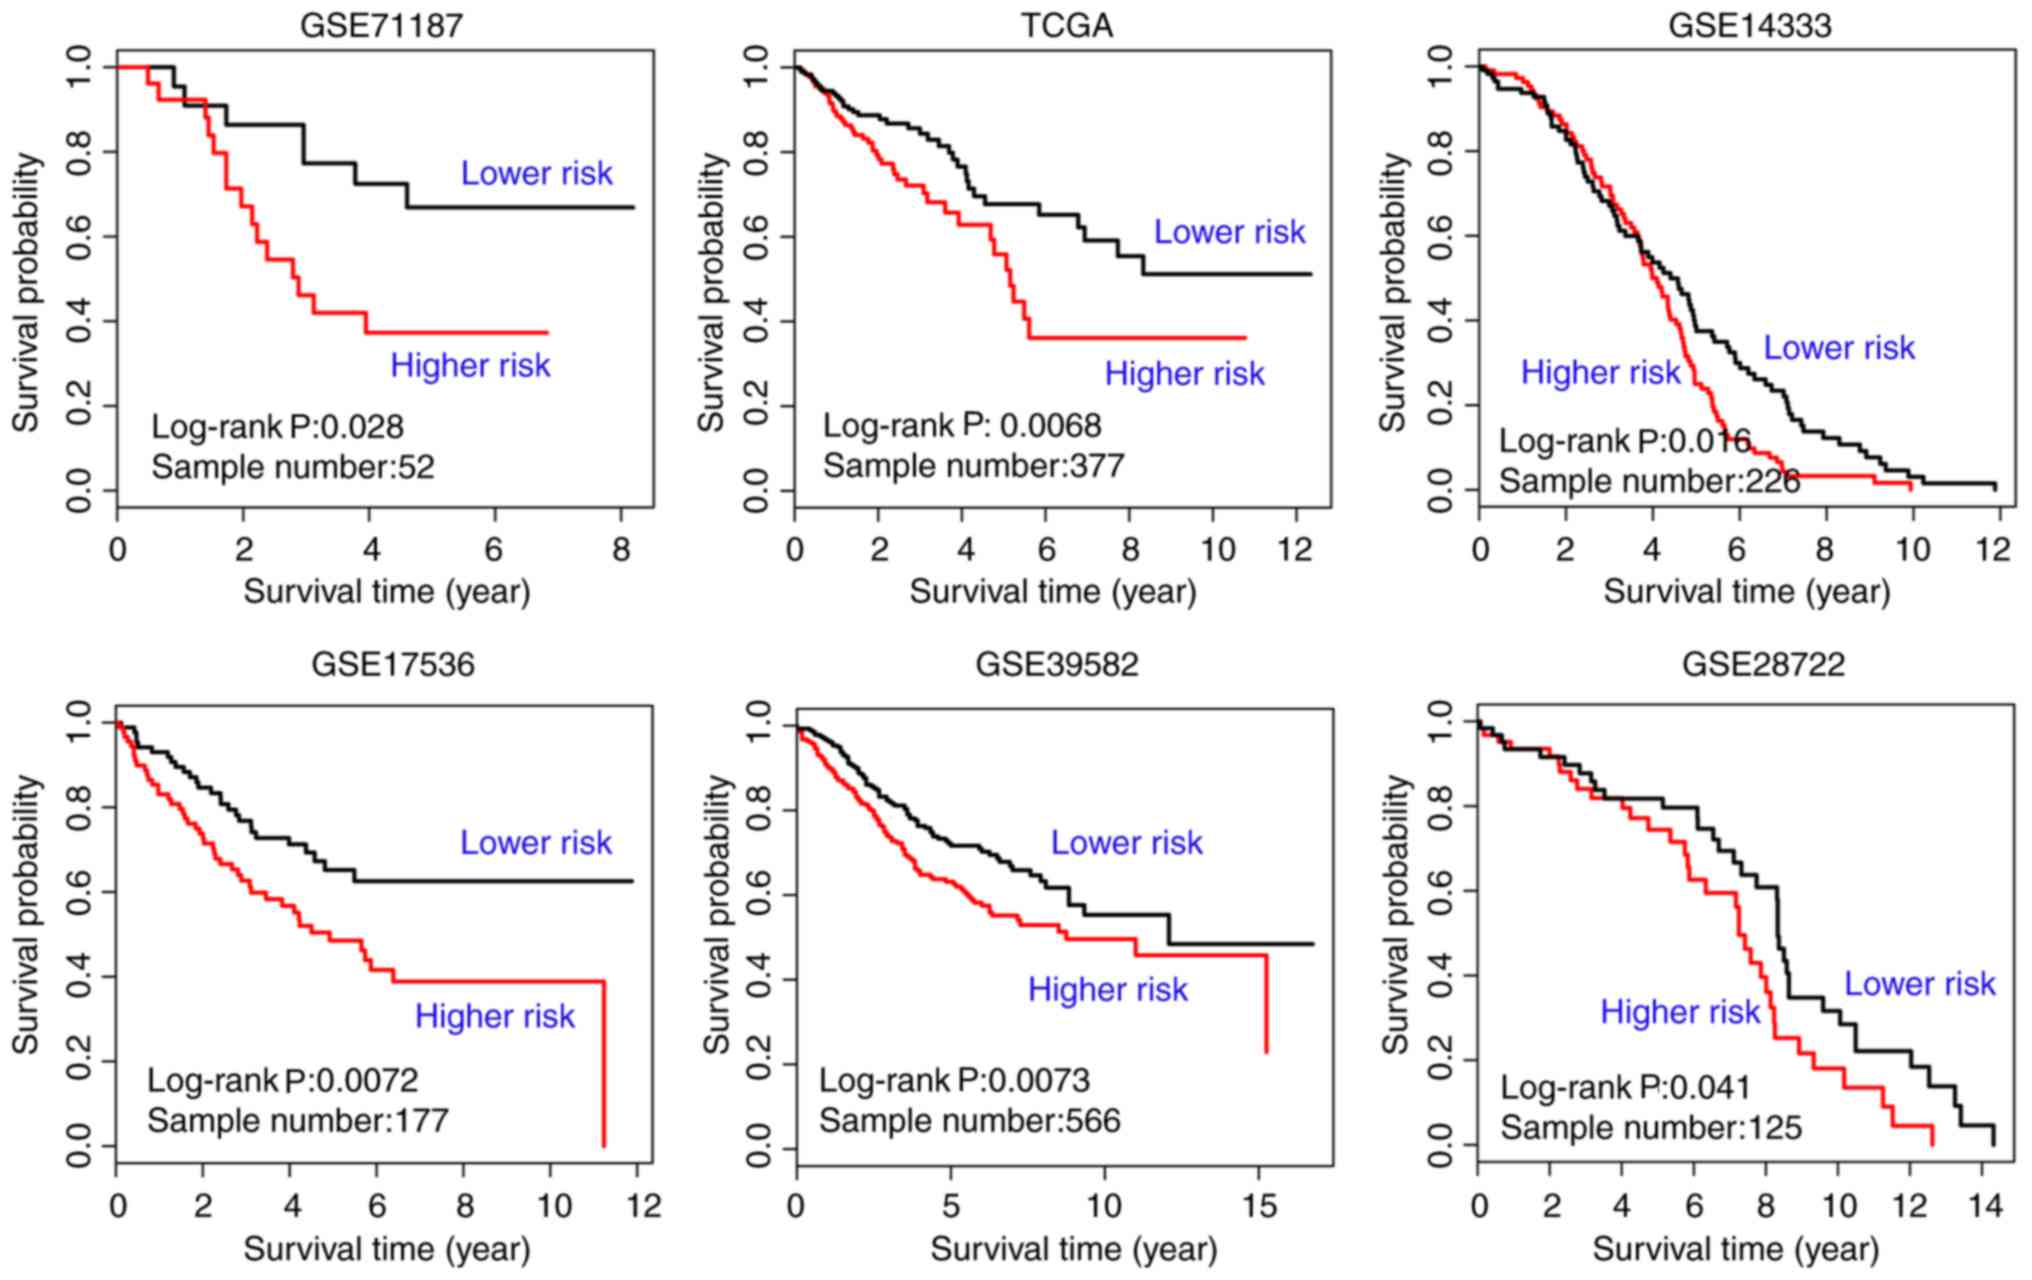
Validation of the prognostic value of
the genes significantly affected by carcinogenic dysregulation
GSE71187 CRC survival data, TCGA RNA sequencing
data, and datasets GSE14333, GSE17536, GSE39582 and GSE28722 were
used to evaluate the prognostic value of the 35 genes significantly
affected by carcinogenic dysregulation. The EM value of the
candidate module was calculated based on their first principal
component. Kaplan-Meier survival analysis was used to illustrate
the difference of survival status between the two EM-assigned
groups in each dataset. The result of the survival analysis
indicated a satisfactory performance of the 35 genes significantly
affected by carcinogenic dysregulation in all six independent
cohorts (GSE71187, n=52, P=0.028; TCGA, n=377, P=0.0068; GSE14333,
n=226, P=0.016; GSE17536, n=177, P=0.0072; GSE39582, n=566,
P=0.0073; GSE28722, n=125, P=0.041; Fig.
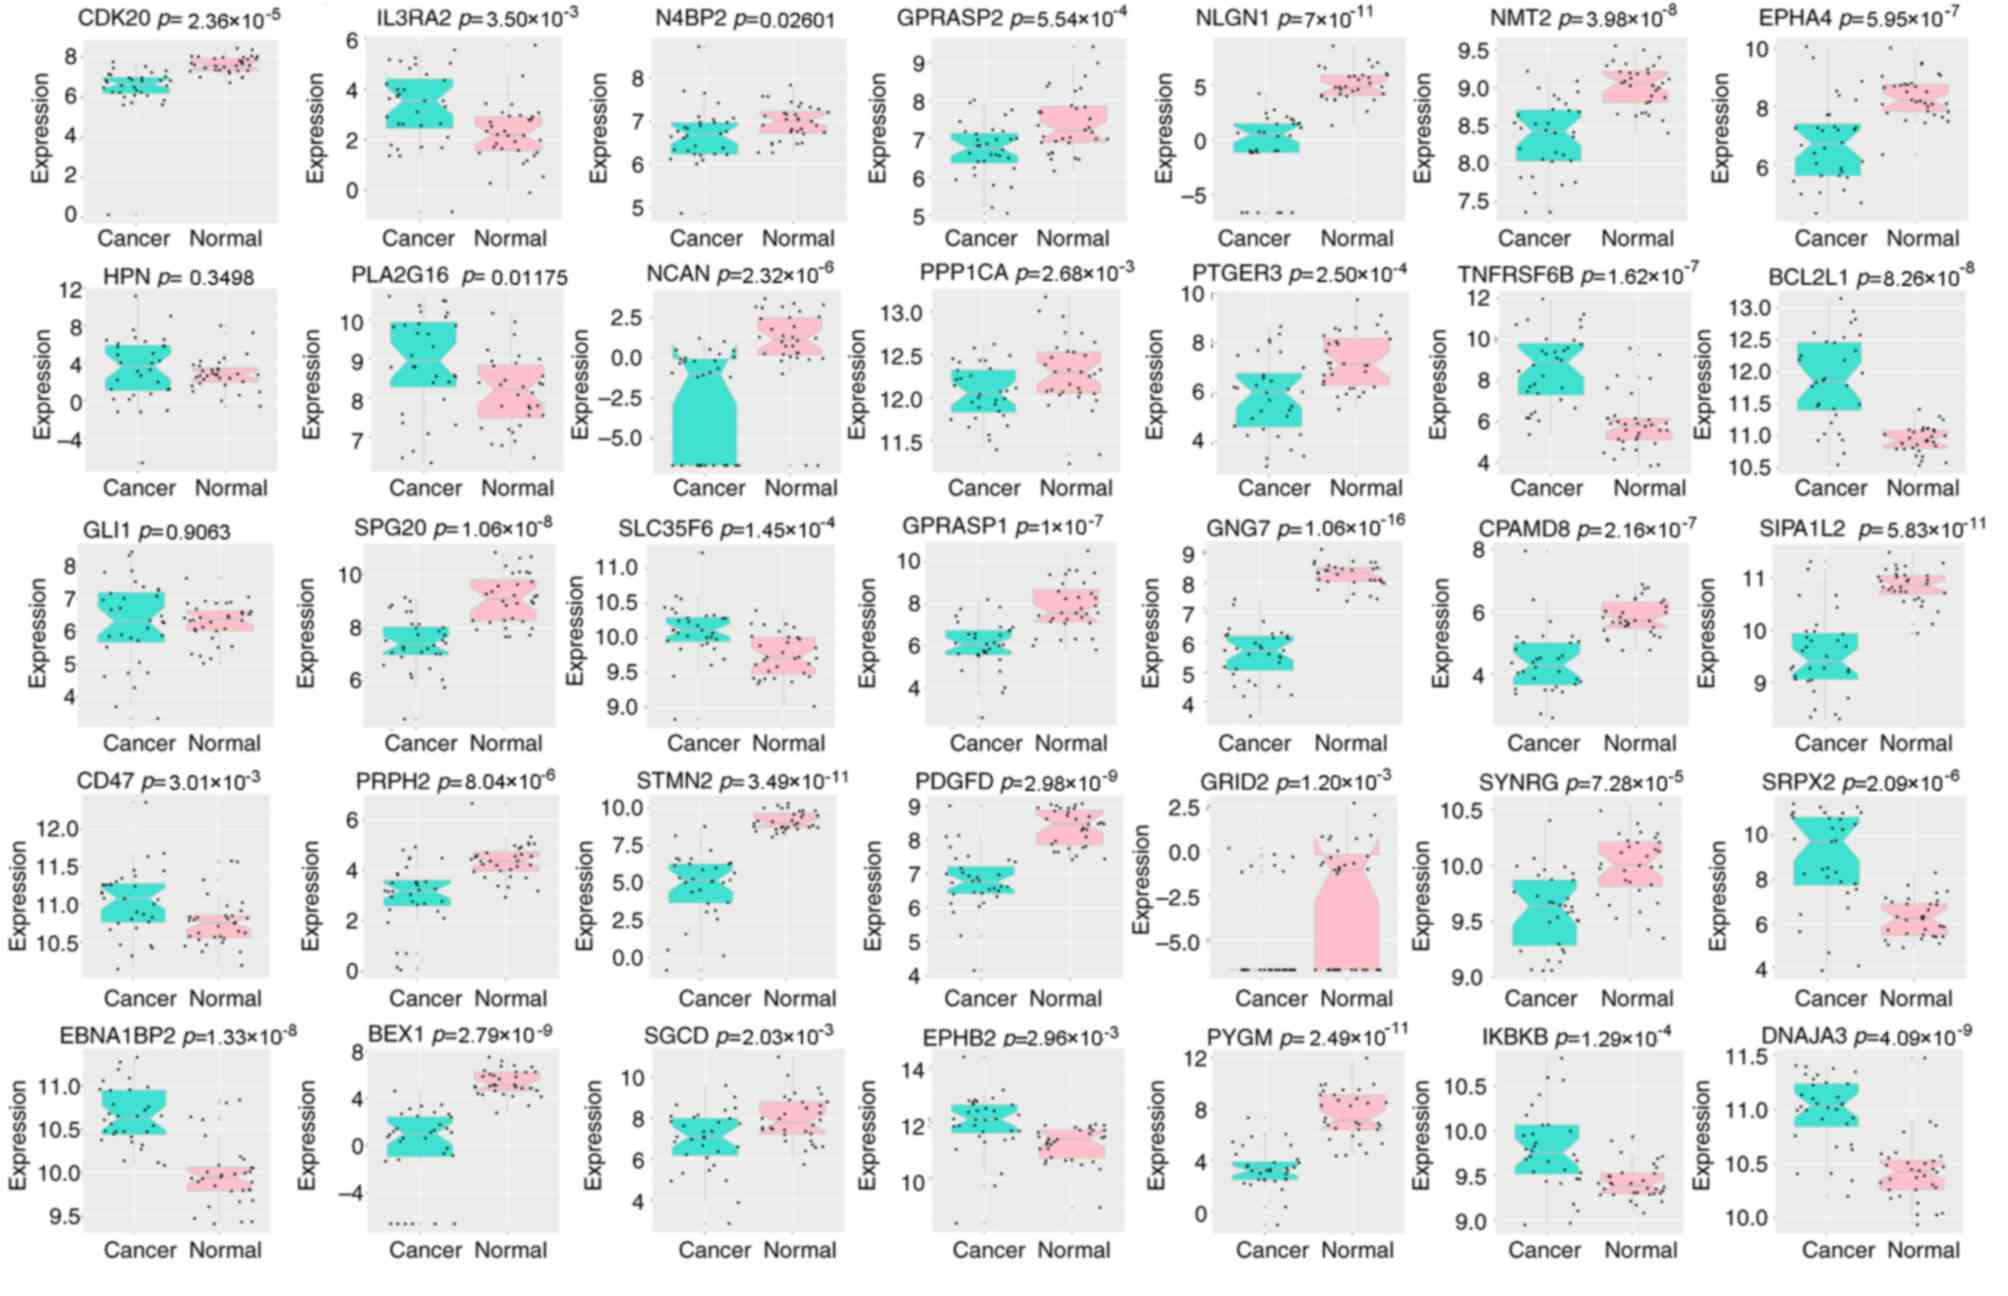
5). All genes were significantly dysregulated during CRC
carcinogenesis in TCGA paired data (P<0.05; Fig. 6), with the exception of hepsin
(P=0.350) and GLI family zinc finger 1 (P=0.906).
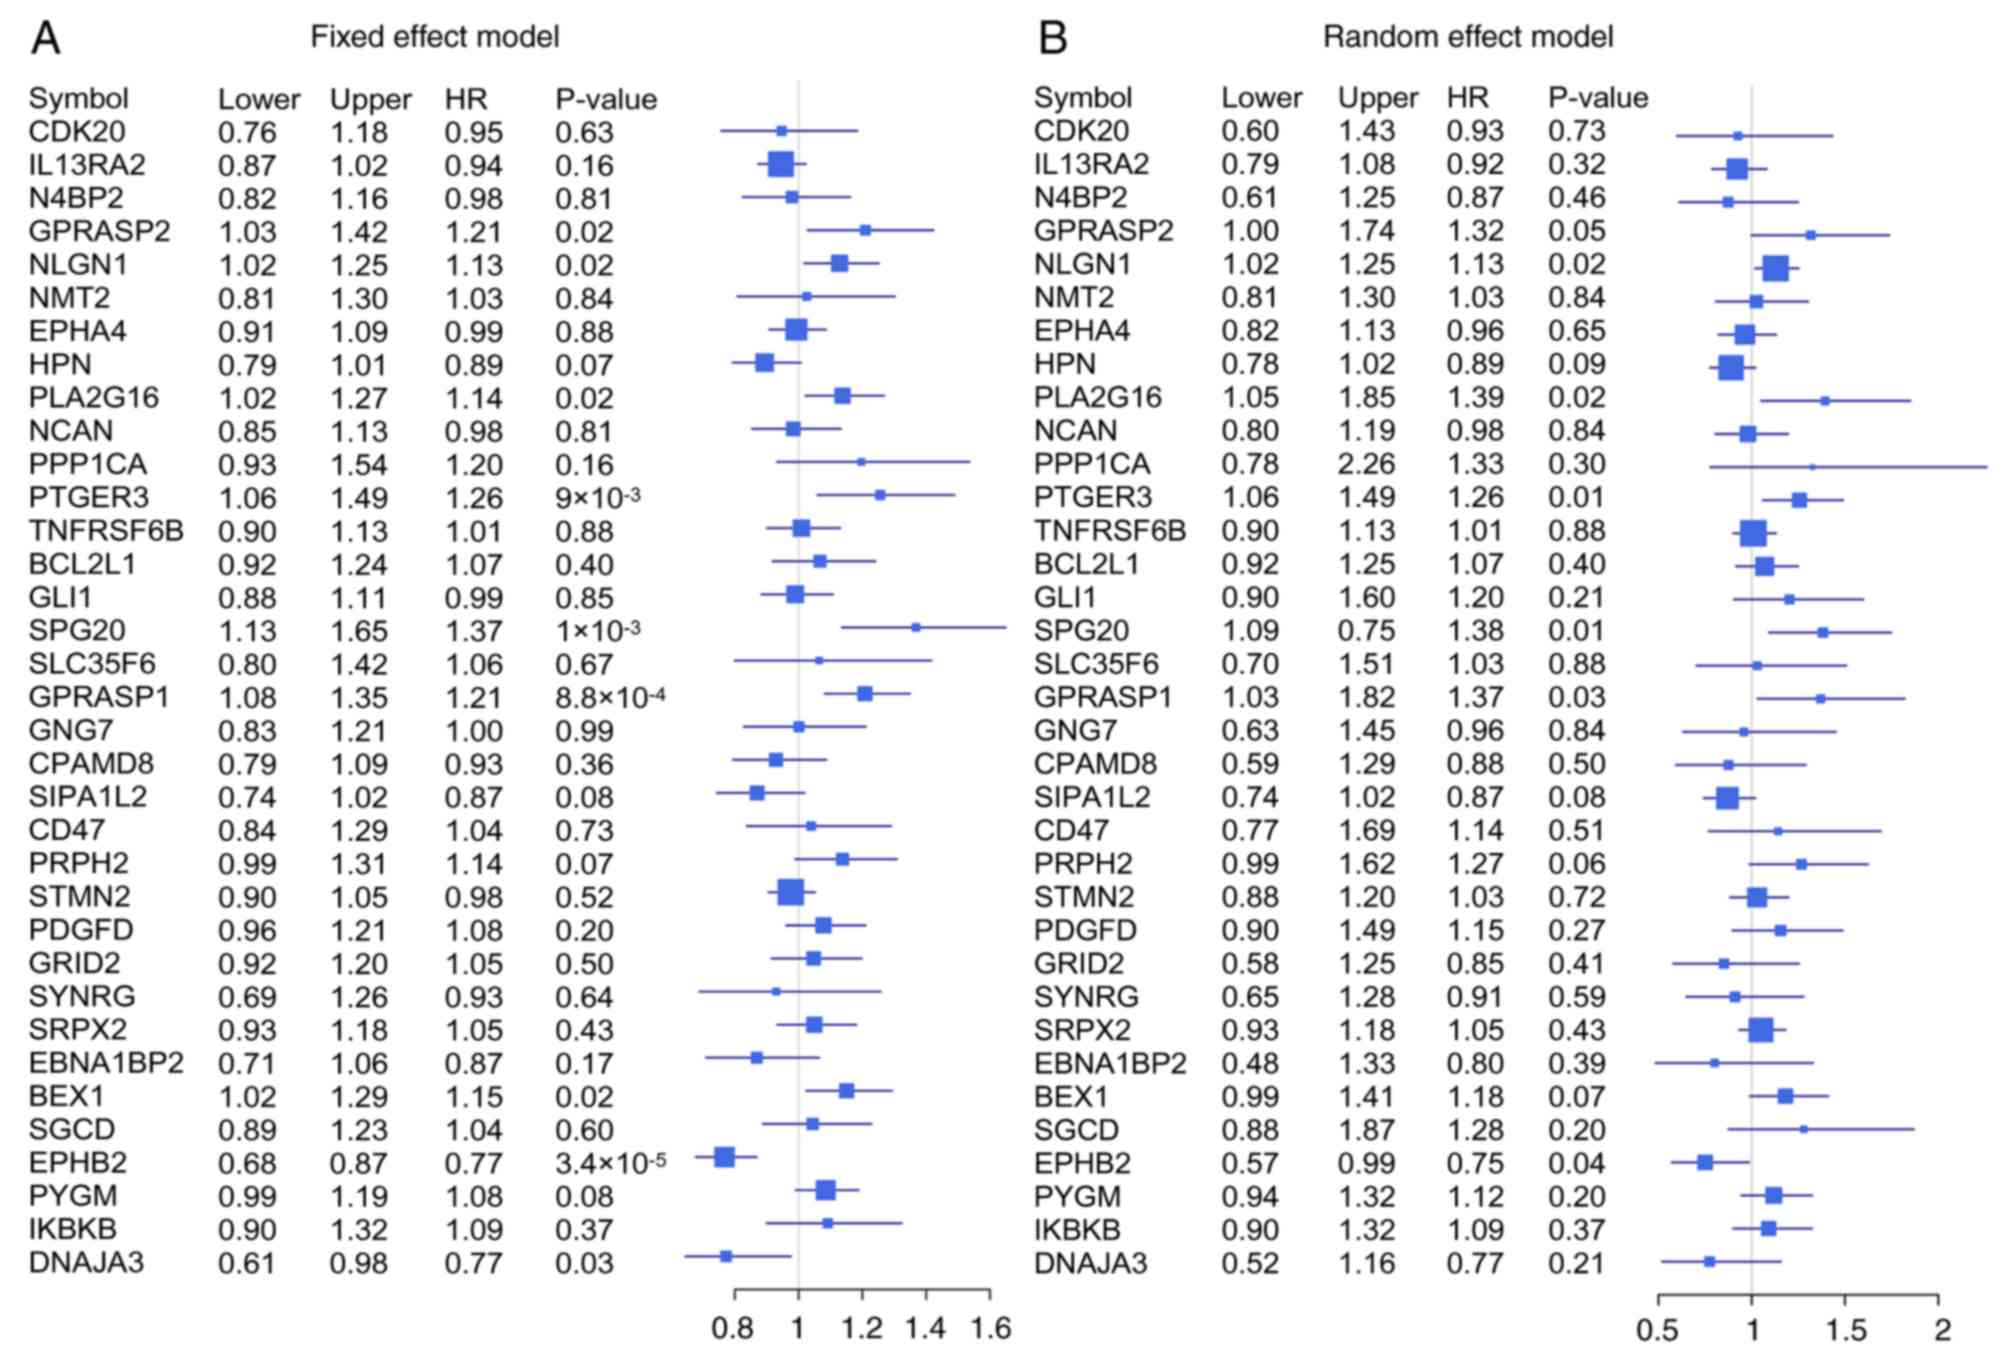
Confirmation of the prognostic value
of the 35 genes significantly affected by carcinogenic
dysregulation
Meta-analysis of 35 significant mRNAs in six
independent cohorts was conducted with a fixed-effects model and a
random-effects model (Fig. 7). The
Cox proportional hazards regression model was used to evaluate the
independence of the prognostic factors in a stepwise manner
(Table I). In each independent
cohort, samples with age, sex and American Joint Committee on
Cancer staging information were used to perform Cox analysis, with
the exception of GSE28722, since the dataset does not contain sex
information. The results indicated that the expression of these 35
genes (as indicated by the EM value) was confirmed as significant
in all six cohorts based on the univariate analysis, and as an
independent prognostic factor in four out of six cohorts, with the
exception of GSE71187 (P=0.131) and GSE17536 (P=0.063).
 | Table I.Univariate and multivariate analyses
of survival in patients with colorectal cancer in six test
cohorts. |
Table I.
Univariate and multivariate analyses
of survival in patients with colorectal cancer in six test
cohorts.
|
| Univariate cox
regression | Multivariate cox
regression |
|---|
|
|
|
|
|---|
| Factors | HR (95% CI) | P-value | HR (95% CI) | P-value |
|---|
| GSE71187 |
| Age
(years) | 0.959
(0.928–0.991) | 0.013 | 0.961
(0.927–0.997) | 0.034 |
| Sex
(male/female) | 1.777
(0.768–4.115) | 0.179 | – | – |
| Stage
(III/II) | 2.919
(1.073–7.942) | 0.036 | 2.261
(0.800–6.393) | 0.124 |
|
EMa | 3.068
(1.241–7.583) | 0.015 | 2.086
(0.804–5.411) | 0.131 |
| TCGA |
| Age
(years) | 1.027
(1.009–1.045) | 0.003 | 1.038
(1.019–1.057) |
6.090×10⁻⁵ |
| Sex
(male/female) | 1.244
(0.808–1.915) | 0.321 | – | – |
| Stage
(III+IV/I+II) | 2.750
(1.759–4.299) |
9.190×10⁻⁶ | 3.101
(1.949–4.932) |
1.769×10⁻⁶ |
|
EMa | 1.815
(1.172–2.809) | 0.008 | 1.610
(1.031–2.513) | 0.036 |
| GSE14333 |
| Age
(years) | 1.015
(1.002–1.028) | 0.020 | 1.013
(1.001–1.026) | 0.042 |
| Sex
(male/female) | 0.877
(0.651–1.182) | 0.390 | – | – |
| Stage
(Duke C/A+B)b | 0.878
(0.638–1.207) | 0.422 | – | – |
|
EMa | 1.456
(1.072–1.976) | 0.016 | 1.395
(1.025–1.901) | 0.035 |
| GSE17536 |
| Age
(years) | 1.007
(0.989–1.025) | 0.473 | – | – |
| Sex
(male/female) | 1.105
(0.694–1.759) | 0.674 | – | – |
| Stage
(III+IV/I+II) | 4.220
(2.387–7.459) |
7.275×10⁻⁷ | 3.934
(2.215–6.985) |
2.934×10⁻⁶ |
|
EMa | 1.899
(1.180–3.055) | 0.008 | 1.576
(0.976–2.545) | 0.063 |
| GSE39582 |
| Age
(years) | 1.024
(1.012–1.036) |
8.793×10⁻⁵ | 1.026
(1.014–1.038) |
2.356×10⁻⁵ |
| Sex
(male/female) | 1.314
(0.983–1.756) | 0.065 | – | – |
| Stage
(III+IV/I+II) | 1.761
(1.322–2.347) |
1.109×10⁻⁴ | 1.762
(1.319–2.354) |
1.257×10⁻⁴ |
|
EMa | 1.457
(1.094–1.940) | 0.010 | 1.385
(1.038–1.847) | 0.027 |
| GSE28722 |
| Age
(years) | 1.017
(0.997–1.038) | 0.103 | – | – |
| Stage
(III+IV/I+II) | 1.205
(0.791–1.834) | 0.385 | – | – |
|
EMa | 1.647
(1.011–2.688) | 0.045 | 1.647
(1.011–2.688) | 0.045 |
Discussion
The concept of biological pre-determinism was first
proposed in a study by MacDonald, which stated that clinical
outcome is possibly pre-determined by the intrinsic natural history
of cancer (21). A previous study of
a mammary intraepithelial neoplasia model indicated that
precancerous cells possess the malignant inclination for latency
and distant metastasis, independent of further genetic alterations
(22). Invasive behaviors were also
discovered in the precancerous stage, suggesting that cancer cell
dissemination may happen prior to tumor formation (23). The aforementioned studies indicated
that the ability of cancer cells to invade and metastasize may be
acquired at a precancerous stage. This concept was also addressed
in a previous study (24). Therefore,
consistent DEGs continuously activated or inactivated in
precancerous and cancer stages may increase the knowledge on the
essential molecular dysregulations during carcinogenesis, and aid
in the identification of prognostic biomarker and potential
therapeutic targets.
GO analysis indicated that consistent DEGs were
significantly enriched in immune response and
development-associated processes (Fig.
2B). It has been reported that chronic infection and
inflammation contribute to ~25% of all cancer types worldwide,
particularly in CRC (25). The
molecular similarities between malignancies and corresponding
developing samples have been reported in respect to transcription
factor activity (26), chromatin
structural regulation (27) and other
signaling pathways (28). Important
molecules have been indicated to be activated or inactivated
simultaneously in development and carcinogenesis processes. For
example, patched 1 is a key regulator for embryonic development and
skin carcinogenesis (29).
Furthermore, a fetus could also evade maternal immune-surveillance
by adopting similar molecular mechanisms to tumors (30). In the present study, GO results of
consistent DEGs confirmed that the molecular dysregulations
associated with immunity and development regulation may serve an
important role in CRC carcinogenesis, as indicated in previous
investigations.
In the present study, RWR, a simple and effective
computational strategy, was used in a merged biological network to
identify genes affected by multistage molecular dysregulation. The
RWR algorithm was used to establish gene to disease associations in
a priori knowledge-based networks, as it performed
superiorly compared with other methods (31–33). The
advantage of this computational strategy is subtly combining
dysregulation status of one's own data with putatively accepted
prior knowledge, rendering genes significantly affected by
carcinogenic dysregulation with certain biological and clinical
associations. Furthermore, consistent DEGs were weighted with
survival association and the edges were weighted with co-expression
association. Therefore, genes identified through RWR algorithm
possibly contained specific genes undergoing considerable
dysregulations during carcinogenesis. Gene signatures derived from
one data type should be extensively tested in other published
datasets in order to increase the validity of the whole analysis.
Therefore, additional published CRC data were also used to test the
validity of these 35 genes significantly affected by carcinogenic
dysregulation. A total of six independent cohorts were used to
evaluate the prognostic value of these 35 mRNAs significantly
affected by carcinogenic dysregulation. Kaplan-Meier survival
analysis was conducted to distinguish the actual survival
association between the two EM-assigned groups in each dataset. The
first principal component captured the greatest amount of total
variance in the profiles and was calculated for each patient.
Patients were then divided into two groups of equal size based on
the rank order of PC1 across their tumor profiles. This method has
been frequently used in previous studies (19,34–36). The
result indicated that the 35 genes significantly affected by
carcinogenic dysregulation performed well in all six independent
cohorts (Fig. 5), suggesting a
profound prognostic value of the 35 identified genes. The
significance of these identified genes in CRC was also supported by
a review of the literature. For example, EPH receptor B2 could
substantially reduce migration and invasiveness of colonic tumor
implants (37), functioning as a key
regulator in CRC carcinogenesis and prognostic prediction (38,39). The
promoter of spartin, variously methylated in colorectal carcinomas,
adenomas and normal mucosa samples (40), was found to be a highly specific and
sensitive biomarker for screening CRC (41). Furthermore, Cox analysis revealed that
the 35 identified genes were unanimously significant in univariate
analysis, validating their association with survival in patients
with CRC.
In conclusion, the global expression profiles of
human healthy colorectal mucosae, precancerous and CRC samples were
downloaded to identify genes with profound prognostic information
and potential clinical application. Consistent DEGs that
continuously differentiated at precancerous and cancer stages were
identified. Upregulated consistent DEGs were associated with
‘immune response’, while downregulated DEGs were mainly associated
with ‘cell development’. Furthermore, 35 genes significantly
affected by carcinogenic dysregulation were successfully identified
through a network-based RWR algorithm, and the expression of these
genes was significantly associated with CRC patients' survival.
Acknowledgements
Not applicable.
Funding
The present study was funded by grants from the
Natural Science Foundation of Shandong Province of China (grant no.
ZR201702170463).
Availability of data and materials
The datasets used or analyzed during the current
study are available from the corresponding author on reasonable
request.
Authors' contributions
NA, CZ, ZY and XY participated in the study design
and the writing of the paper. NA and XY performed the sample
selection, algorithm construction and data analysis. All authors
have read and approved the manuscript and its contents, and are
aware of responsibilities connected to authorship.
Ethics approval and consent to
participate
Not applicable.
Patient consent for publication
Not applicable.
Competing interests
The authors declare that they have no conflicts of
interest.
Glossary
Abbreviations
Abbreviations:
|
CRC
|
colorectal cancer
|
|
DEGs
|
differentially expressed genes
|
|
RWR
|
random walk with restart
|
|
GEO
|
Gene Expression Omnibus
|
|
TCGA
|
The Cancer Genome Atlas
|
|
HPRD
|
Human Protein Reference Database
|
|
KEGG
|
Kyoto Encyclopedia of Genes and
Genomes
|
|
OS
|
overall survival
|
|
FDR
|
false discovery rate
|
|
EM
|
eigengene of the module
|
|
GO
|
Gene Ontology
|
References
|
1
|
Brenner H, Kloor M and Pox CP: Colorectal
cancer. Lancet. 383:1490–1502. 2014. View Article : Google Scholar : PubMed/NCBI
|
|
2
|
Weiser MR: AJCC 8th edition: Colorectal
cancer. Ann Surg Oncol. 25:1454–1455. 2018. View Article : Google Scholar : PubMed/NCBI
|
|
3
|
Gonzalez-Pons M and Cruz-Correa M:
Colorectal cancer biomarkers: Where are we now? Biomed Res Int
2015. 1490142015.
|
|
4
|
Schadt EE, Lamb J, Yang X, Zhu J, Edwards
S, Guhathakurta D, Sieberts SK, Monks S, Reitman M, Zhang C, et al:
An integrative genomics approach to infer causal associations
between gene expression and disease. Nat Genet. 37:710–717. 2005.
View Article : Google Scholar : PubMed/NCBI
|
|
5
|
Zhang B, Gaiteri C, Bodea LG, Wang Z,
McElwee J, Podtelezhnikov AA, Zhang C, Xie T, Tran L, Dobrin R, et
al: Integrated systems approach identifies genetic nodes and
networks in late-onset Alzheimer's disease. Cell. 153:707–720.
2013. View Article : Google Scholar : PubMed/NCBI
|
|
6
|
Chen L, Chu C, Kong X, Huang G, Huang T
and Cai YD: A hybrid computational method for the discovery of
novel reproduction-related genes. PLoS One. 10:e01170902015.
View Article : Google Scholar : PubMed/NCBI
|
|
7
|
Tomczak K, Czerwińska P and Wiznerowicz M:
The cancer genome atlas (TCGA): An immeasurable source of
knowledge. Contemp Oncol (Pozn). 19:A68–A77. 2015.PubMed/NCBI
|
|
8
|
Chen R, Khatri P, Mazur PK, Polin M, Zheng
Y, Vaka D, Hoang CD, Shrager J, Xu Y, Vicent S, et al: A
meta-analysis of lung cancer gene expression identifies PTK7 as a
survival gene in lung adenocarcinoma. Cancer Res. 74:2892–2902.
2014. View Article : Google Scholar : PubMed/NCBI
|
|
9
|
Goonesekere NC, Wang X, Ludwig L and Guda
C: A meta analysis of pancreatic microarray datasets yields new
targets as cancer genes and biomarkers. PLoS One. 9:e930462014.
View Article : Google Scholar : PubMed/NCBI
|
|
10
|
An N, Shi X, Zhang Y, Lv N, Feng L, Di X,
Han N, Wang G, Cheng S and Zhang K: Discovery of a novel immune
gene signature with profound prognostic value in colorectal cancer:
A model of cooperativity disorientation created in the process from
development to cancer. PLoS One. 10:e01371712015. View Article : Google Scholar : PubMed/NCBI
|
|
11
|
Stolte M: The new Vienna classification of
epithelial neoplasia of the gastrointestinal tract: Advantages and
disadvantages. Virchows Arch. 442:99–106. 2003.PubMed/NCBI
|
|
12
|
Jorissen RN, Gibbs P, Christie M, Prakash
S, Lipton L, Desai J, Kerr D, Aaltonen LA, Arango D, Kruhøffer M,
et al: Metastasis-associated gene expression changes predict poor
outcomes in patients with dukes stage B and C colorectal cancer.
Clin Cancer Res. 15:7642–7651. 2009. View Article : Google Scholar : PubMed/NCBI
|
|
13
|
Smith JJ, Deane NG, Wu F, Merchant NB,
Zhang B, Jiang A, Lu P, Johnson JC, Schmidt C, Bailey CE, et al:
Experimentally derived metastasis gene expression profile predicts
recurrence and death in patients with colon cancer.
Gastroenterology. 138:958–968. 2010. View Article : Google Scholar : PubMed/NCBI
|
|
14
|
Marisa L, de Reyniès A, Duval A, Selves J,
Gaub MP, Vescovo L, Etienne-Grimaldi MC, Schiappa R, Guenot D,
Ayadi M, et al: Gene expression classification of colon cancer into
molecular subtypes: Characterization, validation, and prognostic
value. PLoS Med. 10:e10014532013. View Article : Google Scholar : PubMed/NCBI
|
|
15
|
Loboda A, Nebozhyn MV, Watters JW, Buser
CA, Shaw PM, Huang PS, Van't Veer L, Tollenaar RA, Jackson DB,
Agrawal D, et al: EMT is the dominant program in human colon
cancer. BMC Med Genomics. 4:92011. View Article : Google Scholar : PubMed/NCBI
|
|
16
|
Tusher VG, Tibshirani R and Chu G:
Significance analysis of microarrays applied to the ionizing
radiation response. Proc Natl Acad Sci USA. 98:5116–5121. 2001.
View Article : Google Scholar : PubMed/NCBI
|
|
17
|
Li J, Roebuck P, Grünewald S and Liang H:
SurvNet: A web server for identifying network-based biomarkers that
most correlate with patient survival data. Nucleic Acids Res.
40:W123–W126. 2012. View Article : Google Scholar : PubMed/NCBI
|
|
18
|
Ideker T, Ozier O, Schwikowski B and
Siegel AF: Discovering regulatory and signalling circuits in
molecular interaction networks. Bioinformatics. 18 Suppl
1:S233–S240. 2002. View Article : Google Scholar : PubMed/NCBI
|
|
19
|
Liu HY, Kho AT, Kohane IS and Sun Y:
Predicting survival within the lung cancer histopathological
hierarchy using a multi-scale genomic model of development. PLoS
Med. 3:e2322006. View Article : Google Scholar : PubMed/NCBI
|
|
20
|
Amaral LA, Scala A, Barthelemy M and
Stanley HE: Classes of small-world networks. Proc Natl Acad Sci
USA. 97:11149–11152. 2000. View Article : Google Scholar : PubMed/NCBI
|
|
21
|
Macdonald I: Biological predeterminism in
human cancer. Surg Gynecol Obstet. 92:443–452. 1951.PubMed/NCBI
|
|
22
|
Damonte P, Hodgson JG, Chen JQ, Young LJ,
Cardiff RD and Borowsky AD: Mammary carcinoma behavior is
programmed in the precancer stem cell. Breast Cancer Res.
10:R502008. View Article : Google Scholar : PubMed/NCBI
|
|
23
|
Rhim AD, Mirek ET, Aiello NM, Maitra A,
Bailey JM, McAllister F, Reichert M, Beatty GL, Rustgi AK,
Vonderheide RH, et al: EMT and dissemination precede pancreatic
tumor formation. Cell. 148:349–361. 2012. View Article : Google Scholar : PubMed/NCBI
|
|
24
|
Shi X, Zhang Y, Cao B, Lu N, Feng L, Di X,
Han N, Luo C, Wang G, Cheng S and Zhang K: Genes involved in the
transition from normal epithelium to intraepithelial neoplasia are
associated with colorectal cancer patient survival. Biochem Biophys
Res Commun. 435:282–288. 2013. View Article : Google Scholar : PubMed/NCBI
|
|
25
|
Hussain SP and Harris CC: Inflammation and
cancer: An ancient link with novel potentials. Int J Cancer.
121:2373–2380. 2007. View Article : Google Scholar : PubMed/NCBI
|
|
26
|
Hartwell KA, Muir B, Reinhardt F,
Carpenter AE, Sgroi DC and Weinberg RA: The Spemann organizer gene,
Goosecoid, promotes tumor metastasis. Proc Natl Acad Sci USA.
103:18969–18974. 2006. View Article : Google Scholar : PubMed/NCBI
|
|
27
|
Sparmann A and van Lohuizen M: Polycomb
silencers control cell fate, development and cancer. Nat Rev
Cancer. 6:846–856. 2006. View Article : Google Scholar : PubMed/NCBI
|
|
28
|
Liu S, Dontu G, Mantle ID, Patel S, Ahn
NS, Jackson KW, Suri P and Wicha MS: Hedgehog signaling and Bmi-1
regulate self-renewal of normal and malignant human mammary stem
cells. Cancer Res. 66:6063–6071. 2006. View Article : Google Scholar : PubMed/NCBI
|
|
29
|
Kang HC, Wakabayashi Y, Jen KY, Mao JH,
Zoumpourlis V, Del Rosario R and Balmain A: Ptch1 overexpression
drives skin carcinogenesis and developmental defects in
K14Ptch(FVB) mice. J Invest Dermatol. 133:1311–1320. 2013.
View Article : Google Scholar : PubMed/NCBI
|
|
30
|
Ridolfi L, Petrini M, Fiammenghi L,
Riccobon A and Ridolfi R: Human embryo immune escape mechanisms
rediscovered by the tumor. Immunobiology. 214:61–76. 2009.
View Article : Google Scholar : PubMed/NCBI
|
|
31
|
Navlakha S and Kingsford C: The power of
protein interaction networks for associating genes with diseases.
Bioinformatics. 26:1057–1063. 2010. View Article : Google Scholar : PubMed/NCBI
|
|
32
|
Wang XJ, Gulbahce N and Yu HY:
Network-based methods for human disease gene prediction. Brief
Funct Genomics. 10:280–293. 2011. View Article : Google Scholar : PubMed/NCBI
|
|
33
|
Zhang C, Li C, Li J, Han J, Shang D, Zhang
Y, Zhang W, Yao Q, Han L, Xu Y, et al: Identification of
miRNA-mediated core gene module for glioma patient prediction by
integrating high-throughput miRNA, mRNA expression and pathway
structure. PLoS One. 9:e969082014. View Article : Google Scholar : PubMed/NCBI
|
|
34
|
Chen DT, Hsu YL, Fulp WJ, Coppola D, Haura
EB, Yeatman TJ and Cress WD: Prognostic and predictive value of a
malignancy-risk gene signature in early-stage non-small cell lung
cancer. J Natl Cancer Inst. 103:1859–1870. 2011. View Article : Google Scholar : PubMed/NCBI
|
|
35
|
Marchion DC, Cottrill HM, Xiong Y, Chen N,
Bicaku E, Fulp WJ, Bansal N, Chon HS, Stickles XB, Kamath SG, et
al: BAD phosphorylation determines ovarian cancer chemosensitivity
and patient survival. Clin Cancer Res. 17:6356–6366. 2011.
View Article : Google Scholar : PubMed/NCBI
|
|
36
|
Hopewell EL, Zhao WP, Fulp WJ, Bronk CC,
Lopez AS, Massengill M, Antonia S, Celis E, Haura EB, Enkemann SA,
et al: Lung tumor NF-κB signaling promotes T cell-mediated immune
surveillance. J Clin Invest. 123:2509–2522. 2013. View Article : Google Scholar : PubMed/NCBI
|
|
37
|
Senior PV, Zhang BX and Chan ST: Loss of
cell-surface receptor EphB2 is important for the growth, migration,
and invasiveness of a colon cancer cell line. Int J. Colorectal
Dis. 25:687–694. 2010. View Article : Google Scholar
|
|
38
|
Drucker A, Arnason T, Yan SR, Aljawad M,
Thompson K and Huang WY: Ephrin b2 receptor and microsatellite
status in lymph node-positive colon cancer survival. Transl Oncol.
6:520–527. 2013. View Article : Google Scholar : PubMed/NCBI
|
|
39
|
Chen HJ, Wei Z, Sun J, Bhattacharya A,
Savage DJ, Serda R, Mackeyev Y, Curley SA, Bu P, Wang L, et al: A
recellularized human colon model identifies cancer driver genes.
Nat Biotechnol. 34:845–851. 2016. View Article : Google Scholar : PubMed/NCBI
|
|
40
|
Lind GE, Raiborg C, Danielsen SA, Rognum
TO, Thiis-Evensen E, Hoff G, Nesbakken A, Stenmark H and Lothe RA:
SPG20, a novel biomarker for early detection of colorectal cancer,
encodes a regulator of cytokinesis. Oncogene. 30:3967–3978. 2011.
View Article : Google Scholar : PubMed/NCBI
|
|
41
|
Zhang H, Song YC and Dang CX: Detection of
hypermethylated spastic paraplegia-20 in stool samples of patients
with colorectal cancer. Int J Med Sci. 10:230–234. 2013. View Article : Google Scholar : PubMed/NCBI
|