Introduction
As the main pathological type of esophageal cancer,
esophageal squamous cell carcinoma has led to high morbidity and
mortality in China for many years. Its clinical manifestations are
mainly progressive dysphagia and difficulties in swallowing food.
At present, the clinical treatments for esophageal squamous cell
carcinoma are surgery, radiotherapy and chemotherapy. In recent
years, with the advancement of social development and medical
conditions, the surgical skill of esophageal cancer has been
continuously improved, and radiotherapy equipment and novel
chemotherapy drugs have also been continuously updated. However,
the mortality rate for esophageal squamous cell carcinoma has not
been significantly improved. Latest studies have suggested that the
5-year survival rate is only 20% (1–3). As a
result, the treatments for esophageal squamous cell carcinoma need
to be improved. Hao et al (4)
pointed out that the occurrence and development of esophageal
squamous cell carcinoma are associated with multiple risk factors.
Apart from dietary habits and chemical factors, gene deletion and
abnormal expression should also be considered. As early as 2012,
Zhang et al (5) pointed out in
a study that STAT3 activation can cause abnormal proliferation and
transformation of esophageal squamous carcinoma cells. Moreover, a
study conducted by Katsha et al (6) also suggested that the competitor of
STAT3, STAT3 decoy oligodeoxynucleotides (ODN), can slow the growth
of cancer cells. Therefore, determining how to safely and
effectively introduce STAT3 decoy ODN into target cells and target
tissues has become a hot spot in recent clinical research. Although
conventional viral vectors have certain transfection efficiency,
the defects of poor targeting and low safety cannot be ignored.
Furthermore, although liposome transfection is relatively common
and the technology is widely implemented, transfection efficiency
remains low. Ultrasound-targeted microbubbles combined with
ultrasound have become a new research direction in China. A large
number of studies have confirmed that it can safely and effectively
increase gene transfection. However, its effect on squamous cell
carcinoma through the mediation of STAT3 decoy ODN is rare, and
merely few reports have been published worldwide. Therefore, the
purpose of the present study was to explore the effect of
ultrasound-targeted microbubbles combined with ultrasound on the
growth of esophageal squamous cell carcinoma and its mechanisms, in
order to provide a new direction for the treatment of esophageal
squamous cell carcinoma.
Materials and methods
Main materials
Human esophageal squamous carcinoma cell line EC9706
was provided by the Chinese Academy of Sciences Cell Bank
(Shanghai, China). RPMI-1640 medium and fetal bovine serum were
purchased from Gibco (Thermo Fisher Scientific, Inc., Waltham, MA,
USA), and the trypsin and MTT kits were purchased from
Sigma-Aldrich (St. Louis, MO, USA). The DAB chromogenic reagent kit
(PA110) was purchased from Tiangen Biotech Co., Ltd., (Beijing,
China), while the RIPA protein lysate (product no. P0013B) and
dimethyl sulfoxide (product no. ST038) were manufactured by
Biyuntian Biotech Co., Ltd. (Shanghai, China). Rabbit anti-STAT3
polyclonal antibody, mouse anti-p-STAT3 (705-tyrosine
phosphorylation site) monoclonal antibody, and horseradish
peroxidase-conjugated goat anti-rabbit secondary antibody were
purchased from Signalway Antibody LLC (College Park, MD, USA). The
ultrasound contrast agent SonoVue (lyophilized preparation) was
purchased from Bracco SpA (Milan, Italy), while the Lipofectaine™
2000 transfection kit for cationic liposomes was obtained from
Invitrogen (Thermo Fisher Scientific, Inc.). The ODNs and its
mismatch control sequences were designed by Shanghai Shenggong
Biological Engineering Co., Ltd. (Shanghai, China). All base
sequences were modified by total phosphorothioation. The STAT3
decoy ODN sequence was 5′-CATTTCCCGTAAATC-3′ and
5′-CATTTACGGGAAATG-3′, and was labeled with FITC. The
double-stranded mutant ODN control sequence was
5′-CATTTCCTTAAATC-3′ and 5′-GATTTAAGGGAAATG-3′.
The main instruments include an Olympus fluorescence
inverted microscope (Olympus Corporation, Tokyo, Japan), an
ultrasound therapeutic apparatus (Taizhou People's Hospital,
Taizhou, China), an ABI 7500 real-time fluorescence quantitative
PCR system (Applied Biosystems; Thermo Fisher Scientific, Inc.), an
Annexin V-FITC/PI apoptosis kit (Hangzhou MultiSciences [Lianke]
Biotech Co., Ltd., Hangzhou, China), a CGZZ Ultrasonic gene
transfection instrument (Ultrasonographic Image Research Institute,
Chongqing Medical University, Chongqing, China; ultrasonic
transmitting frequency, 300–1,000 kHz; sound intensity range,
0.25–2.50 W/cm), and a Synergy HT Multi-dection microplate reader
(BioTek Instruments, Inc., Winooski, VT, USA).
The study was approved by the Ethics Committee of
Ningbo No. 2 Hospital (Ningbo, China).
Cell culture
Cells were cultured in RPMI-1640 medium (100 µg/ml
of streptomycin + 100 U/ml of penicillin) containing 10%
high-quality fetal bovine serum, and maintained at a specific
condition of 37°C with 5% CO2 saturation humidity. Then,
cells that adherently grew were closely observed, and the culture
fluid was changed every two days. When ~80% confluence was reached,
cells were digested with trypsin (0.25%) and passaged.
Exponentially growing cells were selected for subsequent
experiments.
Preparation of microbubbles
The diameter of the ultrasound contrast agent
SonoVue was 2–5 µm, and the average diameter ~2.5 µm. The surface
had phospholipids, and was filled with SF6. Before implementation,
5 ml of 0.9% physiological saline was used to dissolute and dilute
the SonoVue, and vigorously shaken until the freeze-dried powder
completely dissolved into a microbubble suspension. According to
previous experiments, the optimal microbubble concentration was
20%.
Groups for the experiment
The present study was divided into three groups: the
experimental group, the positive control group and the blank
control group. The experimental group included the following
sub-groups: Group E, STAT3 Decoy ODN + ultrasound microbubble
contrast agent mixed solution + ultrasound irradiation; Group EC,
mutant ODN + ultrasonic microbubble contrast agent mixed solution +
ultrasonic irradiation. The positive control groups were as
follows: Group P, STAT3 decoy ODN + liposomal mixture + ultrasound
irradiation; Group PC, mutant ODN + liposomal mixture + ultrasound
irradiation. The blank control groups were as follows: Group C,
STAT3 decoy ODN + ultrasound irradiation; Group CC, STAT3 decoy ODN
+ ultrasound microbubble contrast agent mixed solution.
Cell transfection and ultrasonic
irradiation
The sense and antisense STAT3 decoy ODN was
solubilized with pH 8.0 Tris-HCl EDTA solution (1 mmol/l),
respectively. Then, this was annealed at 90°C to form a double
strand, keeping the temperature down at 5°C every 15 min, and the
reactant mixture was stored at 4°C.
The transfection operations for groups E and EC were
as follows: serum-free RPMI-1640 nutrient solution was used to
adjust the concentration of ODN and 1 ml of ultrasonic microbubble
suspension to 100 pmol. The above two liquids were respectively
mixed, gently shaken, and subsequently placed on ice for 20 min.
The STAT3 decoy ODN (mutant ODN)-microbubble mixture was mixed with
cells at a density of 1×10⁵ while being exposed to
ultrasound (frequency, 1 MHz; irradiation intensity, 0.5
W/cm2; duration time, 10 sec; interval, 10 sec; total
irradiation time, 1 min). After 6 h of reaction, the sealing
membrane was removed, and the medium containing 10% fetal bovine
serum was replaced by incubating at 37°C in a 5% CO2
incubator.
For groups P and PC, liposome transfection was
performed, according to the kit instructions. Then, 2–4 µg of STAT3
decoy ODN/mutant ODN (100 pmol) and 5 µl of Lipofectamine were
respectively dissolved in serum-free and antibiotic-free medium,
and mixed were thoroughly. Afterwards, this was allowed to stand
for 5 min, and was incubated at room temperature for 20 min. Then,
cells were diluted to adjust the density to 1×10⁵. Next,
the STAT3 decoy ODN-liposome mixture was mixed with cells and
placed at 37°C. Then, ultrasonic irradiation was performed at the
same conditions as above, incubated for another 6 h, and the
RPMI-1640 medium containing 10% fetal bovine serum was replaced for
further culture.
For group C, 100 pmol of ODN was mixed with EC9706
esophageal squamous carcinoma cells at a density of
1×10⁵, and subjected to ultrasound irradiation under the
above conditions. After 6 h, the serum that contained the RPMI-1640
medium was replaced. For group CC, the same procedure was performed
as that in groups E and EC, except for the ultrasound
irradiation.
Detection after transfection
After 48 h of operating, according to the above, the
cells were observed and photographed under an inverted fluorescence
microscope (magnification, ×400). Then, 10 fields were randomly
selected from each slide, and the transfection rate was calculated
by the ratio of the number of green fluorescence cells and the
number of total cells.
Detection of cell apoptosis by flow
cytometry
Cells were collected after digestion, cultured for
24 h, washed with pre-chilled 4°C PBS twice, and the supernatant
was discarded. Then, 70% ethanol was used to fix cells. Next, the
samples were centrifuged at 5,013 × g for 10 min at 28°C and
resuspended in 500 µl of binding buffer to a cell density of 1×10
cells/ml. Subsequently, 5 µl of FITC-labeled Annexin V mixture and
10 µl of propylene iodide (PI; 1 µg/ml) solution were added and
carefully mixed. After 15 min of dark reaction at room temperature,
400 µl of 1X binding buffer was added. After the full reactions, BD
Accuri™ C6 Flow Cytometer (BD, Loveton Circle, USA) was used to
detect 1×10⁴ cells per sample.
Cell survival curve measurement by MTT
assay
The log phase growth of EC9706 cells was diluted to
1×10⁸/l of cell suspension, and inoculated on 96-well
plates at 200 µl per well. Then, the diluted STAT3 decoy ODN,
mutant ODN, liposomes and ultrasonic microbubble mixture was added
into the corresponding wells after 24 h of incubation. Each group
was set up with six duplicate wells, and 150 µl of culture medium
was added. The control group consisted of an equal volume of
dimethyl sulfoxide and serum-free medium without any treatment. The
change in culture fluid at 12, 24, 48 and 72 h after the start of
the culture observed, and 20 µl of MTT (5 mg/ml) was simultaneously
added at room temperature for another 4 h. Then, the supernatant
was carefully discarded, and 150 µl of DMSO was added.
Subsequently, dimethyl sulfoxide (150 µl) was added, and lightly
shaken for 10 min until the crystals were dissolved. The absorbance
(A) of each well was measured using a microplate reader at 490 nm.
The formula was: Cell inhibition rate % = (A control group - A
experimental group)/A control group ×100%.
Revese transcription-quantitative PCR
(RT-qPCR)
Cells were lysated with TRIzol reagent. Then, the
lysate was transferred to a centrifuge tube, chloroform was added,
and the supernatant was taken after shaking and centrifugation at
12,000 × g for 15 min at 4°C. Next, the upper RNA was extracted and
an equal volume of isopropanol was added. The mixture was
centrifuged at 12,000 × g for 10 min at 4°C after mixing well.
Then, the precipitate was collected, washed with 75% ethanol, and
air-dried and dissolved in DEPC to synthesize the cDNA by reverse
transcription. The internal reference gene was β-actin. The
reaction conditions were as follows: pre-denaturation at 95°C for 2
min, denaturation at 95°C for 30 sec, annealing at 60°C for 30 sec,
extension at 72°C for 1 min with 35 cycles, and finally, extension
at 72°C for 10 min. The Ct values of the internal reference genes
and the genes of the respective groups were measured, and the
relative expression levels of the target gene were calculated using
the formula 2−ΔΔCq (7).
The experiment was repeated three times. In the present experiment,
the internal reference gene and target gene primer sequences are
presented in Table I.
 | Table I.Primer sequences of RT-qPCR. |
Table I.
Primer sequences of RT-qPCR.
| Primers | Sequences
(5′-3′) | Size (bp) |
|---|
| STAT3 | F:
GGAGGAGGCATTCGGAAAG | R:
TCGTTGGTGTCACACAGAT | 110 |
| Cyclin D1 | F:
CTTCATTCTCCTTGTTGTTGGT | R:
GATTATTGGGGTATAAAATCCTCT | 163 |
| Bcl-xL | F:
TGACGTGGACATCCGCAAAG | R:
CTGGAAGGTGGACAGCGAGC | 211 |
| β-actin | F:
GGCATCGTGATGGACTCCG | R:
GCTGGAAGGTGGACAGCGA | 138 |
Western blotting
Each group of cells was washed three times with
pre-chilled PBS. The RIPA lysate was added to extract the total
tissue protein, according to protein kit instructions. The BCA kit
was used to quantitatively analyze the protein concentration. Then,
20 µg of cellular total protein was respectively taken from each
group for 10% SDS-PAGE separation. The semi-dry method was used to
separate the protein, followed by transmembrane at a
constant-voltage electrophoresis of 100 V. Then, 5% skim milk
powder was used for blocking for ~1 h, and reacted overnight with
p-STAT3 primary antibody (dilution, 1:250; cat. no. 4905) and STAT3
primary antibody (dilution, 1:600; cat. no. BF0374) for 2 h at a
temperature of 4°C. Subsequently, the membrane was washed with
TBST, and goat anti-mouse IgG secondary antibody (dilution,
1:1,000; cat. no. F0106B) added at 37°C and incubated for 1 h. The
color was developed using a DAB kit and analyzed using Image J
software. The experiment was repeated three times. The expression
level of each detection factor was evaluated using the gray ratio
of the target gene bands and β-actin bands.
Nude mouse model of subcutaneous
transplantation tumor
Forty BALB/c female nude mice, aged 4–6 weeks with
mean body mass 19.35±0.46 g were provided by Beijing Vital River
Laboratory Animal Technology Co., Ltd. (Art. no. 401). During the
feeding process, the temperature was maintained between 24–26°C
with a suitable humidity (55–70%), free access to food and water
and a daily 12 h light/dark cycle. Before the experiment, all the
mice were adaptively fed for one week. After being anaesthetized
via inhalation with 2% isoflurane, the mice were placed in the
supine position and were depilated for ultrasound irradiation. The
EC9706 single cell suspension was prepared and resuspended with
PBS. Then, cell density was adjusted to 5×10⁷ cells/ml.
All treatments were performed on a clean bench. Subsequently, 75%
alcohol was used to partially sterilize the mice. Under sterile
conditions, 0.2 ml of a single cell suspension was subcutaneously
injected on the right side. Tumors formed after one week of cell
inoculation. When the tumors grew to ~100 mm2, mice with
strong tumor growth were selected and sacrificed. Then, the
necrotic tissue was removed, washed with physiological saline, cut
into 2-mm3 uniform pieces, and inoculated on the right
back of the nude mice. The animals were kept under the conditions
of SPF with unlimited feeding. Mice were observed after 10 days. A
total of 30 nude mice with a tumor size of ~100–200 mm3
were selected and randomly divided into six groups, with five mice
in each group. Mice in the experimental group were slowly injected
by each mixture (all, 0.25 ml) using a 1-ml syringe through the
tail vein, while mice in the control group were injected with an
equal volume of saline. After the injection, the ultrasound machine
was immediately used three times, except for the CC group (output,
0.5 W/cm2; duration, 20 sec; interval, 20 sec). After
the end of irradiation, mice were routinely reared, and the length
and width of the transplanted tumor were measured every three days
using a vernier caliper. Tumor volume = tumor length ×
width2 × 1/2. The experiment ended at 15 days after
inoculation, and the nude mice were sacrificed by cervical
dislocation. The tumors of the nude mice were excised and weighed
to calculate for the tumor inhibition rate. The tumor inhibition
rate % = (tumor mass of the control group - tumor mass of the
experimental group)/tumor mass of the control group ×100%.
Statistical analysis
The data obtained from the experiment were analyzed
using SPSS 19.0 software (IBM Corp., Armonk, NY, USA). Quantitative
data were expressed as mean ± standard deviation (mean ± SD).
Variance analysis was used to determine the immunofluorescence and
flow cytometry results after transfection in each group. Pairwise
comparison was performed using the SNK-q test. Repeated calculation
of variance was performed to analyze the difference in the
inhibition rate of the different groups of cells at corresponding
time-points, and explore the effect of the overexpression by
different methods to transfect STAT3 decoy ODN on the proliferation
of cancer cells. At the same time, variance analysis was used to
evaluate the RT-qPCR detection and western blotting results.
Furthermore, the SNK-q test was used to analyze the differences in
the expression levels of gene products in each group, thereby
exploring the possible mechanism of STAT3 decoy ODN.
Results
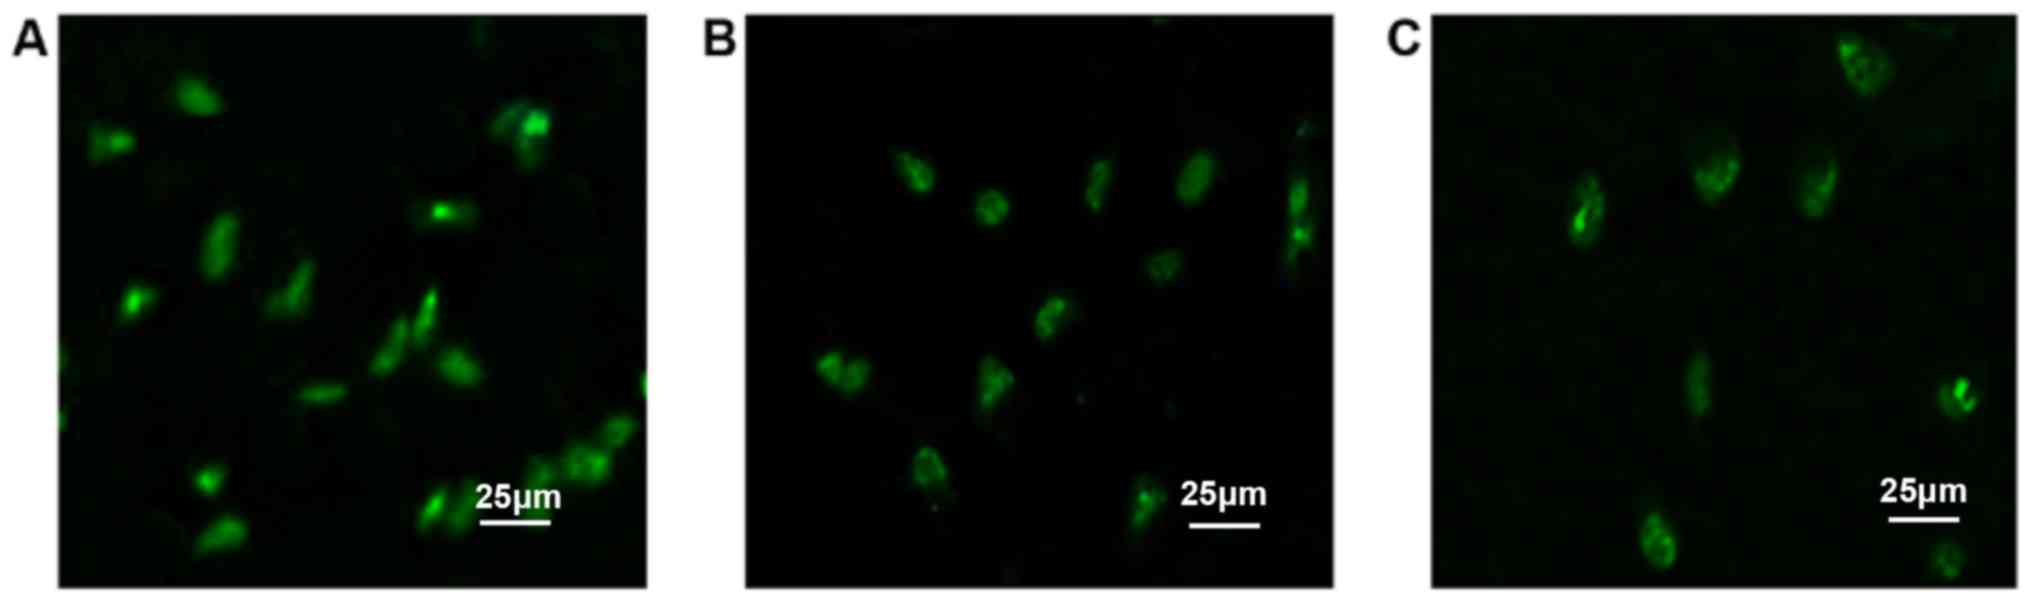
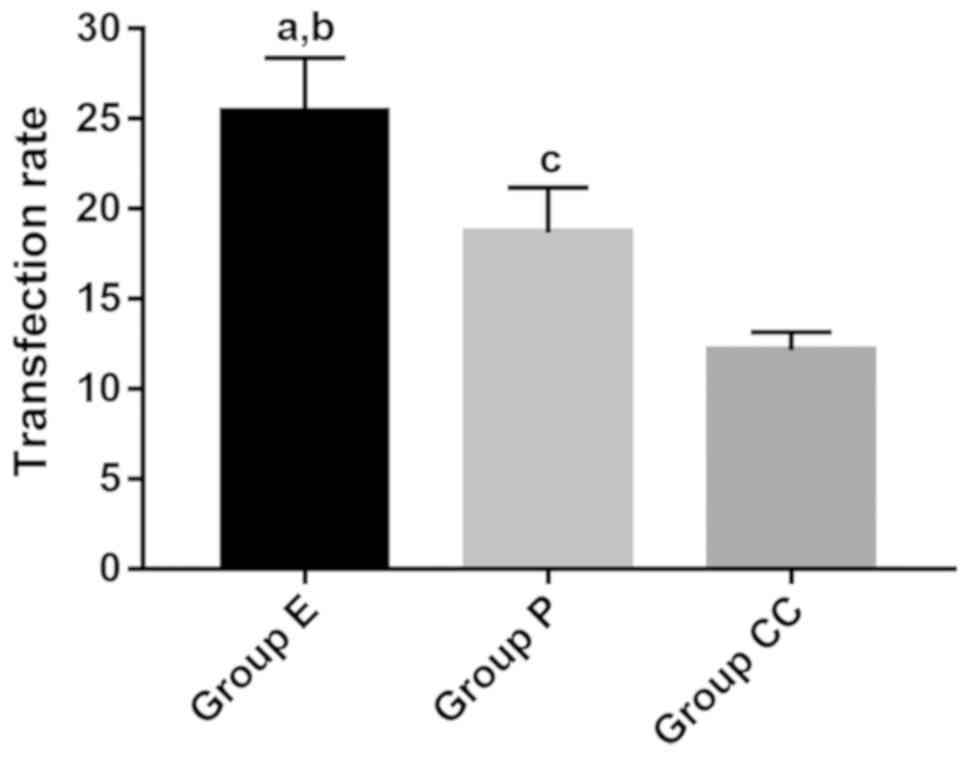
Detection of transfection efficiency
using an inverted fluoroscope
At 48 h after transfection, green fluorescence was
observed in the E, P and CC groups. Most of the antisense STAT3
ODNs labeled with FITC entered the cells, and were mainly located
in the nucleus. However, the fluorescence intensity and quantity
were different. After comparison, it was found that the E group had
higher fluorescence intensity and quantity (Fig. 1), while this was slightly weaker in
the CC group than in the P group. The fluorescence transfection
rates of these three groups were as follows: E group, 25.39±1.05%;
P group, 18.68±2.34%; CC group, 12.15±2.27%. The difference was
statistically significant (F=3.737, P=0.014). Obvious fluorescent
markers were not revealed in the rest of the groups (Fig. 2).
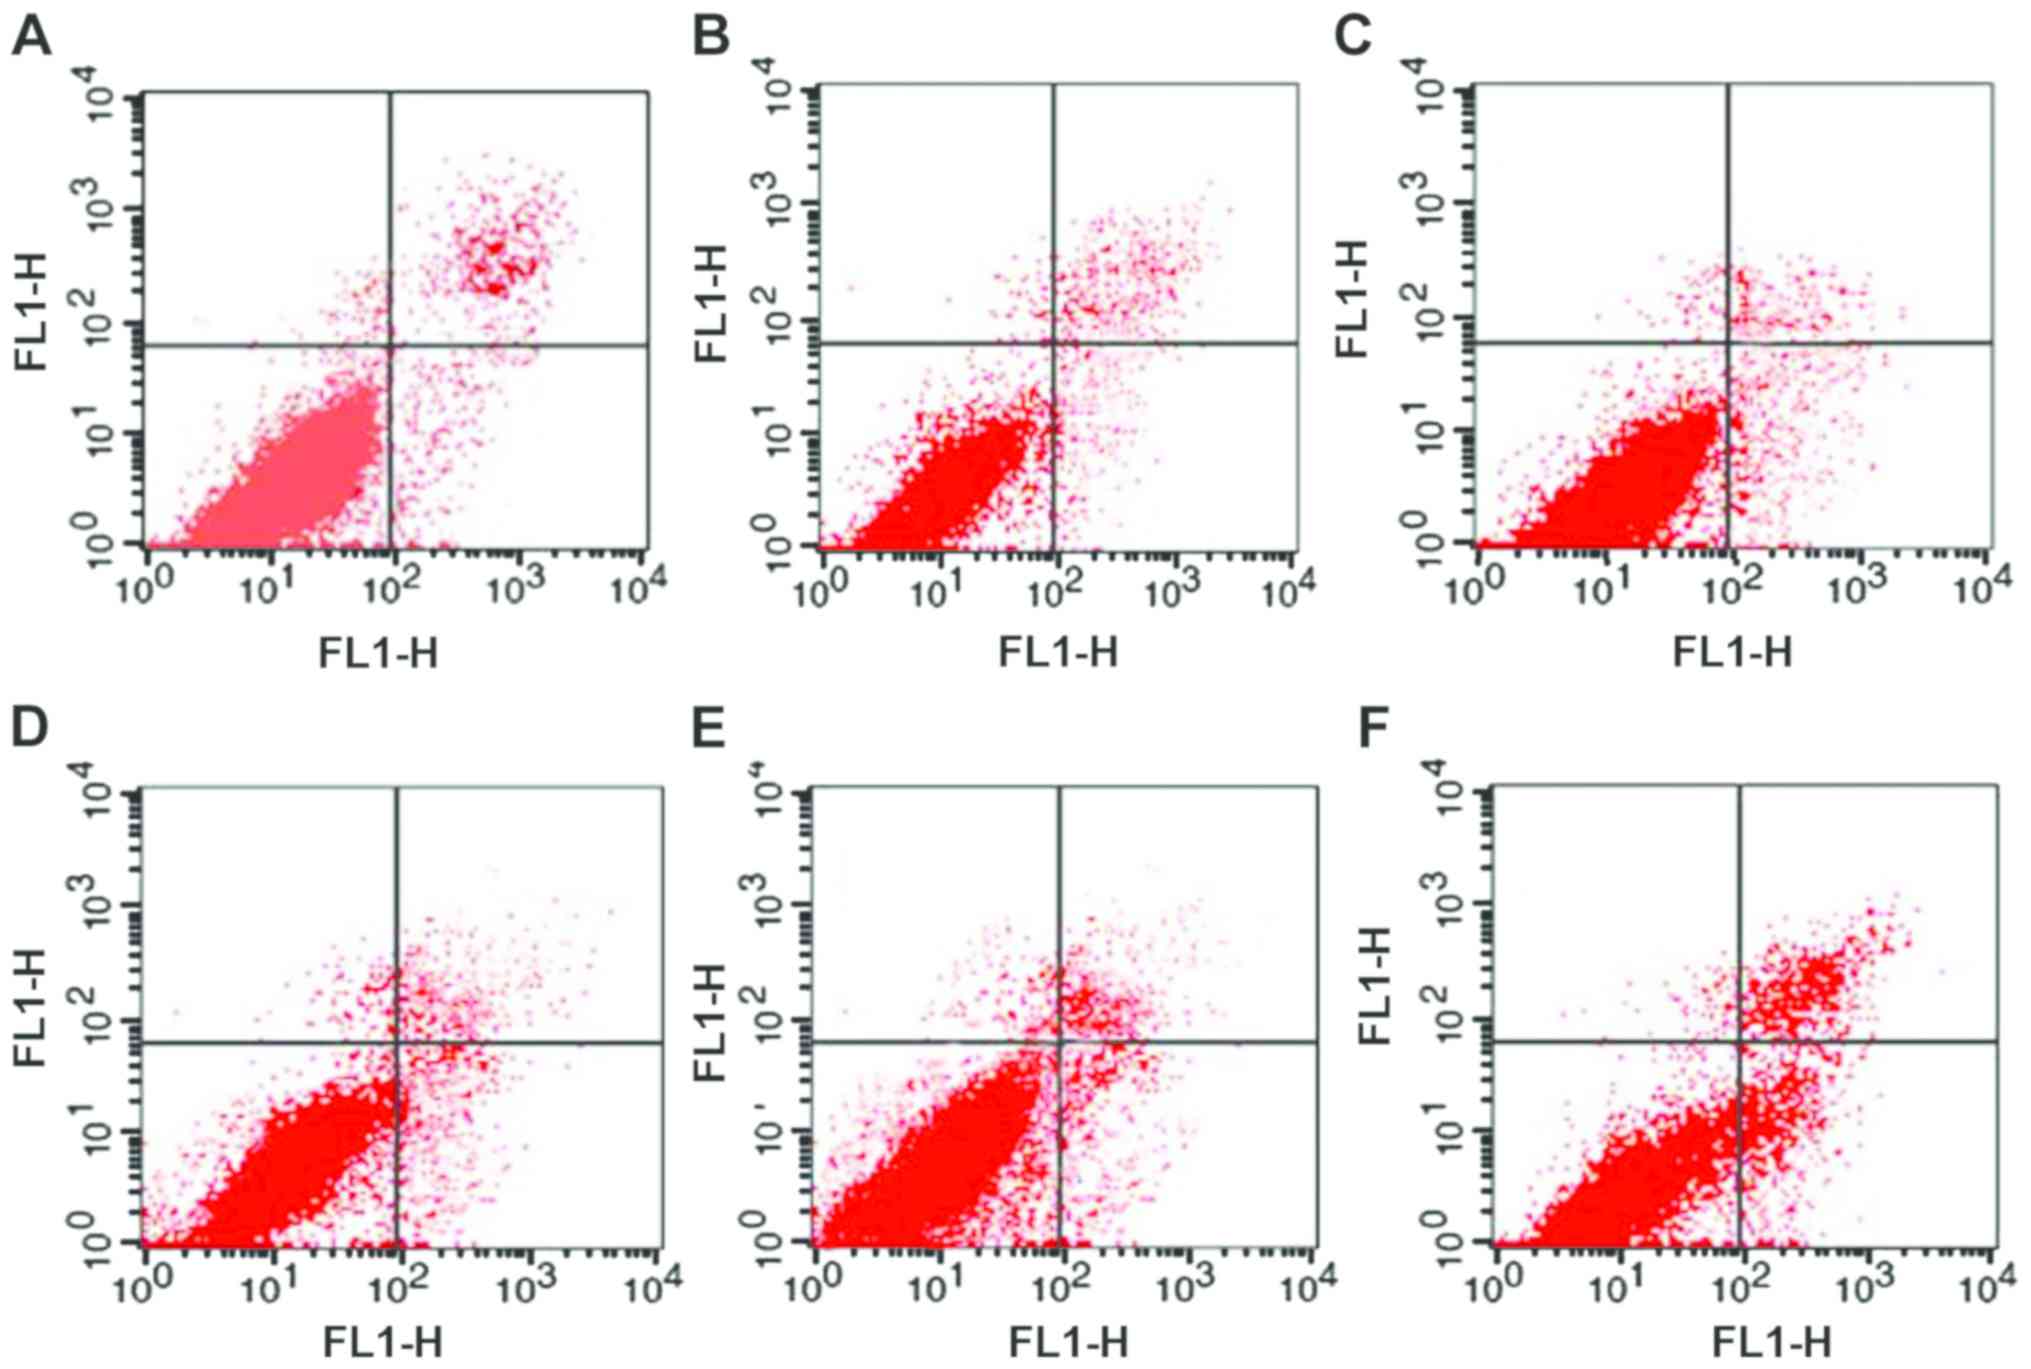
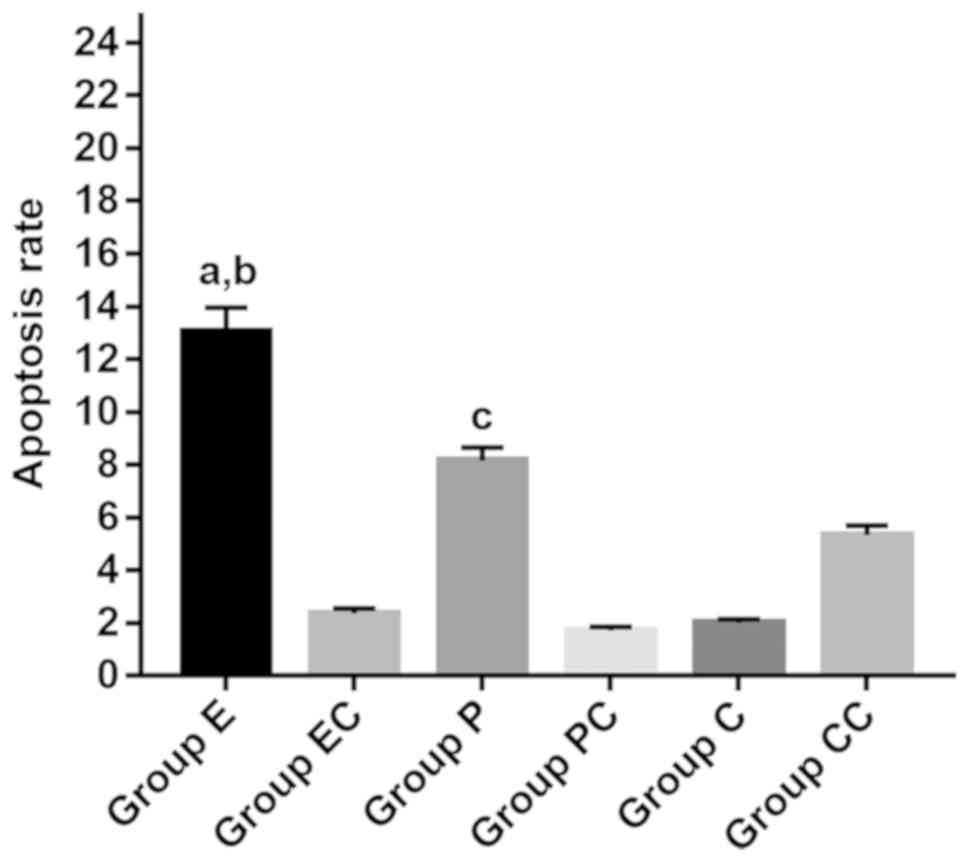
Flow cytometry analysis results
The flow cytometry results are presented in Fig. 3. The successful transfection of STAT3
decoy ODN promoted apoptosis in EC9706 cells. Furthermore, the
number of apoptotic cells increased by 10.70±2.64 and 6.44±3.03% in
the E and P groups, respectively, when compared with the
corresponding control groups. The apoptosis rate in group E
increased by 6.48±2.00%, when compared with group P. The apoptosis
rate in the CC group was only 5.34±1.28%. Furthermore, the
apoptosis rates in the EC, PC and C groups were 2.36±0.22,
1.71±0.13, and 2.00±0.97%, respectively. The variance analysis
revealed F=1.483, P=0.329. Furthermore, there was no statistical
difference among groups (Figs. 3 and
4).
Changes in cell proliferation activity
in each group over time
The MTT assay results revealed that the
proliferation activities of cells were inhibited to varying degrees
in groups E, P and CC, and the maximum inhibition rate was present
at 72 h after culture. Repeated variance analysis among groups
revealed that the inhibition rate was higher in group E than in
group P (F=8.382, P<0.001) and group CC (F=6.469, P<0.001).
Next, the inhibition rate of each group was compared under
different time-points. As shown in Table
II, compared with the corresponding control groups, the
value-added inhibitory rates of groups E, P and CC increased at 24,
48 and 72 h after transfection, and the difference was
statistically significant (P<0.05). Furthermore, group E had the
lowest value-added activity at the above time-points (P<0.05),
while the value-added inhibition rate of groups EC, PC and C
slightly fluctuated over time. The value changes were not obvious,
and the difference was not statistically significant (P>0.05)
(Table III).
| Table II.Comparison of cell inhibition rates in
each group at different time-points. |
Table II.
Comparison of cell inhibition rates in
each group at different time-points.
| Groups | 12 h | 24 h | 48 h | 72 h |
|---|
| Group E | 0.203±0.043 |
0.248±0.036a,b |
0.459±0.043a,b |
0.584±0.031a,b |
| Group EC | 0.177±0.025 | 0.182±0.055 | 0.173±0.036 | 0.156±0.030 |
| Group P | 0.194±0.031 |
0.225±0.027c |
0.348±0.027c |
0.432±0.041c |
| Group PC | 0.192±0.026 | 0.202±0.052 | 0.177±0.031 | 0.186±0.047 |
| Group C | 0.206±0.039 | 0.209±0.043 | 0.276±0.035 | 0.339±0.035 |
| Group CC | 0.195±0.024 | 0.198±0.020 | 0.202±0.027 | 0.184±0.050 |
| Table III.The difference in mean mass and tumor
inhibition rate of xenografts in nude mice. |
Table III.
The difference in mean mass and tumor
inhibition rate of xenografts in nude mice.
| Variables | Group E | Group EC | Group P | Group PC | Group C | Group CC |
F(χ2) | P-value |
|---|
| Tumor quality
(g) |
0.553±0.029a,b | 0.846±0.038 |
0.572±0.023c | 0.874±0.026 | 0.796±0.011 | 0.715±0.033 | 6.938 | <0.001 |
| Inhibition rate
(%) | 27 | 4.50 | 19 | 2.30 | 6.20 | 12 |
|
|
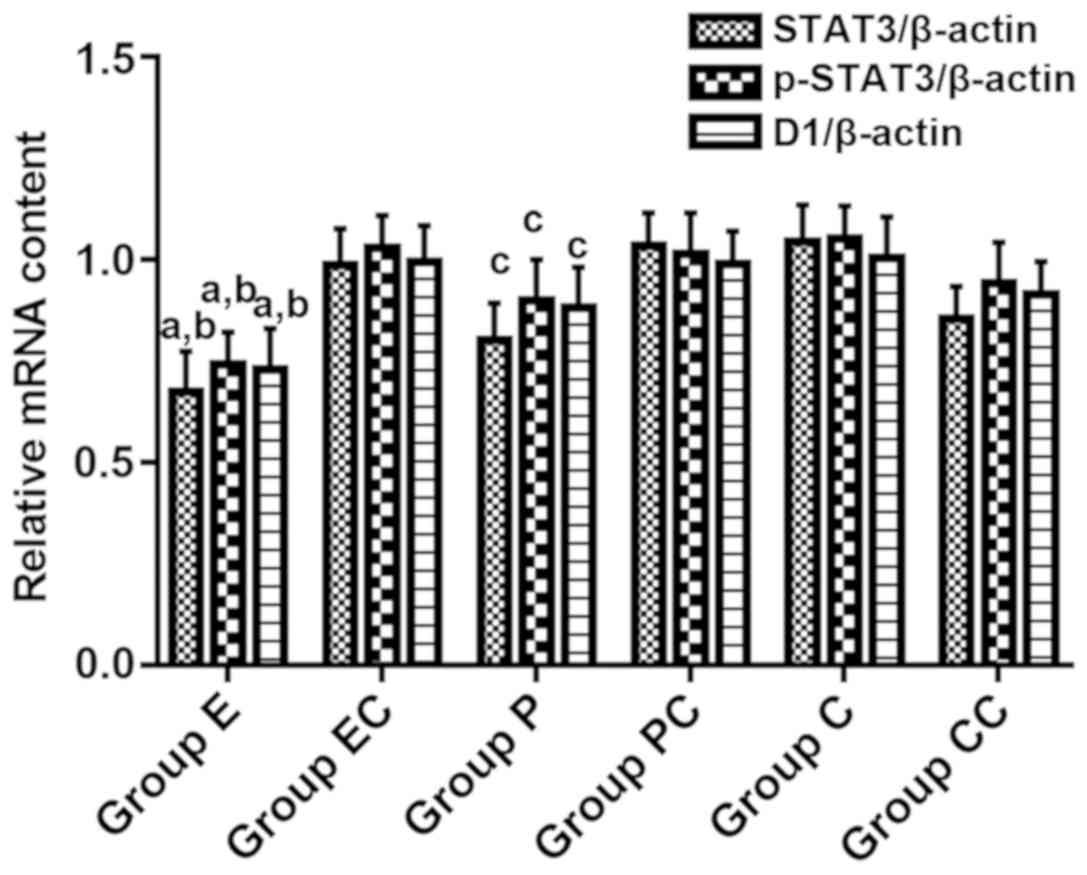
Detection of relative mRNA expression
in each group by RT-qPCR
The PCR results revealed that the relative content
of STAT3 mRNA in groups E, P and CC decreased after transfection
with STAT3 decoy ODN. At the same time, the mRNA levels of bcl-xL
and Cyclin D1 were also downregulated. The variance analysis
revealed that the difference was statistically significant
(F=5.328, P<0.001). Furthermore, the comparison between groups
revealed that the expression levels of the STAT3, Cyclin D1 and
bcl-xL gene products in group E were greater than those in group P,
and these relative expression levels decreased by 12.9, 14.6 and
11.3%, respectively, with significant differences (P<0.05). In
group E, STAT3 mRNA was downregulated by 17.1%, Cyclin D1 mRNA was
downregulated by 20.1%, and bcl-xL mRNA was downregulated by 15.4%,
when compared with group CC. The rest of the groups did not reveal
any significant changes (Fig. 5).
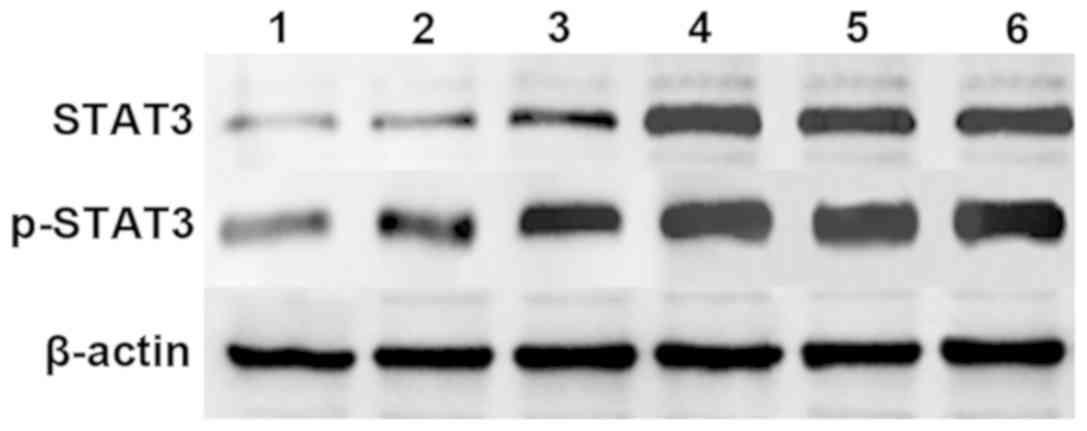
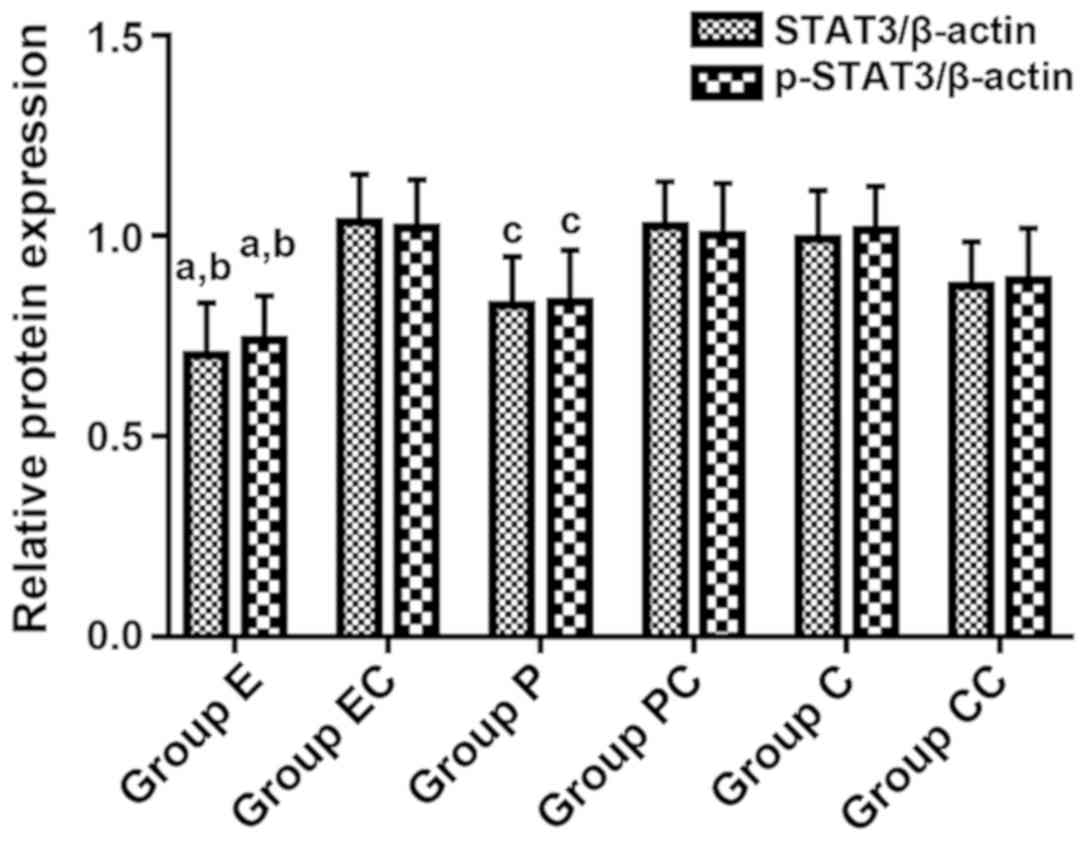
STAT3 and p-STAT3 protein content
assay in each group
Western blotting results revealed that after 72 h of
transfection, the contents of STAT3 and p-STAT3 proteins
significantly decreased in groups E, P and CC, when compared with
the other three groups. The ultrasound contrast agent, the
ultrasound contrast agent combined with ultrasound irradiation, and
liposome all significantly reduced the expression of STAT3 and
p-STAT3, and the difference was statistically significant (F=3.795,
P=0.032). Furthermore, the protein expression level was the lowest
in group E, followed by the P group, while the protein expression
levels in groups EC, PC and C were similar (P>0.05) (Figs. 6 and 7).
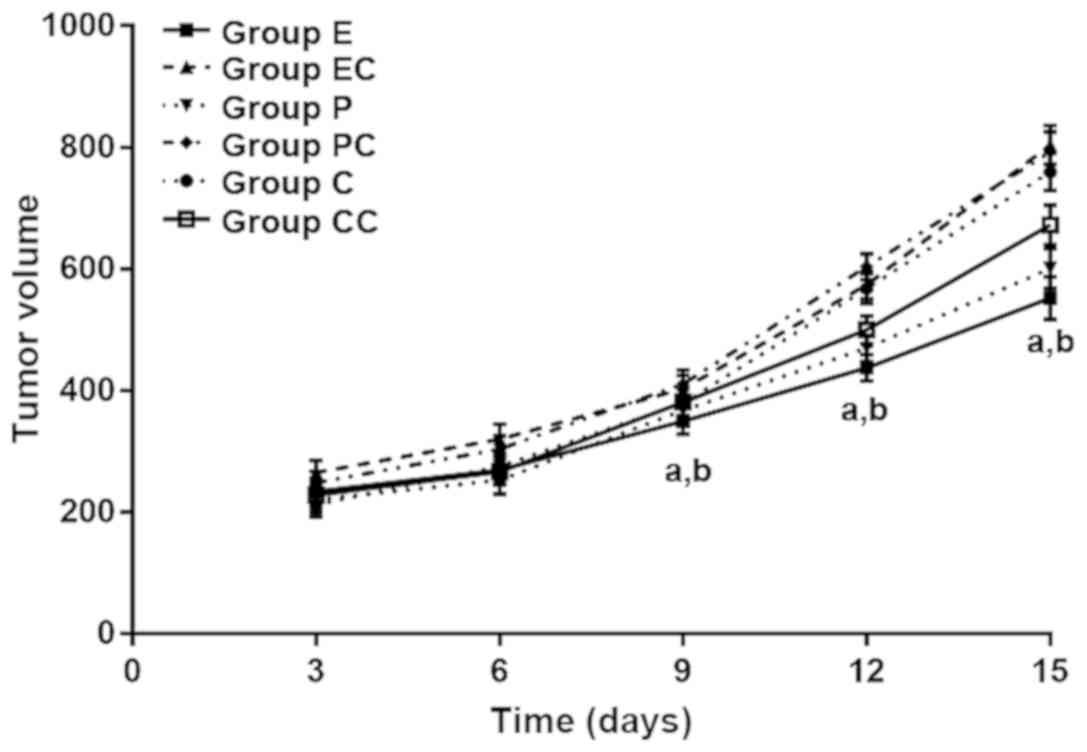
Effect of different transfection
methods on tumor growth activity in nude mice
The growth changes of the transplanted tumors in
each group of nude mice were observed after inoculating and
culturing with different transfection methods. From the overall
growth trend, the tumor volume of nude mice in groups EC, PC and C
grew rapidly, and the amplitude was large. Furthermore, the tumor
volume in nude mice in the corresponding control groups exhibited a
growing trend, but the growth was slow. The volume of tumor growth
in group E was the lowest, followed by group P. In addition, the
analysis of changes in tumor volume at the different time-points in
each group revealed that the transplanted tumors in each group
shared a similar volume on the 3rd day after inoculation, and the
difference was not statistically significant (P>0.05). However,
on the 9th day after inoculation, the volume of transplanted tumors
in each group of nude mice came to be significantly different, and
the volume in groups E, P and CC was significantly smaller than
that in the corresponding control groups (P<0.05). At 9th, 12th
and 15th day after inoculation, the tumor volume in group E was the
lowest, when compared with groups P and CC, and the difference was
statistically significant (P<0.05). After stripping the tumors
of each group, a statistically significant difference was shown in
the mass of these tumors (F=6.938, P<0.001). The tumors in group
E had the lowest mass and the highest inhibition rate (P<0.05).
The tumor masses in groups P and CC were smaller than that in the
rest of the groups, and the inhibition rate was significantly
increased (P<0.05) (Fig. 8).
Discussion
Multiple studies have indicated that the sustained
activation of STAT3 has a close relationship with the occurrence
and development of various tumors such as gastric, esophageal,
breast, and liver cancer (8).
Blocking the continuous activation of STAT3 has been considered to
be an effective treatment, and STAT3 decoy ODN is a continuously
mature blocking method that can weaken downstream biochemical
reactions by downregulating the hyperphosphorylation of
intracellular STAT3 protein to inhibit the proliferation activity
of tumor cells (9,10). Therefore, the competitive blocking
method of inhibiting tumor proliferation through the transfection
of STAT3 decoy ODN has been highly valued. Determining how to
safely and efficiently transfer STAT3 decoy ODN into cells has
become a new challenge. The commonly used gene transfection
carriers in the laboratory are mainly viral vectors and non-viral
vectors. However, the safety and immunogenicity of viral vectors
are difficult to guarantee. The liposomes and plasmids commonly
found in non-viral vectors are easily degraded. Hence, transfection
efficiency is not high, and the therapeutic effect is poor
(11,12). In recent years, ultrasound
microbubbles combined with ultrasound irradiation has been widely
used as a new transfection tool in basic research. Kodama et
al (13) demonstrated that it can
significantly improve transfection efficiency in vivo.
Furthermore, the study conducted by Masuda et al (14) also pointed out that the use of
ultrasound contrast agents has no toxic side effects on the human
body. Compared with viral vectors, this safety problem can be
solved. In addition, the ultrasonic instrument is convenient to
operate, and can accurately control the energy output index.
Furthermore, it can be used for different cells to match the
relatively accurate safety parameter range, which is better than
electroporation (physical method). Generally, it does not cause
damage to tissues (15). However, few
studies have been conducted on the effects on esophageal squamous
cell carcinoma cells, in which ultrasound microbubbles combined
with ultrasound irradiation transfected with STAT3 decoy ODN and
conventional carrier-liposomes were compared.
The present study compared several transfection
methods. The positive control group commonly used liposome combined
with ultrasound irradiation. In order to exclude the interference
from other factors such as ODN, mispaired ligands were used as
intragroup controls. From the results of the immunofluorescence
detection, liposomes, ultrasound microbubbles and ultrasound
microbubbles combined with ultrasound irradiation can successfully
transfect ODNs into cancer cells, indicating that liposomes and
ultrasound microbubbles are all effective transfer tools. Among
these, ultrasound microbubbles combined with ultrasound irradiation
had the highest transfection rate, and liposome combined ultrasound
irradiation had a lower transfection rate. Czarnota et al
(15) suggested that the rational use
of ultrasound irradiation can enhance the ability of cells to take
up carrier-gene complexes, while enhancing the ability of the
nucleus to take up genes. This may be one of the reasons for the
significant increase in ultrasound microbubble transfection
efficiency under ultrasound irradiation. The flow cytometry and MTT
assay analysis results revealed that the three groups of cancer
cells successfully transfected with STAT3 decoy ODN had an
increased rate of apoptosis at the early stages, and cell
proliferation activity gradually decreased, suggesting that the
antisense transfection was successful and STAT3 decoy ODN was
active. The STAT3 ODNs transfected into cells can downregulate the
expression and activation of STAT3 protein, resulting in the
subsequent expression of related genes that can promote apoptosis
of esophageal cancer cells and inhibit their proliferation
(16). Apoptosis in the E group was
the highest, but the proliferation activity was the lowest,
suggesting that ultrasonic microbubbles combined with ultrasound
irradiation is a more effective and safe method, compared with
traditional lipofection. However, further studies are needed.
P-STAT3 is formed by persistently activated STAT3,
and plays a role in upregulating the expression of bcl-xL and
Cyclin D1 after binding the target gene in the nucleus. The change
in STAT3 expression interferes with the process of cell
proliferation and differentiation, reduces apoptosis of tumor cells
and causes carcinogenesis (17). The
present study found that the expression levels of STAT3 and p-STAT3
protein in cancer cells transfected with STAT3 decoy ODN
significantly decreased. At the same time, bcl-xL and Cyclin D1
mRNA levels were also significantly downregulated. Therefore, STAT3
decoy ODN has an inhibitory effect on esophageal squamous carcinoma
cells grown in vitro. A study conducted by Liu et al
(17) demonstrated that antisense ODN
STAT3 can inhibit tumor cell activity, but does not have any
adverse effects on normal cells. Therefore, it can be used as an
effective tumor-targeting therapy, providing new ideas for human
antitumor therapy. The protein and mRNA expression in each group
was shown to be lower in the E group, and later in the positive
control P group. Therefore, it can be considered that ultrasound
microbubbles combined with ultrasound irradiation can reduce STAT3
phosphorylation to inhibit the expression of downstream
anti-apoptotic genes. Hence, it has value in the prevention and
treatment of esophageal squamous cell carcinoma. The nude mouse
model with transplanted tumor suggested that ultrasound
microbubbles combined with ultrasound irradiation transfected with
STAT3 decoy ODN had inhibitory effects on the growth of
transplanted tumors in nude mice, and its intensity of action was
higher than that of liposome-transfected STAT3 decoy ODN.
In conclusion, the present study confirms that
ultrasound irradiation combined with ultrasound microbubbles is an
effective transfection method. Transfection of STAT3 decoy ODN can
significantly inhibit the activity of esophageal squamous carcinoma
cells and enhance apoptosis. Hence, it has a potential clinical
therapeutic value.
Acknowledgements
Not applicable.
Funding
This study was supported by Medical Key Discipline
of Ningbo Oncology 2016-B05.
Availability of data and materials
The datasets used and/or analyzed during the present
study are available from the corresponding author on reasonable
request.
Authors' contributions
YZ, MZ, SL and PC contributed to the concept and
design of the study. XF and DM were responsible for the collection
and analysis of the data. SL and PC wrote and revised the
manuscript. All authors read and approved the final manuscript.
Ethics approval and consent to
participate
The study was approved by the Ethics Committee of
Ningbo No. 2 Hospital (Ningbo, China).
Patient consent for publication
Not applicable.
Competing interests
The authors declare that they have no competing
interests.
References
|
1
|
Ikeda G, Isaji S, Chandra B, Watanabe M
and Kawarada Y: Prognostic significance of biologic factors in
squamous cell carcinoma of the esophagus. Cancer. 86:1396–1405.
1999. View Article : Google Scholar : PubMed/NCBI
|
|
2
|
Dawsey SM, Fleischer DE, Wang GQ, Zhou B,
Kidwell JA, Lu N, Lewin KJ, Roth MJ, Tio TL and Taylor PR: Mucosal
iodine staining improves endoscopic visualization of squamous
dysplasia and squamous cell carcinoma of the esophagus in Linxian,
China. Cancer. 83:220–231. 1998. View Article : Google Scholar : PubMed/NCBI
|
|
3
|
Tanaka H, Kanda M, Koike M, Iwata N,
Shimizu D, Ezaka K, Sueoka S, Tanaka Y, Takami H, Hashimoto R, et
al: Adherens junctions associated protein 1 serves as a predictor
of recurrence of squamous cell carcinoma of the esophagus. Int J
Oncol. 47:1811–1818. 2015. View Article : Google Scholar : PubMed/NCBI
|
|
4
|
Hao JJ, Lin DC, Dinh HQ, Mayakonda A,
Jiang YY, Chang C, Jiang Y, Lu CC, Shi ZZ, Xu X, et al: Spatial
intratumoral heterogeneity and temporal clonal evolution in
esophageal squamous cell carcinoma. Nat Genet. 48:1500–1507. 2016.
View Article : Google Scholar : PubMed/NCBI
|
|
5
|
Zhang Y, Du XL, Wang CJ, Lin DC, Ruan X,
Feng YB, Huo YQ, Peng H, Cui JL, Zhang TT, et al: Reciprocal
activation between PLK1 and Stat3 contributes to survival and
proliferation of esophageal cancer cells. Gastroenterology.
142:521–530.e3. 2012. View Article : Google Scholar : PubMed/NCBI
|
|
6
|
Katsha A, Arras J, Soutto M, Belkhiri A
and El-Rifai W: AURKA regulates JAK2-STAT3 activity in human
gastric and esophageal cancers. Mol Oncol. 8:1419–1428. 2014.
View Article : Google Scholar : PubMed/NCBI
|
|
7
|
Livak KJ and Schmittgen TD: Analysis of
relative gene expressiondata using real-time quantitative PCR and
the 2(-Delta DeltaC(T)) Method. Methods. 25:402–8. 2001. View Article : Google Scholar : PubMed/NCBI
|
|
8
|
Yang Z, Guo L, Liu D, Sun L, Chen H, Deng
Q, Liu Y, Yu M, Ma Y, Guo N, et al: Acquisition of resistance to
trastuzumab in gastric cancer cells is associated with activation
of IL-6/STAT3/Jagged-1/Notch positive feedback loop. Oncotarget.
6:5072–5087. 2015.PubMed/NCBI
|
|
9
|
Kopechek JA, Carson AR, McTiernan CF, Chen
X, Hasjim B, Lavery L, Sen M, Grandis JR and Villanueva FS:
Ultrasound targeted microbubble destruction-mediated delivery of a
transcription factor decoy inhibits STAT3 signaling and tumor
growth. Theranostics. 5:1378–1387. 2015. View Article : Google Scholar : PubMed/NCBI
|
|
10
|
Shi K, Xue J, Fang Y, Bi H, Gao S, Yang D,
Lu A, Li Y, Chen Y and Ke L: Inorganic kernel-reconstituted
lipoprotein biomimetic nanovehicles enable efficient targeting
‘Trojan Horse’ delivery of STAT3-decoy oligonucleotide for
overcoming TRAIL resistance. Theranostics. 7:4480–4497. 2017.
View Article : Google Scholar : PubMed/NCBI
|
|
11
|
Burnham LA, Jaishankar D, Thompson JM,
Jones KS, Shukla D and Tiwari V: Liposome-mediated herpes simplex
virus uptake is glycoprotein-D receptor-independent but requires
heparan sulfate. Front Microbiol. 7:9732016. View Article : Google Scholar : PubMed/NCBI
|
|
12
|
Yamada Y, Hashida M and Harashima H:
Hyaluronic acid controls the uptake pathway and intracellular
trafficking of an octaarginine-modified gene vector in
CD44-positive and CD44- negative cells. Biomaterials. 52:189–198.
2015. View Article : Google Scholar : PubMed/NCBI
|
|
13
|
Kodama T, Aoi A, Watanabe Y, Horie S,
Kodama M, Li L, Chen R, Teramoto N, Morikawa H, Mori S, et al:
Evaluation of transfection efficiency in skeletal muscle using
nano/microbubbles and ultrasound. Ultrasound Med Biol.
36:1196–1205. 2010. View Article : Google Scholar : PubMed/NCBI
|
|
14
|
Masuda N, Maruyama A, Eguchi T, Hirakawa T
and Murakami Y: Influence of microbubbles on free radical
generation by ultrasound in aqueous solution: Dependence of
ultrasound frequency. J Phys Chem B. 119:12887–12893. 2015.
View Article : Google Scholar : PubMed/NCBI
|
|
15
|
Czarnota GJ: Ultrasound-stimulated
microbubble enhancement of radiation response. Biol Chem.
396:645–657. 2015. View Article : Google Scholar : PubMed/NCBI
|
|
16
|
Xuan X, Li S, Lou X, Zheng X, Li Y, Wang
F, Gao Y, Zhang H, He H and Zeng Q: Stat3 promotes invasion of
esophageal squamous cell carcinoma through up-regulation of MMP2.
Mol Biol Rep. 42:907–915. 2015. View Article : Google Scholar : PubMed/NCBI
|
|
17
|
Liu R, Liao J, Yang M, Sheng J, Yang H,
Wang Y, Pan E, Guo W, Pu Y, Kim SJ, et al: The cluster of miR-143
and miR-145 affects the risk for esophageal squamous cell carcinoma
through. PLoS One. 7:e339872012. View Article : Google Scholar : PubMed/NCBI
|