Introduction
Colorectal cancer (CRC) is third most commonly
diagnosed type of cancer affecting males, following lung and
prostate cancer, and the second one affecting females, following
breast cancer (1). In fact, CRC is a
polygenic disease, which arises both from epigenetic, as well as
genetic alterations in a variety of oncogenes, tumor suppressor
genes, mismatch repair genes and cell cycle regulating genes in
colon mucosal cells (2). Due to late
diagnosis, approximately a quarter (20–25%) of CRC cases at the
time of diagnosis present distant metastases, and another quarter
of patients with early resectable CRC will eventually develop
metastatic disease, most often in the liver.
It has been described that different pathways lead
to carcinogenesis in the colonic epithelium; however, the majors
ones are the following: Chromosomal instability (CIN),
microsatellite instability (MSI) and the CpG island methylation
phenotype (CIMP) (3). All these
pathways attribute to the transformation of an adenoma to
carcinoma, a multistep carcinogenic process known as the
adenoma-carcinoma sequence (4), which
is considered to be a common process in all CRCs (5). As CRC is an heterogeneous disease, it
exhibits various clinical manifestations, biological behavior and
an in-tumor variety of mutations (6),
making it a true challenge for the clinician. Despite the fact that
left-sided colon cancer (LCC) accounts for the majority of CRC
cases, the number of cases with right-sided colon cancer (RCCs) is
constantly rising (7). The female
sex, age, a previous history of cancer and insulin resistance are
some of the risk factors that have been associated with RCC, while
a low-fiber diet, smoking and alcoholism have been associated with
LCC (8,9). Moreover, LCC is commonly associated with
metastasis to the liver and lungs, while RCC tends to be more
differentiated and is associated with metastasis to the regional
lymph nodes and the peritoneal cavity (10). In fact, it is estimated that
approximately 22% of patients with CRC present with stage IV
metastatic CRC (mCRC) at the time of diagnosis, indicating that, if
treated, the expected 5-year-survival rate is only 13% (11). In this setting, chemotherapy is mainly
used as a palliative measure in order to improve the quality of
life and achieve the optimum survival. However, not all patients
with stage IV disease exhibit the same response to treatment, even
if the underlying genetic status is the same (12). This is the cornerstone of the research
for prognostic and predictive biomarkers; the in-group
difference.
Micronuclei (MN), or Howell-Jolly bodies, are small
intracellular particles enwrapped in a nuclear envelope. They are
formed as a result of acentric chromatid/chromosome fragments
(mainly due to extensive DNA damage) or whole
chromatids/chromosomes (mainly due to mitotic spindle failure,
kinetochore damage, centromeric DNA hypomethylation and defects in
the cell cycle control system) that during the anaphase of dividing
cells do not follow the rest of the chromosomes and are not
included in the nucleus during telophase. Instead, enwrapped by the
nuclear membrane, they form daughter nuclei-like structures that
are just a fraction of the size of the mother nucleus (13,14).
Numerous studies have evaluated the use of MN frequency (MNf) in
different cell types and lines in order to determine whether it can
be used as an effective biomarker for various types of cancer
(including lung, bladder and colorectal cancer) (15–17).
Almost all of these studies agree that MNf is a sensitive indicator
of cancer since, compared to healthy controls, there is a
significant increase in MN formation regardless of the type of
cancer. However, for patient's convenience, peripheral blood
lymphocytes (PBLs) are preferably used. What is more, those who
evaluated MNf in CRC did prove an increased MNf (thus indicating
its possible use as a diagnostic biomarker), but did not evaluate
their patients in the long-term and did not include cases with
metastatic disease. Hence, the importance of MNf as a prognostic
and/or predictive biomarker in mCRC has not yet been investigated
in detail, at least to the best of our knowledge. The only
published attempt to illuminate the prognostic properties of MNf,
to the best of our knowledge, comes from a team which evaluated MNf
in urothelial cells of patients with bladder cancer (18,19).
Thus, under this scope, the present study aimed to
assess the efficiency of MNf as a biomarker for the prognosis and
disease/treatment prediction of patients with mCRC.
Patients and methods
Patients and study protocol
The protocol of this study was approved by the
Ethics Committee for Patients and Biological Material of the
University Hospital of Heraklion (Heraklion, Greece). During the
period between December, 2016 and February, 2018, 27 patients
referred to the Department of Medical Oncology of the University
Hospital of Heraklion were enrolled in this study. All patients
signed a written consent. The inclusion criteria were as follows:
i) Patients with mCRC treated with 1st line systemic treatment
according to the Hellenic Society of Medical Oncologists (HeSMO)
guidelines (20); and ii) an age
between 50–75 years. The exclusion criteria were as follows: i)
Failure to complete the therapeutic regimen for any reason
(toxicity, refusal of the patient, or death); and ii) the refuse of
the patient to attend the study. Based on the chemotherapeutic
protocol that was selected [folinic acid with5-fluorouracil and
oxaliplatin (FOLFOX) or folinic acid with5-fluorouracil and
irinotecan (FOLFIRI) with or without a biological factor], patients
were further divided into subgroups. Another division of the
patients was made based on their body mass index (BMI) before
treatment (BMI <25, BMI ≥25 but ≤30, and BMI >30). The RECIST
criteria version 1.1 were used for the evaluation of the treatment
response (21). According to these
criteria, patients were evaluated at the end of the therapy and
were divided into 3 subgroups as follows: Good response, stable
disease and no response. Peripheral blood samples were collected at
fixed time-points, namely before the beginning of the therapy, 3
months after the initiation of treatment and at the end of
treatment (at 0, 3 and 6 months of treatment, respectively) for the
evaluation for MNf using the cytokinesis block micronucleus assay
(CBMN assay). By June, 2018, 25 out of the 27 patients had
completed the study. One patient presented with increased toxicity
and terminated the therapy and the other one died due to a heart
failure as a result of a lower respiratory tract infection.
Finally, 10 healthy individuals (5 male and 5 female) were
recruited from the Health Center of Agia Varvara, Heraklion, Crete,
after receiving a thorough explanation about the study, how their
samples would be handled and signing a written consent. The
inclusion criteria were an age between 55 and 70 years and a
personal history free of cancer, autoimmune diseases and COPD.
Exclusion criteria were the presence of the above-mentioned
diseases, direct exposure at any time to pesticides and/or
herbicides and the lack of will of the participant.
MN test
The MN test is an official regulatory ‘tool’ in the
European Legislation (B.12, Regulation 440/2008/EC) validated by
OECD (22). Whole blood (0.5 ml) was
added to 6.5 ml Ham's F-10 medium (Gibco/Thermo Fisher Scientific,
Waltham, MA USA), 1.5 ml fetal bovine serum (Standard Fetal Bovine
Serum, certified, US origin, Gibco/Thermo Fisher Scientific), and
0.3 ml phytohemagglutinin Μ (PHA-M; 10 ml, Thermo Fisher
Scientific). Cultures were incubated at 37°C for a period of 72 h.
Six micrograms per milliliter of cytochalasin-B (white to off-white
powder, ≥98% 5 mg; Acros Organics, Inc./Thermo Fisher Scientific)
was added 44 h following culture initiation. Peripheral blood
lymphocytes (PBLs) were collected by centrifugation at 400 × g
(1,500 rpm) at 20°C for 25 min at 72 h post-incubation. A mild
hypotonic solution of Ham's F-10 medium and milli-Q water (1:1,
v/v) was added to the cell solution and left for 3 min at room
temperature. The cells were fixed with a methanol:acetic acid
solution (5:1, v/v) placed on microscope slides and stained with
Giemsa (Gibco/Thermo Fisher Scientific) 15% at 25°C for 30 min, as
previously described (23,24). The slides were then placed under a
Nikon Eclipse E200 microscope (Nikon Holdings Europe B.V.,
Amsterdam, The Netherlands) where the binucleated cells (BN cells)
and MN were viewed. One thousand BN cells with an intact cytoplasm
were scored per slide for each sample, in order to calculate the
MNf. Standard criteria were used for scoring the MN (25). The cytokinesis block proliferation
index (CBPI) is given by the following equation:
CBPI=M1+2M2+3(M3+M4)N
where M1, M2, M3 and M4 correspond to the number of
cells with 1, 2, 3, and 4 nuclei and ‘N’ is the total number of
cells. These parameters were calculated by counting 2,000 cells, in
order to determine the possible cytotoxic effects, as previously
described (26).
Statistical analysis
Statistical analysis of the MN data was performed
with the G-test for independence on 2×2 tables. The Chi-squared
test was used for the analysis of the CBPI data. The level of
significance was set at 0.05. One-way ANOVA was applied to estimate
differences between 3 groups. Mean plots with error bars and bar
charts were used for the graphical presentation of the data. The
IBM SPSS Statistics Package 21.0 was used for data analysis and for
the graphic representation of the data. The level of acceptance of
null hypotheses was set at the 0.05 level.
Results
The patient characteristics are shown in Table I, while the type of chemotherapy, the
biological factor and the BMI of each patient are presented in
Table II. Out of the 25 patients, 12
were treated with FOLFIRI and 13 with FOLFOX, while 18 of them were
additionally treated with a biological agent (cetuximab,
aflibercept, bevacizumab or panitumumab). The mean BMI was 28.07
(ranging from 18.36 to 41.59).
 | Table I.Patient characteristics (age, sex,
ECOG performance status, location of the primary tumor, number of
metastatic sites, BRAFV600E status, KRAS exon 2 status, NRAS
status, MMR status). |
Table I.
Patient characteristics (age, sex,
ECOG performance status, location of the primary tumor, number of
metastatic sites, BRAFV600E status, KRAS exon 2 status, NRAS
status, MMR status).
| Characteristic | Ν=25 | % |
|---|
| Median/mean age
(range), years | 67/66.04
(50–75) |
|
| Sex |
|
Male | 12 | 48 |
|
Female | 13 | 52 |
| Performance status
(ECOG) |
| 0 | 22 | 88 |
| 1 | 3 | 12 |
| Location |
|
Right-sided | 6 | 24 |
|
Left-sided | 19 | 76 |
| Median/mean number
of metastatic sites (range) |
|
Liver | 3.5/4.8 (0–20) |
|
|
Lung | 3/3.4 (0–10) |
|
| Lymph
nodes | 0/2.33 (0–13) |
|
|
Peritoneum | 0/1.33 (0–7) |
|
|
BRASV600E status |
| WT | 13 | 52 |
|
Mutant | 2 | 10 |
|
Unknown | 10 | 40 |
| KRAS exon 2
mutation |
| WT | 13 | 52 |
|
Mutant | 10 | 40 |
|
Unknown | 2 | 8 |
| NRAS
mutation |
| WT | 11 | 44 |
|
Mutant | 2 | 8 |
|
Unknown | 12 | 48 |
| MMR status |
|
Proficient | 9 | 36 |
|
Deficient | 2 | 8 |
|
Unknown | 14 | 56 |
| Table II.Patient data regarding the
therapeutic protocol, biological agent and BMI. |
Table II.
Patient data regarding the
therapeutic protocol, biological agent and BMI.
| Patient no. | Chemotherapy | Biologic
factor | BMI |
|---|
| 1 | FOLFIRI | No | 34.7 |
| 2 | FOLFOX | Cetuximab | 25.76 |
| 3 | FOLFIRI | Bevacizumab | 20.68 |
| 4 | FOLFIRI | Bevacizumab | 29.17 |
| 5 | FOLFIRI | No | 32.46 |
| 6 | FOLFOX | Cetuximab | 32.46 |
| 7 | FOLFIRI | No | 20.44 |
| 8 | FOLFIRI | Aflibercept | 25.24 |
| 9 | FOLFIRI | Aflibercept | 36.48 |
| 10 | FOLFIRI | Aflibercept | 37.63 |
| 11 | FOLFOX | Aflibercept | 41.59 |
| 12 | FOLFOX | Cetuximab | 25.71 |
| 13 | FOLFIRI | Cetuximab | 31.16 |
| 14 | FOLFOX | Bevacizumab | 26.21 |
| 15 | FOLFOX | No | 32.0 |
| 16 | FOLFIRI | Aflibercept | 30.77 |
| 17 | FOLFIRI | Cetuximab | 24.14 |
| 18 | FOLFIRI | Bevacizumab | 21.87 |
| 19 | FOLFOX | No | 24.03 |
| 20 | FOLFOX | Bevacizumab | 25.83 |
| 21 | FOLFOX | Bevacizumab | 32.71 |
| 22 | FOLFOX | No | 26.44 |
| 23 | FOLFOX | No | 25.53 |
| 24 | FOLFOX | Panitumumab | 18.36 |
| 25 | FOLFOX | Panitumumab | 18.75 |
In the control group (10 individuals), the mean
values of binucleated cells with micronuclei (BNMN), and MN and
CBPI values were 6.91±1.14, 7.91±1.14 and 1.34±0.04 respectively.
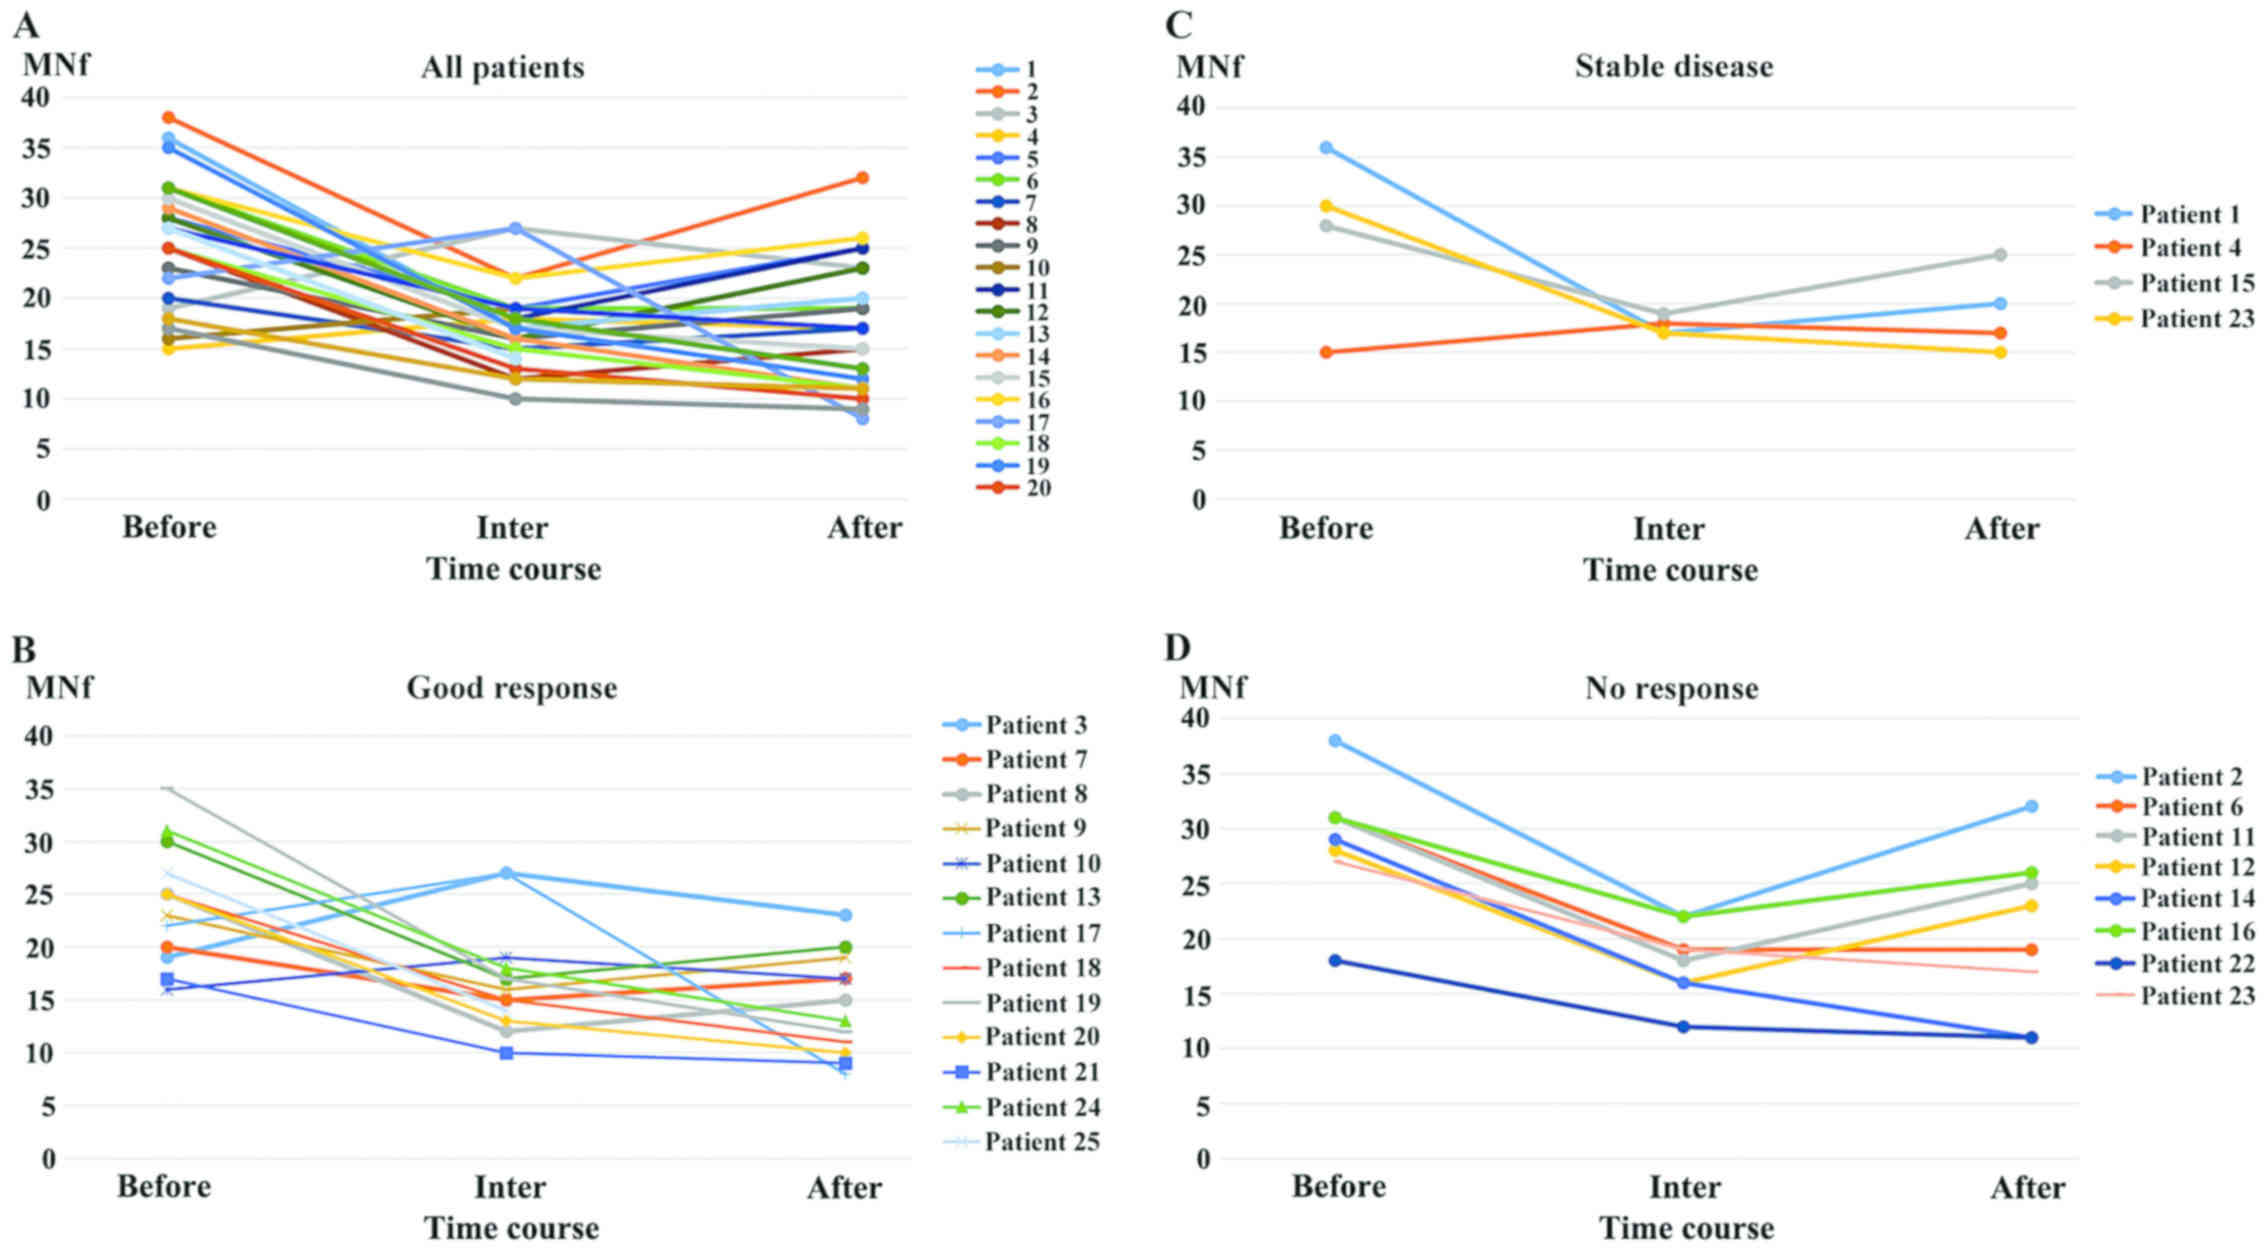
Fig. 1 illustrates the MNf trends of
each patient when interpreted as one group (Fig. 1A), as a good response group (Fig. 1B), as a stable disease group (Fig. 1C) and as a no response group (Fig. 1D) across their treatment (at the
beginning, middle and end). Fig. 1A
exhibits a mixed ‘v’ and ‘Λ’ trend, Fig.
1Ba shallow ‘v’ trend, Fig. 1C a
very shallow ‘v’ trend, and Fig. 1Da
deep ‘v’ trend.
Data regarding the mean values of BNMN, MN and CBPI
and the related P-values when patients were treated as a solid
group are presented in Table III.
Table IIIA shows the data from the
comparison of all the patient mean MNf, BNMN and CBPI values to
those of the controls. For all time-points (before, middle and
after treatment) the patient mean BNMN and MNf values [BNMN:
Before, 23.84±5.58 (P<0.001); middle, 15.56±3.54 (P=0.004); and
after, 15.21±5.53 (P=0.006); MNf: Before, 26.28±6.30 (P<0.001);
middle, 17.40±4.08 (P=0.003); and after, 17.29±6.19 (P=0.004)] were
significantly higher compared to those of the controls. However, no
significant differences were observed for CBPI (before, 1.30±0.05;
middle, 1.32±0.06; and after, 1.31±0.02).
| Table III.Statistical analysis of MN assay in
cultures of peripheral blood lymphocytes showing BN scored, mean
frequency of BNMN, mean frequency of MN and CBPI, for the mean
BNMN, MNf and CBPI values. |
Table III.
Statistical analysis of MN assay in
cultures of peripheral blood lymphocytes showing BN scored, mean
frequency of BNMN, mean frequency of MN and CBPI, for the mean
BNMN, MNf and CBPI values.
| A, all vs.
controls |
|---|
|
|---|
| Group | BN cells
scored | BNMN (means ±
SE) | G | P-value | MNf (means ±
SE) | G | P-value | CBPI (means ±
SE) |
|---|
| Control | 10,000 | 6.91±1.14 |
|
| 7.91±1.14 |
|
| 1.34±0.04 |
| Before | 25,000 | 23.84±5.58 | 25.47 |
<0.001 | 26.28±6.30 | 26.71 |
<0.001 | 1.30±0.05 |
| Middle | 25,000 | 15.56±3.54 | 8.03 |
0.004 | 17.40±4.08 | 8.54 |
0.003 | 1.32±0.06 |
| After | 25,000 | 15.21±5.53 | 7.47 |
0.006 | 17.29±6.19 | 8.37 |
0.004 | 1.31±0.02 |
|
| B, BMI 25–30 vs.
<25 and >30 vs. <25 |
|
| Group | BN cells
scored | BNMN (means ±
SE) | G | P-value | MNf (means ±
SE) | G | P-value | CBPI (means ±
SE) |
|
| ΒΜI <25 | 7,000 | 24.00±5.69 |
|
| 25.57±5.88 |
|
| 1.29±0.05 |
| ΒΜI 25–30 | 8,000 | 23.88±6.79 | 0.006 | 0.98 | 26.13±7.26 | 0.012 | 0.91 | 1.31±0.05 |
| ΒΜI >30 | 10,000 | 23.70±5.06 | 0.004 | 0.95 | 26.50±7.97 | 0.03 | 0.85 | 1.32±0.06 |
|
| C, middle vs.
before and after vs. before therapy |
|
| Group | BN cells
scored | BNMN (means ±
SE) | G | P-value | MNf (means ±
SE) | G | P-value | CBPI (means ±
SE) |
|
| Before | 25,000 | 23.84±5.58 |
|
| 26.28±6.30 |
|
| 1.30±0.05 |
| Middle | 25,000 | 15.56±3.54 | 3.85 | 0.05 | 17.40±4.08 | 3.99 | 0.04 | 1.32±0.06 |
| After | 25,000 | 15.21±5.53 | 4.24 | 0.04 | 17.29±6.19 | 4.11 | 0.04 | 1.31±0.02 |
Table IIIB shows the
results from the comparison between patients with BMI <25 (7
patients) and BMI ≥25 but ≤30 (8 patients) before therapy. The mean
BNMN and MNf values were as follows: (BNMN: BMI <25, 24.00±5.69;
BMI ≥25 but ≤30, 23.88±6.79; MNf: BMI <25, 25.57±5.88; BMI ≥25
but ≤30, 26.13±7.26) and did not exhibit any significant
differences (BMI 25–30 vs. BMI <25; P=0.98 and P=0.91,
respectively). Furthermore, the results from the comparison between
patients with BMI <25 and BMI >30 (10 patients) before
therapy (BNMN: BMI <25, 24.00±5.69; and BMI >30, 23.70±5.06;
MNf: BMI <25, 25.57±5.88; and BMI >30, 26.50±7.97) also did
not exhibit any significant difference (P=0.95 and P=0.85,
respectively). The mean CBPI was almost the same for all the BMI
groups (BMI <25, 1.29±0.05; BMI ≤25 but ≤30, 1.31±0.05; and BMI
>30, 1.32±0.06).
Table IIIC shows the
results when all the patient mean BNMN, MNf and CBPI values at the
middle (BNMN, 15.56±3.54; MNf, 17.40±4.08; CBPI, 1.32±0.06) and at
the end (after) (BNMN, 15.21±5.53; MNf, 17.29±6.19; CBPI,
1.31±0.02) were compared to those before treatment (BNMN,
23.84±5.58; MNf, 26.28±6.30; CBPI, 1.30±0.05). The comparison of
the mean BNMN, MNf and CBPI values at the middle against those at
the beginning of treatment revealed that the mean BNMN values were
not significantly lower (P=0.05), while the mean MNf values were
(P=0.04). The comparison of the mean BNMN, MNf and CBPI values at
the end against those at the beginning of treatment revealed that
both the mean BNMN and MNf values were significantly lower (P=0.04
and P=0.04, respectively). The CBPI values were again almost the
same for both time-points.
Data regarding the mean values of BNMN and MN and
the related P-values when patients were divided into subgroups are
presented in Table IV. Table IVA shows the results from the
comparison of the samples before treatment from the patients with a
good response (13 patients) against those who were stable (4
patients) and those with no response (8 patients). The mean BNMN
values before treatment for the good, stable and no response groups
were 22.31±5.28, 23.00±6.38 and 26.75±5.20, respectively. The
comparison between the groups did not reveal any significant
differences (good vs. stable, P=0.88; and good vs. no response,
P=0.36). The mean MNf values before treatment for the good, stable
and no response group were 24.23±5.60, 27.25±8.85 and 29.13±5.59,
respectively. The comparison between the groups did not reveal any
significant differences (good vs. stable, P=0.54; and good vs. no
response, P=0.33).
| Table IV.Statistical analysis of the mean BNMN
and MNf at different time-points. |
Table IV.
Statistical analysis of the mean BNMN
and MNf at different time-points.
| A, before therapy:
Stable vs. good and no response (No res vs. good). |
|---|
|
|---|
| Group | BN cells
scored | BNMN (means ±
SE) | G | P-value | MNf (means ±
SE) | G | P-value |
|---|
| Good | 13,000 | 22.31±5.28 |
|
| 24.23±5.60 |
|
|
| Stable |
4,000 | 23.00±6.38 | 0.02 | 0.88 | 27.25±8.85 | 0.37 | 0.54 |
| No res |
8,000 | 26.75±5.20 | 0.85 | 0.36 | 29.13±5.59 | 0.95 | 0.33 |
|
| B, at the middle
of treatment: Stable vs. good and No res vs. good. |
|
| Group | BN cells
scored | BNMN (means ±
SE) | G | P-value | MNf (means ±
SE) | G | P-value |
|
| Good | 13,000 | 15.23±4.53 |
|
| 16.92±5.11 |
|
|
| Stable |
4,000 | 15.75±0.96 | 0.02 | 0.89 | 17.75±0.96 | 0.04 | 0.84 |
| No res |
8,000 | 16.00±2.62 | 0.04 | 0.84 | 18.00±3.34 | 0.07 | 0.79 |
|
| C, after
therapy: Stable vs. good and No res vs. good. |
|
| Group | BN cells
scored | BNMN (means ±
SE) | G | P-value | MNf (means ±
SE) | G | P-value |
|
| Good | 13,000 | 12.67±4.21 |
|
| 14.50±4.76 |
|
|
| Stable |
4,000 | 17.00±3.74 | 1.35 | 0.24 | 19.25±4.34 | 0.15 | 0.70 |
| No res |
8,000 | 18.57±7.04 | 2.43 | 0.12 | 21.00±7.85 | 2.60 | 0.11 |
|
| D, good
response: Middle vs. before and after vs. before. |
|
| Group | BN cells
scored | BNMN (means ±
SE) | G | P-value | MNf (means ±
SE) | G | P-value |
|
| Before | 13,000 | 22.31±5.28 |
|
| 24.23±5.60 |
|
|
| Middle | 13,000 | 15.23±4.53 | 2.93 | 0.09 | 16.92±5.11 | 2.84 | 0.09 |
| After | 13,000 | 12.67±4.21 | 6.06 | 0.01 | 14.50±4.76 | 5.52 | 0.02 |
|
| E, stable
response: middle vs. before and after vs. before. |
|
| Group | BN cells
scored | BNMN (means ±
SE) | G | P-value | MNf (means ±
SE) | G | P-value |
|
| Before |
4,000 | 23.00±6.38 |
|
| 27.25±8.85 |
|
|
| Middle |
4,000 | 15.75±0.96 | 2.97 | 0.08 | 17.75±0.96 | 4.45 | 0.03 |
| After |
4,000 | 17.00±3.74 | 1.94 | 0.16 | 19.25±4.34 | 3.01 | 0.08 |
|
| F, no response:
middle vs. before and after vs. before. |
|
| Group | BN cells
scored | BNMN (means ±
SE) | G | P-value | MNf (means ±
SE) | G | P-value |
|
| Before |
8,000 | 26.75±5.20 |
|
| 29.13±5.59 |
|
|
| Middle |
8,000 | 16.00±2.62 | 6.11 | 0.01 | 18.00±3.34 | 5.91 | 0.02 |
| After |
8,000 | 18.57±7.04 | 3.24 | 0.07 | 21.00±7.85 | 2.87 | 0.09 |
Table IVB shows the
results from the comparison of the samples at the middle of
treatment from the patients with a good response against those
which were stable and those with no response. The mean BNMN values
for the good, stable and no response groups at the middle of
therapy were 15.23±4.53, 15.75±0.96 and 16.00±2.62, respectively.
The comparison between the groups did not reveal any significant
differences (good vs. stable, P=0.89; and good vs. no response,
P=0.84). The mean MNf before treatment for the good, stable and no
response group were 16.92±5.11, 17.75±0.96 and 18.00±3.34,
respectively. The comparison between the groups did not reveal any
significant differences (good vs. stable, P=0.84; and good vs. no
response, P=0.79).
Table IVC shows the
results from the comparison of the samples at the end of the
treatment from the patients with a good response against those with
a stable response and those with no response. The mean end BNMN
values for the good, stable and no response group were 12.67±4.21,
17.00±3.74 and 18.57±7.04, respectively. The comparison between the
groups did not reveal any significant differences (good vs. stable,
P=0.24; and good vs. no response, P=0.12). The mean MNf values
before treatment for the good, stable and no response group were
14.50±4.76, 19.25±4.34 and 21.00±7.85, respectively. The comparison
between the groups did not reveal any significant differences (good
vs. stable, P=0.70; and good vs. no response, P=0.11).
Table IVD shows the
results from the comparison of the mean BNMN and MNf values from
the good response group before therapy against those at the middle
and after therapy. The mean BNMN values before, middle and after
therapy were 22.31±5.28, 15.23±4.53 and 12.67±4.21, respectively.
The mean MNf values for the same time-points were 24.23±5.60,
16.92±5.11 and 14.50±4.76, respectively. The comparison between
time-points revealed a significant decrease only when after
treatment was compared with before treatment, with an insignificant
decrease at the middle (BNMN: Before vs. middle, P=0.09; and before
vs. after, P=0.01; MNf: Before vs. middle, P=0.09; and before vs.
after, P=0.02).
Table IVE shows the
results from the comparison of the mean BNMN and MNf values from
the stable group before therapy against those at the middle and
after therapy. The mean BNMN values before, middle and after
therapy were 23.00±6.38, 15.75±0.96 and 17.00±3.74, respectively.
The mean MNf values for the same time-points were 27.25±8.85,
17.75±0.96 and 19.25±4.34, respectively. The comparison between
time-points revealed a significant decrease only for MNf when
middle was compared with before treatment, while BNMN for the same
time-point exhibited an insignificant decrease. At the end of the
therapy, both the BNMN and MNf values increased so that there were
no significant difference between before and after therapy (BNMN:
Before vs. middle, P=0.08; and before vs. after, P=0.16; MNf:
Before vs. middle, P=0.03; and before vs. after, P=0.08).
Table IVF shows the
results from the comparison of mean BNMN and MNf values from the no
response group before therapy against those at the middle and after
therapy. The mean BNMN values before, middle and after therapy were
26.75±5.20, 16.00±2.62 and 18.57±7.04, respectively. The mean MNf
values for the same time-points were 29.13±5.59, 18.00±3.34 and
21.00±7.85, respectively. The comparison between time-points
revealed a significant decrease only when middle was compared with
before therapy both for BNMN and MNf. On the contrary, at the end
of the therapy, both BNMN and MNf increased so that there was no
significant difference between before and after treatment (BNMN:
before vs. middle, P=0.01; and before vs. after, 0.07; MNf: before
vs. middle, P=0.02; and before vs. after, P=0.09).
Discussion
The results of the current study indicated that
patients diagnosed with metastatic CRC, regardless of sex and BMI,
had high rates of BNMN and MNf. Τhis was found both before and
throughout the systemic therapy, even though they tended to
decrease after therapy, but never to the degree of the individuals
without cancer. In parallel, they had the same CBPI with healthy
individuals that remained stable throughout treatment, while no
change in the CBPI was evidenced at any point time or for any
group.
It is well established that MN assay is a sensitive
indicator of genomic damages of exogenous and endogenous origin
(23,27). MNf in PBLs represents an indirect,
intracellular indicator of chromosomal and genomic instability
(high levels of MN are indicative of extended damages of the DNA
repair system and in chromosomal division) (17,28–30). It
has been proven that, even though MNf does not differ between the
two sexes (31), it does between
young and older and between normal-weight and obese individuals as
a result of the accumulation of genetic damage (31,32). These
facts support the hypothesis that the CBMN assay can be used as an
indicator of the genotoxic and cytotoxic state (33). Indeed, it has previously been
concluded that high levels of MN are linked to cancer (16). Moreover, a number of theories support
the hypothesis that MNf can be used as a tool for cancer prognosis
(18,19,34);
however, they all agree that further investigations are required to
verify this claim.
This study focused on the evaluation of MNf as a
potential prognostic/predictive biomarker for CRC monitoring in a
rather common group of patients with CRC, those with distant
metastases (stage IV disease). For this purpose, 25 patients with
stage IV CRC from a single oncologic center were included. Based on
the current therapeutic guidelines for stage IV CRC, these patients
underwent treatment with either FOLFOX or FOLFIRI with an addition
of a biological factor based on their underlying genetic status
(RAS and BRAF mutations). Folinic acid and 5-fluorouracil are the
common compounds of the FOLFOX and FOLFIRI regimens, while
oxaliplatin and irinotecan are the compounds that differentiate
them, respectively. Bibliographic data have indicated that FA is an
anti-clastogenic agent which significantly reduces the percentage
of BNMN (35). It has been found that
oxaliplatin induces cytogenetic damage (BNMN) through its
clastogenic action, possibly through interfering with topoisomerase
II (36). As regards irinotecan,
Kopjar et al, using the CBMN assay, observed a
dose-dependent increase in MNf in an in vitro study with
human lymphocytes (37). Another
study on irinotecan also found a significant increase of BNMN, but
in a non-dose-dependent manner (38).
However, to the best of our knowledge, there is no study available
to date estimating the MNf and BNMN using the actual combination of
FOLFOX or FOLFIRI with or without biological agents. Moreover, to
the best of our knowledge, this study is the first one conducted
with such a patient group and, thus, any interpretation of the data
presented will be based mainly on data coming from different
patient groups and thus should be treated accordingly.
CBPI is a tool widely used not only to better
understand the BNMN results, but also to estimate any cytotoxic
effect from chemical agents on cell cultures that use cytochalasin
B expressed by an altered proliferation cells (38). As regards the best understanding of
BNMN results, when CBPI is indifferent between time-points, then
MNf results are comparable and any fluctuation of MNf can be
attributed solely to the disease and/or the systemic treatment. As
for the cytotoxicity, when the CBPI value is close to one, there is
no cytotoxic event. However, in order to extract safer conclusions
regarding cytotoxicity, patient CBPIs are compared to those of the
control and not to the unit. In this study, if we address all
patients as one solid group, before the beginning of the therapy,
we can see that there was no difference in their CBPI values
compared with the healthy individuals, suggesting no cytotoxicity
from the disease. Moreover, we can see that CBPI remained almost
the same throughout the duration of therapy. Thus, the combination
of the disease and chemotherapy again did not lead to cytotoxicity.
Therefore, it is safe to say that the MNf results are indicative of
the patients' condition. Since sex does not affect MNf and the age
group of our patients was the same (between 50 and 75 years old),
the main parameters that had to be examined as to whether they
affect MNf were BMI and malignancy per se. For the former case,
patients were divided based on their BMI into 3 groups (BMI <25,
BMI ≤25 but ≤30 and BMI >30). Statistical analysis of the MNf
before the beginning of the treatment revealed no statistical
differences (Table IIIB). For this
reason, BMI was excluded from the final interpretation. The
comparison of the MNf and BNMN scores between the patients before
the systemic treatment and the healthy individuals (matched for
sex, age and BMI) revealed significantly higher rates for both
indexes (P<0.001). In fact, this significantly higher rate of
MNf and BNMN was maintained throughout treatment (Table IIIA). Thus, it is reasonable to
assume that the increased rates of MNf and BNMN are due to cancer.
A following comparison of the mean BNMN and MNf of all patients
revealed that BNMN decreased insignificantly at the middle and
significantly at the end (P<0.05), while MNf was significantly
lower for both time-points (P=0.04 and P=0.04 respectively)
(Table IIIC).
Based on the RECIST 1.1 criteria, we further divided
the patients into the ‘good response’, ‘stable disease’ and ‘no
response’ groups. The subsequent analysis revealed some very
interesting data. First of all, when each subgroup was compared to
the other for the same time-point, no significant differences were
revealed both for the mean BNMN and MNf values. However, the
subsequent comparison between time-points of the same group
revealed that the ‘good response’ group had a declining trend for
BNMN and MNf with an insignificant decrease at the middle (P=0.09
for both), and a significant one at the end of the therapy (P=0.01
and P=0.02, respectively) exhibiting a ‘shallow v trend’ (Fig. 1A). The same analysis was performed for
the ‘stable disease’ group revealing a significant) decrease
followed by an increase, making the MNf difference between before
and after treatment insignificant (Fig.
1C). The ‘no response’ group exhibited a significant decrease
at the middle both for BNMN and MNf (P=0.01 and P=0.02,
respectively). Interestingly though, the trend was reversed at the
end of the therapy, where both the BNMN and MNf values increased to
such an extent, that no significant difference was evident anymore,
exhibiting a ‘deep v trend’ (Fig.
1D).
Overall, there is a clear genotoxic state in the
PBLs of patients represented by the very high mean MNf before
therapy. This genotoxic state depicts the great cancer load at that
time. After the first trimester of the therapy, the decrease in the
mean MNf reflects the response of the organism to the treatment
accomplished by the depletion of the sensitive cancer clone.
However, the following increase of mean MNf (but never to the
degree before treatment) raises a challenge for its clinical
interpretation. The first scenario is that of a ‘gradual emergence
of a resistant clone’. First, sensitive cancer cells are depleted
and so MNf and BNMN decrease. Subsequently, resistant ones emerge
as they do not have to compete for energy or oxygen supply. In
fact, this scenario could explain the fluctuations in MNf observed
in the 3 response groups during the therapy. At the middle of
therapy, both the good and no response groups began killing
sensitive cells and decreased their MNf numbers, while the stable
group did not. While the good responders then continued to deplete
sensitive cancer cells, the non-responders began to increase cancer
cells and their MNf increases accordingly, while the stable group
maintained almost the same cell number and MNf. The second scenario
is the ‘long-term chemo-effect’. As mentioned before, both
oxaliplatin and irinotecan increase MNf. Thus, while the cancer
load decreases and the drug accumulation is not yet at its peak,
the MNf also decreases. However, as the rate of cancer cells
decrease diminishes and the accumulation of the drug reaches its
zenith, the MN-increasing properties of oxaliplatin and irinotecan
become evident. This scenario can also explain why at the end of
the treatment the response group did not differ significantly, in
terms of mean BNMN and MNf, than the other 2 groups, even though
their cancer burden was reduced by >30%. In other words,
systemic treatment increased MNf and prevented a cell number
difference to be seen. Interestingly though, even if the majority
of the patients exhibited the ‘v’-shaped trend of MNf, there were 4
patients who exhibited a reverse ‘v’-shaped trend, with an increase
of mean MNf at 3 months, and a subsequent decrease at 6 months, as
shown in Fig. 1. It is noteworthy
that these 4 patients who did not follow the ‘v’-shaped trend as
the rest of the participants, but rather an inverted ‘v’, were
proven to share the same therapy with a combination therapy of
FOLFIRI and some type of biological agent. Whichever the case may
be, as exhibited by the results from the good and the poor response
groups, MNf was not associated with tumor response.
The key is to identify the exact time when the
relapse or stability of the disease occurs and is first depicted in
MNf by a certain increase of it. In doing so, we would be able to
achieve a better tailoring of the therapy and at the same time we
will be a step closer towards personalized treatment with a
possible shortening of the chemotherapy duration. This in turn
would positively affect not only patients, in terms of less
side-effects as a consequence of tailored systemic therapy, but
also the health care system due to the decreased financial burden
of shortened systemic therapy. However, more patients and even more
sampling points would be required in order to successfully identify
the true nadir of MNf.
The findings of this study reveal an association,
firstly between MNf and CRC per se, with significantly elevated MN
rates at all time-points and, secondly between MNf and response to
treatment, where a good response was evidenced by the significantly
low rates at the end of treatment and a bad response by the
maintenance of high rates at the end. Despite the fact that the
results of the current study are in the same line of evidence with
previously published data (15–19), they
should be interpreted with caution and would be used as
hypothesis-generated. We aim to continue this research in a
prospective larger group of patients with metastatic CRC in order
to validate the findings of the current study and establish the
prognostic and predictive significance of MNf in this setting.
Acknowledgements
The authors would like to thank the Toxicology
Laboratory of the Medical School, University of Crete for providing
the necessary infrastructure, and the Department of Medical
Oncology, University Hospital of Heraklion and the Health Center of
Agia Barbara, Heraklion for providing blood samples from oncologic
patients and controls, respectively
Funding
This study was supported by the Special Research
Account of University of Crete (ELKE nos. 4658, 3392, 3963) and
ToxPlus S.A.
Availability of data and materials
All data generated or analyzed during this study is
included in this published article or are available from the
corresponding author upon reasonable request.
Authors' contributions
TKN conducted the experiments, interpreted the data
and wrote the manuscript. PDS performed the analysis and
interpreted the data. PA conducted the experiments and wrote the
manuscript. KK conducted the experiments and wrote the manuscript.
TMS drafted, interpreted the data and critically revised the
article. DAS conceived and designed, critically reviewed and
supervised the article. AT conceived and designed, critically
revised, provided laboratory infrastructure and was responsible for
the critical revision of the article for important intellectual
content. JS provided blood samples, edited the manuscript and was
responsible for the critical revision of the article for important
intellectual content. JT conceived and designed the study. All
authors have read and approved the final manuscript.
Ethics approval and consent to
participate
Blood and information of patients were obtained with
written informed consent. Procedures involving patients in this
study were approved by the Human Ethics Committee at the University
Hospital of Heraklion on December 2016.
Patient consent for publication
Not applicable.
Competing interests
DAS is the Editor-in-Chief for the journal, but had
no personal involvement in the reviewing process, or any influence
in terms of adjudicating on the final decision, for this article.
The other authors declare that they have no competing
interests.
Glossary
Abbreviations
Abbreviations:
|
CRC
|
colorectal cancer
|
|
MN
|
micronuclei
|
|
MNf
|
micronuclei frequency
|
|
CBMN assay
|
cytokinesis block micronucleus
assay
|
|
CIN
|
chromosomal instability
|
|
MSI
|
microsatellite instability
|
|
CIMP
|
CpG island methylation phenotype
|
|
LCC
|
left-sided colon cancer
|
|
RCC
|
right-sided colon cancer
|
|
mCRC
|
metastatic colorectal cancer
|
|
BN cells
|
binucleated cells
|
|
CBPI
|
cytokinesis block proliferation
index
|
|
BNMN
|
binucleated cells with micronuclei
|
|
FOLFIRI
|
folinic acid with 5-fluorouracil and
irinotecan
|
|
FOLFOX
|
folinic acid with 5-fluorouracil and
oxaliplatin
|
|
PBLs
|
peripheral blood lymphocytes
|
References
|
1
|
Jemal A, Bray F, Center MM, Ferlay J, Ward
E and Forman D: Global cancer statistics. CA Cancer J Clin.
61:69–90. 2011. View Article : Google Scholar : PubMed/NCBI
|
|
2
|
Tsiaoussis J, Vassilopoulou L,
Nikolouzakis T, Rakitskii VN, Vakonaki E, Fragkiadaki P,
Stivaktakis P and Tsatsakis AM: Biomolecular profile of colorectal
cancer - The role of telomerase as a potent biomarker. Farmacia.
65:643–659. 2017.
|
|
3
|
Nikolouzakis TK, Vassilopoulou L,
Fragkiadaki P, Mariolis Sapsakos T, Papadakis GZ, Spandidos DA,
Tsatsakis AM and Tsiaoussis J: Improving diagnosis, prognosis and
prediction by using biomarkers in CRC patients (Review). Oncol Rep.
39:2455–2472. 2018.PubMed/NCBI
|
|
4
|
Cunningham D, Atkin W, Lenz HJ, Lynch HT,
Minsky B, Nordlinger B and Starling N: Colorectal cancer. Lancet.
375:1030–1047. 2010. View Article : Google Scholar : PubMed/NCBI
|
|
5
|
Engstrand J, Nilsson H, Strömberg C, Jonas
E and Freedman J: Colorectal cancer liver metastases - a
population-based study on incidence, management and survival. BMC
Cancer. 18:782018. View Article : Google Scholar : PubMed/NCBI
|
|
6
|
Souglakos J, Philips J, Wang R, Marwah S,
Silver M, Tzardi M, Silver J, Ogino S, Hooshmand S, Kwak E, et al:
Prognostic and predictive value of common mutations for treatment
response and survival in patients with metastatic colorectal
cancer. Br J Cancer. 101:465–472. 2009. View Article : Google Scholar : PubMed/NCBI
|
|
7
|
Richman S and Adlard J: Left and right
sided large bowel cancer. BMJ. 324:931–932. 2002. View Article : Google Scholar : PubMed/NCBI
|
|
8
|
Haggar FA and Boushey RP: Colorectal
cancer epidemiology: Incidence, mortality, survival, and risk
factors. Clin Colon Rectal Surg. 22:191–197. 2009. View Article : Google Scholar : PubMed/NCBI
|
|
9
|
Koliarakis I, Psaroulaki A, Nikolouzakis
TK, Sgantzos M, Kokkinakis M, Goulielmos G, Androutsopoulos V,
Tsatsakis A and Tsiaoussis J: Intestinal microbiota and colorectal
cancer: A new aspect of research. J BUON. 23:1216–1234.
2018.PubMed/NCBI
|
|
10
|
Adam R, de Gramont A, Figueras J, Kokudo
N, Kunstlinger F, Loyer E, Poston G, Rougier P, Rubbia-Brandt L,
Sobrero A, et al of the EGOSLIM (Expert Group on OncoSurgery
management of LIver Metastases) group, : Managing synchronous liver
metastases from colorectal cancer: A multidisciplinary
international consensus. Cancer Treat Rev. 41:729–741. 2015.
View Article : Google Scholar : PubMed/NCBI
|
|
11
|
Siegel RL, Miller KD, Fedewa SA, Ahnen DJ,
Meester RG, Barzi A and Jemal A: Colorectal cancer statistics,
2017. CA Cancer J Clin. 67:177–193. 2017. View Article : Google Scholar : PubMed/NCBI
|
|
12
|
Charlton ME, Kahl AR, Greenbaum AA,
Karlitz JJ, Lin C, Lynch CF and Chen VW: KRAS testing, tumor
location, and survival in patients with stage IV colorectal cancer:
SEER 2010–2013. J Natl Compr Canc Netw. 15:1484–1493. 2017.
View Article : Google Scholar : PubMed/NCBI
|
|
13
|
Fenech M, Kirsch-Volders M, Natarajan AT,
Surralles J, Crott JW, Parry J, Norppa H, Eastmond DA, Tucker JD
and Thomas P: Molecular mechanisms of micronucleus, nucleoplasmic
bridge and nuclear bud formation in mammalian and human cells.
Mutagenesis. 26:125–132. 2011. View Article : Google Scholar : PubMed/NCBI
|
|
14
|
Mateuca R, Lombaert N, Aka PV, Decordier I
and Kirsch-Volders M: Chromosomal changes: Induction, detection
methods and applicability in human biomonitoring. Biochimie.
88:1515–1531. 2006. View Article : Google Scholar : PubMed/NCBI
|
|
15
|
Pardini B, Viberti C, Naccarati A, Allione
A, Oderda M, Critelli R, Preto M, Zijno A, Cucchiarale G, Gontero
P, et al: Increased micronucleus frequency in peripheral blood
lymphocytes predicts the risk of bladder cancer. Br J Cancer.
116:202–210. 2017. View Article : Google Scholar : PubMed/NCBI
|
|
16
|
Ravegnini G, Zolezzi Moraga JM, Maffei F,
Musti M, Zenesini C, Simeon V, Sammarini G, Festi D, Hrelia P and
Angelini S: Simultaneous analysis of SEPT9 promoter methylation
status, micronuclei frequency, and folate-related gene
polymorphisms: The potential for a novel blood-based colorectal
cancer biomarker. Int J Mol Sci. 16:28486–28497. 2015. View Article : Google Scholar : PubMed/NCBI
|
|
17
|
Maffei F, Zolezzi Moraga JM, Angelini S,
Zenesini C, Musti M, Festi D, Cantelli-Forti G and Hrelia P:
Micronucleus frequency in human peripheral blood lymphocytes as a
biomarker for the early detection of colorectal cancer risk.
Mutagenesis. 29:221–225. 2014. View Article : Google Scholar : PubMed/NCBI
|
|
18
|
Espinoza F, Cecchini L, Morote J, Marcos R
and Pastor S: Micronuclei frequency in urothelial cells of bladder
cancer patients, as a biomarker of prognosis. Environ Mol Mutagen.
Oct 4–2018.(Epub ahead of print). doi: 10.1002/em.22252. View Article : Google Scholar : PubMed/NCBI
|
|
19
|
Wang RC, Yang L, Tang Y and Bai O:
Micronucleus expression and acute leukemia prognosis. Asian Pac J
Cancer Prev. 14:5257–5261. 2013. View Article : Google Scholar : PubMed/NCBI
|
|
20
|
Dervenis C, Xynos E, Sotiropoulos G,
Gouvas N, Boukovinas I, Agalianos C, Androulakis N, Athanasiadis A,
Christodoulou C, Chrysou E, et al: Clinical practice guidelines for
the management of metastatic colorectal cancer: A consensus
statement of the Hellenic Society of Medical Oncologists (HeSMO).
Ann Gastroenterol. 29:390–416. 2016.PubMed/NCBI
|
|
21
|
Schwartz LH, Litière S, de Vries E, Ford
R, Gwyther S, Mandrekar S, Shankar L, Bogaerts J, Chen A, Dancey J,
et al: RECIST 1.1-Update and clarification: From the RECIST
committee. Eur J Cancer. 62:132–137. 2016. View Article : Google Scholar : PubMed/NCBI
|
|
22
|
Hayashi M: The micronucleus test-most
widely used in vivo genotoxicity test. Genes Environ. 38:182016.
View Article : Google Scholar : PubMed/NCBI
|
|
23
|
Stivaktakis P, Vlastos D, Giannakopoulos E
and Matthopoulos DP: Differential micronuclei induction in human
lymphocyte cultures by imidacloprid in the presence of potassium
nitrate. ScientificWorldJournal. 10:80–89. 2010. View Article : Google Scholar : PubMed/NCBI
|
|
24
|
Fenech M: The cytokinesis-block
micronucleus technique: A detailed description of the method and
its application to genotoxicity studies in human populations. Mutat
Res. 285:35–44. 1993. View Article : Google Scholar : PubMed/NCBI
|
|
25
|
Fenech M, Chang WP, Kirsch-Volders M,
Holland N, Bonassi S and Zeiger E: HUman MicronNucleus project:
HUMN project: Detailed description of the scoring criteria for the
cytokinesis-block micronucleus assay using isolated human
lymphocyte cultures. Mutat Res. 534:65–75. 2003. View Article : Google Scholar : PubMed/NCBI
|
|
26
|
Surrallés J, Xamena N, Creus A, Catalán J,
Norppa H and Marcos R: Induction of micronuclei by five pyrethroid
insecticides in whole-blood and isolated human lymphocyte cultures.
Mutat Res. 341:169–184. 1995. View Article : Google Scholar : PubMed/NCBI
|
|
27
|
Stivaktakis PD, Giannakopoulos E, Vlastos
D and Matthopoulos DP: Determination of genotoxic effects of
methidathion alkaline hydrolysis in human lymphocytes using the
micronucleus assay and square-wave voltammetry.
Bioelectrochemistry. 113:9–14. 2017. View Article : Google Scholar : PubMed/NCBI
|
|
28
|
Zhang CZ, Spektor A, Cornils H, Francis
JM, Jackson EK, Liu S, Meyerson M and Pellman D: Chromothripsis
from DNA damage in micronuclei. Nature. 522:179–184. 2015.
View Article : Google Scholar : PubMed/NCBI
|
|
29
|
Bonassi S, Znaor A, Ceppi M, Lando C,
Chang WP, Holland N, Kirsch-Volders M, Zeiger E, Ban S, Barale R,
et al: An increased micronucleus frequency in peripheral blood
lymphocytes predicts the risk of cancer in humans. Carcinogenesis.
28:625–631. 2007. View Article : Google Scholar : PubMed/NCBI
|
|
30
|
Schmid W: The micronucleus test. Mutat
Res. 31:9–15. 1975. View Article : Google Scholar : PubMed/NCBI
|
|
31
|
Fenech M and Bonassi S: The effect of age,
gender, diet and lifestyle on DNA damage measured using
micronucleus frequency in human peripheral blood lymphocytes.
Mutagenesis. 26:43–49. 2011. View Article : Google Scholar : PubMed/NCBI
|
|
32
|
Andreassi MG, Barale R, Iozzo P and Picano
E: The association of micronucleus frequency with obesity, diabetes
and cardiovascular disease. Mutagenesis. 26:77–83. 2011. View Article : Google Scholar : PubMed/NCBI
|
|
33
|
Bonassi S, Coskun E, Ceppi M, Lando C,
Bolognesi C, Burgaz S, Holland N, Kirsh-Volders M, Knasmueller S,
Zeiger E, et al: The HUman MicroNucleus project on eXfoLiated
buccal cells (HUMN(XL)): The role of life-style, host factors,
occupational exposures, health status, and assay protocol. Mutat
Res. 728:88–97. 2011. View Article : Google Scholar : PubMed/NCBI
|
|
34
|
Ramesh G, Chaubey S, Raj A, Seth RK,
Katiyar A and Kumar A: Micronuclei assay in exfoliated buccal cells
of radiation treated oral cancer patients. J Exp Ther Oncol.
12:121–128. 2017.PubMed/NCBI
|
|
35
|
Scaglione F and Panzavolta G: Folate,
folic acid and 5-methyltetrahydrofolate are not the same thing.
Xenobiotica. 44:480–488. 2014. View Article : Google Scholar : PubMed/NCBI
|
|
36
|
de Souza AP, Lehmann M and Dihl RR:
Comparative study on the induction of complex genomic alterations
after exposure of mammalian cells to carboplatin and oxaliplatin.
Drug Chem Toxicol. 40:410–415. 2017. View Article : Google Scholar : PubMed/NCBI
|
|
37
|
Kopjar N, Zeljezić D, Vrdoljak AL, Radić
B, Ramić S, Milić M, Gamulin M, Pavlica V and Fucić A: Irinotecan
toxicity to human blood cells in vitro: Relationship between
various biomarkers. Basic Clin Pharmacol Toxicol. 100:403–413.
2007. View Article : Google Scholar : PubMed/NCBI
|
|
38
|
Kasuba V, Rozgaj R, Gamulin M and Trosić
I: Assessment of cyto/genotoxicity of irinotecan in v79 cells using
the comet, micronucleus, and chromosome aberration assay. Arh Hig
Rada Toksikol. 61:1–9. 2010. View Article : Google Scholar : PubMed/NCBI
|