Introduction
Cytochrome P450 (CYP) enzymes are involved in the
metabolism of the majority of therapeutic drugs (1). While the majority of CYP enzymes are
expressed in the endoplasmic reticulum and inner mitochondrial
membrane of liver cells, these enzymes can also be found in
extrahepatic tissues (2,3) contributing to the metabolism of
xenobiotic compounds (4). The
tissue-specific expression of CYP enzymes has a major influence on
the sensitivity and exposure of a particular organ to a given drug
(3).
The role of CYP enzymes in the metabolism of
anticancer agents and the efficacy of cancer therapy has been the
subject of investigation for years (5). Inter- and intraindividual differences
in the expression and activity of CYP enzymes have been
demonstrated in several tumor tissues (6,7).
Recently, Noll et al (8) demonstrated a tumor-autonomous
CYP-mediated resistance to therapy with paclitaxel, dasatinib, and
erlotinib in pancreatic ductal adenocarcinoma. Further research
revealed that CYP3A5 was also expressed in other malignancies
including rectal adenocarcinoma and colon adenoma (8), suggesting that CYP3A5 played a similar
role in these malignancies.
With an estimated 1.4 million new cases in 2012,
colorectal cancer (CRC) is one of the most commonly diagnosed
cancer types (9). The main goal for
localized CRC therapy is surgical resection; however, advanced
stages are treated with different chemotherapy protocols using the
agents 5-fluorouracil (+/−leucovorin), irinotecan (CPT-11), and
oxaliplatin, as well as monoclonal antibodies (10–12).
Irinotecan is part of the standard treatment regimen
for metastatic CRC (13) and is
usually administered as part of a combination therapy, e.g., with
5-fluorouracil/folinic acid (or capecitabine) (FOLFIRI/XELIRI),
5-fluorouracil/folinic acid/oxaliplatin (FOLFOXIRI) and/or with
monoclonal antibodies against vascular endothelial growth factor
(VEGF; bevacizumab) or epidermal growth factor receptor (EGFR;
cetuximab, panitumumab) in selected patients with RAS wild-type CRC
(14). Irinotecan can be
administered as part of first-line treatment, but also in all later
lines of sequential CRC therapy. First approved in France in 1995,
the topoisomerase I inhibitor irinotecan has since been approved in
~80 countries (13).
Although no deterioration in quality-of-life scores
has been reported with chemotherapy including irinotecan (13), administration of irinotecan is often
associated with potentially lethal side effects, mainly diarrhea
and neutropenia (13,15).
Irinotecan acts as a prodrug and is activated by
carboxylesterases into 7-ethyl-10-hydroxy-camptothecin (SN-38),
which is ~100- to 1,000-fold more toxic and inhibits topoisomerase
I, leading to deoxyribonucleic acid (DNA) breaks. The active
metabolite SN-38 can be deactivated either by glucuronidation in
hepatic and extrahepatic tissues, or by CYP3A4- and
CYP3A5-dependent oxidation, forming the inactive metabolites
7-ethyl-10 [4-N-(5-aminopentanoicacid)-1-piperidino]
carbonyloxycamptothecin (APC) and 7-ethyl-10 [4-amino-1-piperidino]
carbonyloxycamptothecin (NPC). CYP3A induction has been
demonstrated to cause decreased formation of SN-38 (15).
CYP3A5 is the most frequently expressed CYP3A
isoform in extrahepatic tissues, suggesting an important role for
this isoform in local metabolism (16). The presence of CYP3A5 has been
demonstrated in normal colon (3,17,18),
colon adenoma (19), and CRC
(20). The CYP3A5*3 polymorphism,
which can lead to reduced enzyme activity, has been associated with
significantly longer progression-free survival in patients with
metastatic CRC (21).
The potential of cancer therapy is impaired by
difficulties in predicting both tumor response and adverse events
(6). The purpose of the present
study was to systematically analyze CYP3A5 protein expression in
normal colon, colon adenomas, CRC, and additional normal tissues,
and to evaluate whether CYP3A5 expression in CRC tissue determines
tumor response to irinotecan therapy.
Materials and methods
Patient material
Tissue samples were stored in the tissue bank of the
National Center for Tumor Diseases (NCT; Heidelberg, Germany) and
used with the approval of the ethics committee of Heidelberg
University (206/2005). All tissues were fixed in formalin and
embedded in paraffin.
We examined tissue microarrays (TMAs) comprising
normal tissues (Table I). Duplicate
cores were available for each specimen on the TMA. Whole tissue
slides of normal colon of 15 patients and colon adenomas of 45
patients (15 tubular adenomas, 15 tubulovillous adenomas, 15
sessile serrated adenomas) were also examined.
 | Table I.Composition of tissue
microarrays. |
Table I.
Composition of tissue
microarrays.
| Tissue type | Number of specimens
(n) |
|---|
| Adipose tissue | 10 |
| Adrenal gland | 3 |
| Appendix | 4 |
| Colon | 17 |
| Endometrium | 2 |
| Esophagus | 13 |
| Gallbladder | 10 |
| Heart | 13 |
| Kidney | 17 |
| Liver | 14 |
| Lung | 10 |
| Muscle | 7 |
| Myometrium | 5 |
| Ovary | 6 |
| Pancreas | 7 |
| Prostate | 13 |
| Salivary gland | 8 |
| Skin | 5 |
| Small
intestine | 13 |
| Spleen | 14 |
| Stomach | 14 |
| Testis | 12 |
| Thymus | 6 |
| Thyroid gland | 11 |
| Tonsil | 5 |
| Urinary
bladder | 4 |
In addition to the abovementioned tissues, 85 whole
tissue slides of CRC tissues from 65 patients undergoing surgery or
biopsy (population P1), were also obtained from the tissue bank of
the NCT. Of these tissue samples, 48 were specimens from primary
CRC and 37 were specimens from metastases. Regarding treatment
exposure, 68 CRC tissues were irinotecan-naïve, while 17 were
procured following treatment with irinotecan. The present study was
approved by the Ethics Committee of the Medical Faculty of the
University of Heidelberg (reference no. 206/2005).
To assess a possible correlation between CYP3A5
expression and tumor response to irinotecan treatment, tissues of a
subpopulation of P1 including 61 patients (population P2) for whom
clinical data were available were examined. Specimens were obtained
before irinotecan treatment in 53 cases (in 40 cases before any
kind of chemotherapy), and after irinotecan therapy in 8 cases.
Immunohistochemistry
Immunohistochemistry was performed using the
ZytoChem Plus AP Polymer System kit (Zytomed Systems, Berlin,
Germany). Tissue sections were deparaffinized and rehydrated.
Antigen retrieval was achieved by incubating the specimens in
Target Retrieval Solution (0.01 M citrate buffer, PH 6.0) (Dako;
Agilent Technologies GmbH, Waldbronn, Germany) at 99°C for 25 min
followed by cooling at room temperature for 15 min. The blocking
solution was applied for 5 min. The sections were then incubated
with the rabbit monoclonal anti-CYP3A5 antibody (Abcam, Cambridge,
UK) at 4°C overnight. The PostBlock was added to the slides for 20
min. The specimens were then incubated with AP-polymer for 30 min.
Liquid Permanent Red (Dako; Agilent Technologies GmbH) was used for
staining. After 17 min, the reaction was terminated with distilled
water. The slides were washed with phosphate-buffered saline after
each incubation, and the tissue was counterstained with
hematoxylin.
Scoring
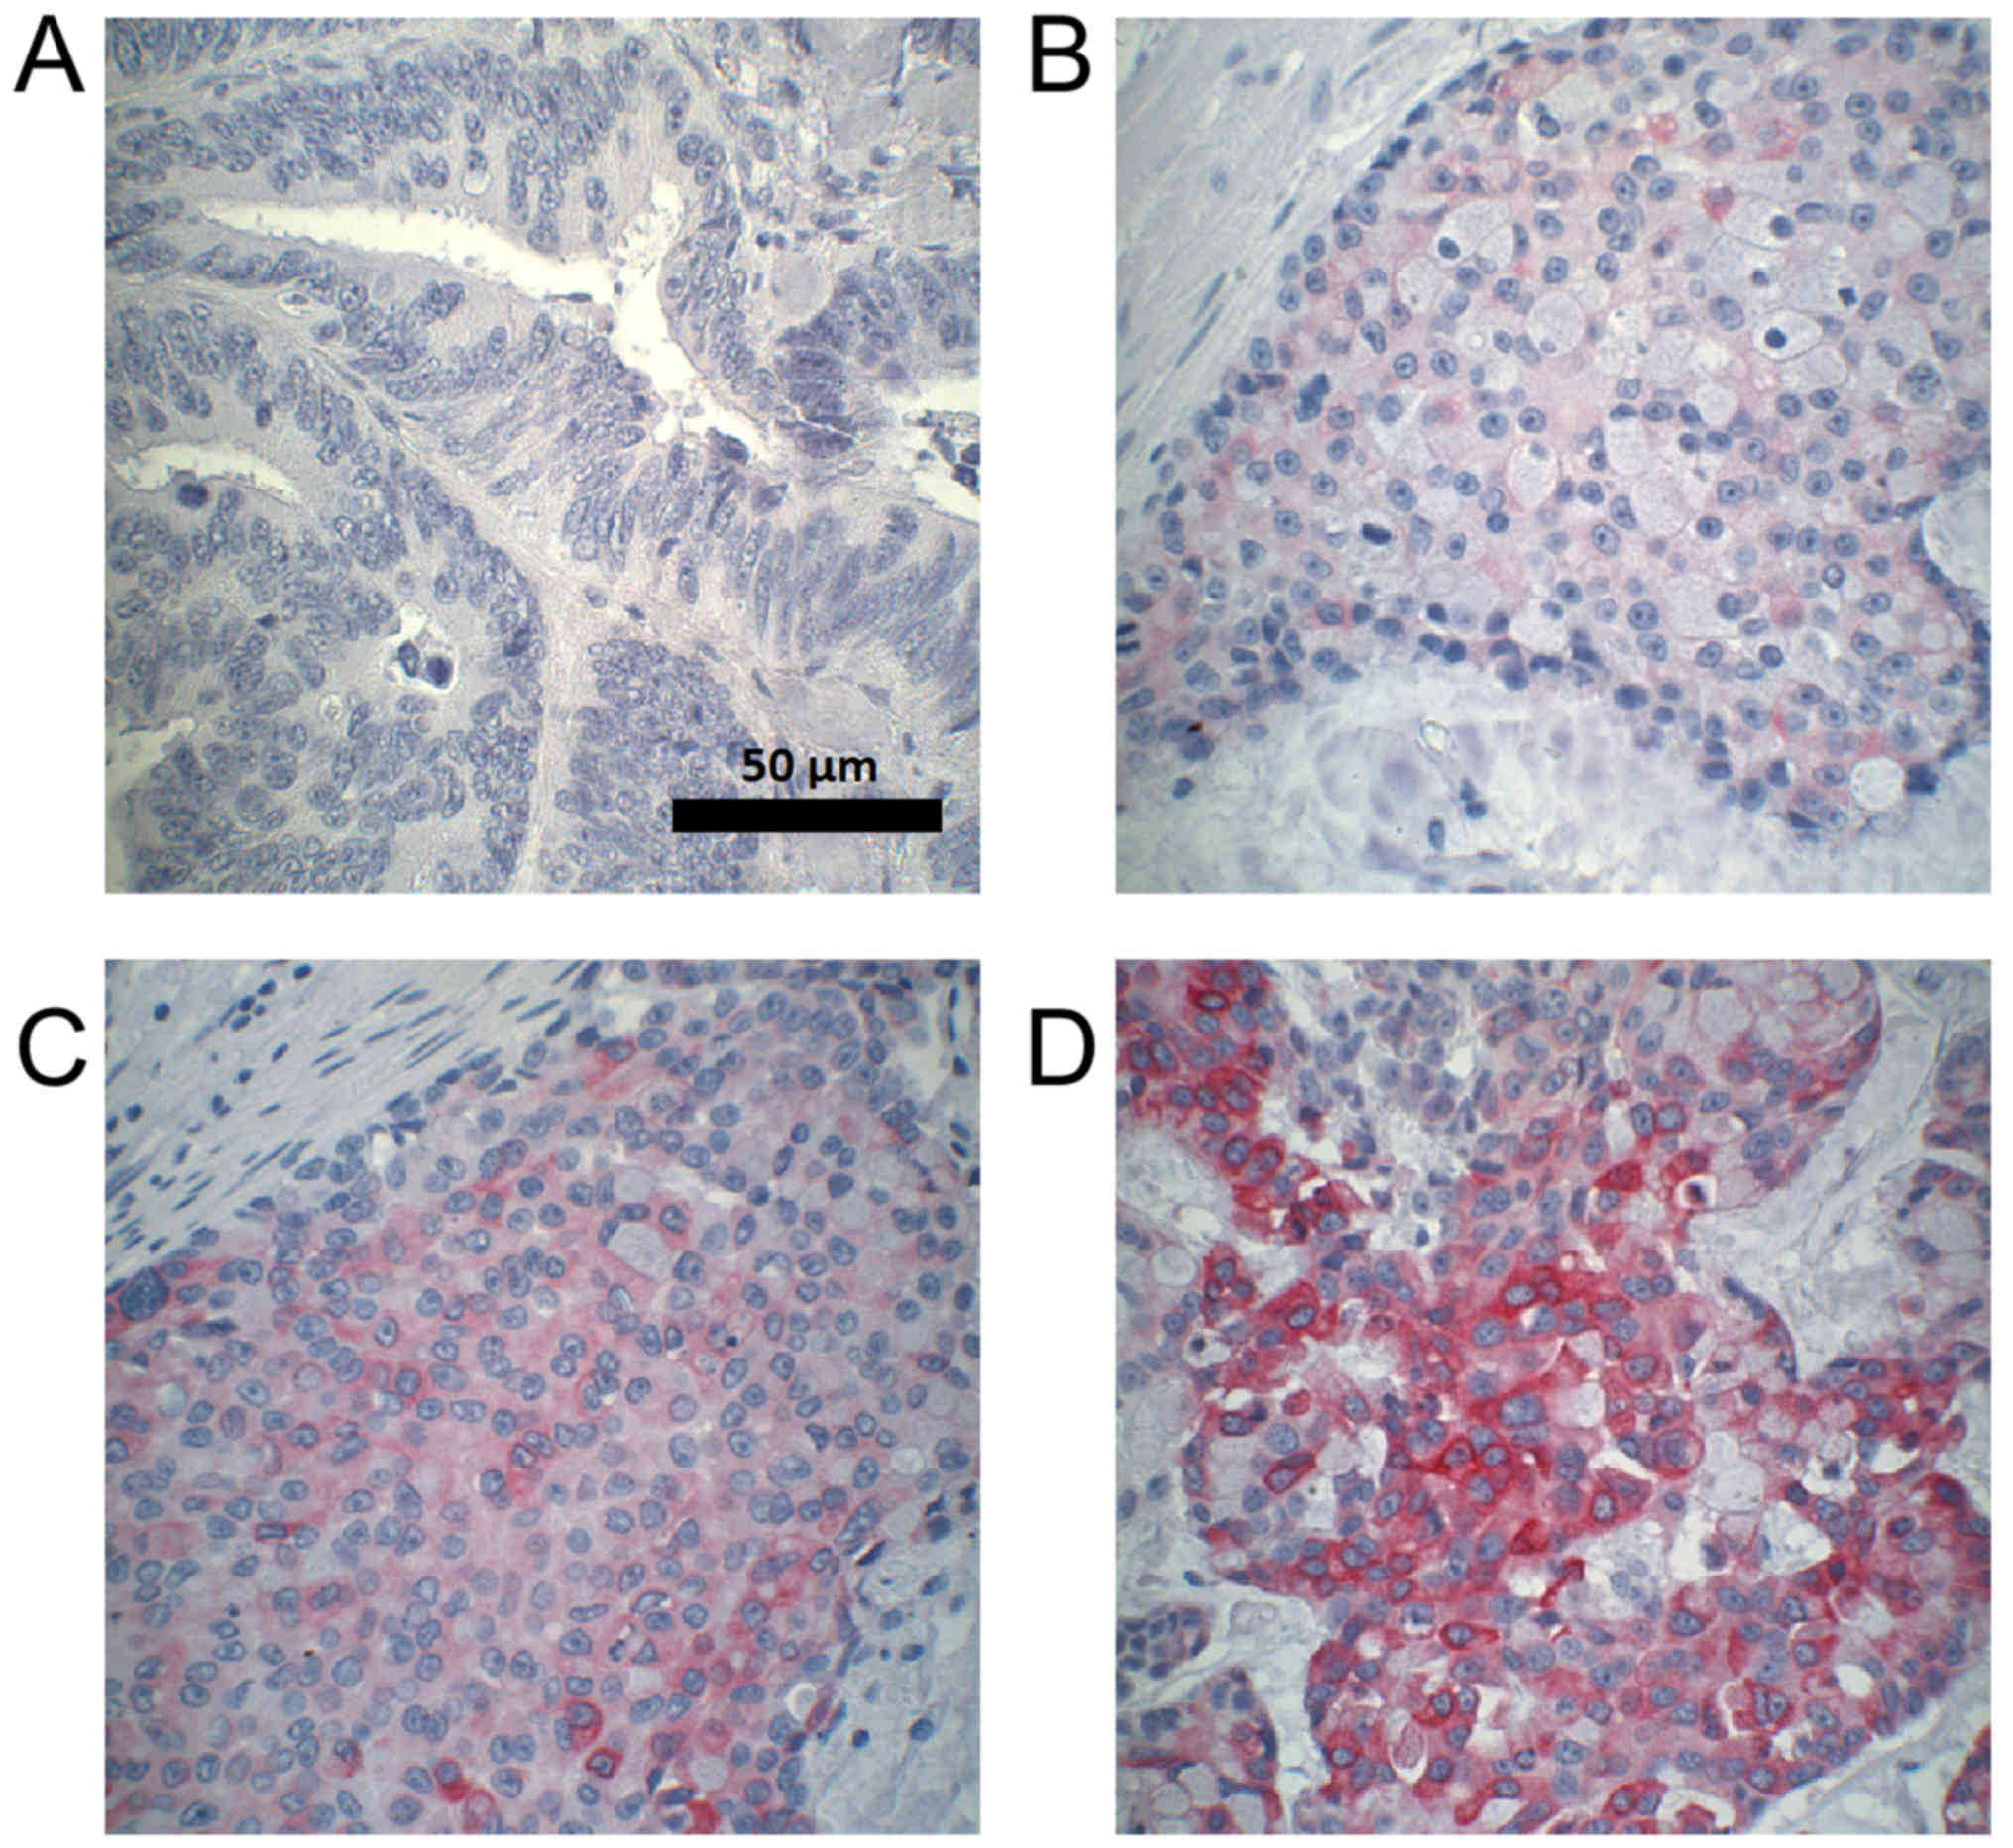
A semi-quantitative score was used to evaluate the
immunohistochemical staining of each specimen by estimating the
staining intensity (negative, weak, moderate, strong; Fig. 1) and the percentage of stained cells,
assigning a score of 0–300. The score was calculated using the
equation 1 × (% of cells with weak staining) + 2 × (% of cells with
moderate staining) + 3 × (% of cells with strong staining), as
previously established and used (22). Scoring was performed by researchers
blinded to therapy response.
Assessment of therapy response
Best overall tumor response was assessed for the
first chemotherapy containing irinotecan. Protocols included
fluoropyrimidine and oxaliplatin as well as the monoclonal
antibodies bevacizumab, cetuximab, and panitumumab.
Tumor response was assessed according to the
Response Evaluation Criteria in Solid Tumors (RECIST) 1.1
guidelines (23) on the basis of
contrast-enhanced computed tomography (CT) scans. Unidimensional
measurements of target lesions and qualitative assessment of
non-target disease allowed categorization of overall tumor response
as complete response (CR), partial response (PR), stable disease
(SD), or progressive disease (PD). The best overall response
recorded from the beginning until the end of the treatment was used
for further analysis.
Statistical analysis
Spearman's rank correlation was used to assess a
possible correlation between CYP3A5 expression and tumor response
to irinotecan therapy. We used the Wilcoxon signed-rank test to
analyze differences between paired specimens and the Kruskal-Wallis
test to investigate whether CYP3A5 expression differed among the
different categories of tumor response and among certain clinical
parameters. The Mann-Whitney U test was used to assess differences
in CYP3A5 expression between two groups. Due to the nature of the
study as an explorative data analysis no alpha adjustment was
performed.
In cases of more than one specimen per patient, a
specimen was selected randomly. The final score for each specimen
on the TMA was determined as the mean score of the duplicate
cores.
All analyses were performed using SPSS for Windows
version 24 (IBM Corp., Armonk, NY, USA). P<0.05 was considered
to indicate a statistically significant difference.
Results
CYP3A5 expression in normal
tissues
Among the 26 examined normal tissues, adipose
tissue, adrenal gland, appendix, endometrium, esophagus, heart
muscle, lung epithelial cells, skeletal muscle, myometrium, ovary,
exocrine pancreas, prostate, salivary gland, squamous epithelium of
the skin, spleen, testis, thymus, and urothelium were
CYP3A5-negative.
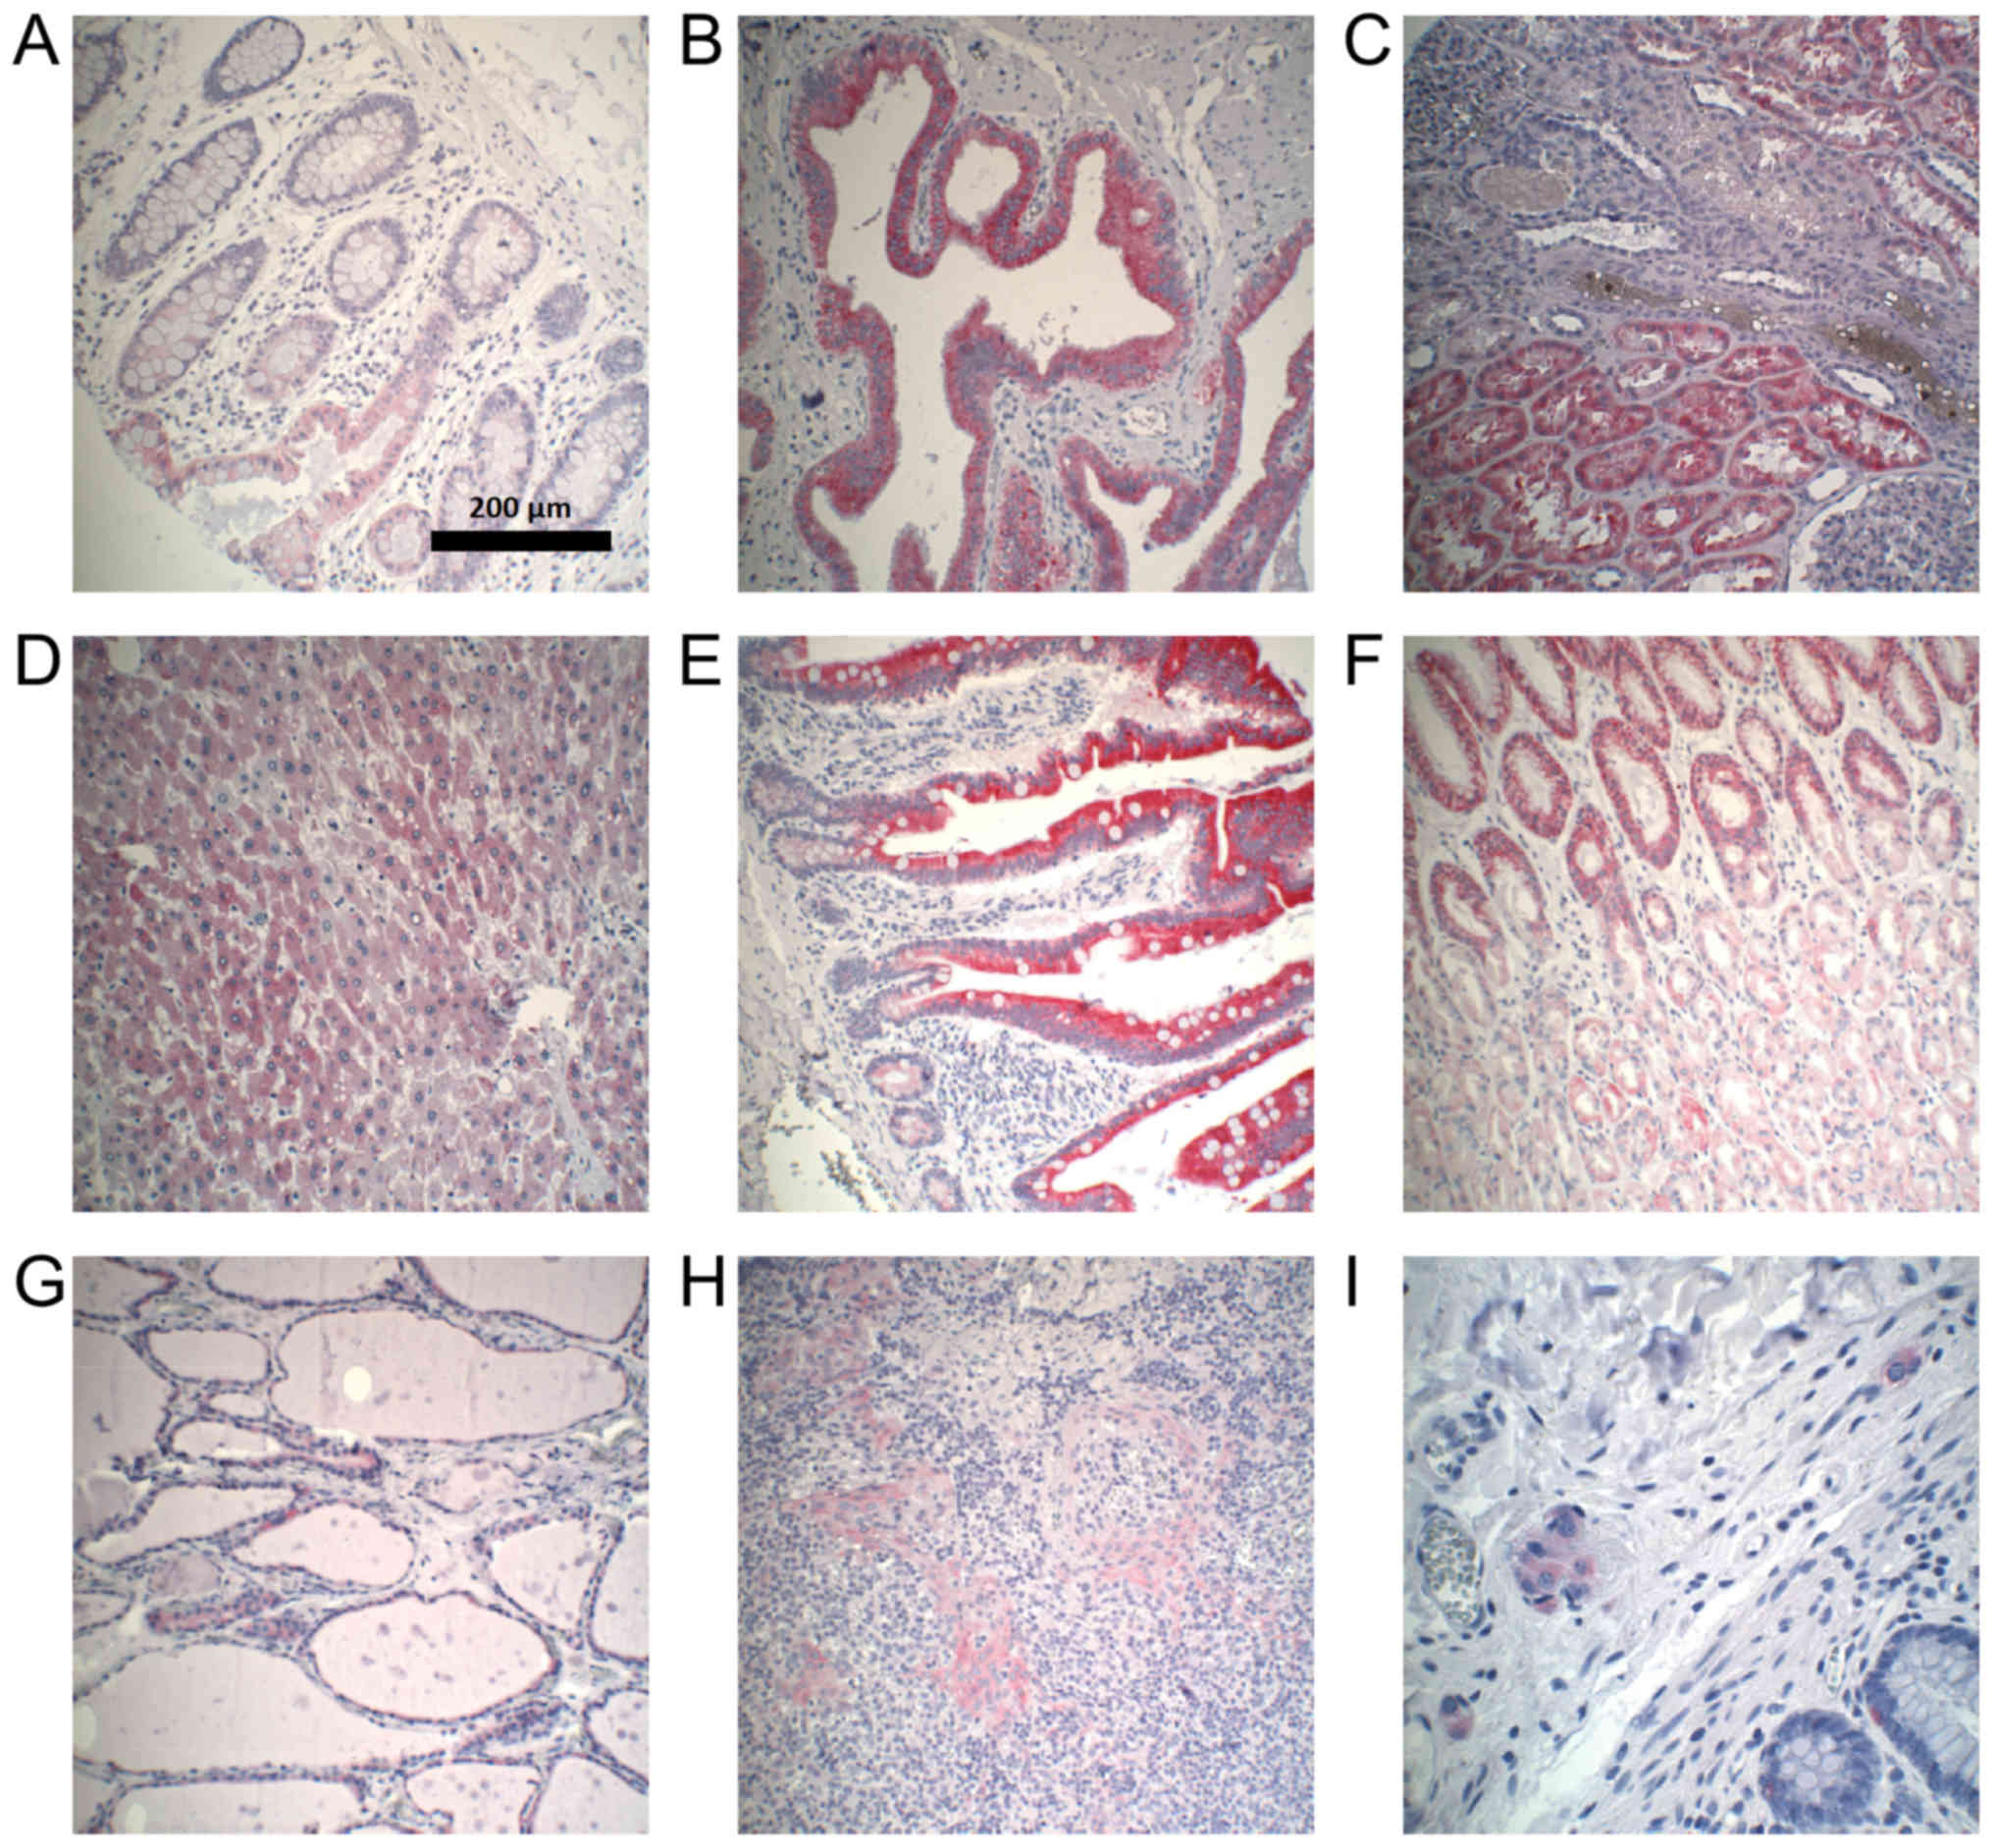
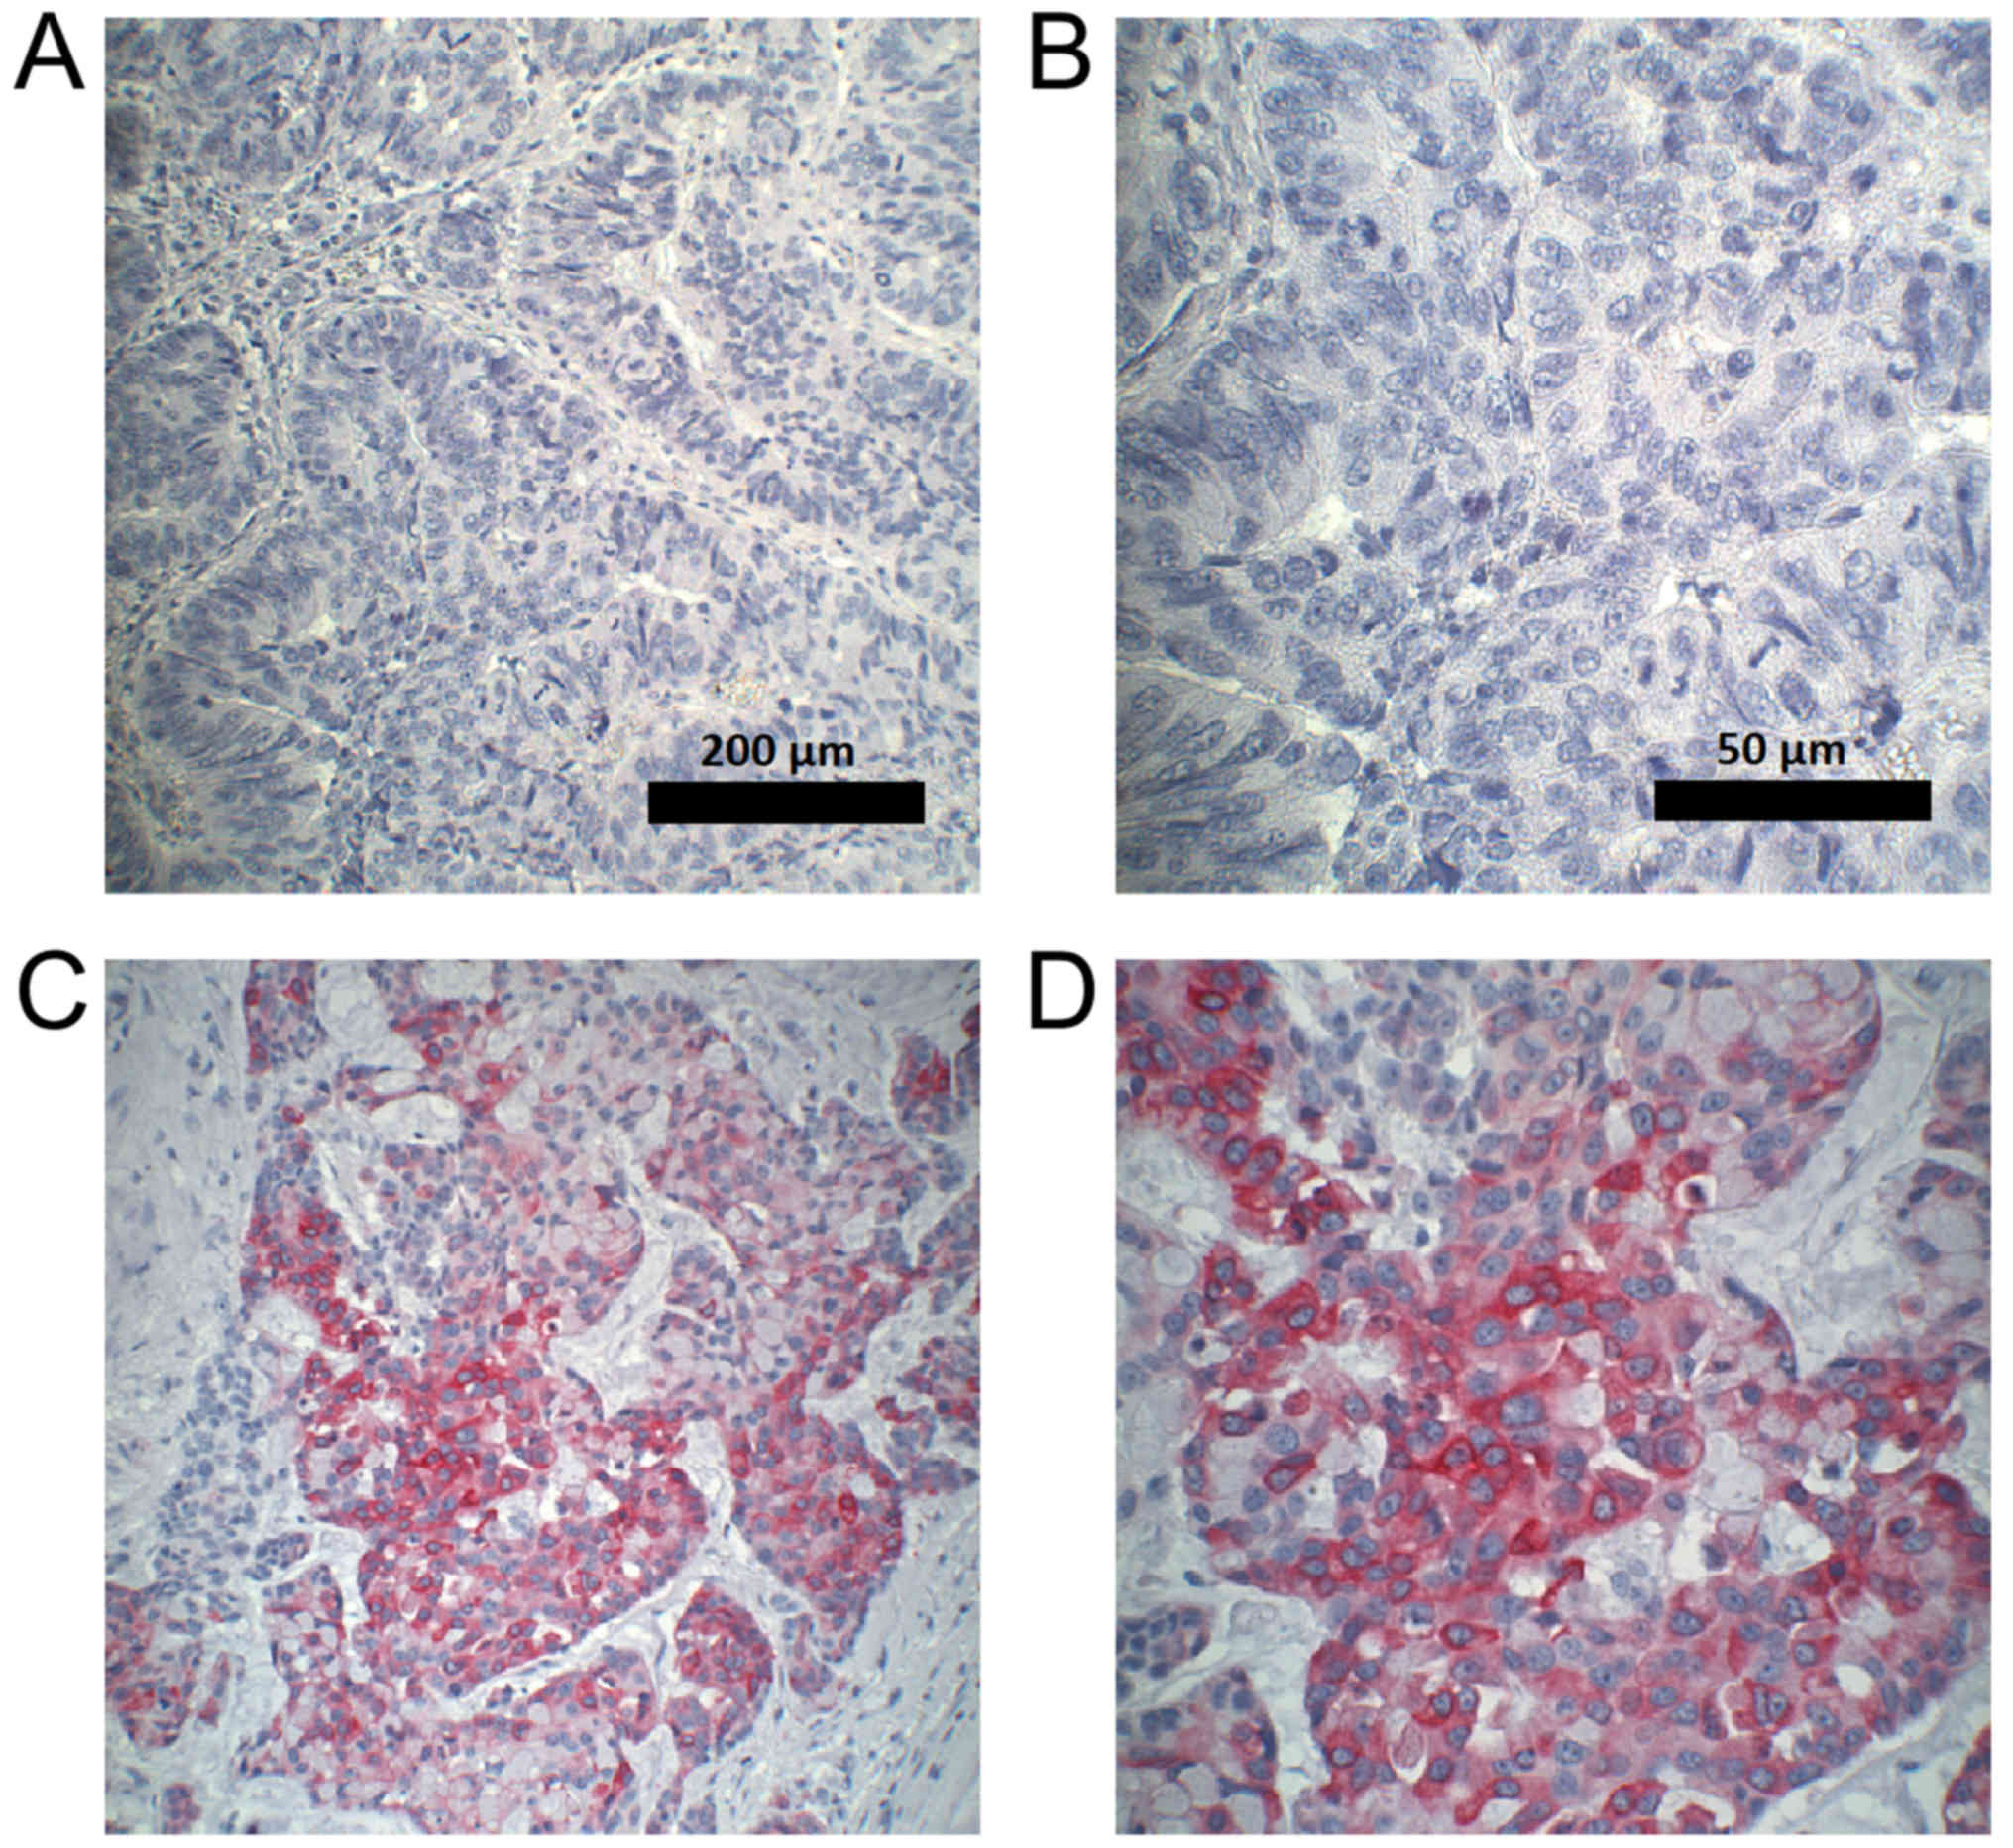
Colon epithelium, gallbladder epithelium, kidney,
liver, epithelium of the small intestine, stomach, thyroid gland,
and lymphatic tissue of the tonsil expressed CYP3A5 to different
extents (Fig. 2). All
CYP3A5-positive organs demonstrated a heterogeneous distribution of
CYP3A5 expression. Examples of CYP3A5-positive staining in normal
tissues are shown in Fig. 3.
CYP3A5-negative sections could be found in every organ. The highest
CYP3A5 expression was observed in gallbladder epithelium. In
addition, expression of CYP3A5 was observed in ganglion cells
located in normal colon.
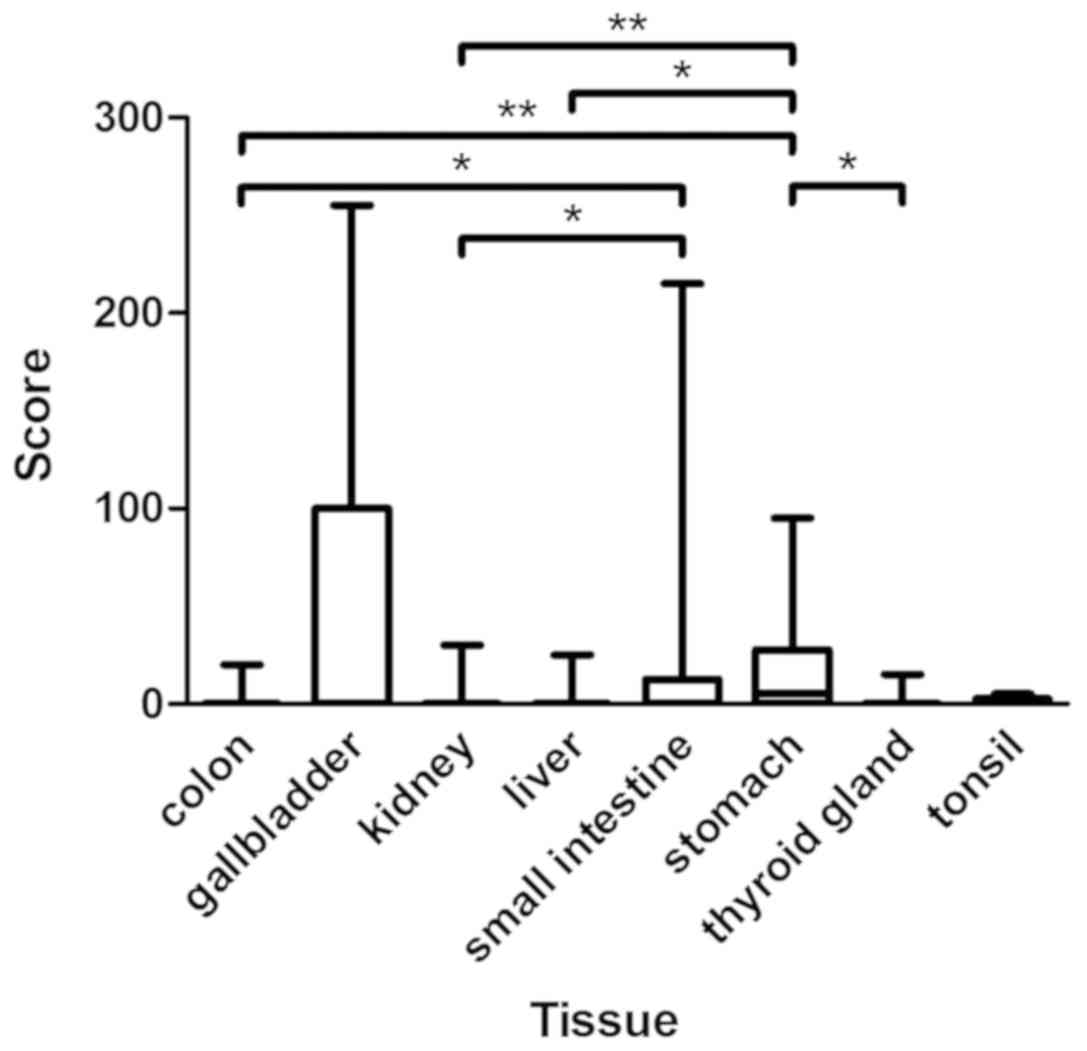 | Figure 2.Assessment of immunohistochemical
staining in CYP3A5-positive normal tissues included in TMA. The
figure presents the medians, 25 and 75th percentiles, and the
minimums and maximums of the scores in CYP3A5-positive normal
tissues of TMA. Medians: Colon 0, gallbladder 0, kidney 0, liver 0,
small intestine 0, stomach 5, thyroid gland 0, and tonsil 0.
*P<0.05 and **P<0.01, as indicated. CYP3A5, cytochrome P450
3A5; TMA, tissue microarrays. |
CYP3A5 expression in normal colon,
colorectal adenoma, and colorectal cancer
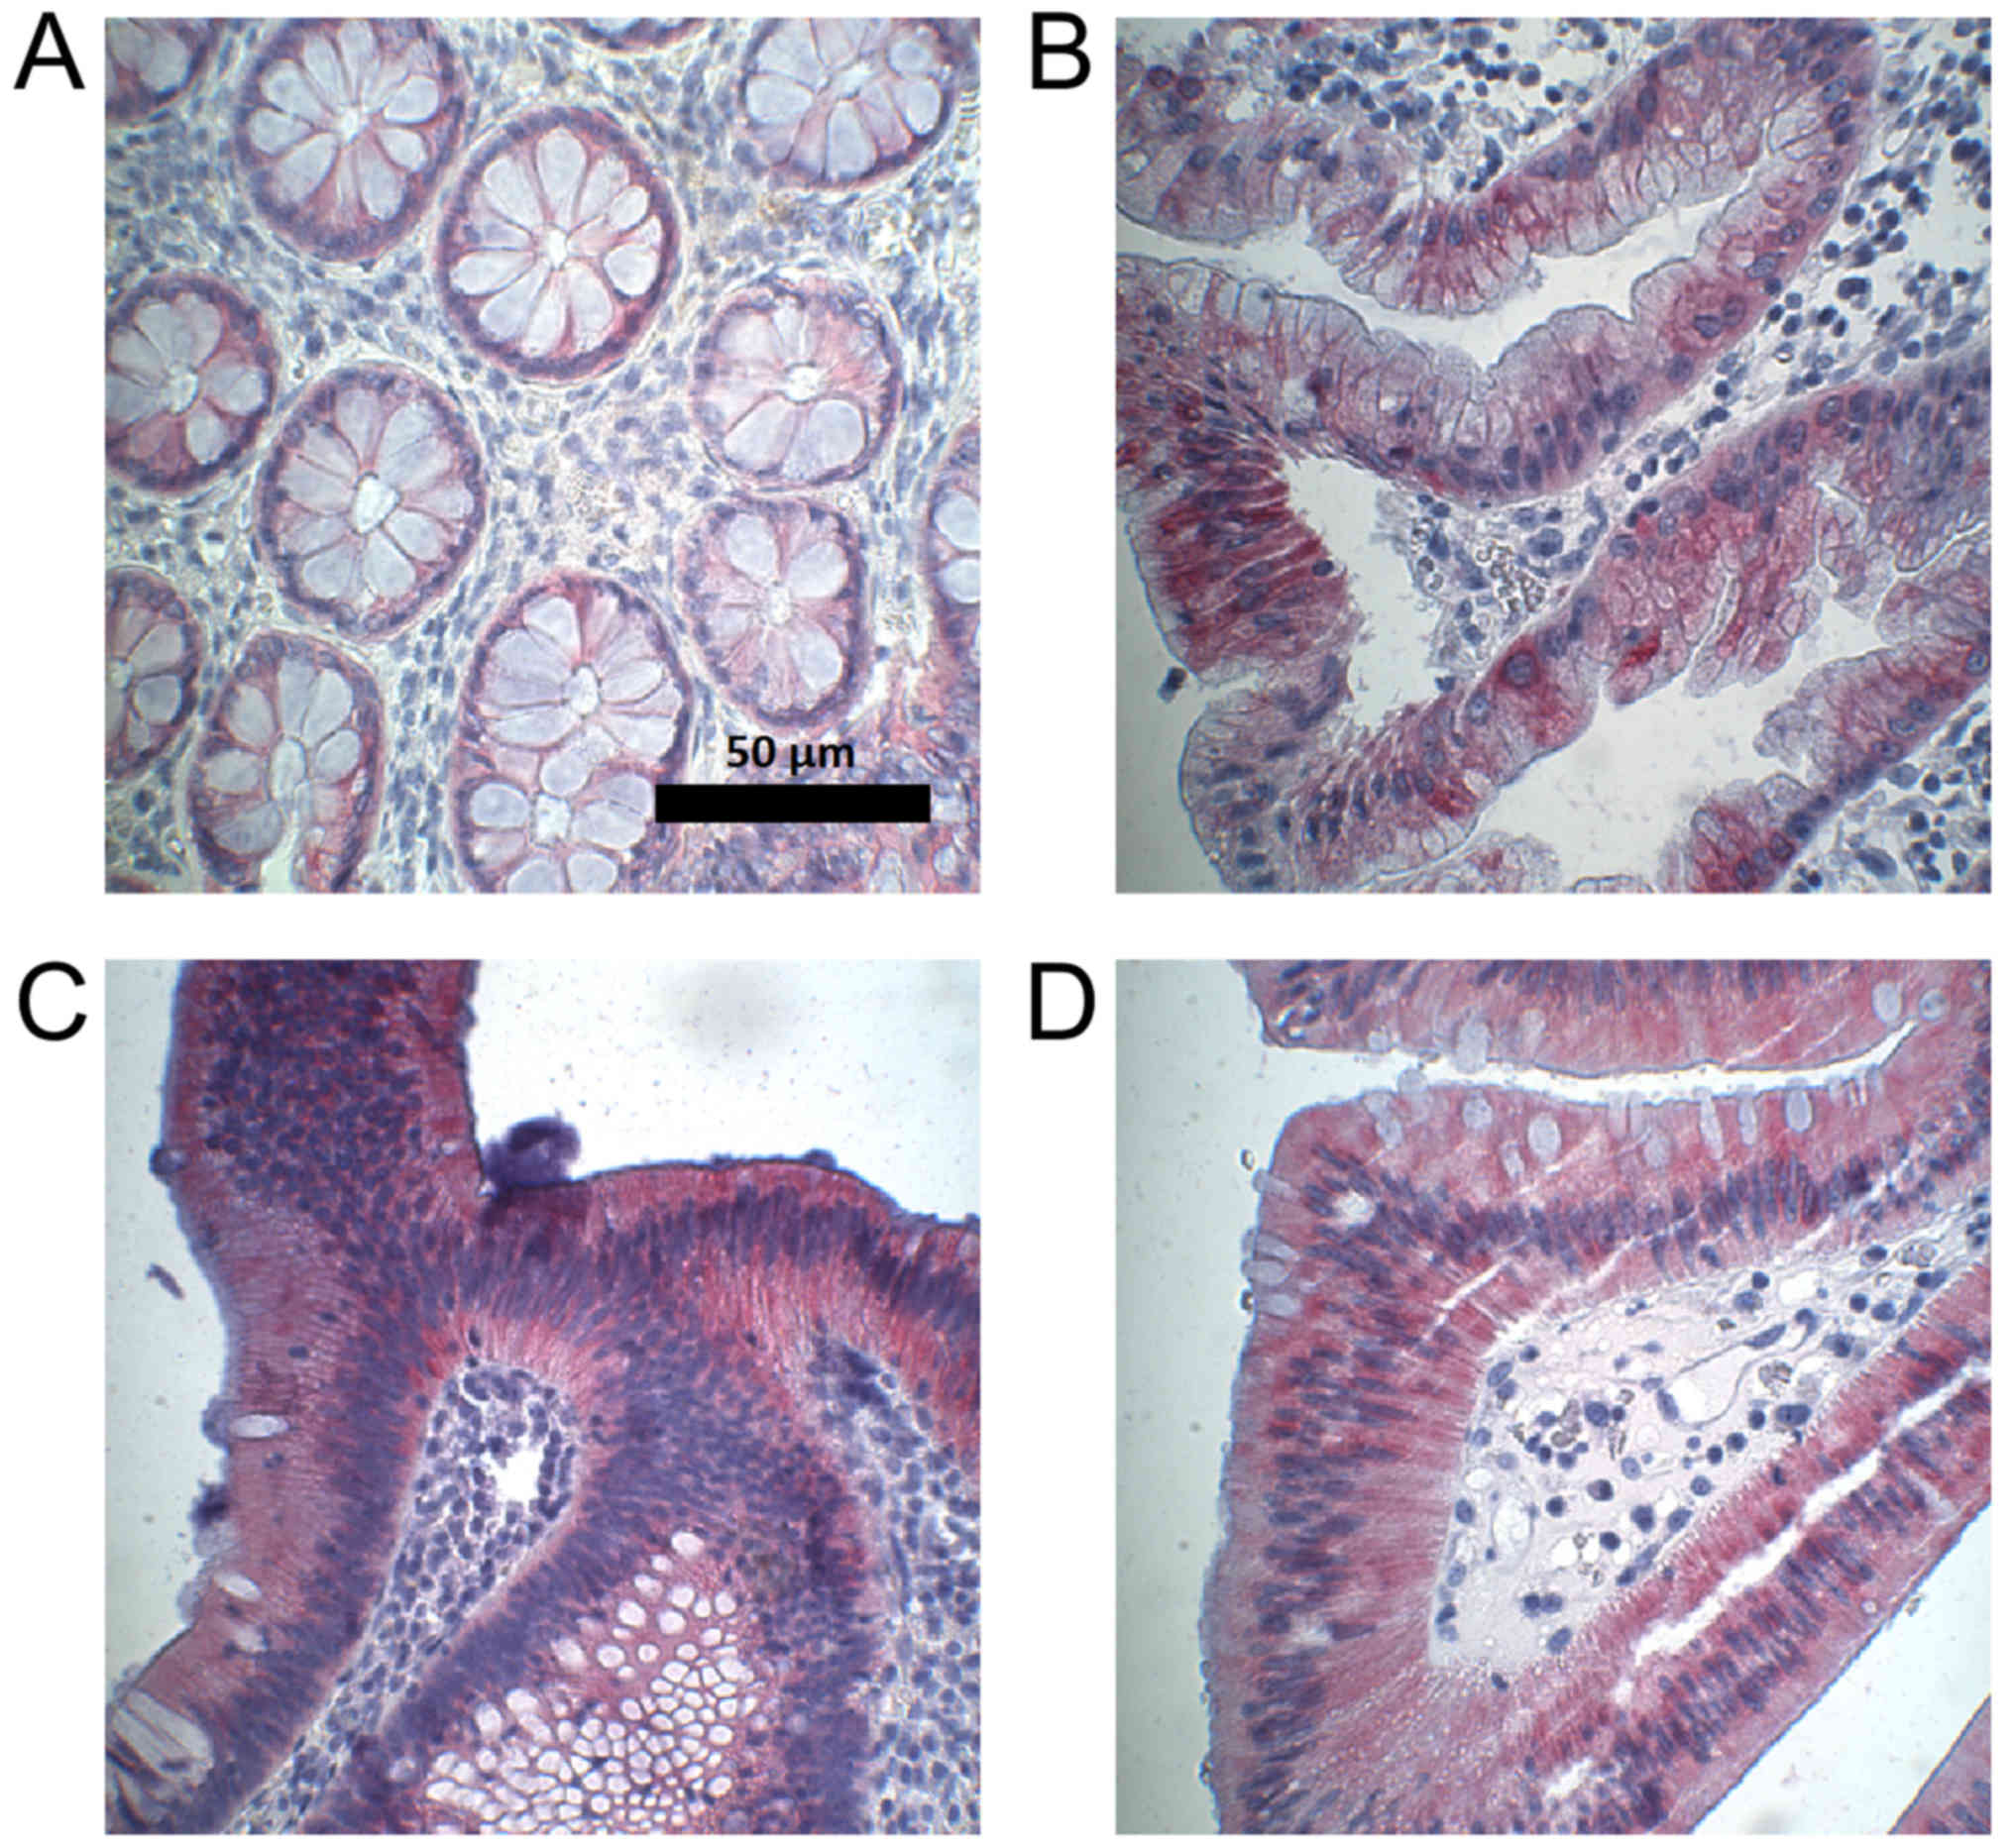
Expression of CYP3A5 was heterogeneously distributed
in normal colon, colorectal adenoma, and CRC. In principle,
expression was higher in apical epithelial cells compared to that
in epithelial cells located in the depths of the colonic crypts.
The results of the immunohistochemical assessment of CYP3A5
expression in these tissues are shown in Table II.
| Table II.Assessment of CYP3A5 staining in
normal colon, colorectal adenoma and colorectal cancer. |
Table II.
Assessment of CYP3A5 staining in
normal colon, colorectal adenoma and colorectal cancer.
| Tissue type | Median score | Score range | CYP3A5-positive
specimens, n (%) |
|---|
| Normal colon | 0 | 0–40 | 2
(13.3) |
| Colorectal
adenoma | 0 | 0–140 | 19 (42.2) |
| Sessile serrated
adenoma | 0 | 0–110 | 7
(46.7) |
| Tubular
adenoma | 10 | 0–120 | 8
(53.3) |
| Tubulovillous
adenoma | 0 | 0–140 | 4
(26.6) |
| Colorectal
cancer | 0 | 0–130 | 14 (21.5) |
| CRC: Primary
tumor | 0 | 0–130 | 9
(23.1) |
| CRC:
Metastasis | 0 | 0–180 | 5
(19.2) |
Medians of CYP3A5 expression in normal colon,
sessile serrated adenoma, and tubulovillous adenoma did not differ
(median, 0). However, expression of CYP3A5 in tubular adenoma
(median, 10) differed significantly from that in normal colon
(P=0.04). Expression of CYP3A5 was higher in colorectal adenoma
than in normal colon mucosa, with a difference that was close to
statistically significant (P=0.06). Figs. 4 and 5
provide an overview of the assessment of CYP3A5 expression in
normal colon and colorectal adenoma, as well as examples of CYP3A5
staining.
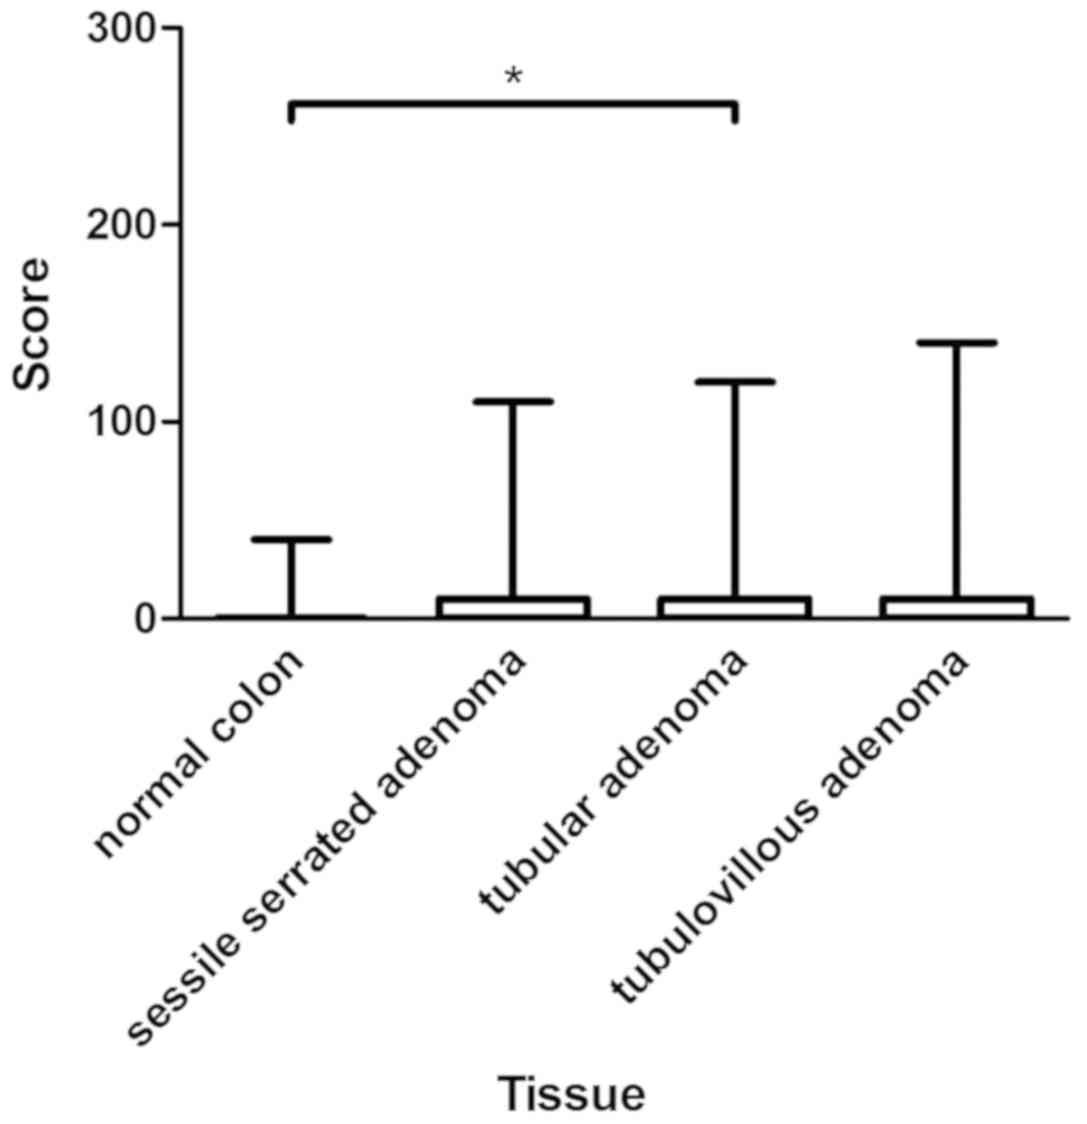 | Figure 4.Assessment of immunohistochemical
staining in normal colon and colon adenomas. The figure presents
the medians, 25 and 75th percentiles, and the minimums and maximums
of the scores in the normal colon (median, 0), sessile serrated
adenoma (median, 0), tubular adenoma (median, 10), and
tubulovillous adenoma (median, 0). *P<0.05, as indicated. |
In population P1, originating from 65 patients,
CYP3A5 was heterogeneously expressed in CRC tissues (Table II). Most CYP3A5-positive tissues
demonstrated spotty CYP3A5 expression. Individual CYP3A5-positive
cells were found in otherwise CYP3A5-negative tissues.
Primary cancer specimens and corresponding
metastases from 17 patients were compared. No statistically
significant differences in CYP3A5 expression were found.
CYP3A5 expression correlates with
tumor response to irinotecan therapy
Tissues of 61 patients were examined to determine
whether CYP3A5 expression correlated with tumor response to
irinotecan therapy (population P2). The clinical data of population
P2 are shown in Table III. Among
patients in this population, 4 (6.6%) showed CR, 22 (36.1%) PR, 17
(27.9%) SD, and 18 (29.5%) PD following the first irinotecan
treatment. Table IV lists the
distribution of CYP3A5-negative and -positive tissues as well as
the percentage of responders and non-responders for each
chemotherapy protocol.
| Table III.Clinical data of population P2. |
Table III.
Clinical data of population P2.
| Variable | CYP3A5-negative
tissue (n=47), n (%) | CYP3A5-positive
tissue (n=14), n (%) | Responders (CR +
PR) (n=26), n (%) | Non-responders (SD
+ PD) (%) (n=35), n (%) |
|---|
| Age at first
irinotecan therapy | mean, 61 years
(range, 23–76) | mean, 60 years
(range, 32–77) | mean, 61 years
(range, 43–76) | mean, 60 years
(range, 23–77) |
| Sex |
|
Male | 31 (66.0) | 9 (64.3) | 20 (76.9) | 20 (57.1) |
|
Female | 16 (34.0) | 5 (35.7) | 6 (23.1) | 15 (42.9) |
| Primary tumor
site |
|
Caecum | 6 (12.8) | 2 (14.3) | 2 (7.7) | 6 (17.1) |
|
Colon | 11 (23.4) | 3 (21.4) | 3 (11.5) | 11 (31.4) |
|
Sigmoid | 15 (31.9) | 3 (21.4) | 11 (42.3) | 7 (20.0) |
|
Rectosigmoid | 1 (2.1) | 0 (0) | 1 (3.8) | 0 (0) |
|
Rectum | 14 (29.8) | 6 (42.9) | 9 (34.6) | 11 (31.4) |
| KRAS status |
|
Mutated | 16 (34.0) | 7 (50) | 6 (23.1) | 17 (48.6) |
| Wild
type | 30 (63.8) | 7 (50) | 20 (76.9) | 17 (48.6) |
|
Unknown | 1 (2.1) | 0 (0) | 0 (0) | 1 (2.9) |
| Chemotherapy prior
to irinotecan treatment |
| No
prior therapy | 31 (66.0) | 9 (64.3) | 14 (53.8) | 26 (74.3) |
| Prior
chemotherapy | 16 (34.0) | 5 (35.7) | 12 (46.2) | 9 (25.7) |
| Table IV.Protocols of the first
irinotecan-based chemotherapy in population P2. |
Table IV.
Protocols of the first
irinotecan-based chemotherapy in population P2.
| Chemotherapy
protocol | CYP3A5-negative
tissue, n (%) | CYP3A5-positive
tissue, n (%) | Responders (CR +
PR), n (%) | Non-responders (SD
+ PD), n (%) |
|---|
| Fluoropyrimidine,
irinotecan | 6
(12.8) | 1 (7.1) | 1
(3.8) | 6
(17.1) |
| Fluoropyrimidine,
irinotecan, bevacizumab | 23 (48.9) | 7 (50.0) | 13 (50.0) | 17 (48.6) |
| Fluoropyrimidine,
irinotecan, cetuximab | 15 (31.9) | 5 (35.7) | 11 (42.3) | 9
(25.7) |
| Fluoropyrimidine,
irinotecan, oxaliplatin | 0
(0) | 1 (7.1) | 0
(0) | 1
(2.9) |
| Fluoropyrimidine,
irinotecan, oxaliplatin, bevacizumab | 2
(4.3) | 0 (0) | 0
(0) | 2
(5.7) |
| Fluoropyrimidine,
irinotecan, panitumumab | 1
(2.1) | 0 (0) | 1
(3.8) | 0
(0) |
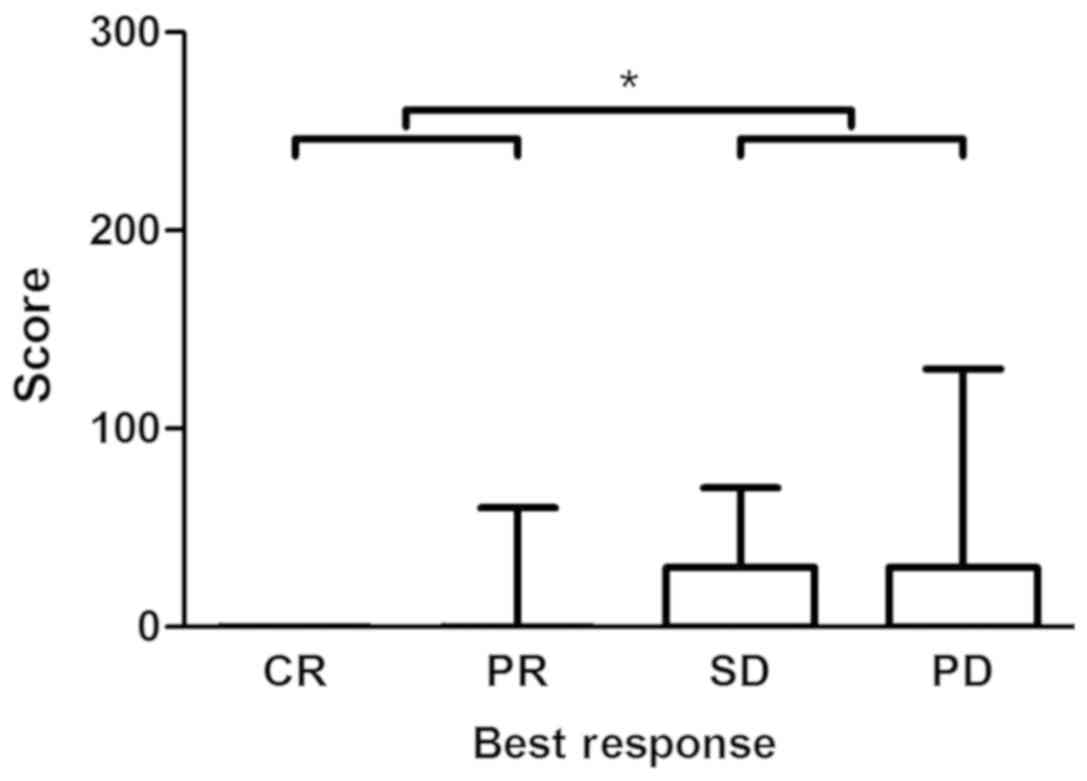
Spearman's rank correlation revealed a statistically
significant correlation (P=0.03) between CYP3A5 expression in CRC
tissue and tumor response to irinotecan treatment in population P2
(correlation coefficient, 0.276). A statistically significant
difference (P=0.02) in CYP3A5 expression was demonstrated between
responders (CR + PR) and non-responders (SD + PD) (Figs. 6 and 7).
Interestingly, no CYP3A5 was expressed in CRC
tissues with complete response to irinotecan therapy. The highest
CYP3A5 expression was observed in tumors progressing under
treatment.
In CRC tissues, no statistically significant
difference was observed in CYP3A5 expression before and after
treatment with irinotecan.
Discussion
Owing to the complex regulation of cytochrome
enzymes, the quantity of CYP3A5 mRNA does not correlate with the
expressed amount of cytochrome enzyme in normal colon and
colorectal adenoma tissue (19).
Therefore, we selected immunohistochemistry for detection of CYP3A5
protein expression.
Immunohistochemical assessment of CYP3A5 expression
in normal tissues had previously only been performed in stomach and
lung tissue. In the present study, we found that more than half of
the examined stomach tissues expressed CYP3A5 at low to moderate
intensity. In a previous study, Kolars et al (24) were not able to demonstrate CYP3A5
expression through immunohistochemical examination of the stomach
tissue of only one patient. In lung tissue,
immunohistochemistry-based studies found CYP3A5 to be the
predominant CYP3A enzyme (25,26),
while all of our lung specimens were CYP3A5-negative. These
conflicting results might result from methodological differences in
immunohistochemistry and the use of different antibodies.
In the present study, we observed the highest
expression of CYP3A5 in the small intestine, gallbladder, and
stomach. CYP3A5 was also expressed to a small extent in the liver,
kidney, and thyroid gland. CYP3A5 expression data in the small
intestine (27), liver (28–30),
kidney (31,32), and thyroid gland (29,30) is
so far limited to CYP3A5 mRNA analyses and/or CYP3A5 protein
immunoblots.
In accordance with the existing data (24), we observed no CYP3A5 expression in
the pancreas. While we could not demonstrate CYP3A5 expression in
the adrenal gland, endometrium, esophagus, heart, muscle,
myometrium, ovary, prostate, salivary gland, skin, spleen, testis,
thymus, or urothelium of the urinary bladder, expression of CYP3A5
mRNA has been described in these sites (30,33,34).
Expression of CYP3A5 in the gallbladder, tonsil, neurons, adipose
tissue, and appendix was examined for the first time in the present
study.
CYP3A5 expression in normal colon has been
investigated with a variety of different methods in the past
(17,18,27,35–37).
Consistent with the results of the present study, Kumarakulasingham
et al (20) observed weak
CYP3A5-positive staining in 25% of the examined colonic tissues
using immunohistochemistry.
CYP enzymes can be involved in the activation of
procarcinogens (38). Therefore, it
could be hypothesized that CYP3A5 accumulation in adenomas reflects
the dysplastic character of these lesions and facilitates the
transition to malignant tumors. Indeed, CYP3A5 expression in
colorectal adenoma was higher than that in normal colon, although
this difference did not reach statistical significance, possibly
owing to the small number of specimens in our analysis.
In contrast to the findings of the present study,
Bergheim et al (19) reported
54% lower expression of CYP3A5 in adenoma tissue and the
surrounding normal colon tissue compared to the expression in
patients without adenomas. Furthermore, CYP3A5 expression did not
differ between adenoma and surrounding normal colon tissue
(19). As colon adenomas and normal
colon tissue showed a patchy distribution of CYP3A5 expression,
quantification of CYP3A5 expression by western blot analysis of
lysates from the whole specimens, as performed by Bergheim et
al (19), might miss high
expression of the enzyme when restricted to small tissue
patches.
The risk of invasive carcinoma in colorectal
adenomas depends on the type of adenoma (39,40).
However, these different risks were not reflected by different
CYP3A5 expression levels in our study. The present study is the
first to compare CYP3A5 expression in different adenoma subtypes.
However, we did not find any obvious trends, suggesting that
differences in expression might instead by caused by
inter-individual differences.
Using immunohistochemistry, Kumarakulasingham et
al (20) reported CYP3A5
expression in ~65% of the CRC tissues, with most specimens
demonstrating low, and <5% showing high, CYP3A5 expression. In
an immunohistochemical analysis performed by Noll et al
(8), weak CYP3A5 expression was
found in 3 out of 8 specimens of adenocarcinoma of the rectum.
In the current study, the percentage of
CYP3A5-negative CRC tissues was greater than that previously
reported, possibly owing to our decision to consider specimens
CYP3A5-positive only when expression was observed in at least 10%
of the tissue.
While we found expression of CYP3A5 to be the same
in primary cancer and metastasis, Kumarakulasingham et al
(20) reported that expression in
primary cancer did not correspond to that in the respective lymph
node metastases. These conflicting observations could be caused by
the small, possibly not representative, specimens on the TMAs used
by Kumarakulasingham et al (20).
Non-responders to irinotecan expressed significantly
more CYP3A5 than responders. Therefore, a tumor-autonomous
CYP3A5-mediated resistance to irinotecan therapy is possible.
However, tumor samples in each response category contained
CYP3A5-negative tissues, suggesting that tumor response to
irinotecan therapy does not solely depend on CYP3A5 expression.
Further studies are required to validate a higher metabolism of
irinotecan in tumor tissue of non-responders to irinotecan
therapy.
We were unable to observe an induced CYP3A5
expression in CRC tissue as a response to irinotecan treatment
resulting in a secondary resistance in the clinical setting of our
study.
Although similar in histology, colorectal cancer is
a heterogeneous disease owing to molecular differences (11). The identification of biomarkers and
mutation analyses are becoming increasingly important for
prediction of outcome and therapy selection.
In the present study, we demonstrated for the first
time a statistically significant correlation between CYP3A5
expression and tumor response to irinotecan therapy, suggesting a
tumor-autonomous resistance to treatment with irinotecan through
increased CYP3A5-mediated metabolism.
Acknowledgements
The authors would like to thank Mrs. Jutta Mohr
(Department of Gastroenterology, University Hospital Heidelberg,
Heidelberg, Germany) for their technical support.
Funding
The present study was supported by the ‘Stiftung für
Krebs-und Scharlachforschung Mannheim’.
Availability of data and materials
The data generated and analyzed during this study
are available from the corresponding author on reasonable
request.
Authors' contributions
EB performed the immunohistochemical staining,
collected the patient information and analyzed the data. EB and RK
wrote the manuscript. MS established the immunohistochemistry. MMG
and EH provided the tissue samples and performed the pathological
analysis of the examined tissues. CG obtained the clinical data of
patients treated at the NCT Heidelberg. TFW and EB performed the
assessment of the radiological tumor response to treatment. TB and
EB performed the statistical analysis. RK was responsible for the
planning and supervision of the project, as well as the
interpretation of the results. All authors read and approved the
final manuscript.
Ethics approval and consent to
participate
Due to the retrospective nature of the present study
and the use of archive material, written informed consent from
patients was not required. The study, including the use of tissues
as well as patient data, was approved by the Ethics Committee of
the Medical Faculty of the University of Heidelberg (reference no.
206/2005; Heidelberg, Germany).
Patient consent for publication
Not applicable.
Competing interests
The authors declare that they have no competing
interests.
Glossary
Abbreviations
Abbreviations:
|
APC
|
7-ethyl-10
[4-N-(5-aminopentanoicacid)-1-piperidino]
carbonyloxycamptothecin
|
|
CR
|
complete response
|
|
CRC
|
colorectal cancer
|
|
CYP
|
cytochrome P450
|
|
DNA
|
deoxyribonucleic acid
|
|
EGFR
|
epidermal growth factor receptor
|
|
NPC
|
7-ethyl-10 [4-amino-1-piperidino]
carbonyloxycamptothecin
|
|
PD
|
progressive disease
|
|
PR
|
partial response
|
|
RECIST
|
Response Evaluation Criteria in Solid
Tumors
|
|
SD
|
stable disease
|
|
SN-38
|
7-ethyl-10-hydroxy-camptothecin
|
|
TMA
|
tissue microarray
|
|
VEGF
|
vascular endothelial growth factor
|
References
|
1
|
MacLeod SL, Nowell S, Massengill J, Jazieh
A, McClure G, Plaxco J, Kadlubar FF and Lan NP: Cancer therapy and
polymorphisms of cytochromes P450. Clin Chem Lab Med. 38:883–887.
2000. View Article : Google Scholar : PubMed/NCBI
|
|
2
|
Pavek P and Dvorak Z: Xenobiotic-induced
transcriptional regulation of xenobiotic metabolizing enzymes of
the cytochrome P450 superfamily in human extrahepatic tissues. Curr
Drug Metab. 9:129–143. 2008. View Article : Google Scholar : PubMed/NCBI
|
|
3
|
Ding X and Kaminsky LS: Human extrahepatic
cytochromes P450: Function in xenobiotic metabolism and
tissue-selective chemical toxicity in the respiratory and
gastrointestinal tracts. Annu Rev Pharmacol Toxicol. 43:149–173.
2003. View Article : Google Scholar : PubMed/NCBI
|
|
4
|
Krishna DR and Klotz U: Extrahepatic
metabolism of drugs in humans. Clin Pharmacokinet. 26:144–160.
1994. View Article : Google Scholar : PubMed/NCBI
|
|
5
|
Rochat B: Role of cytochrome P450 activity
in the fate of anticancer agents and in drug resistance: Focus on
tamoxifen, paclitaxel and imatinib metabolism. Clin Pharmacokinet.
44:349–366. 2005. View Article : Google Scholar : PubMed/NCBI
|
|
6
|
Michael M and Doherty MM: Tumoral drug
metabolism: Overview and its implications for cancer therapy. J
Clin Oncol. 23:205–229. 2005. View Article : Google Scholar : PubMed/NCBI
|
|
7
|
Yu LJ, Matias J, Scudiero DA, Hite KM,
Monks A, Sausville EA and Waxman DJ: P450 enzyme expression
patterns in the NCI human tumor cell line panel. Drug Metab Dispos.
29:304–312. 2001.PubMed/NCBI
|
|
8
|
Noll EM, Eisen C, Stenzinger A, Espinet E,
Muckenhuber A, Klein C, Vogel V, Klaus B, Nadler W, Rösli C, et al:
CYP3A5 mediates basal and acquired therapy resistance in different
subtypes of pancreatic ductal adenocarcinoma. Nat Med. 22:278–287.
2016. View
Article : Google Scholar : PubMed/NCBI
|
|
9
|
Torre LA, Bray F, Siegel RL, Ferlay J,
Lortet-Tieulent J and Jemal A: Global cancer statistics, 2012. CA
Cancer J Clin. 65:87–108. 2015. View Article : Google Scholar : PubMed/NCBI
|
|
10
|
Ahmed S, Johnson K, Ahmed O and Iqbal N:
Advances in the management of colorectal cancer: From biology to
treatment. Int J Colorectal Dis. 29:1031–1042. 2014. View Article : Google Scholar : PubMed/NCBI
|
|
11
|
Ciombor KK, Wu C and Goldberg RM: Recent
therapeutic advances in the treatment of colorectal cancer. Annu
Rev Med. 66:83–95. 2015. View Article : Google Scholar : PubMed/NCBI
|
|
12
|
Gustavsson B, Carlsson G, Machover D,
Petrelli N, Roth A, Schmoll HJ, Tveit KM and Gibson F: A review of
the evolution of systemic chemotherapy in the management of
colorectal cancer. Clin Colorectal Cancer. 14:1–10. 2015.
View Article : Google Scholar : PubMed/NCBI
|
|
13
|
Glimelius B: Benefit-risk assessment of
irinotecan in advanced colorectal cancer. Drug Saf. 28:417–433.
2005. View Article : Google Scholar : PubMed/NCBI
|
|
14
|
Schmoll HJ, Van Cutsem E, Stein A,
Valentini V, Glimelius B, Haustermans K, Nordlinger B, van de Velde
CJ, Balmana J, Regula J, et al: ESMO consensus guidelines for
management of patients with colon and rectal cancer. A personalized
approach to clinical decision making. Ann Oncol. 23:2479–2516.
2012. View Article : Google Scholar : PubMed/NCBI
|
|
15
|
Paulik A, Grim J and Filip S: Predictors
of irinotecan toxicity and efficacy in treatment of metastatic
colorectal cancer. Acta Medica (Hradec Kralove). 55:153–159. 2012.
View Article : Google Scholar : PubMed/NCBI
|
|
16
|
Lamba JK, Lin YS, Schuetz EG and Thummel
KE: Genetic contribution to variable human CYP3A-mediated
metabolism. Adv Drug Deliv Rev. 54:1271–1294. 2002. View Article : Google Scholar : PubMed/NCBI
|
|
17
|
Lown KS, Bailey DG, Fontana RJ, Janardan
SK, Adair CH, Fortlage LA, Brown MB, Guo W and Watkins PB:
Grapefruit juice increases felodipine oral availability in humans
by decreasing intestinal CYP3A protein expression. J Clin Invest.
99:2545–2553. 1997. View Article : Google Scholar : PubMed/NCBI
|
|
18
|
Bergheim I, Bode C and Parlesak A:
Distribution of cytochrome P450 2C, 2E1, 3A4, and 3A5 in human
colon mucosa. BMC Clin Pharmacol. 5:42005. View Article : Google Scholar : PubMed/NCBI
|
|
19
|
Bergheim I, Bode C and Parlesak A:
Decreased expression of cytochrome P450 protein in non-malignant
colonic tissue of patients with colonic adenoma. BMC Gastroenterol.
5:342005. View Article : Google Scholar : PubMed/NCBI
|
|
20
|
Kumarakulasingham M, Rooney PH, Dundas SR,
Telfer C, Melvin WT, Curran S and Murray GI: Cytochrome p450
profile of colorectal cancer: Identification of markers of
prognosis. Clin Cancer Res. 11:3758–3765. 2005. View Article : Google Scholar : PubMed/NCBI
|
|
21
|
Dong N, Meng F, Wu Y, Wang M, Cui Y and
Zhang S: Genetic polymorphisms in cytochrome P450 and clinical
outcomes of FOLFIRI chemotherapy in patients with metastatic
colorectal cancer. Tumour Biol. 36:7691–7698. 2015. View Article : Google Scholar : PubMed/NCBI
|
|
22
|
Koschny R, Krupp W, Xu LX, Mueller WC,
Bauer M, Sinn P, Keller M, Koschny T, Walczak H, Bruckner T, et al:
WHO grade related expression of TRAIL-receptors and apoptosis
regulators in meningioma. Pathol Res Pract. 211:109–116. 2015.
View Article : Google Scholar : PubMed/NCBI
|
|
23
|
Eisenhauer EA, Therasse P, Bogaerts J,
Schwartz LH, Sargent D, Ford R, Dancey J, Arbuck S, Gwyther S,
Mooney M, et al: New response evaluation criteria in solid tumours:
Revised RECIST guideline (version 1.1). Eur J Cancer. 45:228–247.
2009. View Article : Google Scholar : PubMed/NCBI
|
|
24
|
Kolars JC, Lown KS, Schmiedlin-Ren P,
Ghosh M, Fang C, Wrighton SA, Merion RM and Watkins PB: CYP3A gene
expression in human gut epithelium. Pharmacogenetics. 4:247–259.
1994. View Article : Google Scholar : PubMed/NCBI
|
|
25
|
Anttila S, Hukkanen J, Hakkola J,
Stjernvall T, Beaune P, Edwards RJ, Boobis AR, Pelkonen O and
Raunio H: Expression and localization of CYP3A4 and CYP3A5 in human
lung. Am J Respir Cell Mol Biol. 16:242–249. 1997. View Article : Google Scholar : PubMed/NCBI
|
|
26
|
Raunio H, Hakkola J, Hukkanen J, Lassila
A, Päivärinta K, Pelkonen O, Anttila S, Piipari R, Boobis A and
Edwards RJ: Expression of xenobiotic-metabolizing CYPs in human
pulmonary tissue. Exp Toxicol Pathol. 51:412–417. 1999. View Article : Google Scholar : PubMed/NCBI
|
|
27
|
Thörn M, Finnström N, Lundgren S, Rane A
and Lööf L: Cytochromes P450 and MDR1 mRNA expression along the
human gastrointestinal tract. Br J Clin Pharmacol. 60:54–60. 2005.
View Article : Google Scholar : PubMed/NCBI
|
|
28
|
Westlind-Johnsson A, Malmebo S, Johansson
A, Otter C, Andersson TB, Johansson I, Edwards RJ, Boobis AR and
Ingelman-Sundberg M: Comparative analysis of CYP3A expression in
human liver suggests only a minor role for CYP3A5 in drug
metabolism. Drug Metab Dispos. 31:755–761. 2003. View Article : Google Scholar : PubMed/NCBI
|
|
29
|
Koch I, Weil R, Wolbold R, Brockmöller J,
Hustert E, Burk O, Nuessler A, Neuhaus P, Eichelbaum M, Zanger U
and Wojnowski L: Interindividual variability and tissue-specificity
in the expression of cytochrome P450 3A mRNA. Drug Metab Dispos.
30:1108–1114. 2002. View Article : Google Scholar : PubMed/NCBI
|
|
30
|
Bièche I, Narjoz C, Asselah T, Vacher S,
Marcellin P, Lidereau R, Beaune P and de Waziers I: Reverse
transcriptase-PCR quantification of mRNA levels from cytochrome
(CYP)1, CYP2 and CYP3 families in 22 different human tissues.
Pharmacogenet Genomics. 17:731–742. 2007. View Article : Google Scholar : PubMed/NCBI
|
|
31
|
Haehner BD, Gorski JC, Vandenbranden M,
Wrighton SA, Janardan SK, Watkins PB and Hall SD: Bimodal
distribution of renal cytochrome P450 3A activity in humans. Mol
Pharmacol. 50:52–59. 1996.PubMed/NCBI
|
|
32
|
Givens RC, Lin YS, Dowling AL, Thummel KE,
Lamba JK, Schuetz EG, Stewart PW and Watkins PB: CYP3A5 genotype
predicts renal CYP3A activity and blood pressure in healthy adults.
J Appl Physiol (1985). 95:1297–1300. 2003. View Article : Google Scholar : PubMed/NCBI
|
|
33
|
Baron JM, Höller D, Schiffer R,
Frankenberg S, Neis M, Merk HF and Jugert FK: Expression of
multiple cytochrome p450 enzymes and multidrug
resistance-associated transport proteins in human skin
keratinocytes. J Invest Dermatol. 116:541–548. 2001. View Article : Google Scholar : PubMed/NCBI
|
|
34
|
Lechevrel M, Casson AG, Wolf CR, Hardie
LJ, Flinterman MB, Montesano R and Wild CP: Characterization of
cytochrome P450 expression in human oesophageal mucosa.
Carcinogenesis. 20:243–248. 1999. View Article : Google Scholar : PubMed/NCBI
|
|
35
|
Gervot L, Carrière V, Costet P, Cugnenc
PH, Berger A, Beaune PH and de Waziers I: CYP3A5 is the major
cytochrome P450 3A expressed in human colon and colonic cell lines.
Environ Toxicol Pharmacol. 2:381–388. 1996. View Article : Google Scholar : PubMed/NCBI
|
|
36
|
McKinnon RA, Burgess WM, Gonzalez FJ and
McManus ME: Metabolic differences in colon mucosal cells. Mutat
Res. 290:27–33. 1993. View Article : Google Scholar : PubMed/NCBI
|
|
37
|
Windmill KF, McKinnon RA, Zhu X, Gaedigk
A, Grant DM and McManus ME: The role of xenobiotic metabolizing
enzymes in arylamine toxicity and carcinogenesis: Functional and
localization studies. Mutat Res. 376:153–160. 1997. View Article : Google Scholar : PubMed/NCBI
|
|
38
|
Sheweita SA: Drug-metabolizing enzymes:
Mechanisms and functions. Curr Drug Metab. 1:107–132. 2000.
View Article : Google Scholar : PubMed/NCBI
|
|
39
|
Erichsen R, Baron JA, Hamilton-Dutoit SJ,
Snover DC, Torlakovic EE, Pedersen L, Frøslev T, Vyberg M, Hamilton
SR and Sørensen HT: Increased risk of colorectal cancer development
among patients with serrated polyps. Gastroenterology.
150:895–902.e5. 2016. View Article : Google Scholar : PubMed/NCBI
|
|
40
|
Nusko G, Mansmann U, Partzsch U,
Altendorf-Hofmann A, Groitl H, Wittekind C, Ell C and Hahn EG:
Invasive carcinoma in colorectal adenomas: Multivariate analysis of
patient and adenoma characteristics. Endoscopy. 29:626–631. 1997.
View Article : Google Scholar : PubMed/NCBI
|