Introduction
Oesophageal cancer remains a major national and
global health problem. In the United States in 2016, oesophageal
cancer accounted for >15,000 mortalities (1). In China in 2015, the incidence of
oesophageal cancer was ~478,000, and the number of mortalities was
estimated to be ~375,000 (2).
Surgery, chemotherapy and radiotherapy are the primary strategies
for patient treatment at present (3). Radiation therapy has broad applications
as a vital strategy for shrinking tumours or treating regional
disease in oesophageal cancer (4).
Current technologies employed in radiotherapy have led to a number
of advanced methods for improving treatment; however, the prognosis
of oesophageal cancer remains poor, and the sensitivity of patients
towards radiation is unknown (5). In
the transition towards an era of personalized medicine, a powerful
tool that assists clinicians in assessing which individuals are
likely to be benefit from radiotherapy does not exist. In
consideration of the heterogeneity between various tumour types,
even for patients with the same tumour type, prognostic and
therapy-predictive molecular markers are essential to improve
decisions regarding cancer therapy. At the molecular level,
numerous genes are responsive to radiation exposure, and a recent
study proposed that identifying the gene signature may predict
precise radiotherapy (6). In the
past few decades, predictive radiosensitivity techniques have been
developed and tested (7). In cell
line experiments, the values of the surviving fraction of cells at
[2] Gy(SF)2, SF5 and SF8 are defined as indicators for
distinguishing radiosensitivity (RS) and radioresistance (RR),
whereas patients are defined as RS and RR based on the clinical
outcome (overall survival and recurrence rate) (8). However, the majority of studies on the
radiosensitivity of oesophageal cancer are primarily dependent on
high-throughput microarrays to assay differential gene expression
between RS and RR oesophageal cancer cell lines, and different cell
lines predict markedly different RS and RR biomarkers (9–11).
Although these studies may contribute to an improved understanding
of the biological mechanisms underlying the development and
progression of cancer to a certain extent, it is difficult to
practically apply these to clinical decision-making on whether
radiotherapy is an appropriate means of treatment, based on the
mixed results of in vitro assays.
In the present study, two common radiosensitive gene
signatures, which were previously validated by clinical data, were
utilised (6,7). The two types of gene signatures from
different sources of radiosensitive genes were used to analyse the
gene expression and clinical data of patients with oesophageal
cancer. Eschrich et al (12)
and Kim et al (13) proposed
two different gene signatures for predicting radiosensitivity.
Eschrich et al (12) used a
panel of 48 human cancer cell lines to propose a radiosensitivity
index (RSI), which was modelled as a function of the combination of
gene expression, tissue of origin, and ras and p53
status to correlate the surviving fraction of cells at 2Gy(SF2).
The model developed by Eschrich et al (12) predicted an RSI (10 genes), which was
directly proportional to tumour radioresistance (12). A high level of RSI represents
radioresistance, thus allowing for the successful prediction of a
number of types of primary cancer (14–20).
Although the authors previously predicted the radiosensitivity of
oesophageal cancer, the sample sizes were too small (n=12), and
this may have resulted in a poor prediction of the overall survival
of the 12 patients with oesophageal cancer (21). Kim et al (13) proposed a radiosensitivity gene
signature which included 31 genes based on the integrated results
of four different microarray experiments. The gene signature
demonstrated promising results for predicting the radiosensitivity
of cancer cells; however, it has only been validated in
glioblastoma. Therefore, in the present study, RSI and the 31-gene
signature have been utilized to predict the outcomes of patients
with oesophageal cancer using data obtained from The Cancer Genomic
Atlas (TCGA).
Patients with cancer who respond to radiotherapy
typically exhibit a favourable prognosis compared with those with a
radioresistant cancer. Therefore, it is hypothesized that the gene
expression profile of patients with oesophageal cancer may allow
for the classification of individuals into RS and RR groups. In the
present study, a 31-gene signature and RSI were used as predictive
biomarkers for predicting the overall survival of patients with
oesophageal cancer. The results obtained from the two different
types of radiosensitivity gene signatures utilised did not exhibit
any overlap. Thus, the signatures were combined to improve the
estimation of overall survival in patients with oesophageal cancer,
based on a dataset obtained from TCGA. The dataset contained
information on 152 patients who received radiotherapy (https://xenabrowser.net/datapages/?cohort=GDC%20TCGA%20Esophageal%20Cancer%20(ESCA)&removeHub=https%3A%2F%2Fxena.treehouse.gi.ucsc.edu%3A443).
Multivariate Cox regression analyses were used to determine the key
genes for predicting RS and RR in patients with oesophageal
cancer.
Materials and methods
Clinical data and gene expression data
collection
Data of patients with oesophageal cancer were
downloaded from TCGA data portal (https://portal.gdc.cancer.gov/). Among the cases with
the gene expression profiles and clinical indexes, there were 152
cases with effective radiotherapy information, which were used for
further analysis. The gene signatures associated with
radiosensitivity were aggregated from two previous publications
(12,13) and there were no instances of overlap
in the gene signatures. Eschrich et al (12) indicated a linear combination of 10
genes for predicting RS and RR, whereas Kim et al (13) identified 31 genes integrated from
four different platforms for classifying the level of sensitivity
of cancer cell lines after receiving radiotherapy.
Statistical analysis for clinical data
and gene expression data
Univariate survival analysis was used to determine
thedemographic and clinical factors associated with the overall
survival time of patients with oesophageal cancer among 8 factors:
Age, sex, histological type, radiotherapy, tumour status, smoking
history, alcohol history, and Tumor-Node-Metastasis (TNM) stage.
Only clinical factors with P≤0.05 (log-rank test) were analysed
using a multivariate Cox regression analysis. The correlation
between overall survival time and gene expression using the
univariate Cox regression for each gene from the two gene
signatures was used to obtain a prognostic index (PI) derived from
the linear combination of gene expression and the coefficient of
Cox regression.
To generate an improved model of biomarkers for
predicting the RS or RR classification of patients with oesophageal
cancer, the two gene signatures were combined into a novel model.
Multivariate Cox regression was used to calculate the P-value of
the combination of all the genes in the 41-gene signature. A
combined gene-signature from two sources was used. One part of gene
signature was obtained from 10 radiosensitive biomarkers and the
other part was obtained from 31 radiosensitive biomarkers. Genes
with P<0.1 were selected using multivariate Cox regression
(22,23). These genes were used as a gene
signature for predicting RS and RR. The PI values derived from
different gene combinations were ranked according to the hazard
ratio (HR) and P-value of the log-rank test. The high-risk and
low-risk groups divided by the median PI value, which was estimated
by the HR and the P-value of the log-rank test. Thus, a higher HR
and smaller P-value represented an improved PI.
RSI
RSI is a rank-based linear regression algorithm
proposed by Eschrich et al (12): RSI=−0.0090008 × androgen receptor
(AR)+0.0128283 × transcription factor AP-1
(JUN)+0.0254552 × signal transducer and activator of
transcription 1 (STAT1)−0.0017589 × protein kinase C β
type−0.0038171 × transcription factor p65 + 0.1070213 ×
tyrosine protein kinase ABL1 (ABL1)−0.0002509 × small
ubiquitin-related modifier 1–0.0092431 ×
serine/threonine-protein kinase PAK 2 (PAK2)−0.0204469 ×
histone deacetylase 1−0.0441683 × interferon regulatory
factor 1.
According to Eschrich et al (12), the lower quartile of RSI was
pre-defined as the cut-off point to divide patients into
radiosensitive or radioresistant groups.
As an evaluation criterion and a corresponding
value, the area under the curve (AUC) of the receiver-operator
characteristic (ROC) curve, which is applied to assess the capacity
and efficiency of a gene signature for classifying patient outcome,
was utilized in the present study to verify the integrated gene
signature.
Prognosis index for oesophageal
cancer
As an integrated indicator of gene signature for
individual patients, the PI was calculated using a linear
combination of the expression value of the feature genes weighted
by the Cox regression coefficient. Multivariate stepwise Cox
regression was additionally used to analyse the clinical factors
that were significantly associated with overall survival time by
univariate survival analysis. In univariate survival analysis,
log-rank test P<0.05 was considered as significance factors. The
clinical variables and combination gene signature with a
multivariate Cox regression significance of P≤0.1 were considered
as important predictors of oesophageal cancer prognosis (23), and the PI was defined as follows:
PI=β1X1+β2X2+…,+
βiXi; where βi is the Cox
regression coefficient of the ith variable, Xi is
the value of the ith variable and was the
log2-transformed expression value of each gene, and
βi was the Cox regression coefficient of the ith
gene.
Estimating PI with different RS gene
signatures
Patients with oesophageal cancer were classified
into two groups (RS and RR) based on the median value of the PI
(median PI value, 0.52). Kaplan-Meier curves and a two-sided
log-rank test were used to compare the corresponding overall
survival time and the difference in distribution of the two
groups.
Gene Ontology (GO) enrichment
GO enrichment was used to analyse the functions of
the genes in the 41-gene signature. Database for Annotation,
Visualization and Integrated Discovery (DAVID; david.abcc.ncifcrf.gov) was used to examine the gene
ontology of the selected RNAs by choosing ‘Homo sapiens’ and
subsequently searching the terms ‘GO TERM_BP_FAT’, ‘GO
TERM_CC_FAT’, and ‘GO TERM_MF_FAT’ for the next step in the
analysis (24,25). Abbreviations are defined as follows:
BP, biological process; MF, molecular function; CC, cellular
component; and FAT, function annotation chart. A Fisher's exact
test was used to determine the significant categories.
Gene set enrichment analysis
(GSEA)
GSEA (www.broadinstitute.org/gsea) was performed using
MSigDB C2 curated Kyoto Encyclopaedia of Genes and Genomes v5.2,
and gene sets with a false discovery rate (FDR) value <0.1 after
1,000 permutations were considered to be significantly enriched
(26). Additionally, GSEA was used
to examine the differences in oesophageal cancer pathways between
the RS and RR groups.
Programme implementation
The aforementioned univariate Cox regression,
multivariate Cox regression and Kaplan-Meier survival curves for
overall survival were analysed using R (version 3.2.4; www.R-project.org) (27) with R studio (version 1.1.463)
(28) and the ‘survival’ package
(5). The ROC curve was plotted using
the ‘survival ROC’ package (29). Log-rank test is used to test the
significance of Kaplan-Meier curve (23) and Wald test is used to test Cox
regression (30).
Results
Clinical characteristics of patients
with oesophageal cancer
The clinical data of oesophageal cancer patients in
TCGA are summarized in Table I. In
total, eight clinical factors (age, sex, histological type,
radiotherapy, tumour status, smoking history, alcohol history and
TNM stage) were used for survival analysis.
 | Table I.Clinical traits of oesophagus cancer
with radiotherapy in The Cancer Genome Atlas database. |
Table I.
Clinical traits of oesophagus cancer
with radiotherapy in The Cancer Genome Atlas database.
| Factors | Death/patients | Median survival
time | 95% CI | Log-rank | Multivariate Cox
P-value |
|---|
| Age |
|
|
|
|
|
|
≤60.5 | 30/77 | 1,263 | 557-NA | 0.711 | 0.441 |
|
>60 | 30/75 | 764 | 650-NA |
|
|
| Sex |
|
|
|
|
|
|
Female | 5/20 | NA | 1,458-NA | 0.144 | 0.790 |
|
Male | 55/132 | 764 | 610–1,361 |
|
|
| Histological
type |
|
|
|
|
|
|
Oesophagus adenocarcinoma, not
otherwise specified | 34/75 | 951 | 600-NA | 0.84 | 0.243 |
|
Oesophagus squamous cell
carcinoma | 26/77 | 764 | 567-NA |
|
|
| Radiotherapy |
|
|
|
|
|
|
Yes | 8/31 | 855 | 610–1,458 | 0.379 | 0.133 |
| No | 52/121 | 764 | 567-NA |
|
|
| Tumour status |
|
|
|
|
|
| With
tumour | 43/66 | 600 | 484–855 | 0.00162 | 0.855 |
|
Tumour-free | 16/81 | NA | 1,458-NA |
| 0.660 |
|
Unknown | 1/5 | 730 | NA |
|
|
| Smoking
history |
|
|
|
|
|
| ≤15
years | 13/29 | 567 | 283-NA | 0.0156 | 0.557 |
| >15
years | 9/27 | 1,402 | 730-NA |
| 0.090 |
|
Duration not specified | 0/2 | NA | NA |
| 0.998 |
| Current
smoker | 14/32 | 855 | 378-NA |
| 0.356 |
|
Lifelong non-smoker | 9/45 | NA | NA |
| 0.014a |
|
Unknown | 15/17 | 610 | 435–987 |
|
|
| Alcohol
history |
|
|
|
|
|
|
Yes | 37/107 | 1,361 | 694-NA | 0.249 |
|
| No | 23/48 | 600 | 480-NA |
|
|
|
Unknown | 0/2 | NA | NA |
|
|
| TNM stage |
|
|
|
|
|
| Stage
0 | 1/1 | 480 | NA | 0.00045 | 0.873 |
| Stage
I | 5/19 | 1,781 | 1402 |
| 0.031a |
| Stage
II | 18/62 | 987 | 764-NA |
| 0.051 |
| Stage
III | 23/50 | 694 | 484-NA |
| 0.337 |
| Stage
IV | 6/6 | 322 | 136-NA |
| 0.958 |
|
Unknown | 7/14 | 283 | 161-NA |
|
|
In the present study, seven variables (age, gender,
histological type, tumour status, smoking history, alcohol history
and TNM stage) were tested for their association with survival.
Table I demonstrates that tumour
status, smoking history and TNM stage were significantly associated
with overall survival in patients with oesophageal cancer in
univariate survival analysis (log-rank test, P<0.05).
Multivariate Cox regression analysis of these factors suggested TNM
stage was correlated with overall survival time, and TNM stage I
was closely associated with survival time (Table I). There was no significant
difference in TCGA between oesophageal cancer patients treated with
and without radiotherapy, and fewer patients received
radiotherapy.
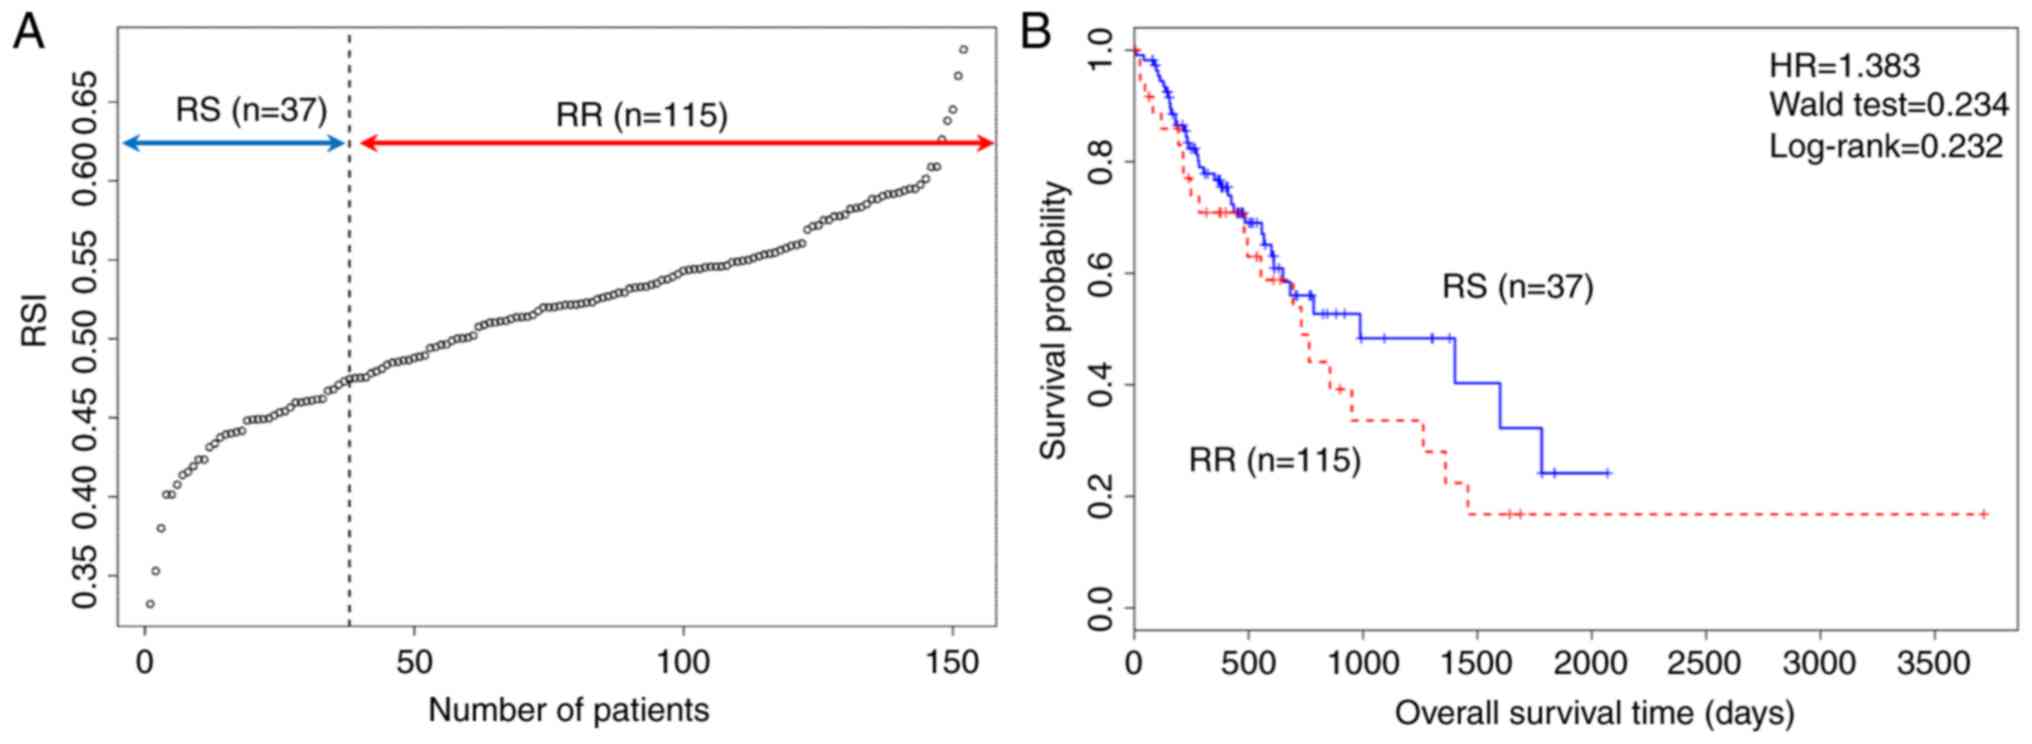
Standard RSI for estimating RS and RR
groups
The RSI was calculated in 152 patients with
oesophageal cancer, classifying patients into two groups (RS, 25%;
RR, 75%) and the cut off point for classification was 0.474. The
overall survival of the two groups using a Kaplan-Meier plot is
presented in Fig. 1, and the plot
suggested that standard RSI was not able to satisfactorily predict
overall survival of patients with oesophageal cancer.
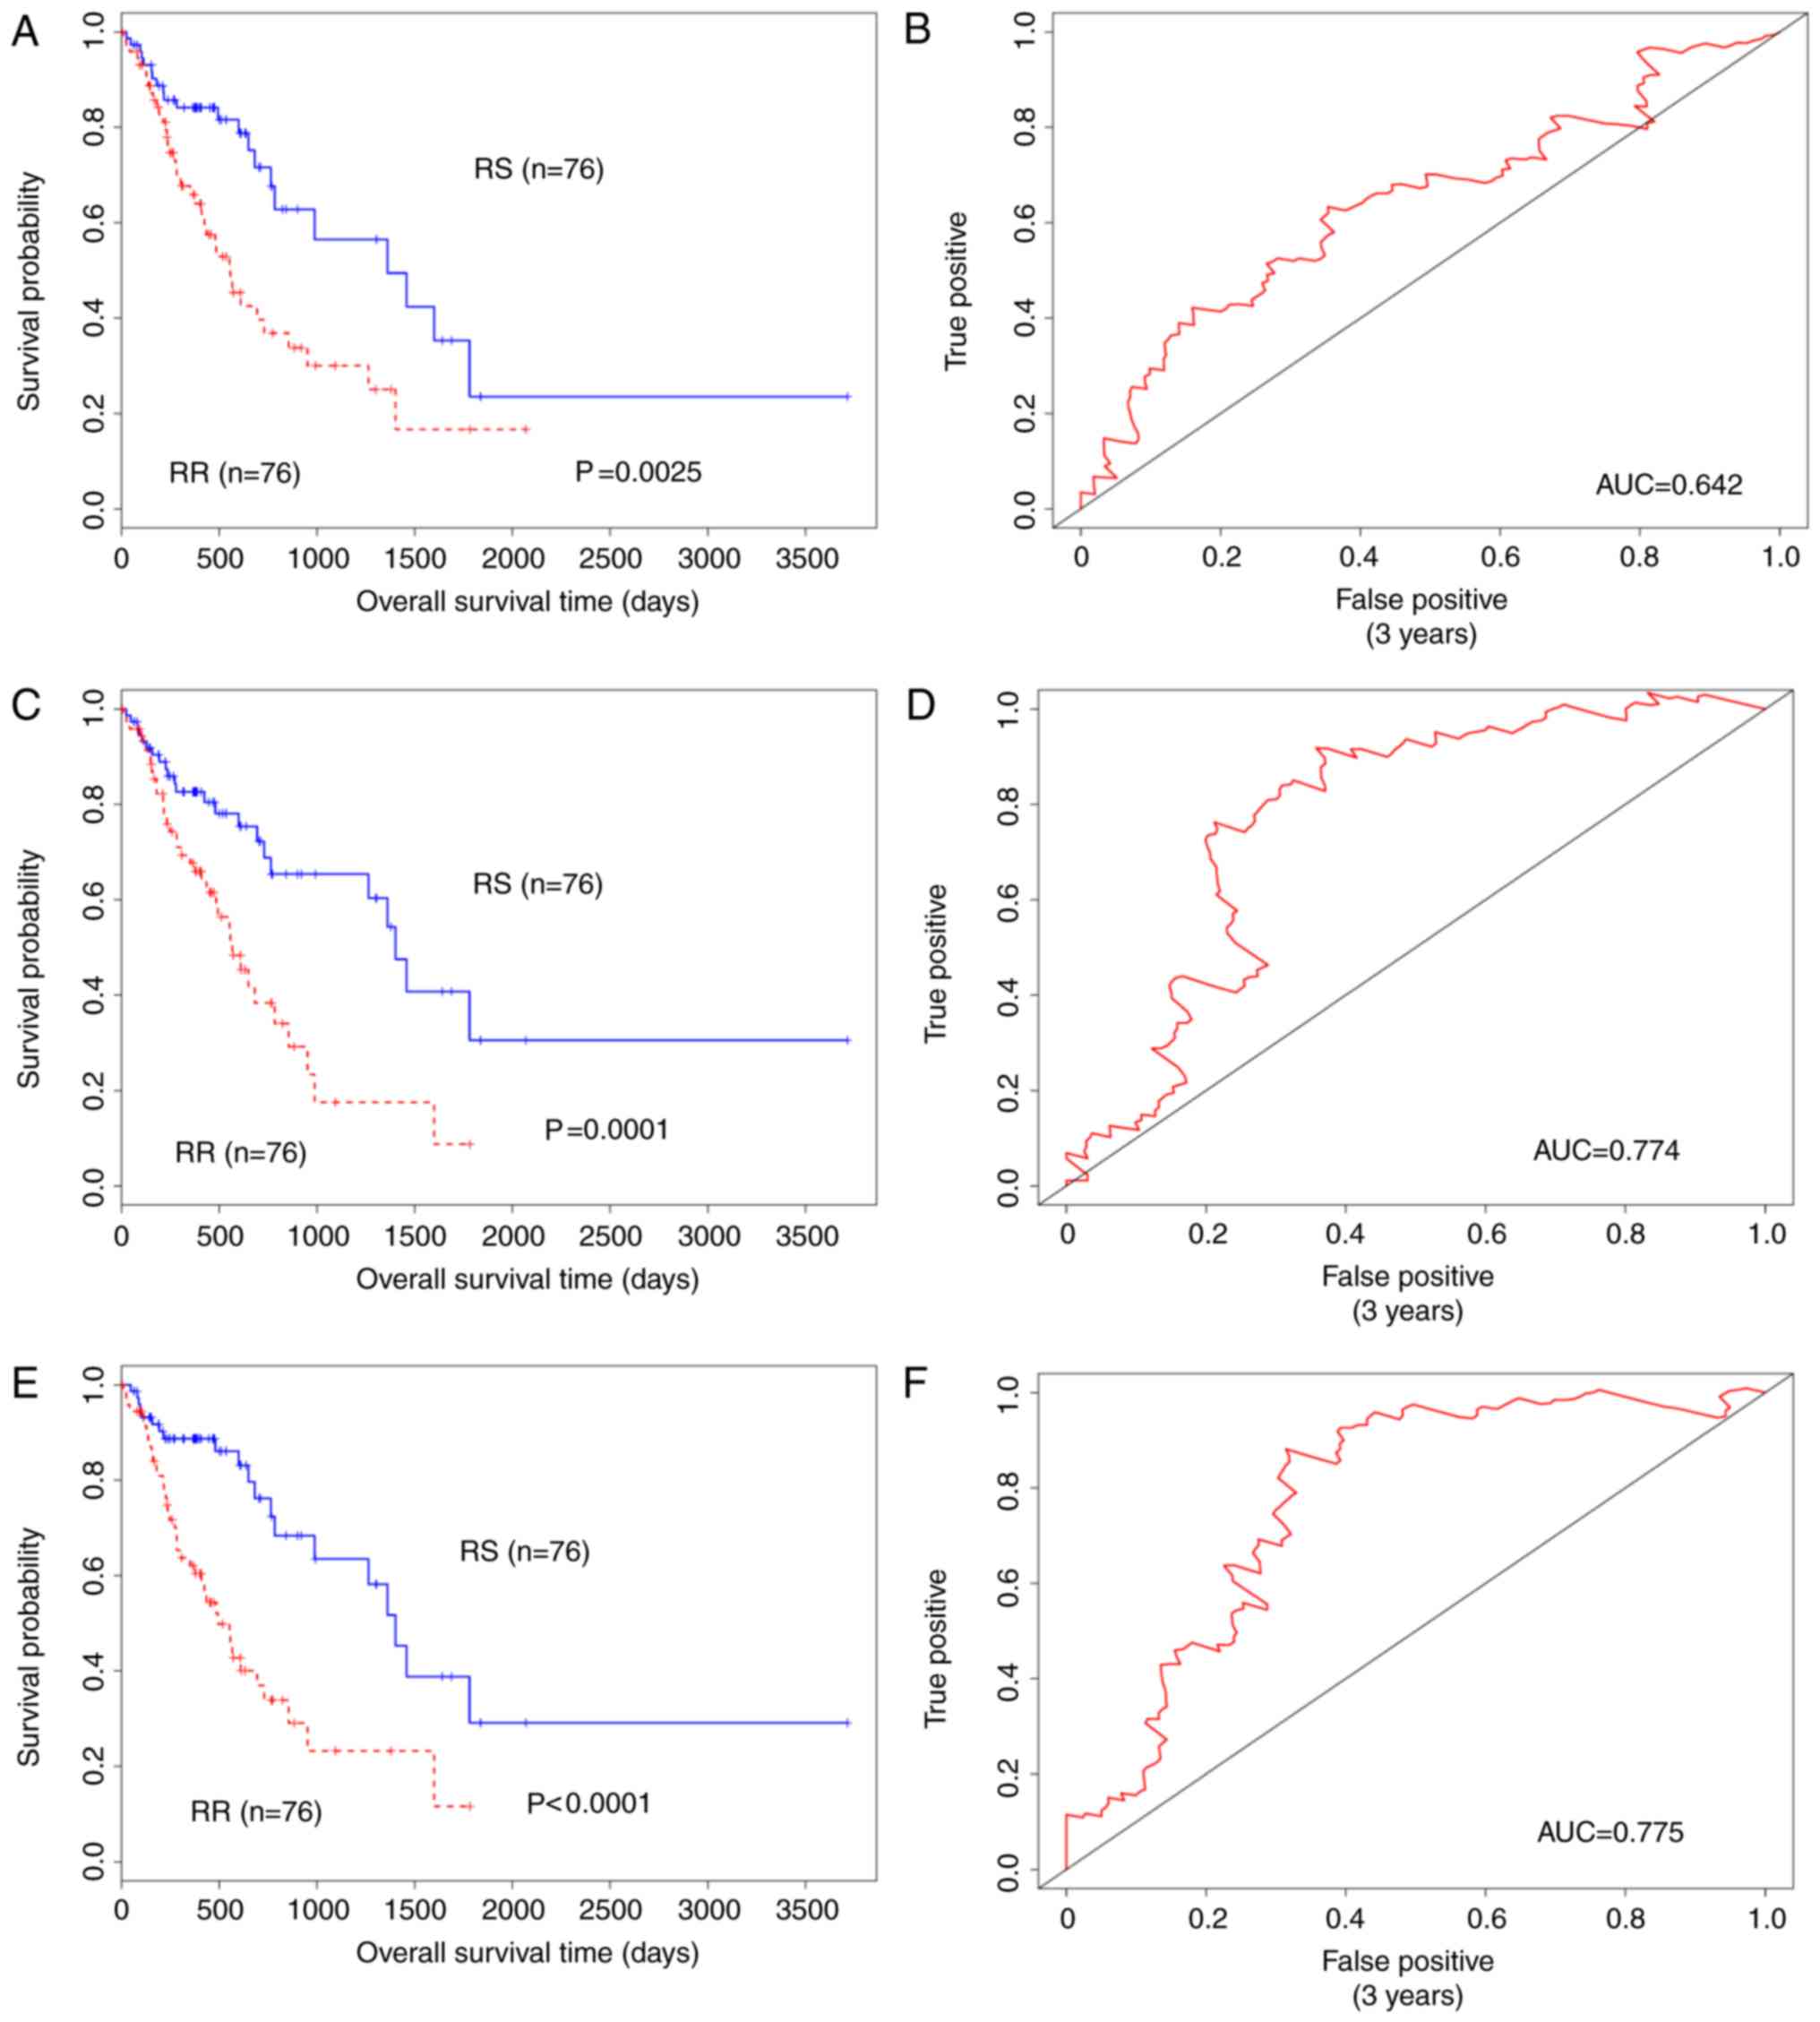
Gene signature for predicting
prognosis in TCGA oesophageal cancer cohort
Considering that the RSI did not predict overall
survival, the PI of two independent gene signatures and their
integration was calculated and analysed. First, the ten genes from
RSI were used to perform univariate Cox regression (Table II). Subsequently, the 31-gene
signature combination was analysed by univariate Cox regression in
addition to the former analysis (Table
III). The present study proposed that these genes may be
biomarkers for predicting RR and RS in several cell lines. In the
current study, Jun proto-oncogene, AP-1 transcription factor
subunit (JUN), interferon regulatory factor 1 (IRF1) and pirin
(PIR) were significantly associated with survival in oesophageal
cancer (P<0.05; Tables II and
III). Of the three genes, JUN is
closely associated with tumour development (29) and IRF1 is a radioresistance biomarker
(28). The gene PIR has rarely been
reported to be associated with oesophageal cancer. PIR may act as a
redox sensor for the nuclear factor κβ and is involved in stress
responses (30). The present study
revealed that not all genes associated with survival in oesophageal
cancer (P>0.05). Therefore, two gene signatures for predicting
RS and RR for oesophageal cancer were proposed. To identify the
core genes for predicting prognosis, multivariate Cox regression
was used to filter combination genes (41 genes), obtaining six
genes with a P<0.1 as a cut-off threshold (Table IV). However, analysis of the core
genes demonstrated that their combination was not significantly
associated with overall survival time (HR, 0.638; 95% CI;
0.380–1.070; P=0.089; Wald test; Table
V). To separate the patients into RS and RR, the median value
of PI was selected (Fig. 2).
| Table II.Radiosensitivity index (10-gene
signature) for predicting radiosensitivity. |
Table II.
Radiosensitivity index (10-gene
signature) for predicting radiosensitivity.
| Gene symbol | Uniprot accession
no. | Description | Univariate Cox
P-value | Coefficient | Hazard ratio | 95% CI |
|---|
| AR | P10275 | Androgen
receptor | 0.078 | −1.331 | 0.264 | 0.06–1.16 |
| JUN | P05412 | Transcription
factor AP-1 | 0.039 | 0.301 | 1.351 | 1.01–1.80 |
| STAT1 | P42224 | Signal transducer
and activator of transcription 1-alpha/beta | 0.622 | 0.067 | 1.069 | 0.81–1.40 |
| PRKCB | P05771 | Protein kinase C
beta type | 0.836 | 0.031 | 1.03 | 0.76–1.40 |
| RELA | Q04206 | Transcription
factor p65 | 0.501 | −0.238 | 0.789 | 0.39–1.58 |
| ABL1 | P00519 |
| 0.745 | −0.102 | 0.903 | 0.49–1.67 |
| SUMO1 | P63165 | Small
ubiquitin-related modifier 1 | 0.567 | 0.164 | 1.180 | 0.67–2.07 |
| PAK2 | Q13177 |
Serine/threonine-protein kinase PAK 2 | 0.995 | −0.002 | 0.998 | 0.64–1.57 |
| HDAC1 | Q13547 | Histone deacetylase
1 | 0.317 | 0.266 | 1.305 | 0.77–2.20 |
| IRF1 | P10914 | Interferon
regulatory factor 1 | 0.035 | 0.305 | 1.357 | 1.02–1.80 |
| Table III.A 31-gene signature for predicting
radiosensitivity. |
Table III.
A 31-gene signature for predicting
radiosensitivity.
| Gene symbol | Uniprot accession
no. | Description | Univariate Cox
P-value | Coefficient | Hazard ratio | 95% CI |
|---|
| ACTN1 | P12814 |
Alpha-actinin-1 | 0.746 | −0.054 | 0.947 | 0.68–1.31 |
| ANXA2 | P07355 | Annexin A2 | 0.102 | −0.299 | 0.741 | 0.52–1.06 |
| ANXA5 | P14668 | Annexin A5 | 0.588 | −0.097 | 0.907 | 0.64–1.29 |
| ARHGDIB | P52566 | Rho
GDP-dissociation inhibitor 2 | 0.285 | 0.136 | 1.145 | 0.89–1.47 |
| CAPNS1 | P04632 | Calpain small
subunit 1 | 0.629 | 0.138 | 1.148 | 0.66–2.01 |
| CBR1 | P16152 | Carbonyl reductase
[NADPH] 1 | 0.791 | 0.031 | 1.032 | 0.82–1.30 |
| CCND1 | P24385 | G1/S-specific
cyclin-D1 | 0.900 | 0.012 | 1.012 | 0.84–1.22 |
| CD63 | P08962 | CD63 antigen | 0.687 | 0.075 | 1.077 | 0.75–1.55 |
| CORO1A | P31146 | Coronin-1A | 0.248 | 0.141 | 1.152 | 0.91–1.46 |
| CXCR4 | P61073 | C-X-C chemokine
receptor type 4 | 0.756 | −0.029 | 0.971 | 0.81–1.17 |
| DAG1 | Q14118 | Dystroglycan | 0.197 | −0.200 | 0.818 | 0.60–1.11 |
| EMP2 | P54851 | Epithelial membrane
protein 2 | 0.983 | 0.003 | 1.003 | 0.76–1.31 |
| HCLS1 | P14317 | Hematopoietic
lineage cell-specific protein | 0.088 | 0.187 | 1.206 | 0.97–1.49 |
| HTRA1 | Q92743 | Serine protease
HTRA1 | 0.210 | 0.163 | 1.177 | 0.91–1.52 |
| ITGB5 | P18084 | Integrin
beta-5 | 0.874 | −0.032 | 0.969 | 0.65–1.43 |
| LAPTM5 | Q13571 |
Lysosomal-associated transmembrane 5
protein | 0.121 | 0.152 | 1.164 | 0.96–1.41 |
| LRMP | Q12912 | Lymphoid-restricted
membrane protein | 0.553 | 0.086 | 1.089 | 0.82–1.45 |
| MYB | P10242 | Transcriptional
activator Myb | 0.932 | −0.008 | 0.992 | 0.82–1.02 |
| PFN2 | P35080 | Profilin-2 | 0.518 | 0.056 | 1.058 | 0.89–1.25 |
| PIR | O00625 | Pirin | 0.043 | 0.237 | 1.268 | 1.01–1.59 |
| PKM2 | P14618 | Pyruvate kinase
PKM | 0.985 | 0.003 | 1.003 | 0.70–1.43 |
| PTMS | P04550 | Parathymosin | 0.290 | 0.176 | 1.192 | 0.86–1.65 |
| PTPRC | P08575 | Receptor-type
tyrosine-protein phosphatase C | 0.350 | 0.096 | 1.100 | 0.90–1.34 |
| PTPRCAP | Q14761 | Protein tyrosine
phosphatase receptor | 0.435 | 0.085 | 1.089 | 0.88–1.35 |
| PYGB | P11216 | Glycogen
phosphorylase, brain form type C-associated protein | 0.622 | −0.063 | 0.939 | 0.73–1.21 |
| RAB13 | P51153 | Ras-related protein
Rab-13 | 0.965 | 0.012 | 1.012 | 0.59–1.72 |
| RALB | P11234 | Ras-related protein
Ral-B | 0.724 | −0.077 | 0.926 | 0.60–1.42 |
| SCRN1 | Q12765 | Secernin-1 | 0.683 | 0.060 | 1.062 | 0.80–1.42 |
| SQSTM1 | Q13501 | Sequestosome-1 | 0.218 | 0.197 | 1.218 | 0.89–1.67 |
| TWF1 | Q12792 | Twinfilin-1 | 0.277 | 0.282 | 1.325 | 0.79–2.20 |
| WAS | P42768 | Wiskott-Aldrich
syndrome protein | 0.246 | 0.137 | 1.147 | 0.91–1.45 |
| Table IV.Genes determined to be significant
based on univariate Cox regression of the combined 41-gene
signature. |
Table IV.
Genes determined to be significant
based on univariate Cox regression of the combined 41-gene
signature.
| Gene symbol | Uniprot accession
no. | Description | Multivariate cox
P-value | Coefficient | Hazard ratio | 95% CI |
|---|
| ANXA5 | P14668 | Annexin A5 | 0.068 | −0.688 | 0.526 | 0.24–1.05 |
| TWF1 | Q12792 | Twinfilin-1 | 0.074 | 0.832 | 2.299 | 0.92–5.73 |
| AR | P10275 | Androgen
receptor | 0.009 | −4.625 | 0.010 | 0.00–0.31 |
| JUN | P05412 | Transcription
factor AP-1 | 0.093 | 0.387 | 1.472 | 0.94–2.31 |
| STAT1 | P42224 | Signal transducer
and activator of transcription 1-alpha/beta | 0.041 | −0.646 | 0.515 | 0.27–0.97 |
| IRF1 | P10914 | Interferon
regulatory factor 1 | 0.011 | 0.878 | 2.405 | 1.22–4.74 |
| Table V.Cox regression analysis of prognosis
index of all the different of gene signatures. |
Table V.
Cox regression analysis of prognosis
index of all the different of gene signatures.
| PI in Type of
radiosensitivity genes | Number of
genes | HR | 95% CI | P-value |
|---|
| Standard RSI | 10 | 1.383 | 0.810–2.362 | 0.232 |
| PI of RSI | 10 | 2.218 | 1.307–3.764 | 0.003 |
| 31-gene
signature | 31 | 2.402 | 1.410–4.093 | 0.001 |
| RSI+31-gene
signature | 41 | 2.967 | 1.717–5.127 |
9.71×10⁻⁵ |
| Multivariate Cox
screen | 6 | 0.6380 | 0.380–1.070 | 0.089 |
As a linear combination of the expression values of
10 genes, the PI of RSI, calculated by the aforementioned formula,
was significantly relevant with overall survival time (HR, 2.218,
95% CI, 1.307–3.764; P=0.0025, Wald test; Table V). The PI of the 31-gene signature
was also significantly associated with overall survival time (HR,
2.402; 95% CI, 1.410–4.093; P=0.001; Wald test; Table V). The RSI and the 31-gene signature
were combined and the aforementioned process was used to calculate
the PI. The results demonstrated that the PI of the combination was
more significantly associated with overall survival time compared
with RSI or the 31-gene signature alone (HR, 2.967; 95% CI,
1.717–5.127; P=4.66×10⁻⁵; Wald test; Table V). As demonstrated in the survival
analysis and Fig. 2, the RS group
had an improved prognosis compared with the RR group, particularly
when considering the effect of the combination of RSI and the
31-gene signature, which had the highest HR and the most
significant P-value. Therefore, the 41-gene signature may be the
best biomarker for classifying patients with oesophageal cancer
into RS or RR groups.
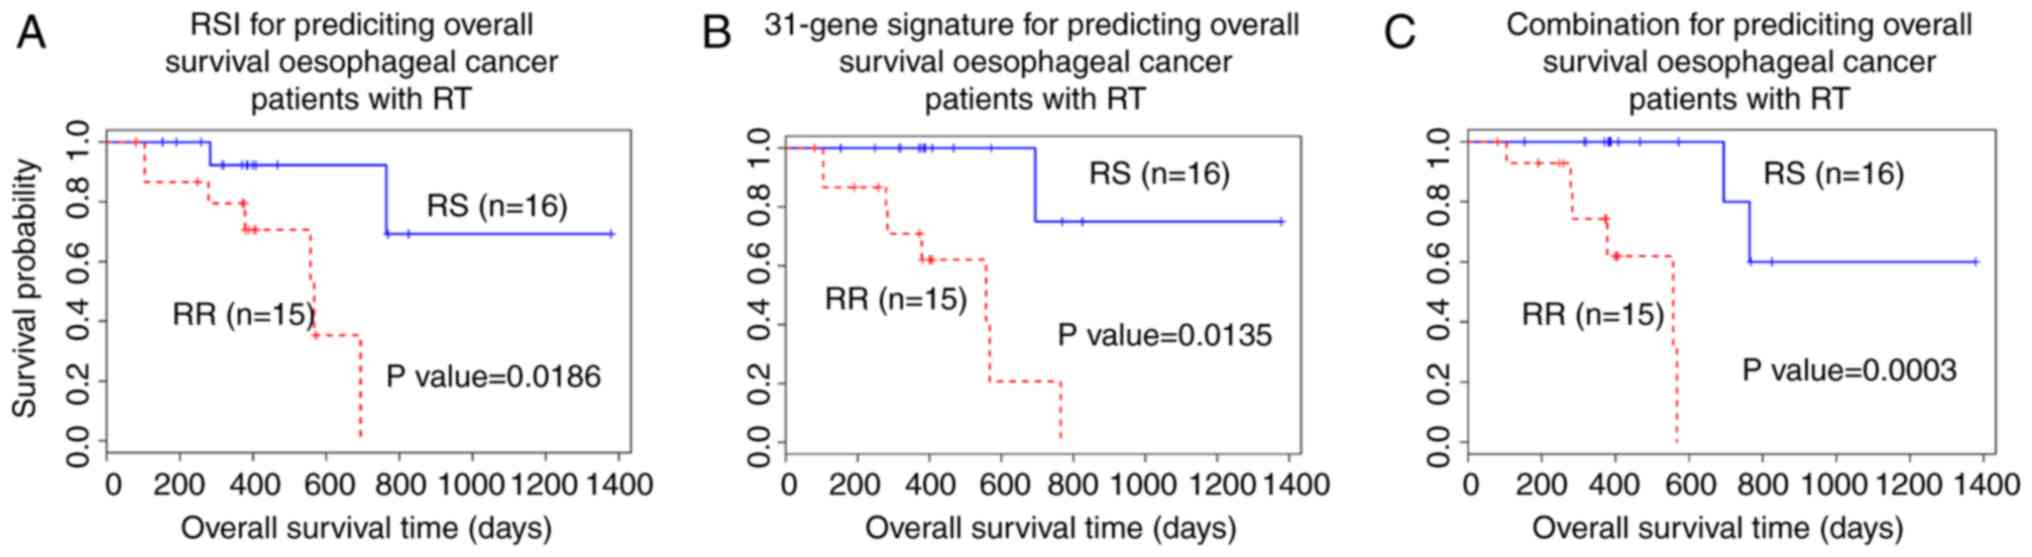
Gene signature validation in patients
who had received radiotherapy
For further validation of the effectiveness and
performance of the two independent gene signature and combination
models, samples from 31 patients who had received radiotherapy were
selected for assessment (Fig.
3).
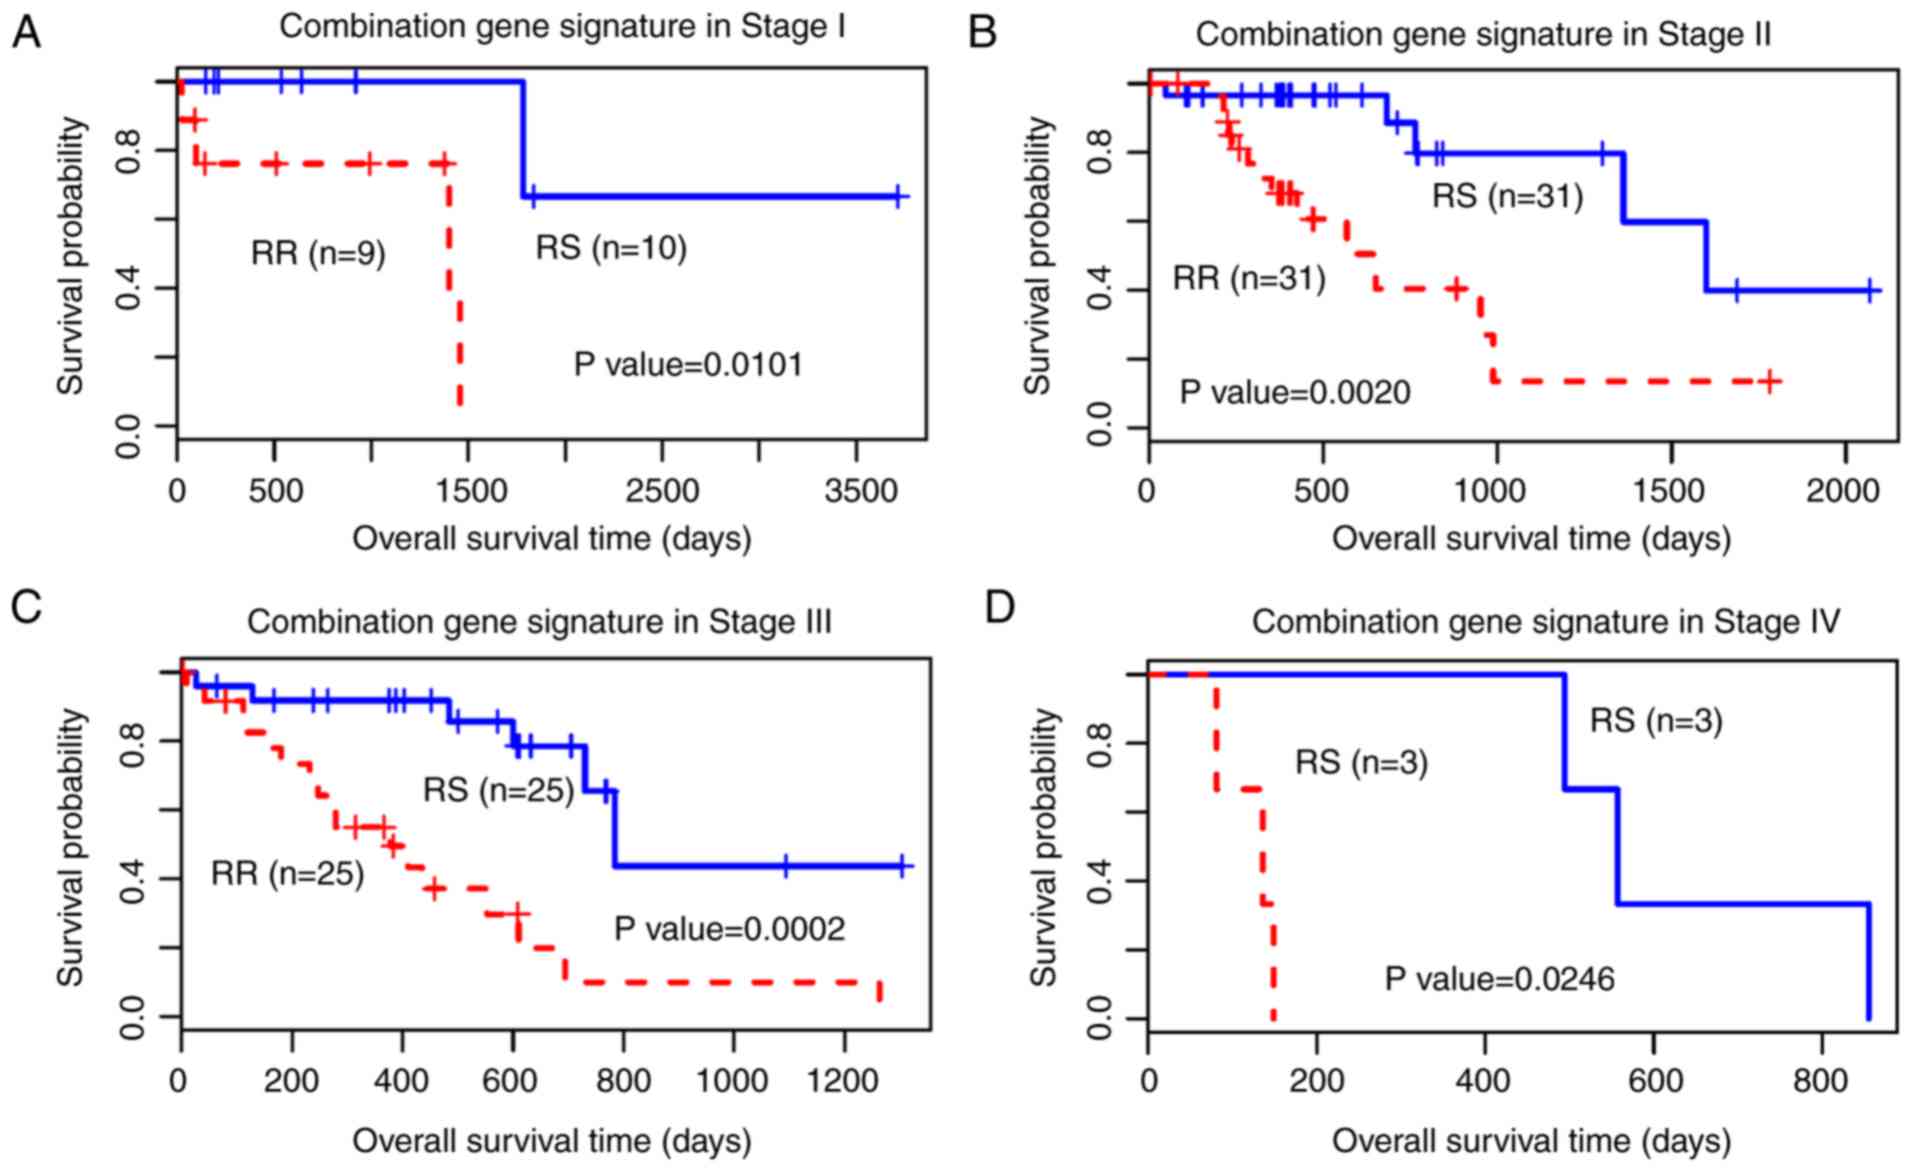
Additionally, with the TNM staging system being an
important clinical indicator for tumours in clinical practice, in
the present study, the 41-gene signature was used to predict the
outcome of all stages of patients with oesophageal cancer (Fig. 4). The results demonstrated that the
41-gene signature of RS classified all stages significantly, with
an improved predictive capacity for Stage II and Stage III.
Core genes for patients who have
received radiotherapy
The results demonstrated that the core genes were
not able to predict RS and RR groups in all patients with
oesophageal cancer (Table V).
Therefore, the core genes were tested in patients who received
radiotherapy (n=31). The 41-gene signature combination performed
well in predicting the prognosis in all oesophageal cancer patients
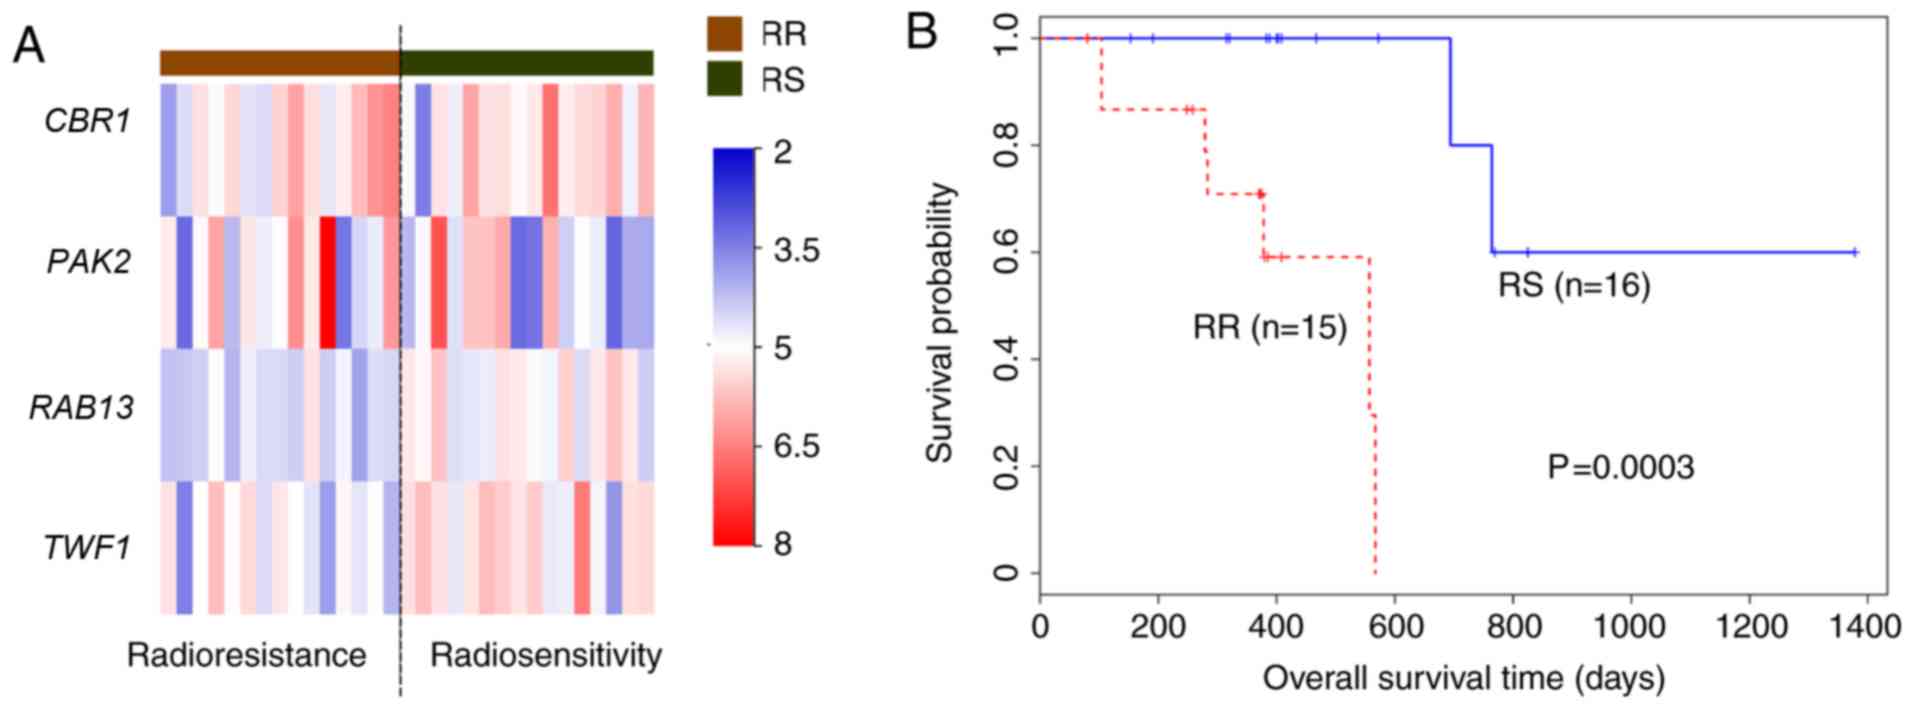
and patients who had received radiotherapy. Multivariate Cox
regression analysis demonstrated that the core genes [CBR1,
PAK2, ras-related protein Rab 13 (RAB13) and
twinfilin-1(TWF1)] may significantly predict the prognosis
of patients with oesophageal cancer who had received radiotherapy
(Fig. 5).
The results demonstrated that the expression of the
four core genes differed between the RS and RR groups (Fig. 5A). The RS group had a significantly
longer survival time compared with the RR group (P=0.0003; Fig. 5).
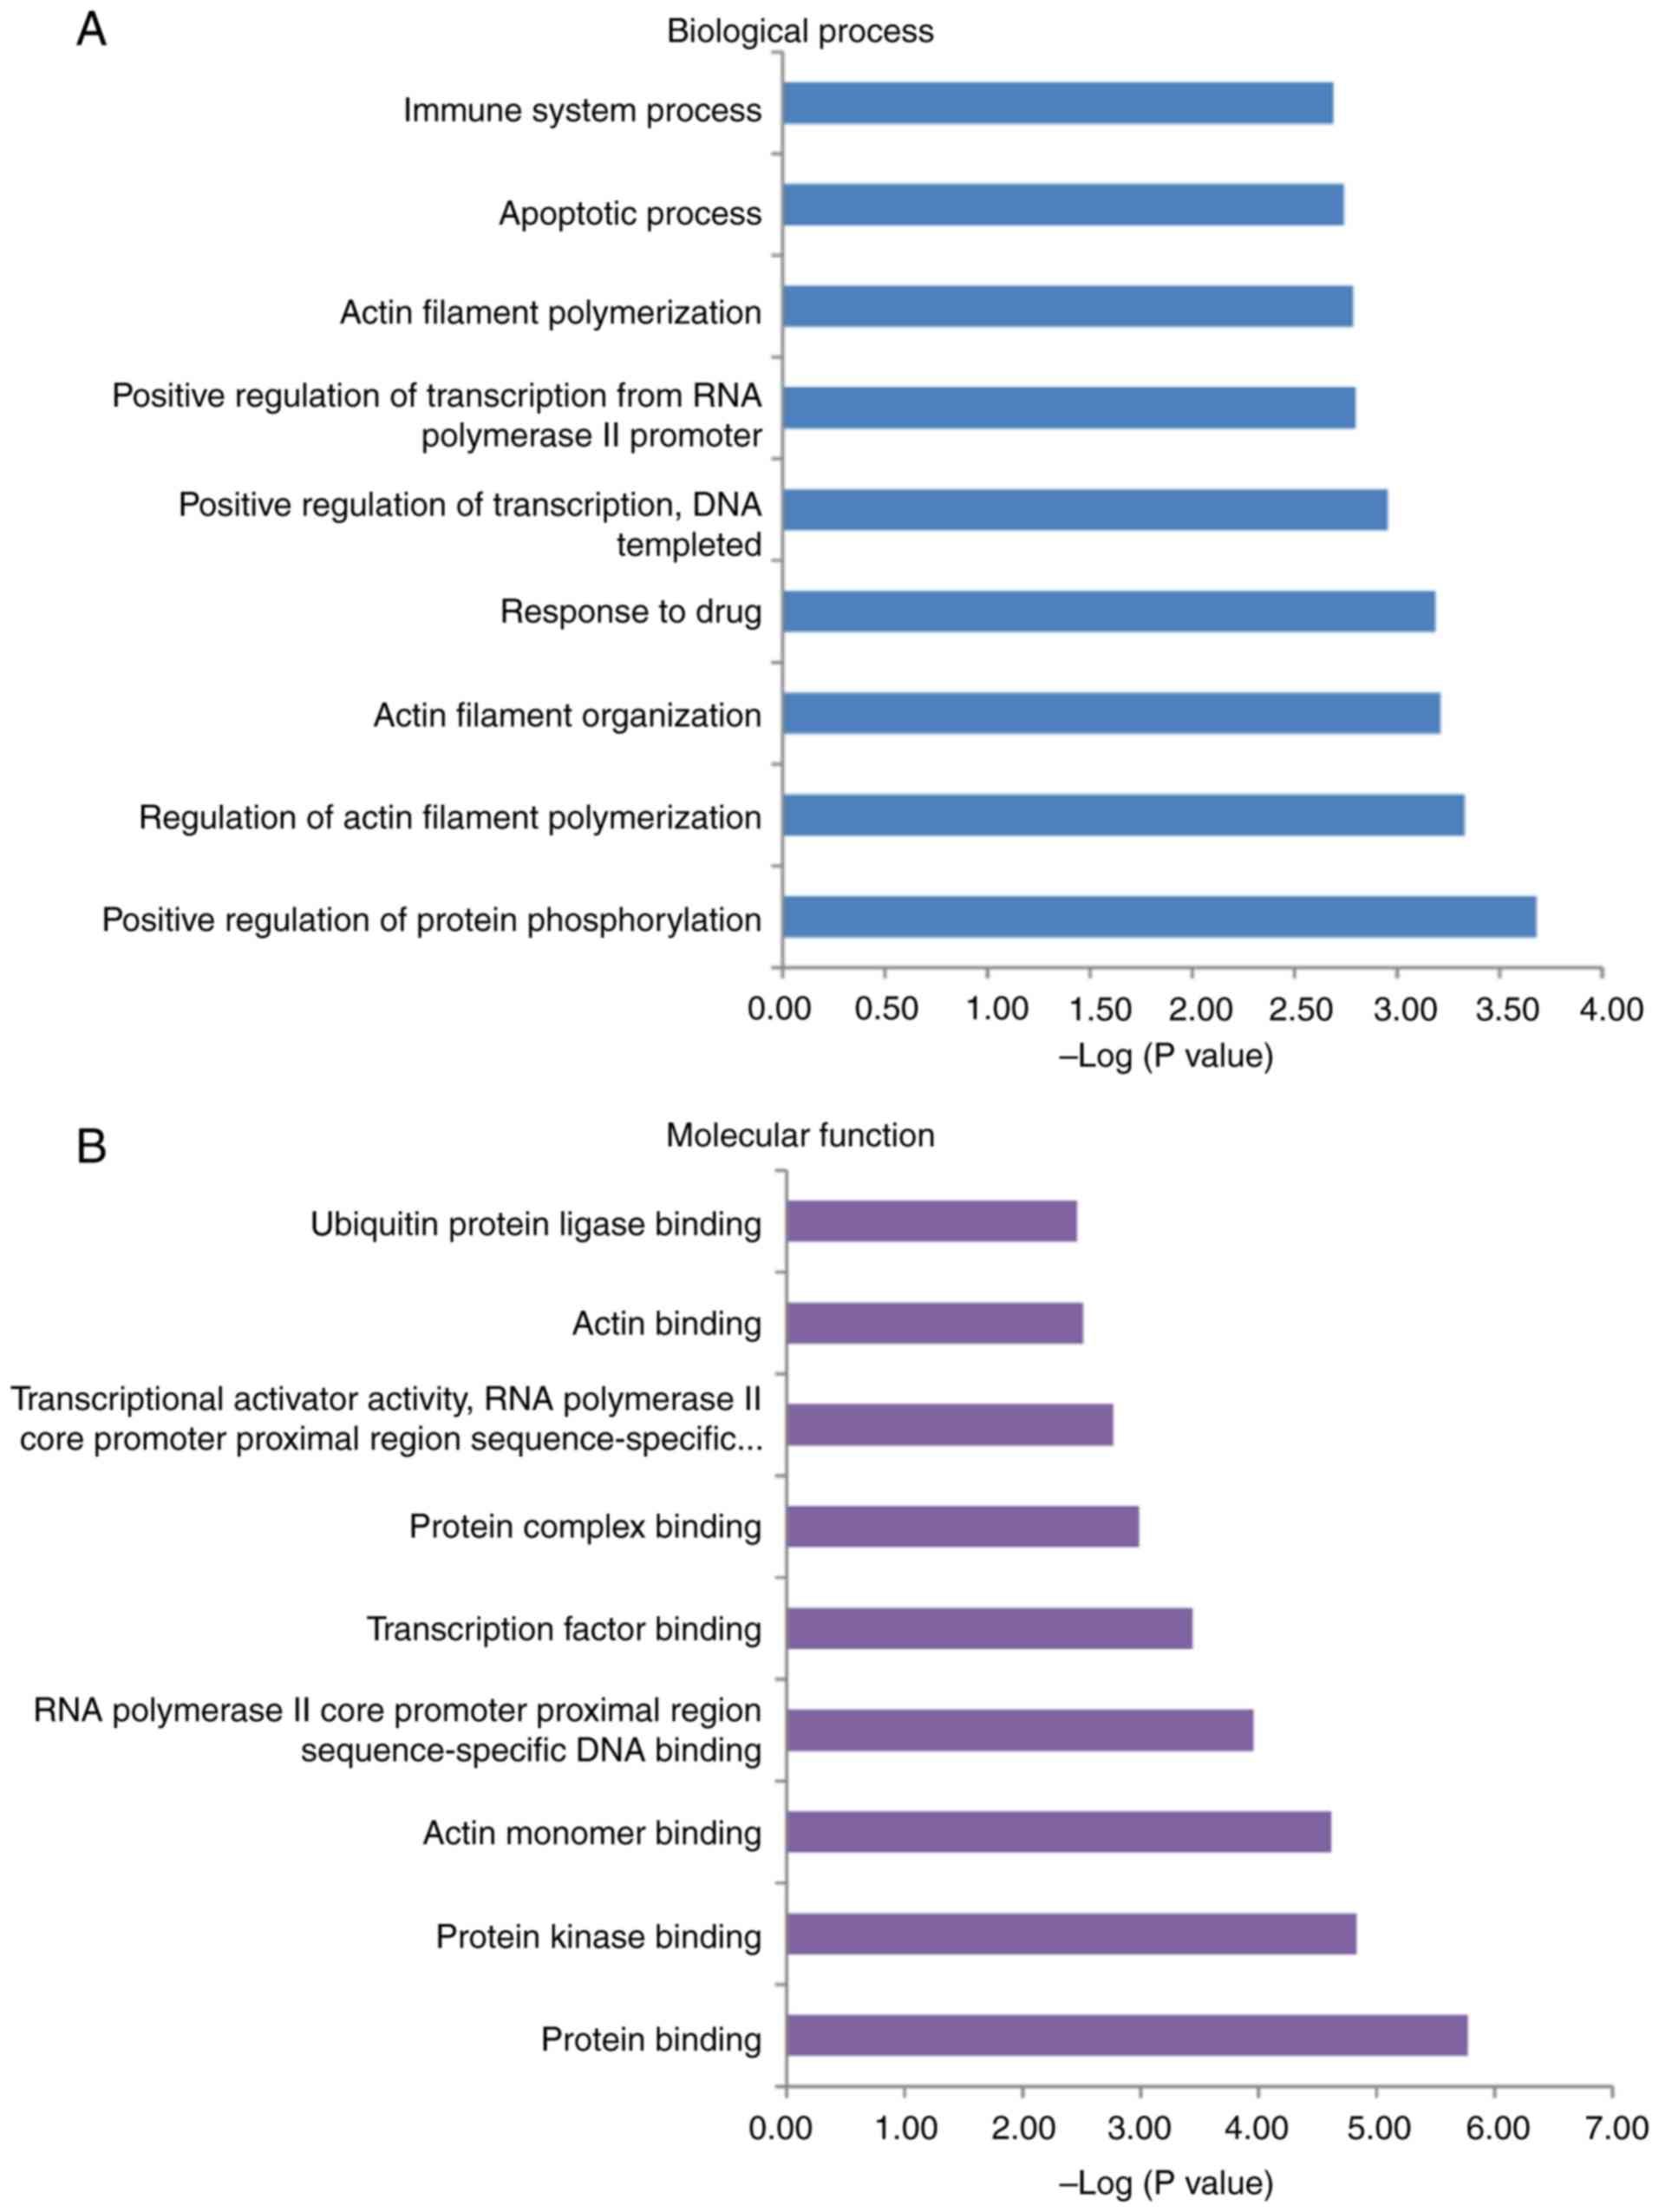
GO enrichment
The results indicated that the 41-gene signature
combination had the highest HR and the largest significant
difference between the RS and RR groups. Therefore, the GO terms
associated with these 41 genes were analysed, and the results (top
10 catalogues) are presented in Fig.
6. The 41 genes were primarily associated with protein
phosphorylation and protein binding (Fig. 6A and B). These genes were mainly
enriched in the ‘cytosol’ and ‘extracellular exosome’ (Fig. 6C). The results indicated that
radiosensitivity and radioresistance were closely associated with
these cellular components.
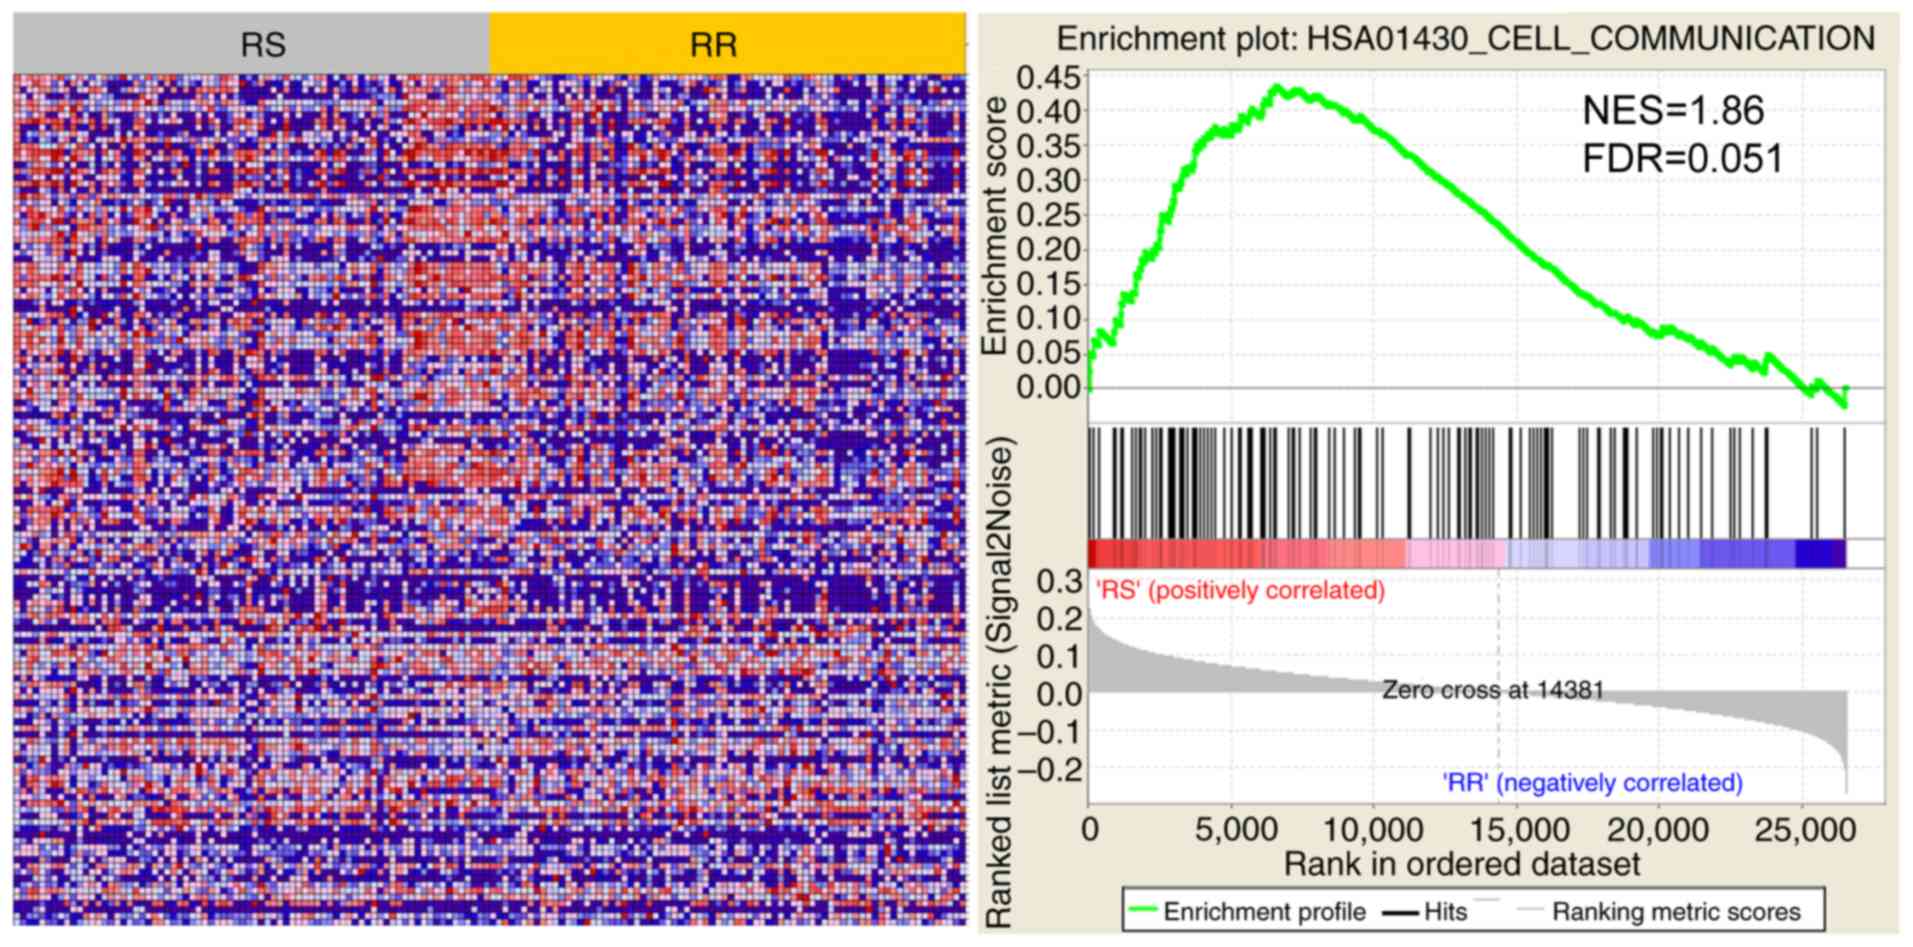
Identification of the ‘cell
communication’ pathway by GSEA
The RS and RR groups were divided by the 41-gene
signature to analyse the active pathway. The results demonstrated
that ‘cell communication’ was significantly different between the
RS and RR groups (Fig. 7). Using
GSEA analysis, the normalized enrichment score was 1.86, and the
FDR was 0.051.
Discussion
In the present study, the results suggested that
integrating the two previously developed radiosensitive gene
signatures (6,7) demonstrated improved performance in
predicting overall survival in patients with oesophageal cancer
compared with either method alone. RSI and the 31-gene signature
were independently proposed, and the two signatures are related to
SF2 measured from cellular radiosensitivity. The two types of gene
signatures predicted clinical outcomes using univariate Cox
regression analysis, and the 31-gene signature performed better
compared with RSI. When the two types of gene signatures were
combined, the combination (41-gene) signature demonstrated the
highest HR and most significant P-value. However, when multivariate
Cox regression analysis was used to screen independent genes for
prognosis, the novel gene combination of 6 genes did not predict
survival; demonstrating that the expression of the 41 genes was
associated with overall survival in patients with oesophageal
cancer.
Compared with the previous studies on the
radiosensitivity of oesophageal cancer, a common radiosensitive
gene signature to predict overall survival instead of gene
expression differences in cell lines was applied. For example,
cyclin-dependent kinase inhibitor 2A, interferon-β1, matrix
metalloproteinase 1, protein S100-A4, and tumor necrosis
factor receptor superfamily member 25 were demonstrated to be
upregulated, whereas granzyme A, Myc proto-oncogene,
transforming growth factor β1 and tumor necrosis
factor-α were downregulated (RS vs. RR cell lines) (31). In clinical practice, clinicians
cannot make a distinction between whether patients are RS or RR
a priori. In addition, different RS and RS oesophageal
cancer cell lines express different biomarkers and regulation
levels from 13 oesophageal cancer cell lines analysis (32). Therefore, there is no universal gene
group to determine radiosensitivity. A previous study indicated
that CABPR, fatty acid binding protein 5, desmocollin-2,
glutathione peroxidase 2, thioredoxin domain-containing protein,
carbonyl reductase (CBR)3, dedicator of cytokinesis 8, and
multidrug resistance-associated protein 1 were upregulated,
whereas replication protein A 70 kDa DNA-binding subunit,
leucine zipper protein down-regulated in cancer cells, necdin,
and the S-phase kinase-associated protein 1 were
downregulated (32). It has been
hypothesized that genes coding for proteins involved in the cell
cycle and DNA repair are associated with radiosensitivity (33–35).
Furthermore, a number of RS genes derived from cell lines present a
significant obstacle in clinical practice as several different
markers may confound clinical decision-making. Although the gene
signatures used were selected from cell lines, these gene
signatures were validated using a large amount of clinical
data.
As radiosensitivity is difficult to study at the
molecular level, RS genes are simply obtained from cellular
experiments using SF2. Although a number of studies have predicted
specific radiosensitive biomarkers for a limited number of cancer
types (36,37), only a small number of common
biomarkers for prognosis have been identified (22,38). The
function of the 41-gene signature was investigated using GO. The 41
genes were primarily involved in protein phosphorylation biological
processes. In particular, protein phosphorylation is closely
associated with radiosensitivity (39,40).
Based on the molecular function and cellular component analysis,
these genes may primarily serve protein-binding functions and are
located in the cytosol. Additionally, the majority of these genes
(STAT1, AR, JUN, PIR and ABL1) serve vital roles in
transcriptional regulation. The expression of transcription factors
as indicators may predict radiosensitivity in cancer cells.
Consequently, RS and RR groups that were classified using the
41-gene signature from GSEA were analysed, and it was demonstrated
that the cell communication pathway was active in the RS group,
consistent with the conclusions related to drug sensitivity in a
recent study (41). However, the
association between cell communication and radiosensitivity has not
been studied, to the best of our knowledge.
Additionally, the four core genes (CBR1, PAK2,
RAB13 and TWF1) were sufficient for predicting the
prognosis of patients with radiotherapy. One gene (PAK2) was
derived from RSI and the other three genes (CBR1, RAB13 and
TWF1) were derived from the 31-gene signature. Common
radiosensitivity genes were used to obtain specific special
biomarkers for predicting RS and RR groups in patients with
oesophageal cancer. The biomarkers from clinical data may be more
useful than those from experiments with cell lines in clinical
practice.
The current study had several limitations. While the
relevance of specific genes for the effective prognosis prediction
of oesophageal cancer was demonstrated in the current study, a
limited sample size was investigated. Future clinical validation
using larger sample sizes is warranted. The present study did not
attempt to predict the relapse free survival (RFS) rate, as
information on RFS was incomplete. However, the integrated 41-gene
signature is an optimal radiosensitivity candidate for predicting
the overall survival of oesophageal cancer.
Acknowledgements
Not applicable.
Funding
The present study was supported by a Gansu Province
Science Foundation (grant no. 1606RJZA016).
Availability of data and materials
The datasets generated and/or analyzed during the
current study are available in the Cancer Genome Atlas repository
(https://xenabrowser.net/datapages/?cohort=GDC%20TCGA%20Esophageal%20Cancer%20(ESCA)&removeHub=https%3A%2F%2Fxena.treehouse.gi.ucsc.edu%3A443).
Authors' contribution
QNZ and ZTB performed the analysis and wrote the
manuscript. JHT was another major contributor in interpreting the
biological and clinical data and writing the manuscript. XHW
proposed and designed the methods for this manuscript. RFL and YL
preprocessed the downloaded data. YRK and YY performed statistical
analysis and validation. All authors read and approved the final
manuscript.
Ethics approval and consent to
participate
Not applicable.
Patient consent for publication
Not applicable.
Competing interests
The authors declare that they have no competing
interests.
References
|
1
|
Siegel RL, Miller KD and Jemal A: Cancer
statistics, 2016. CA Cancer J Clin. 66:7–30. 2016. View Article : Google Scholar : PubMed/NCBI
|
|
2
|
Chen W, Zheng R, Baade PD, Zhang S, Zeng
H, Bray F, Jemal A, Yu XQ and He J: Cancer statistics in China,
2015. CA Cancer J Clin. 66:115–132. 2016. View Article : Google Scholar : PubMed/NCBI
|
|
3
|
Ng J and Lee P: The role of radiotherapy
in localized esophageal and gastric cancer. Hematol Oncol Clin
North Am. 31:453–468. 2017. View Article : Google Scholar : PubMed/NCBI
|
|
4
|
Ravi S, Khaldoun A, Meredith KL, Biagioli
MC, Chuong MD, Cruz A and Hoffe SE: Radiation therapy and
esophageal cancer. Cancer Control. 20:97–110. 2013. View Article : Google Scholar : PubMed/NCBI
|
|
5
|
Altorki N and Harrison S: What is the role
of neoadjuvant chemotherapy, radiation, and adjuvant treatment in
resectable esophageal cancer? Ann Cardiothorac Surg. 6:167–174.
2017. View Article : Google Scholar : PubMed/NCBI
|
|
6
|
Scott JG, Berglund A, Schell MJ, Mihaylov
I, Fulp WJ, Yue B, Welsh E, Caudell JJ, Ahmed K, Strom TS, et al: A
genome-based model for adjusting radiotherapy dose (GARD): A
retrospective, cohort-based study. Lancet Oncol. 18:202–211. 2017.
View Article : Google Scholar : PubMed/NCBI
|
|
7
|
Begg AC: Predicting response to
radiotherapy: Evolutions and revolutions. Int J Radiat Biol.
85:825–836. 2009. View Article : Google Scholar : PubMed/NCBI
|
|
8
|
Amundson SA, Do KT, Vinikoor LC, Lee RA,
Koch-Paiz CA, Ahn J, Reimers M, Chen Y, Scudiero DA, Weinstein JN,
et al: Integrating global gene expression and radiation survival
parameters across the 60 cell lines of the national cancer
institute anticancer drug screen. Cancer Res. 68:415–424. 2008.
View Article : Google Scholar : PubMed/NCBI
|
|
9
|
Lynam-Lennon N, Reynolds JV, Marignol L,
Sheils OM, Pidgeon GP and Maher SG: MicroRNA-31 modulates tumour
sensitivity to radiation in oesophageal adenocarcinoma. J Mol Med
(Berl). 90:1449–1458. 2012. View Article : Google Scholar : PubMed/NCBI
|
|
10
|
Chen GZ, Zhu HC, Dai WS, Zeng XN, Luo JH
and Sun XC: The mechanisms of radioresistance in esophageal
squamous cell carcinoma and current strategies in radiosensitivity.
J Thorac Dis. 9:849–859. 2017. View Article : Google Scholar : PubMed/NCBI
|
|
11
|
Fukuda K, Sakakura C, Miyagawa K, Kuriu Y,
Kin S, Nakase Y, Hagiwara A, Mitsufuji S, Okazaki Y, Hayashizaki Y
and Yamagishi H: Differential gene expression profiles of
radioresistant oesophageal cancer cell lines established by
continuous fractionated irradiation. Br J Cancer. 91:1543–1550.
2004. View Article : Google Scholar : PubMed/NCBI
|
|
12
|
Eschrich S, Zhang H, Zhao H, Boulware D,
Lee JH, Bloom G and Torres-Roca JF: Systems biology modeling of the
radiation sensitivity network: A biomarker discovery platform. Int
J Radiat Oncol Biol Phys. 75:497–505. 2009. View Article : Google Scholar : PubMed/NCBI
|
|
13
|
Kim HS, Kim SC, Kim SJ, Park CH, Jeung HC,
Kim YB, Ahn JB, Chung HC and Rha SY: Identification of a
radiosensitivity signature using integrative metaanalysis of
published microarray data for NCI-60 cancer cells. BMC Genomics.
13:3482012. View Article : Google Scholar : PubMed/NCBI
|
|
14
|
Eschrich SA, Fulp WJ, Pawitan Y, Foekens
JA, Smid M, Martens JW, Echevarria M, Kamath V, Lee JH, Harris EE,
et al: Validation of a radiosensitivity molecular signature in
breast cancer. Clin Cancer Res. 18:5134–5143. 2012. View Article : Google Scholar : PubMed/NCBI
|
|
15
|
Torres-Roca JF, Erho N, Vergara I,
Davicioni E, Jenkins RB, Den RB, Dicker AP and Eschrich SA: A
molecular signature of radiosensitivity (rsi) is an rt-specific
biomarker in prostate cancer. Int J Radiat Oncol Biol Phy. 90
(Suppl):S1572014. View Article : Google Scholar
|
|
16
|
Creelan B, Eschrich SA, Fulp WJ and
Torres-Roca JF: A gene expression platform to predict benefit from
adjuvant external beam radiation in resected non-small cell lung
cancer. Int J Radiat Oncol Biol Phys. 90 (Suppl):S76–S77. 2014.
View Article : Google Scholar
|
|
17
|
Torres-Roca JF, Fulp WJ, Caudell JJ,
Servant N, Bollet MA, van de Vijver M, Naghavi AO, Harris EE and
Eschrich SA: Integration of a radiosensitivity molecular signature
into the assessment of local recurrence risk in breast cancer. Int
J Radiat Oncol Biol Phys. 93:631–638. 2015. View Article : Google Scholar : PubMed/NCBI
|
|
18
|
Strom T, Hoffe SE, Fulp W, Frakes J,
Coppola D, Springett GM, Malafa MP, Harris CL, Eschrich SA,
Torres-Roca JF and Shridhar R: Radiosensitivity index predicts for
survival with adjuvant radiation in resectable pancreatic cancer.
Radiother Oncol. 117:159–164. 2015. View Article : Google Scholar : PubMed/NCBI
|
|
19
|
Ahmed KA, Fulp WJ, Berglund AE, Hoffe SE,
Dilling TJ, Eschrich SA, Shridhar R and Torres-Roca JF: Differences
between colon cancer primaries and metastases using a molecular
assay for tumor radiation sensitivity suggest implications for
potential oligometastatic SBRT patient selection. Int J Radiat
Oncol Biol Phys. 92:837–842. 2015. View Article : Google Scholar : PubMed/NCBI
|
|
20
|
Ahmed KA, Chinnaiyan P, Fulp WJ, Eschrich
S, Torresroca JF and Caudell JJ: The radiosensitivity index
predicts for overall survival in glioblastoma. Oncotarget.
6:34414–34422. 2015. View Article : Google Scholar : PubMed/NCBI
|
|
21
|
Eschrich SA, Pramana J, Zhang H, Zhao H,
Boulware D, Lee JH, Bloom G, Rocha-Lima C, Kelley S, Calvin DP, et
al: A gene expression model of intrinsic tumor radiosensitivity:
Prediction of response and prognosis after chemoradiation. Int J
Radiat Oncol Biol Phys. 75:489–496. 2009. View Article : Google Scholar : PubMed/NCBI
|
|
22
|
Corneil TA, Kuyper LM, Shoveller J, Hogg
RS, Li K, Spittal PM, Schechter MT and Wood E: Unstable housing,
associated risk behaviour, and increased risk for HIV infection
among injection drug users. Health Place. 12:79–85. 2006.
View Article : Google Scholar : PubMed/NCBI
|
|
23
|
Kempe P, Van Oppen P, De Haan E, Twisk JW,
Sluis A, Smit JH, van Dyck R and van Balkom AJ: Predictors of
course in obsessive-compulsive disorder: Logistic regression versus
Cox regression for recurrent events. Acta Psychiatr Scand.
116:201–210. 2007. View Article : Google Scholar : PubMed/NCBI
|
|
24
|
Huang DW, Sherman BT and Lempicki RA:
Systematic and integrative analysis of large gene lists using DAVID
bioinformatics resources. Nat Protoc. 4:44–57. 2009. View Article : Google Scholar : PubMed/NCBI
|
|
25
|
Huang DW, Sherman BT and Lempicki RA:
Bioinformatics enrichment tools: Paths toward the comprehensive
functional analysis of large gene lists. Nucleic Acids Res.
37:1–13. 2009. View Article : Google Scholar : PubMed/NCBI
|
|
26
|
Subramanian A, Tamayo P, Mootha VK,
Mukherjee S, Ebert BL, Gillette MA, Paulovich A, Pomeroy SL, Golub
TR, Lander ES and Mesirov JP: Gene set enrichment analysis: A
knowledge-based approach for interpreting genome-wide expression
profiles. Proc Natl Acad Sci USA. 102:15545–15550. 2005. View Article : Google Scholar : PubMed/NCBI
|
|
27
|
Schena M, Battaglia AF and Munoz F:
Esophageal cancer developed in a radiated field: Can we reduce the
risk of a poor prognosis cancer? J Thorac Dis. 9:1767–1771. 2017.
View Article : Google Scholar : PubMed/NCBI
|
|
28
|
Guo Y, Zhu XD, Qu S, Li L, Su F, Li Y,
Huang ST and Li DR: Identification of genes involved in
radioresistance of nasopharyngeal carcinoma by integrating gene
ontology and protein-protein interaction networks. Int J Oncol.
40:85–92. 2012.PubMed/NCBI
|
|
29
|
Looby E, Abdel-Latif MMM, Morales VA and
Kelleher D: Bile acid exposure induces activation of the
extracellular signal-regulated kinase and the transcription factor
AP-1 in esophageal cancer cells. Gastroenterology. 124:A2762003.
View Article : Google Scholar
|
|
30
|
Liu F, Rehmani I, Esaki S, Fu R, Chen L,
de Serrano V and Liu A: Pirin is an iron-dependent redox regulator
of NF-κB. Proc Nati Acad Sci USA. 110:9722–9727. 2013. View Article : Google Scholar
|
|
31
|
Maher S, Lynamlennon N and Reynolds J:
Differential gene expression profiles as markers of radioresistance
in esophageal cancer. Cancer Res. 68:2008.
|
|
32
|
Ogawa R, Ishiguro H, Kuwabara Y, Kimura M,
Mitsui A, Mori Y, Mori R, Tomoda K, Katada T, Harada K and Fujii Y:
Identification of candidate genes involved in the radiosensitivity
of esophageal cancer cells by microarray analysis. Dis Esophagus.
21:288–297. 2008. View Article : Google Scholar : PubMed/NCBI
|
|
33
|
Allalunis-Turner MJ, Zia PK, Barron GM,
Mirzayans R and Day RS III: Radiation-induced DNA damage and repair
in cells of a radiosensitive human malignant glioma cell line.
Radiat Res. 144:288–293. 1995. View Article : Google Scholar : PubMed/NCBI
|
|
34
|
Chen Y, Li Z, Dong Z, Beebe J, Yang K, Fu
L and Zhang JT: 14-3-3sigma contributes to radioresistance by
regulating DNA repair and cell cycle via PARP1 and CHK2. Mol Cancer
Res. 15:418–428. 2017. View Article : Google Scholar : PubMed/NCBI
|
|
35
|
Pugh TJ, Keyes M, Barclay L, Delaney A,
Krzywinski M, Thomas D, Novik K, Yang C, Agranovich A, McKenzie M,
et al: Sequence variant discovery in DNA repair genes from
radiosensitive and radiotolerant prostate brachytherapy patients.
Clin Cancer Res. 15:5008–5016. 2009. View Article : Google Scholar : PubMed/NCBI
|
|
36
|
Yi HM, Yi H, Zhu JF, Xiao T, Lu SS, Guan
YJ and Xiao ZQ: A five-variable signature predicts radioresistance
and prognosis in nasopharyngeal carcinoma patients receiving
radical radiotherapy. Tumor Biol. 37:2941–2949. 2016. View Article : Google Scholar
|
|
37
|
Bing Z, Tian J, Zhang J, Li X, Wang X and
Yang K: An integrative model of miRNA and mRNA expression signature
for patients of breast invasive carcinoma with radiotherapy
prognosis. Cancer Biother Radiopharm. 31:253–260. 2016. View Article : Google Scholar : PubMed/NCBI
|
|
38
|
Zhou J, Wu X, Li G, Gao X, Zhai M, Chen W,
Hu H and Tang Z: Prediction of radiosensitive patients with gastric
cancer by developing gene signature. Int J Oncol. 51:1067–1076.
2017. View Article : Google Scholar : PubMed/NCBI
|
|
39
|
Vasireddy RS, Sprung CN, Cempaka NL, Chao
M and Mckay MJ: H2AX phosphorylation screen of cells from
radiosensitive cancer patients reveals a novel DNA double-strand
break repair cellular phenotype. Br J Cancer. 102:1511–1518. 2010.
View Article : Google Scholar : PubMed/NCBI
|
|
40
|
Jacobs KM, Misri S, Meyer B, Raj S, Zobel
CL, Sleckman BP, Hallahan DE and Sharma GG: Unique epigenetic
influence of H2AX phosphorylation and H3K56 acetylation on normal
stem cell radioresponses. Mol Biol Cell. 27:1332–1345. 2016.
View Article : Google Scholar : PubMed/NCBI
|
|
41
|
Jaiswal R, Raymond Grau GE and Bebawy M:
Cellular communication via microparticles: Role in transfer of
multidrug resistance in cancer. Future Oncol. 10:655–669. 2014.
View Article : Google Scholar : PubMed/NCBI
|