Introduction
MicroRNAs (miRNAs/miRs) are a class of small
noncoding RNAs that serve key roles in various types of biological
processes. Competing endogenous RNAs (ceRNAs) were recently defined
as a group of RNAs that competes for shared miRNA targets and
affects the biological functions of miRNAs (1). It has been reported that ceRNAs serve
regulatory roles in gene expression, and are involved in the
pathogenesis of cancer and other diseases (2). Therefore, focusing on ceRNA networks is
important to understand the underlying mechanisms of cancer
progression.
Glioblastoma (GBM) is a common aggressive cancer
that originates in the brain. Early stage symptoms of GBM are
similar to those of a stroke, but they worsen rapidly (3). The survival time of patients after
diagnosis is between 12 and 15 months, and only 3–5% of patients
survive for 5 years following therapy (4). Current therapies include surgery,
chemotherapy and radiation; however, GBM maintains a poor
prognosis. It is therefore important to study the underlying
genetic mechanisms of GBM. Identifying prognostic markers of GBM
will also aid understanding of the mechanism underlying metastasis
and may lead to the discovery of novel therapeutic targets.
Identifying the ceRNA network in GBM may provide a novel
perspective for understanding the biological mechanisms of the
disease.
In the present study, RNA microarray analysis was
performed on tumors from patients with GBM, and a ceRNA network
based on the GBM datasets was designed. The genes that were
highlighted in the dysfunctional pathways may serve key roles in
GBM progression. Subsequently, a functional analysis of mRNAs from
the ceRNA network was performed, and focused on the significant
pathway-associated genes and miRNAs.
Materials and methods
Sample collection
Tumor specimens and paired adjacent healthy tissues
were obtained during surgical resection performed at Luhe Hospital
Affiliated to Capital Medical University (Beijing, China) between
September 2016 and December 2016. The patients with GBM included in
the presented consisted of one female and two males (age, 60±7.21
years). All surgically removed tissue samples were immediately
frozen in liquid nitrogen and then stored at −80°C within 30 min.
The study was approved by the Ethics Committee of Luhe Hospital
Affiliated to Capital Medical University (Beijing, China) and all
patients provided informed consent prior to the study.
Microarray RNA expression
Total RNA was isolated using a TRIzol®
Plus RNA Purification kit (Invitrogen; Thermo Fisher Scientific,
Inc., Waltham, MA, USA), according to the supplier's protocol. RNA
quality and concentration were assessed using an ND-1000
Spectrophotometer (Nanodrop; Thermo Fisher Scientific, Inc.,
Wilmingtom, DE, USA). Microarrays were performed using a
GeneChip® WT Pico Reagent kit (Thermo Fisher Scientific,
Inc.) according to the manufacturer's protocol. Briefly, total RNA
(>1 µg) was used for cDNA synthesis, which was performed with WT
Pico Reagent kit (Thermo Fisher Scientific, Inc.), according to the
manufacturer's protocol. The cDNA was fragmented with uracil-DNA
glycosylase and apurinic/apyrimidinic endonuclease 1 at the
unnatural dUTP residues, and then labeled with biotin and terminal
deoxynucleotidyl transferase (TdT) using the Affymetrix DNA
Labeling Reagent (Affymetrix; Thermo Fisher Scientific, Inc.). The
samples were hybridized with the GeneChip®
Hybridization, Wash, and Stain kit (Thermo Fisher Scientific,
Inc.). After washing, the arrays were scanned with a
GeneChip® Scanner 3000 7G (Thermo Fisher Scientific,
Inc.).
Testing for correlation of expression
levels between samples
The correlation and reliability of RNA expression
between samples were evaluated. Based on RNA expression, a
principal components analysis (PCA) was conducted for each sample
using the psych package (version 1.7.8) (5) in R 3.4.1 (https://cran.r-project.org/web/packages/psych/index.html)
in order to evaluate whether obvious outliers were present in the
samples. In addition, Pearson correlation coefficients (PCC) were
calculated between samples using the cor function in R 3.4.1
(https://stat.ethz.ch/R-manual/R-devel/library/stats/html/cor.html).
Data preprocessing and differential
expression analysis
The raw data were preprocessed by oligo (version
1.40.2) (6) in R 3.4.1, which
included original data transformation, unwanted data elimination,
background correction and normalization. RNA data were annotated
based on the human whole genome (GRCh38.p10), provided by the
GENCODE database (https://www.gencodegenes.org).
The differentially expressed mRNAs (DE-mRNAs), long
non-coding RNAs (DE-lncRNAs), miRNAs (DE-miRNAs) and circular RNAs
(DE-circRNAs) between the GBM group and controls were identified
using the limma package (version 3.32.5) (7) (http://bioconductor.org/packages/release/bioc/html/limma.html).
P<0.05 and |log fold change (FC)|>1 were defined as cutoff
values. The DE-mRNAs, DE-lncRNAs, DE-miRNAs and DE-circRNAs were
clustered based on the expression values obtained by the pheatmap
package (version 1.0.8) (8) in R
(https://cran.r-project.org/web/packages/pheatmap/index.html).
Function and pathway analysis of
DE-mRNAs
The Gene Ontology (GO) functions and Kyoto
Encyclopedia of Genes and Genomes (KEGG) pathways closely
associated with DE-mRNAs were predicted by the Database for
Annotation, Visualization and Integrated Discovery (DAVID) online
tool (9) (https://david.ncifcrf.gov/).
If the number of genes enriched in a GO term were
exact, P-values were calculated using the Fisher exact test based
on hypergeometric distribution. When 2nf ≤ n, the
P-value was calculated as follows:
Pf(nf,n,Nf,N)=2*pn(X≤nf)=2*∑x-1nf(nx)(N-nNf-x)(NNf)
where nf, number of DE genes enriched in
the GO term; n, total number of genes enriched in the GO term;
Nf, total number of DE genes that are either enriched or
not enriched in the GO term; N, total number of genes in all
conditions; N-n, total number of genes not enriched in the GO term;
pF, P-value obtained by Fisher exact test;
pn, P-value of the GO term; and x, random variable.
Prediction of the disease-related
RNAs
Weighted gene co-expression network analysis (WGCNA)
(10) is a biological method used to
design correlation networks based on high throughput expression
data. WGCNA can be employed to find clusters of genes closely
correlated and analyze the correlation between RNA and disease. In
the present study, DE-mRNAs, DE-lncRNAs, DE-miRNAs and DE-circRNAs
were analyzed with the WGCNA package (11) in R.
Prediction of lncRNA-miRNA,
circRNA-miRNA and miRNA-mRNA interactions
Based on the differentially expressed RNA analysis,
the interactions between lncRNA and miRNA were analyzed by miRcode
version 11 (http://www.mircode.org/) (12). The circRNA-miRNA interactions were
predicted by the starBase database version 2.0 (13) (http://starbase.sysu.edu.cn/index.php). The
|correlation coefficient|>0.6 obtained by WGCNA analysis was
defined as the criterion for screening the lncRNA-miRNA and
circRNA-miRNA interactions. The interaction network was visualized
by Cytoscape 3.3 (14) (http://www.cytoscape.org/).
The target genes regulated by DE-miRNAs were
predicted by miRanda (http://www.microrna.org/microrna/home.do) (15) and TargetScan (16) Release 7.1 (http://www.targetscan.org/vert_71/). The miRNA-mRNA
interactions with reverse expression were collected for network
construction using Cytoscape 3.3. Subsequently, the target genes of
the miRNAs were subjected to GO function and pathway analysis using
the DAVID online tool.
ceRNA network construction
Based on the lncRNA-miRNA, circRNA-miRNA and
miRNA-mRNA interactions predicted, a ceRNA network was constructed.
Pathway analysis was performed for the mRNAs in the ceRNA network.
The significant pathways and genes were further analyzed.
Prognosis analysis
A total of 305 brain tumor datasets, including 128
GBM, 46 oligodendrocytomas, 94 astrocytomas and 37 mixed brain
tumor samples were downloaded from the Chinese Glioma Genome Atlas
(CGGA;http://www.cgga.org.cn/) database. The
128 GBM samples with prognostic information were collected for
further analysis. The significant pathway-related genes were
subjected to Kaplan-Meier curve analysis (17) based on the expression values of the
128 GBM samples with the application of the survival package
(version 2.41.3; http://cran.r-project.org/web/packages/survival/index.html)
in R.
Results
Correlation between the gene
expression profiles of samples
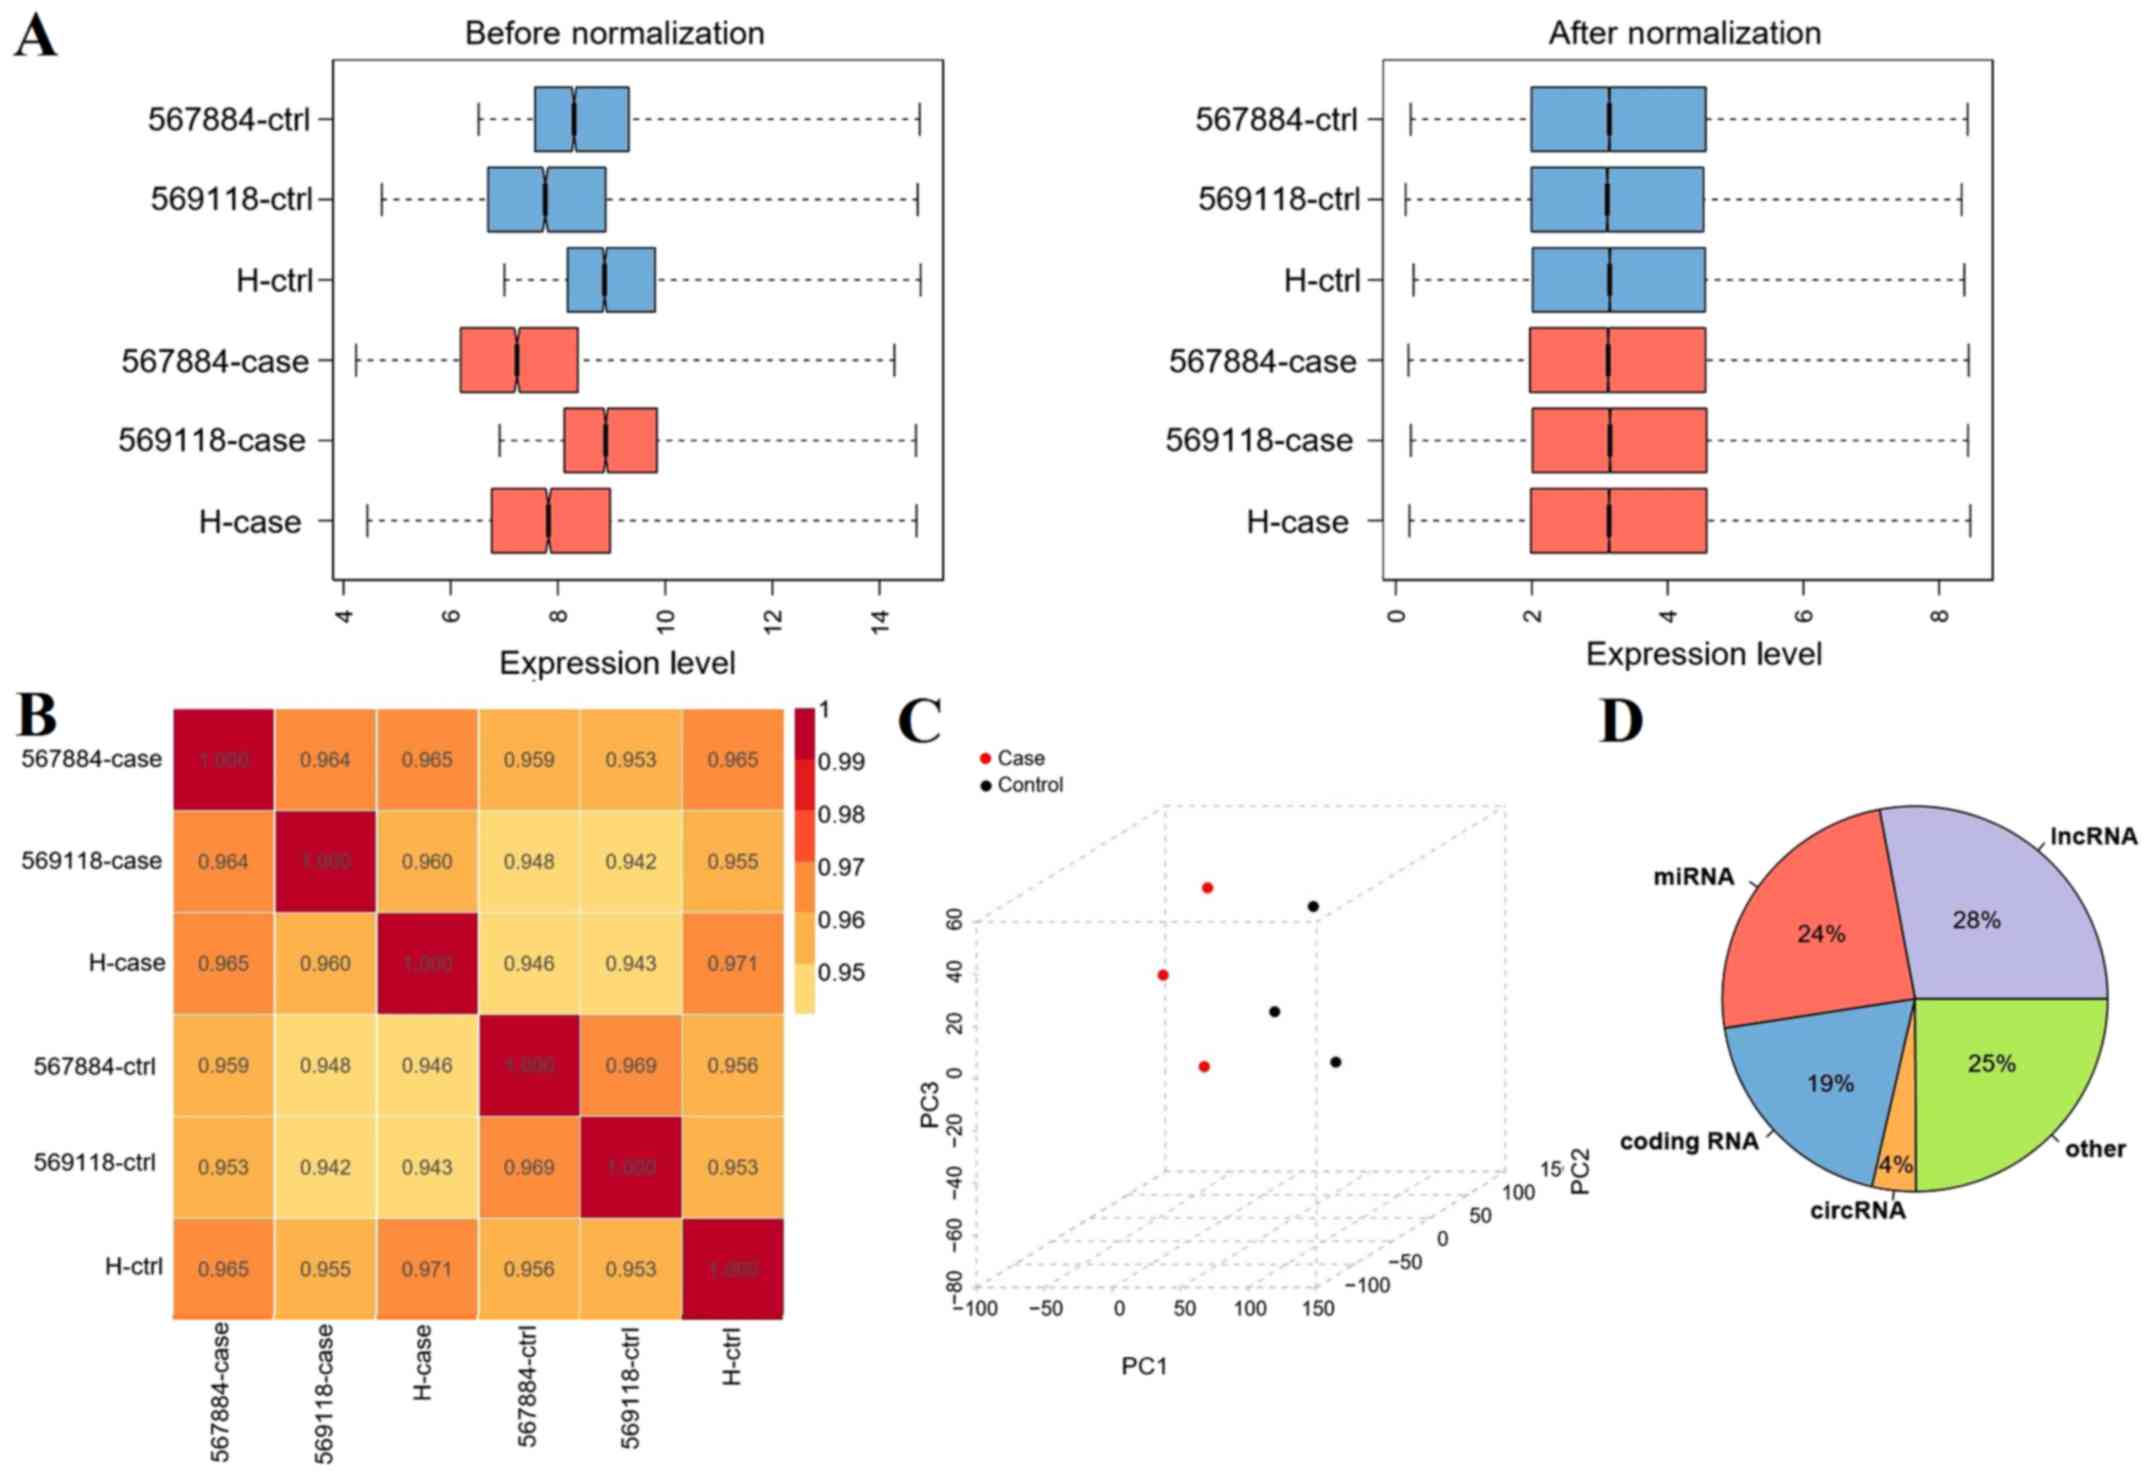
After data preprocessing, the expression data were
normalized (Fig. 1A). PCC between
samples was calculated. If the correlation coefficient was close to
1, this indicated that the expression patterns between samples were
similar. As shown in Fig. 1B, all
PCCs ranged between 0.95 and 1, which indicated that the expression
pattern correlations between samples were high.
PCA analysis demonstrated that there
were no outliers
The sample distribution was relatively centralized,
particularly for samples in the same group (Fig. 1C). After RNA data annotation, a total
of 135,750 probes with expression signals were detected, including
28% lncRNAs, 24% miRNAs, 4% circRNAs and 19% mRNAs (Fig. 1D).
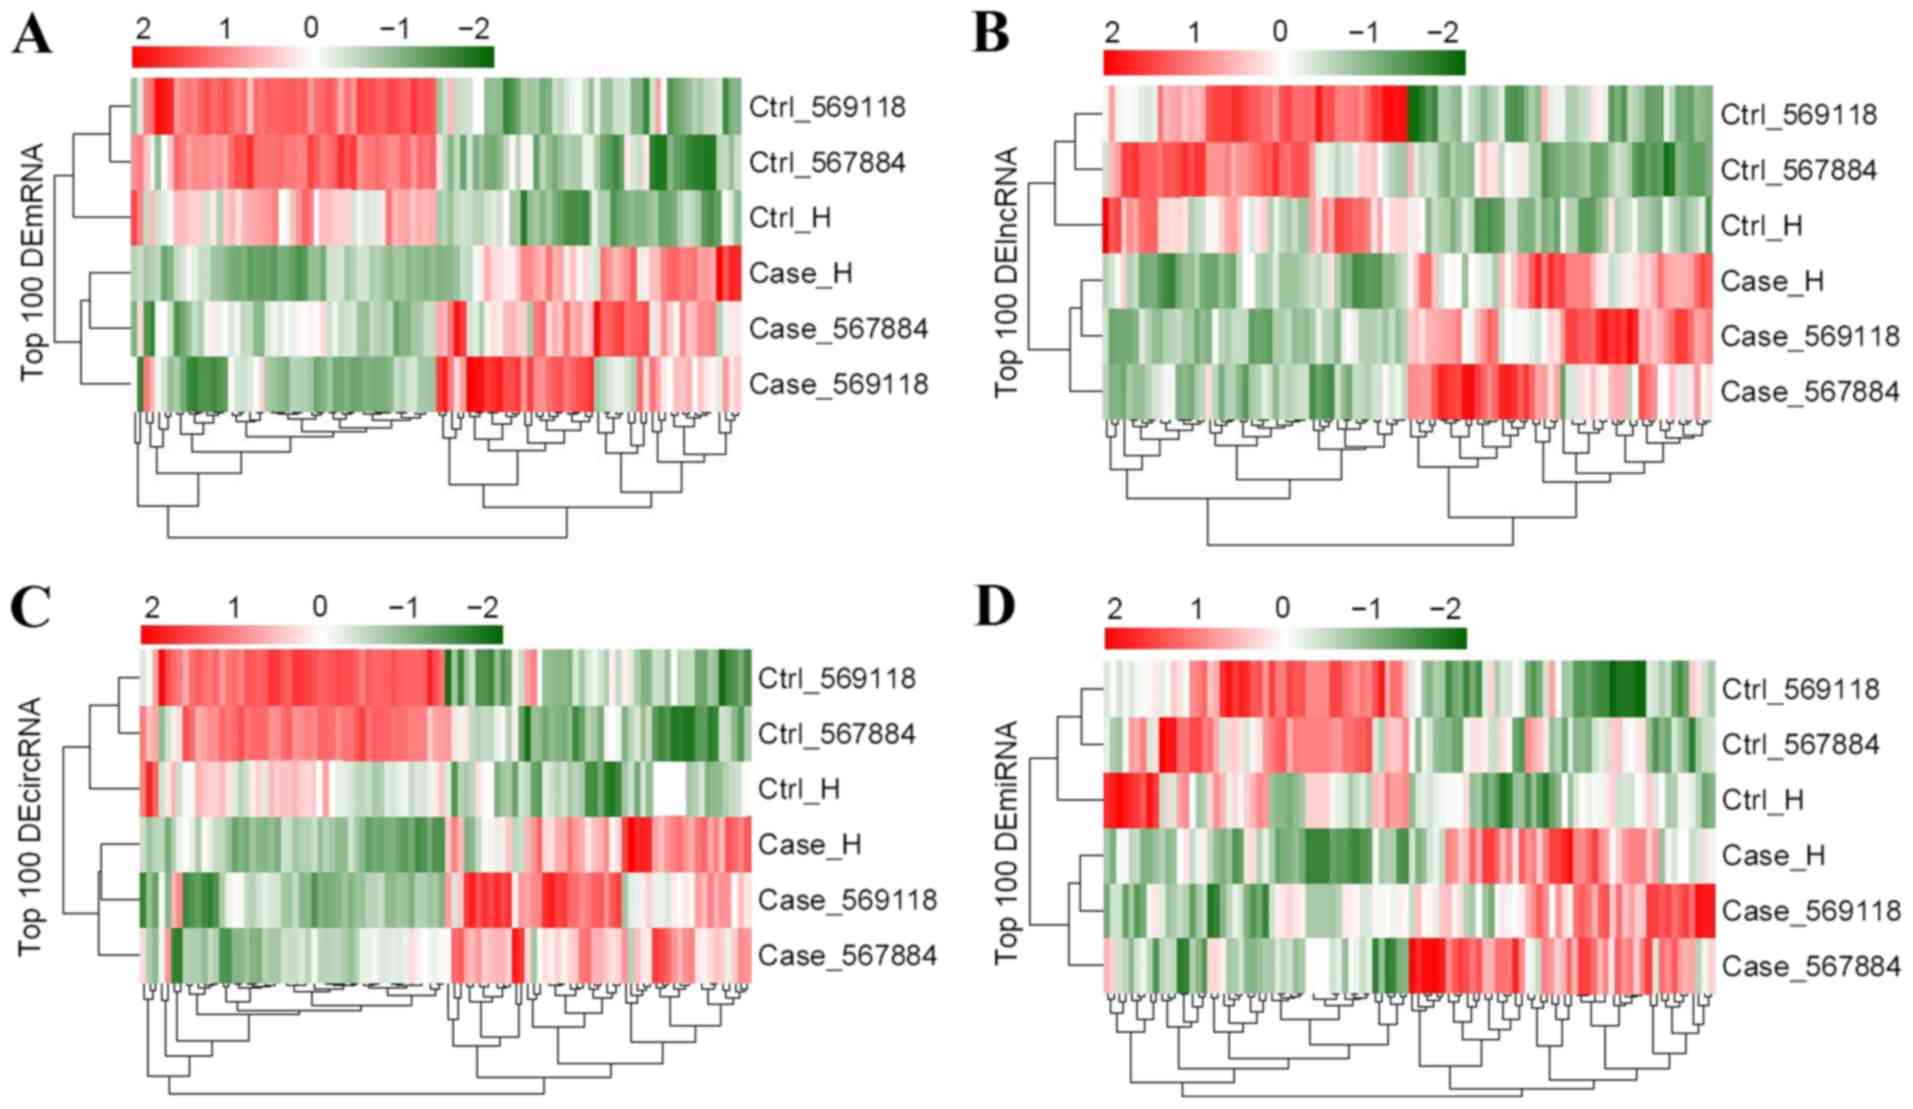
Identification of differentially
expressed RNAs
According to the cutoff value, a total of 987
DE-mRNAs, 2,879 DE-lncRNAs, 702 DE-circRNAs and 44 DE-miRNAs were
found in tumor samples compared with controls. Bidirectional
hierarchical cluster analysis illustrated that the expression
patterns of DE-mRNAs, DE-lncRNAs, DE-circRNAs and DE-miRNAs were
considerably different between GBM and control samples (Fig. 2).
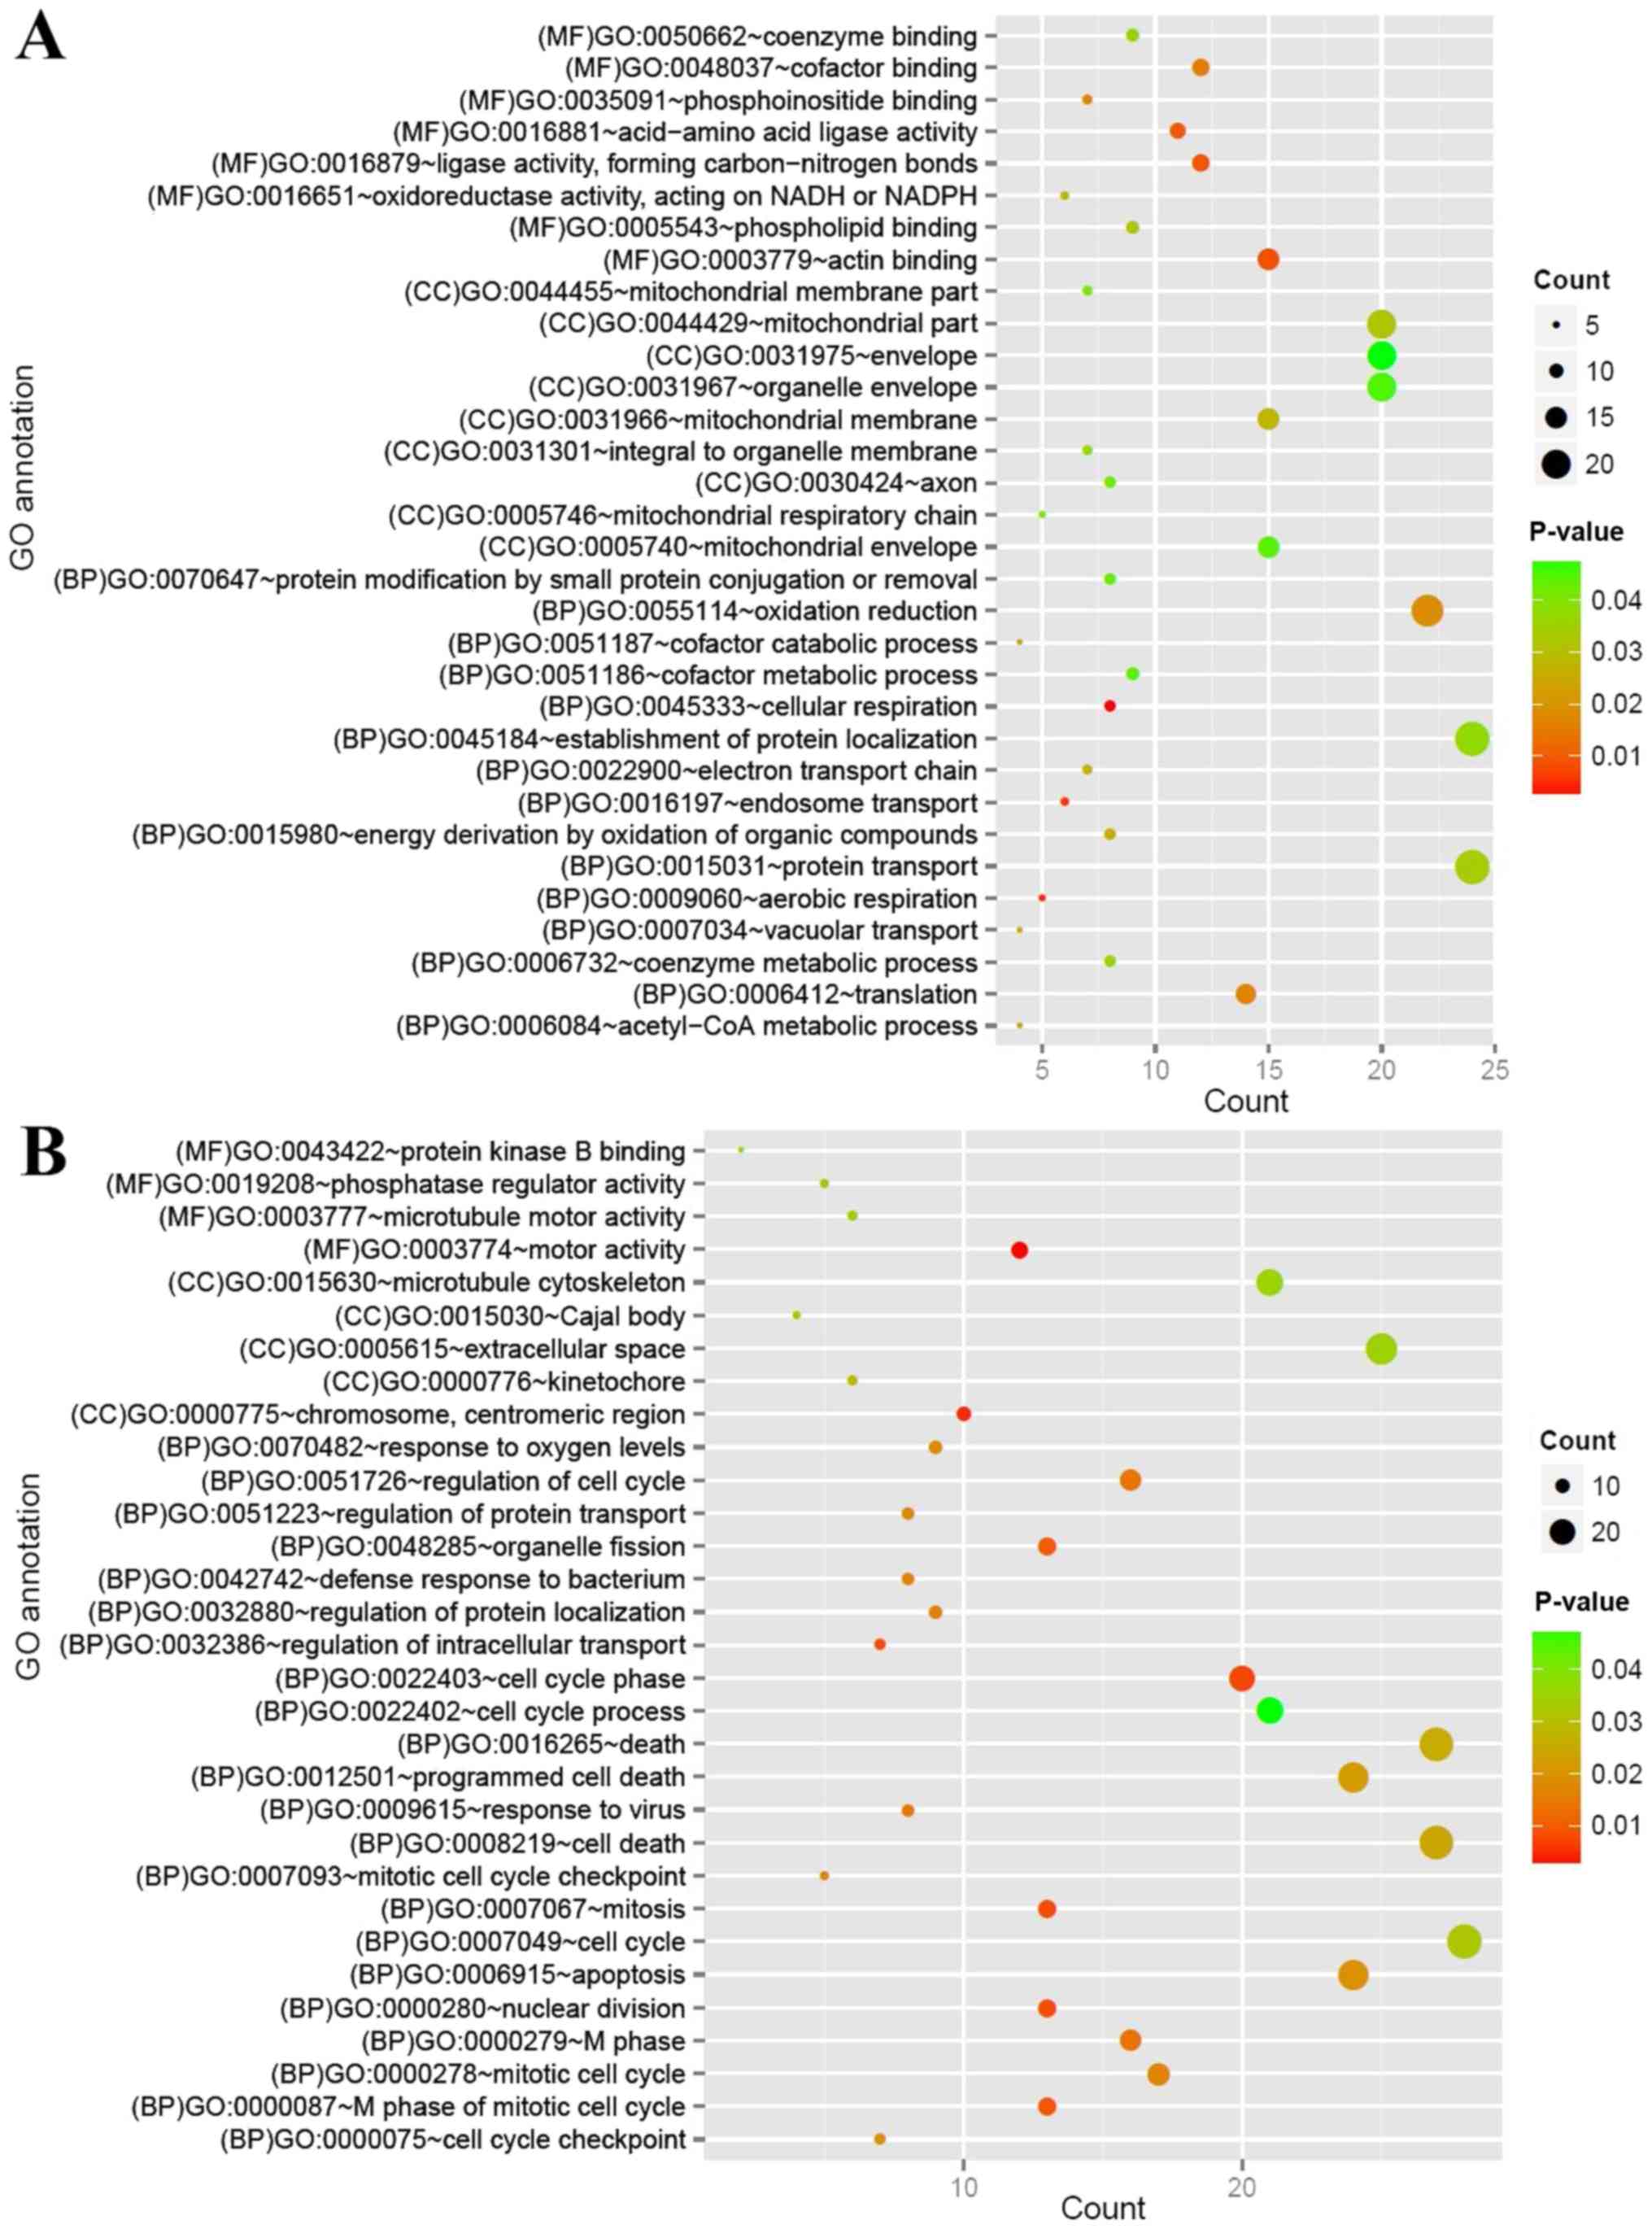
DE-mRNAs GO functions and
pathways
GO function and KEGG pathway analyses were performed
for the up and downregulated mRNAs. The downregulated mRNAs were
considerably enriched for 32 GO terms [15 biological processes
(BP), 9 cellular components (CC) and 8 molecular functions (MF)],
including ‘GO:0045333~cellular respiration’ (BP),
‘GO:0016197~endosome transport’ (BP) and ‘GO:0016881~acid-amino
acid ligase activity’ (MF) (Fig.
3A). The upregulated mRNAs were closely associated with 31 GO
terms (22 BP, 5 CC and 4 MF), including ‘GO:0022403~cell cycle
phase’ (BP), ‘GO:0000775~chromosome, centromeric region (CC)’ and
‘GO:0003774~motor activity’ (MF) (Fig.
3B).
Downregulated mRNAs were considerably enriched in
four pathways: ‘hsa05010: Alzheimer's disease’; ‘hsa00970:
Aminoacyl-tRNA biosynthesis’; ‘hsa04740: Olfactory transduction’;
and ‘hsa04130: SNARE interactions in vesicular transport’. The
upregulated mRNAs were considerably enriched in seven pathways,
including: ‘hsa00601: Glycosphingolipid biosynthesis’; ‘hsa04110:
Cell cycle’; ‘hsa04664: Fc epsilon RI signaling pathway’; and
‘hsa00380: Tryptophan metabolism’ (Table
I).
 | Table I.Significant pathways enriched by
mRNAs. |
Table I.
Significant pathways enriched by
mRNAs.
| A, Upregulated
mRNAs |
|---|
|
|---|
| Pathway | Count | P-value | Genes |
|---|
|
hsa00601:Glycosphingolipid
biosynthesis | 4 | 0.029075 | GCNT2, B3GNT5,
B3GALT5, ST8SIA1 |
| hsa04110:Cell
cycle | 8 | 0.045249 | RAD21, EP300,
TGFB3, BUB1B, SMC1A, GADD45A, CDC25A, TGFB2 |
|
hsa00603:Glycosphingolipid
biosynthesis | 3 | 0.045376 | B3GALT5, HEXA,
ST8SIA1 |
| hsa04664:Fc epsilon
RI signaling pathway | 6 | 0.045974 | IL5, PLCG1,
PLA2G2A, IL13, VAV2, PLA2G2F |
| hsa04140:Regulation
of autophagy | 4 | 0.046813 | IFNA2, PRKAA1,
IFNA8, IFNA17 |
| hsa00511:Other
glycan degradation | 3 | 0.046845 | MAN2C1, HEXA,
NEU1 |
| hsa00380:Tryptophan
metabolism | 4 | 0.049342 | TDO2, IDO2,
WARS2, INMT |
|
| B, Downregulated
mRNAs |
|
| Pathway | Count | P-value | Genes |
|
|
hsa05010:Alzheimer's disease | 10 | 0.008332 | NOS1, UQCRC1,
CASP9, NDUFA8, COX7B2, SNCA, BACE1, PPP3R1, NDUFA10, ITPR1 |
|
hsa00970:Aminoacyl-tRNA biosynthesis | 4 | 0.0458 | NARS, PSTK,
CARS2, IARS2 |
| hsa04740:Olfactory
transduction | 14 | 0.046398 | OR4K5, OR5P3,
OR4K2, OR5M11, OR6C74, OR1E2, OR2K2, PRKG1, OR2AE1, OR4A5, OR1S1,
OR4C15, OR2T33, OR14I1 |
| hsa04130:SNARE
interactions in vesicular transport | 4 | 0.048063 | VAMP7, SNAP47,
GOSR1, STX1B |
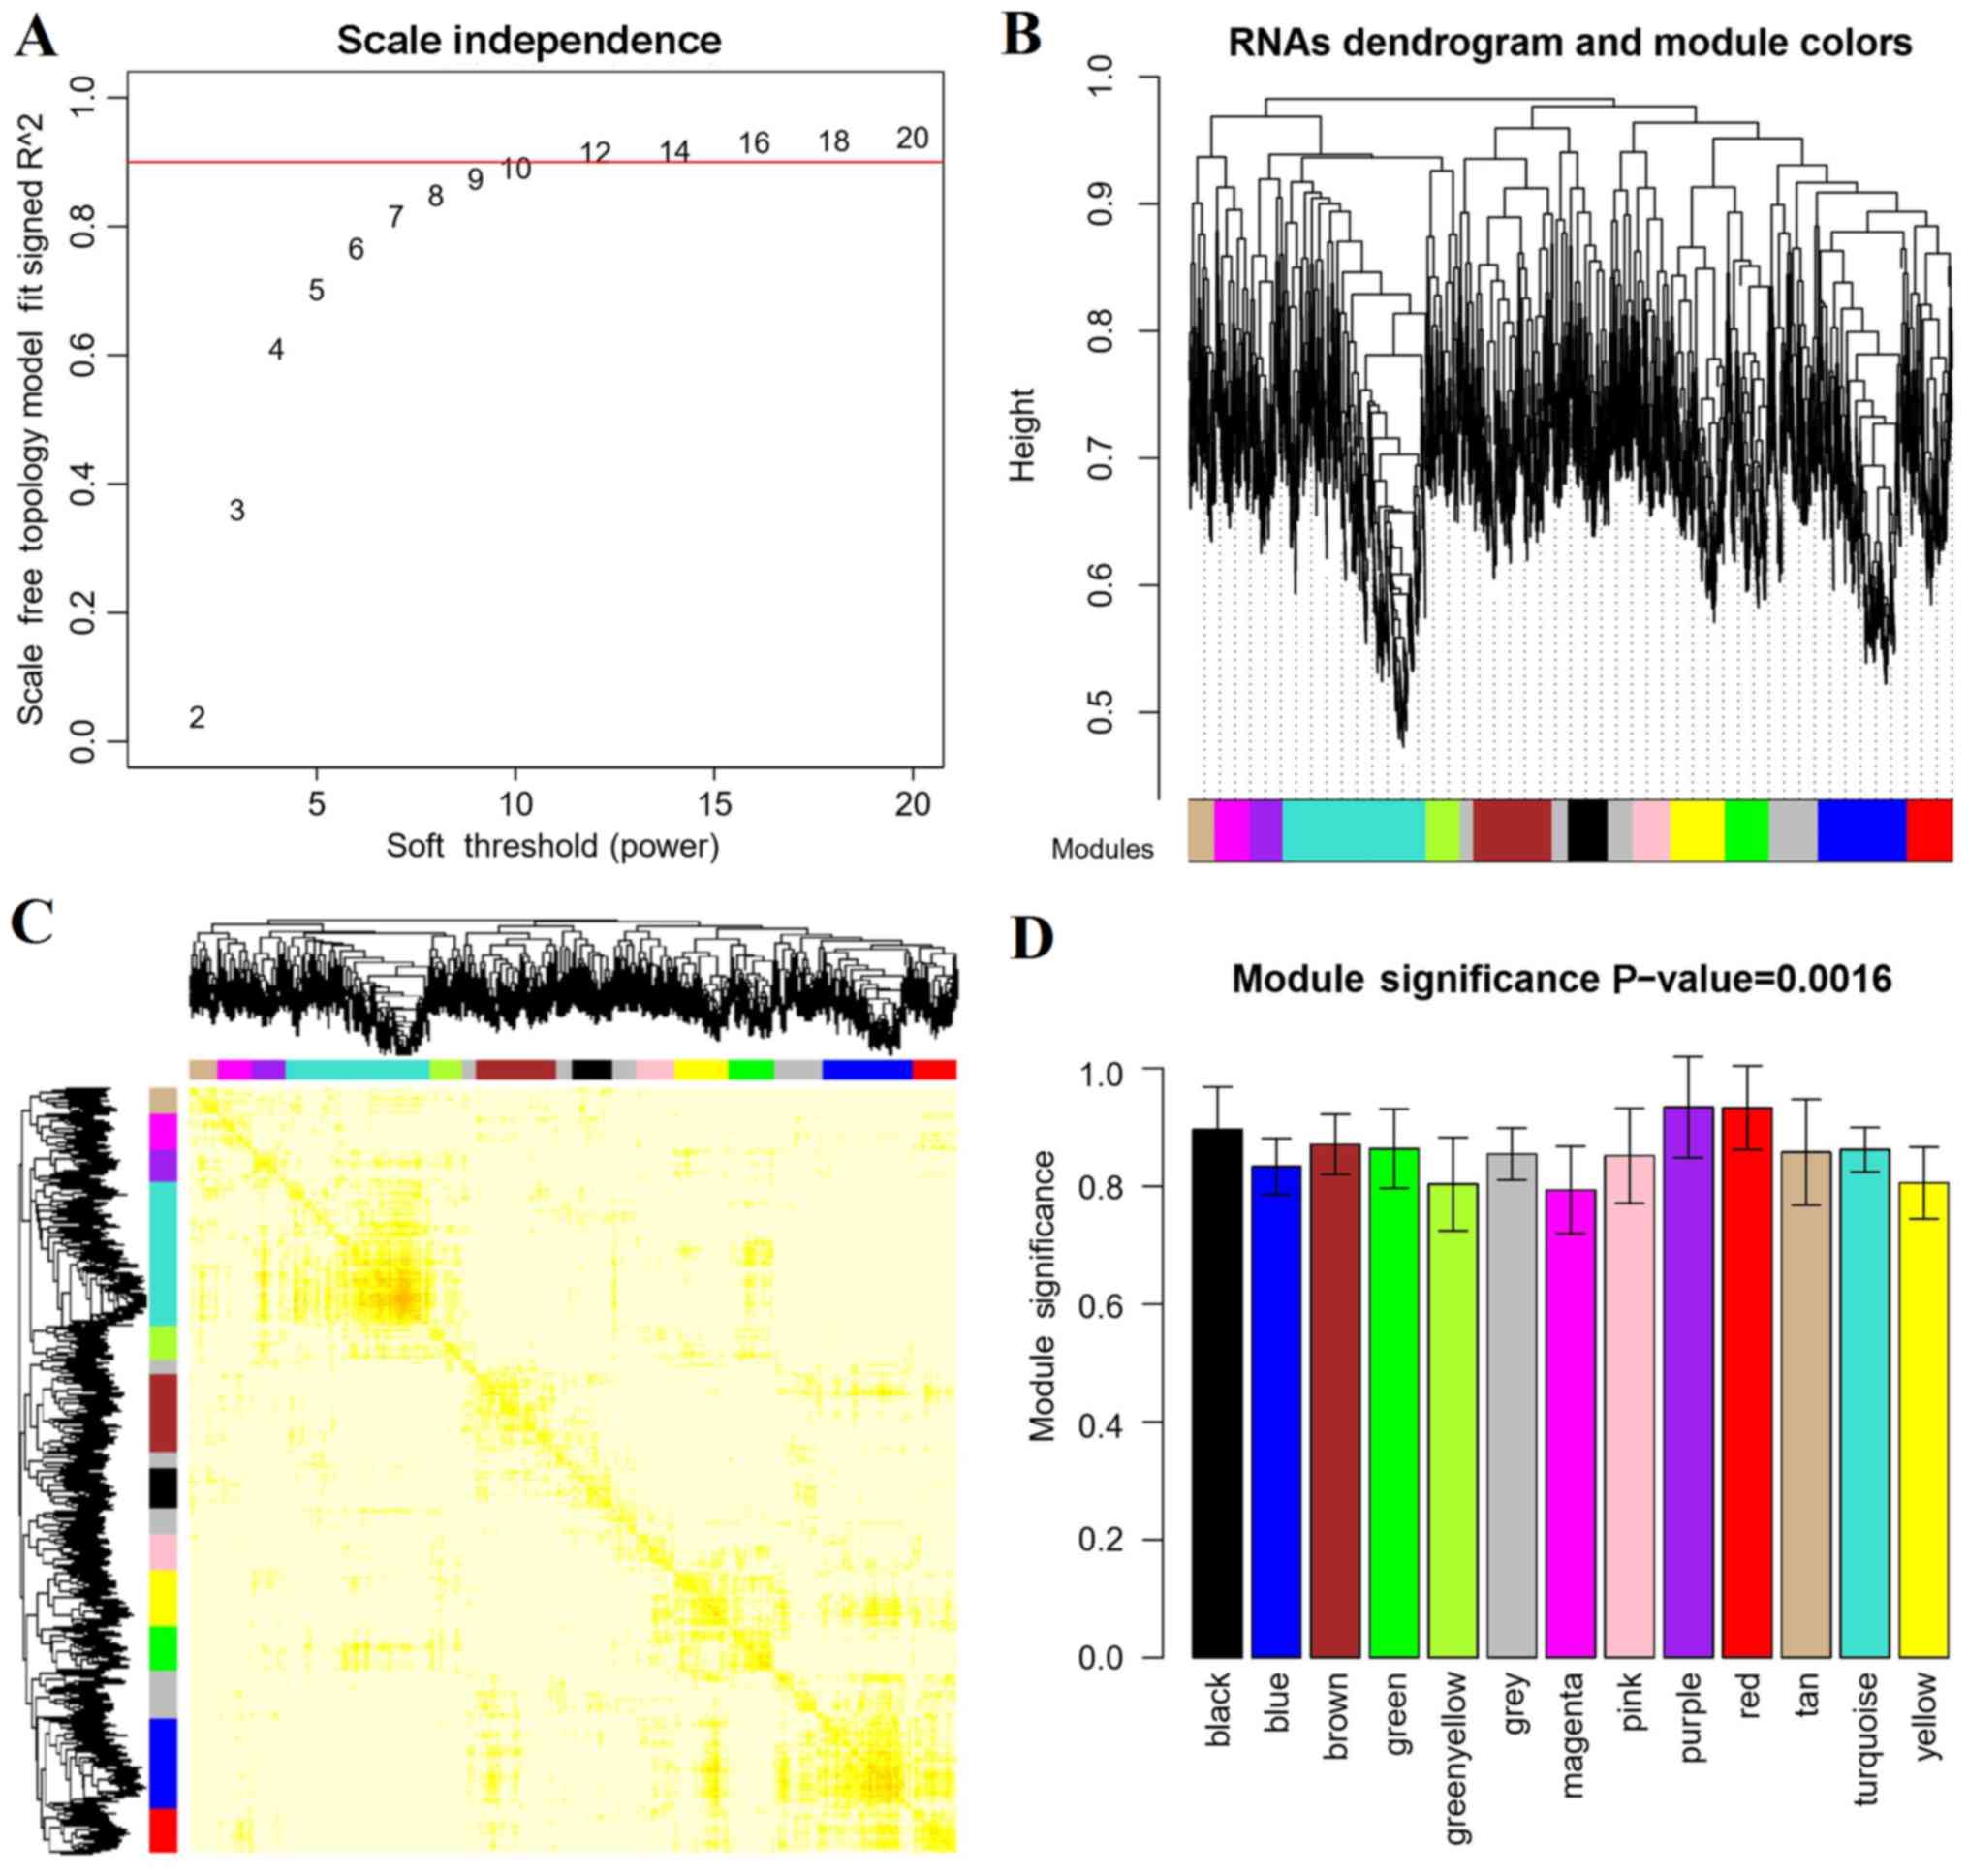
Disease-related RNAs and modules based
on WGCNA analysis
In order to screen the disease-related RNAs,
correlation analysis was performed based on the WGCNA algorithm. As
shown in Fig. 4A, when (correlation
coefficient)2 was up to 0.9, the weight parameter power
was 12. Power=12 was used for the RNA dendrogram and module
analysis, and other parameters were set as gene count=100 and
cutHeight=0.95. A total of 13 modules were obtained (Fig. 4B) and the correlation dendrogram of
modules was presented in Fig. 4C.
The correlations between RNA expression and disease state
(disease/control) were calculated. All modules were significantly
correlated with disease (P=0.0016) and the correlation coefficient
of each module to disease was >0.8 (Fig. 4D and Table II).
| Table II.Correlation and RNA composition of
each module with disease. |
Table II.
Correlation and RNA composition of
each module with disease.
| Module color | Correlation with
disease | Total RNAs | lncRNA | mRNA | miRNA | circRNA |
|---|
| Black | 0.8981 | 188 | 100 | 53 | 6 | 29 |
| Blue | 0.8367 | 423 | 220 | 117 | 6 | 80 |
| Brown | 0.8756 | 372 | 213 | 88 | 15 | 56 |
| Green | 0.8619 | 210 | 114 | 60 | 2 | 34 |
| Green/yellow | 0.8017 | 157 | 89 | 40 | 3 | 25 |
| Grey | 0.8573 | 492 | 267 | 123 | 23 | 79 |
| Magenta | 0.7969 | 165 | 87 | 41 | 7 | 30 |
| Pink | 0.8559 | 178 | 92 | 49 | 2 | 35 |
| Purple | 0.9369 | 158 | 74 | 51 | 3 | 30 |
| Red | 0.9365 | 210 | 103 | 64 | 5 | 38 |
| Tan | 0.8589 | 126 | 80 | 26 | 4 | 16 |
| Turquoise | 0.8611 | 680 | 327 | 201 | 24 | 128 |
| Yellow | 0.8027 | 260 | 125 | 74 | 6 | 55 |
lncRNA-miRNA, circRNA-miRNA and
miRNA-mRNA interactions
A total of 55,064 lncRNA-miRNA interactions were
predicted by the miRcode database. Based on WGCNA analysis, the
lncRNA-miRNA pairs with |correlation coefficient|>0.6 were
collected for the lncRNA-miRNA interaction network. As shown in
Fig. 5A, the lncRNA-miRNA
interaction network was constructed with 450 lncRNA-miRNA
interaction pairs.
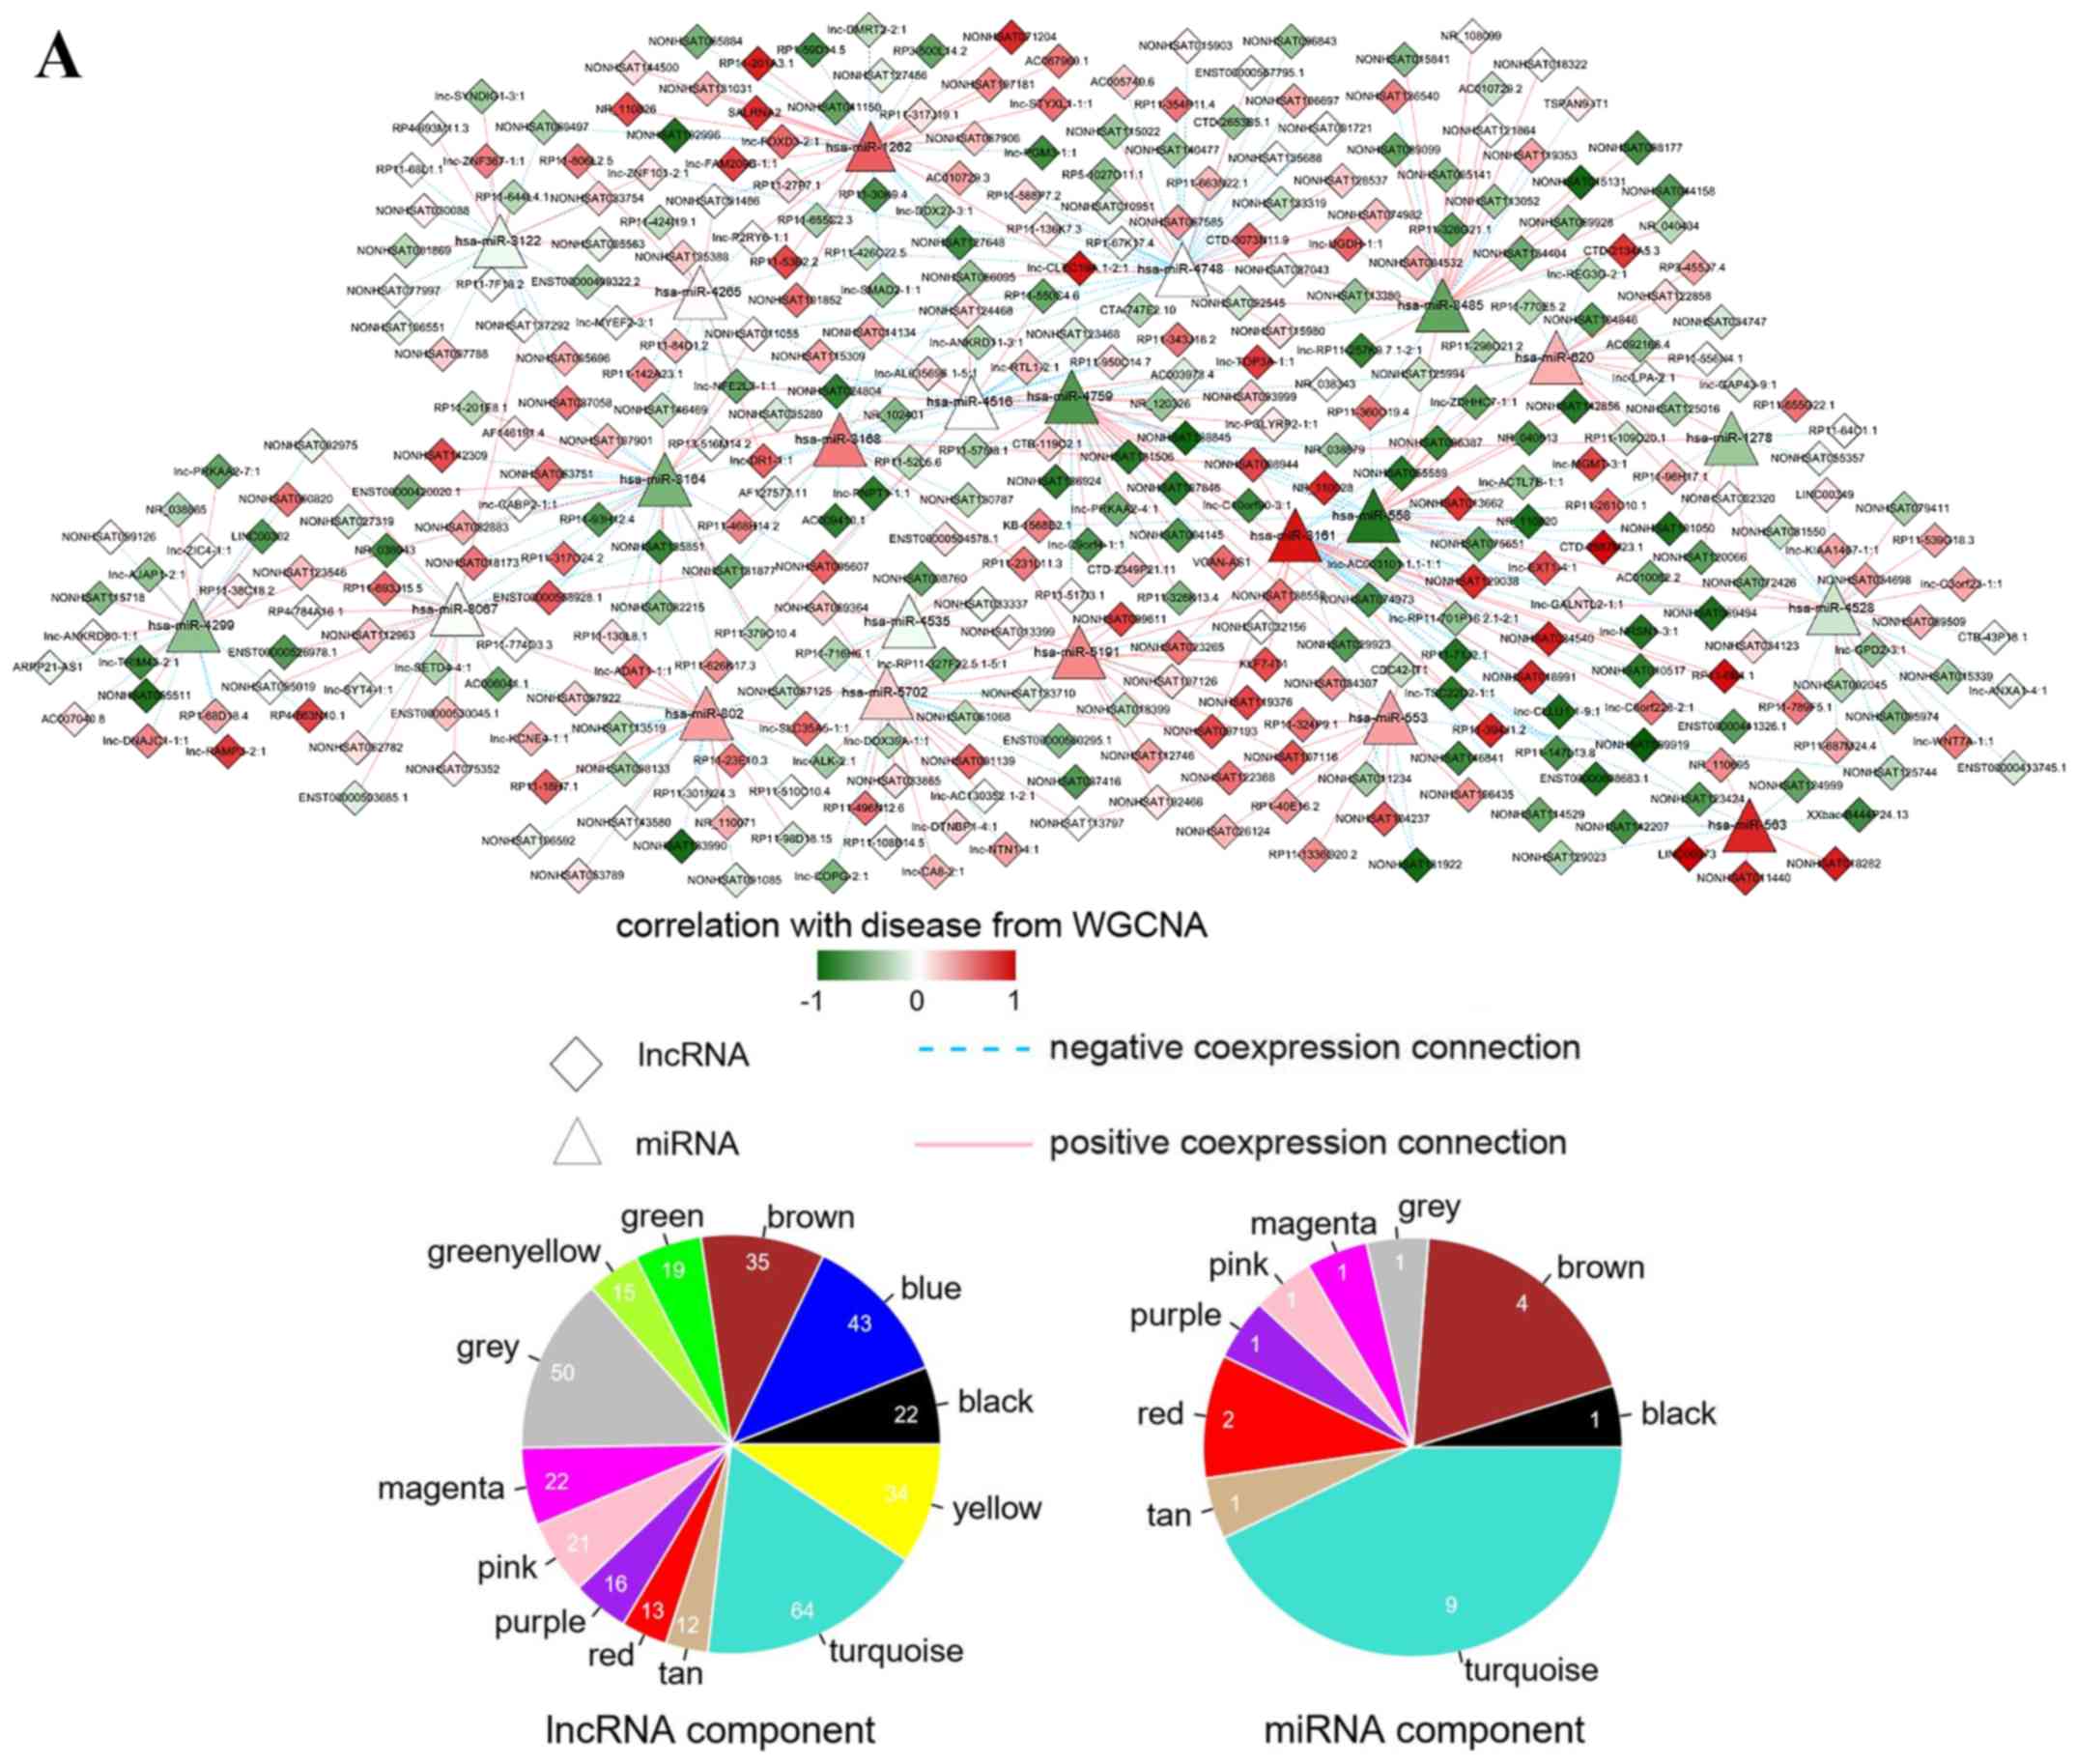 | Figure 5.Interaction networks. (A)
lncRNA-miRNA interaction network: Triangle node represents miRNA
and rhombus node represents lncRNA; color change from green to red
represents negative correlation to positive correlation with
disease based on WGCNA. Red line represents positive correlation
and blue line represents negative correlation. The pie chart shows
the distribution of nodes in WGCNA modules. (B) circRNA-miRNA
interaction network: Triangle node represents miRNA and square node
represents circRNA. (C) miRNA-mRNA interaction network: Triangle
node represents miRNA and circle node represents mRNA. (D) ceRNA
regulatory network: Triangle node represents miRNA, square node
represents circRNA, rhombus node represents lncRNA and circle node
represents mRNA. (E) Subnetwork of ceRNA involved with ETV5,
MEF2C and ELK4. circRNA, circular RNA; ELK4, ETS
transcription factor; ETV5, ETS variant 5; KM, Kaplan-Meier;
lncRNA, long non-coding RNA; MEF2C, myocyte enhancer factor
2C; miRNA/miR, microRNA; WGCNA, weighted gene co-expression network
analysis. |
Based on the information deposited in the starBase
database, 20,480 circRNA-miRNA interactions were collected, among
which 313 pairs had a |correlation coefficient|>0.6. The
circRNA-miRNA interaction network comprised 183 circRNAs and 22
miRNAs connected with 313 edges (Fig.
5B).
A total of 8,275 and 15,573 miRNA-mRNA interactions
were predicted through miRanda and the TargetScan database,
respectively. Among the 425 overlapping interactions, 151
interaction pairs had inverse expression. In addition, 209 mRNA
interaction pairs with a |correlation coefficient|>0.6 were
collected to construct the miRNA-mRNA interaction network. The
network presented 163 nodes (42 miRNAs and 121 mRNAs) and 360 edges
(151 miRNA-mRNA interactions and 209 mRNA-mRNA interactions)
(Fig. 5C). miRNAs and mRNAs in the
network were mainly the members in the turquoise and brown modules
by WGCNA.
ceRNA regulatory network
construction
Based on the aforementioned RNA interactions
obtained, a ceRNA network comprising lncRNA, circRNA, miRNA and
mRNA was constructed (Fig. 5D). The
ceRNA network contained 487 nodes (273 lncRNAs, 156 circRNAs, 14
miRNAs and 44 mRNAs) and 602 edges (317 lncRNA-miRNA interactions,
234 circRNA-miRNA interactions and 51 miRNA-mRNA interactions). The
lncRNA, circRNA and mRNA nodes were mainly members of the turquoise
disease-related module in WGCNA. The miRNAs were mainly from the
turquoise and brown modules.
All mRNAs in the ceRNA network were subjected to
pathway analysis, and six significant KEGG pathways were enriched,
including ‘has05202:Transcriptional misregulation in cancer’,
‘has00603:Glycosphingolipid biosynthesis’ and ‘hsa04010: MAPK
signaling pathway’. The differentially expressed ETS variant 5
(ETV5), myocyte enhancer factor 2C (MEF2C) and ETS
transcription factor (ELK4) were enriched in the
‘transcriptional misregulation in cancer pathway’ (Table III). The ceRNA networks associated
with ETV5, MEF2C and ELK4 were further analyzed. As
shown in Fig. 5E, ETV5, MEF2C
and ELK4 were regulated by hsa-miR-8067, hsa-miR-3161 and
hsa-miR-4528, respectively.
| Table III.Significant pathways enriched by
mRNAs in the ceRNA network. |
Table III.
Significant pathways enriched by
mRNAs in the ceRNA network.
| Term | ID | P-value | Genes |
|---|
| Transcriptional
misregulation in cancer | hsa05202 | 0.0008963 | ETV5, MEF2C,
ELK4 |
| RNA transport | hsa03013 | 0.0139342 | EIF2B1,
GEMIN8 |
| Glycosphingolipid
biosynthesis | hsa00603 | 0.0153436 | DSE,
ST8SIA1 |
| MAPK signaling
pathway | hsa04010 | 0.0288689 | MEF2C,
ELK4 |
| Amino sugar and
nucleotide sugar metabolism | hsa00520 | 0.0492771 | CYB5R4 |
| Notch signaling
pathway | hsa04330 | 0.0492771 | NCSTN |
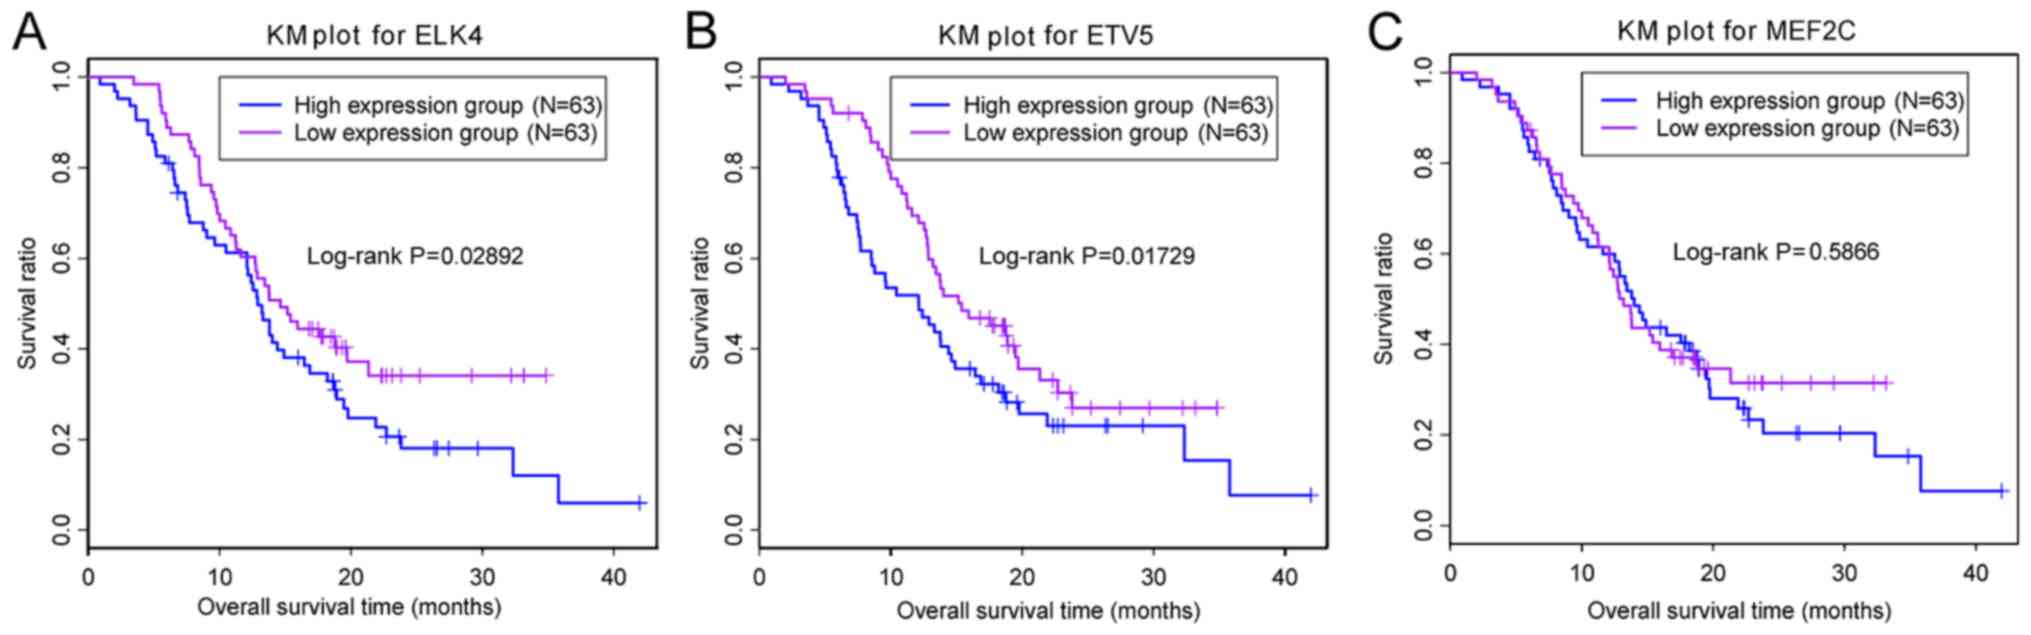
Determination of prognostic
markers
Prognostic marker analysis was performed for
ETV5, MEF2C and ELK4. The samples were classified
into high and low expression groups based on the expression median
of the given gene. The association between gene expression and
prognosis was analyzed. Fig. 6
demonstrated that low expression of ETV5 and ELK4
were significantly associated with a good prognosis, whereas
MEF2C expression was not associated with prognosis.
Discussion
ceRNAs serve an important role in regulating gene
expression. It has been reported that perturbations in ceRNA
networks are closely associated with cancer progression (1). GBM is a common aggressive brain cancer,
known to have a poor prognosis and limited available therapies.
Therefore, ceRNA networks may provide novel tools to understand the
underlying mechanisms of GBM and discover potential novel
therapeutic targets. In the present study, RNA microarray data were
obtained from GBM tumor and paired control tissues. Based on the
RNA expression datasets, a ceRNA network was constructed.
The differential expression of RNAs between GBM and
control samples observed suggested that DE-RNAs may be important
for cancer progression. For instance, it has been demonstrated that
reducing SH2-containing-inositol-5-phosphatase 2 expression affects
the control of cell migration in glioblastoma (18). In addition, inhibition of mammalian
target of rapamycin complex 1 and 2 leads to suppression of GBM
cell proliferation (19). It is well
known that miRNAs are a class of small lncRNAs, which negatively
regulate gene expression at the mRNA level (20). Some ceRNAs, including lncRNAs and
circRNAs, share the target binding sites of miRNAs and
competitively bind in order to affect gene expression and
biological processes (2). The ceRNA
networks contain transcripts that share miRNA response elements
targeted by miRNAs (1). The ceRNA
network analysis performed in the present study revealed that
‘transcriptional misregulation in cancer’ was a markedly altered
pathway in GBM.
ETV5, ELK4, and MEF2C are mRNAs that
exhibited significant differential expression in the most
significantly enriched pathways. ETV5 is a member of the
erythroblast transformation-specific (ETS) family of transcription
factors, and its dysregulation is associated with prostate
(21) and endometrial cancer
(22). A recent study revealed that
ETS pathways are perturbed in the initiation and maintenance of
glioma (23). In addition, Li et
al reported that ETV5 serves a critical role in
perinatal gliogenesis (24). It has
been reported that many ETS family members are upregulated in Kras,
Hras and Erbb tumors (23).
ETV5 is also involved in tumor initiation and gliogenesis
regulation (24). ETV5 may
therefore serve an important role in GBM development. In addition,
prognostic analysis of ETV5 expression in 128 brain nerve
tumor samples revealed that low expression was considerably
associated with a good prognosis, which suggested that high
expression of ETV5 may be a risk factor for GBM.
High expression of ELK4 was also revealed to
be a risk factor for GBM by prognostic analysis. Similar to
ETV5, ELK4 is an ETS-domain transcription factor. ETS
transcription factors serve regulatory roles in gene expression and
various biological processes, including cellular proliferation,
differentiation, development and apoptosis (25). ETS transcription factors have
previously been suggested as candidate therapeutic targets for
cancer (26). In addition, ETS gene
rearrangement and fusion are frequently observed in prostate cancer
(27,28). The solute carrier family 45, member
3-ELK4 is a novel fusion transcript highly expressed in
patients with prostate cancer (29).
Some ETS genes, including ETV1, ETV4, ETV5 and ELK4,
have been reported to be rearranged in prostate cancer (28). In addition, ELK4 promotes
apoptosis in glioma by inhibiting the expression of the
anti-apoptotic protein myeloid cell leukemia-1 (30). Downregulation of ELK4
inhibited GBM tumor formation and ELK4 was defined as a
novel target for GBM therapy (30).
In the present study, ELK4 was considerably upregulated in
GBM tumor samples, and these high expression levels were associated
with a poor prognosis, which was consistent with previous findings.
Altogether, these results suggested that ELK4 may serve a
critical role in GBM formation.
The ceRNA network analysis revealed that ETV5
was regulated by miR-8067, and that ELK4 was a target for
miR-4528. In a previous study, miR-4528 was revealed to be
differentially expressed in colon cancer (31). Although the evidence for a critical
role of miR-8067 and miR-4528 in GBM is minimal, they may aid the
regulation of ELK4 and ETV5, and further
investigation is required.
In the present study, the ceRNA analysis indicated
that the ‘transcriptional misregulation in cancer’ pathway, which
involves ELK4 and ETV5, was considerably dysregulated
in GBM tumor samples. Therefore, ELK4 and ETV5 may be
critical in tumor formation, and their expression levels were
significantly associated with prognosis. ELK4 and
ETV5 may be considered as prognostic markers for GBM, and
the miRNAs regulating their expression may be candidate targets for
GBM. In order to verify these assumptions, further investigations
are required.
Despite its interesting findings, the present study
had some limitations. Firstly, experimental verifications of the
results using clinical specimens or cell lines have not been
included due to insufficient material and funding. In addition, the
sample size was not large enough to produce significant results. In
conclusion, due to the analysis design and comprehensive
bioinformatics analysis, the results obtained in the present study
may be of great interest to identify novel prognostic markers for
GBM. Further validation will be the focus of further studies.
Acknowledgements
The authors would like to thank Professor Fengping
Shan (Department of Immunology, China Medical University) for
critical advice for the manuscript and Dr Wei Song (Bioinformatics
Department, Eryun Information Technology Co., Ltd., Shanghai,
China) for technical assistance.
Funding
No funding was received.
Availability of data and materials
The datasets used and/or analyzed during the current
study are available from the corresponding author on reasonable
request.
Authors' contributions
HW and YT conceived and designed the experiments. HZ
and JZ performed the statistical analyses. HW and JZ interpreted
the data. HW, HZ and JZ drafted the manuscript. HW and YT revised
the manuscript. All authors have read and approved the final
manuscript.
Ethics approval and consent to
participate
The study was approved by the Ethics Committee of
Luhe Hospital Affiliated to Capital Medical University (Beijing,
China), and all patients provided informed consent.
Patient consent for publication
Not applicable.
Competing interests
The authors declare that they have no competing
interests.
Glossary
Abbreviations
Abbreviations:
|
GBM
|
glioblastoma
|
|
ceRNA
|
competing endogenous RNAs
|
References
|
1
|
Salmena L, Poliseno L, Tay Y, Kats L and
Pandolfi Pier P: A ceRNA hypothesis: The rosetta stone of a hidden
RNA language? Cell. 146:353–358. 2011. View Article : Google Scholar : PubMed/NCBI
|
|
2
|
Tay Y, Kats L, Salmena L, Weiss D, Tan SM,
Ala U, Karreth F, Poliseno L, Provero P, Di Cunto F, et al:
Coding-independent regulation of the tumor suppressor PTEN by
competing endogenous mRNAs. Cell. 147:344–357. 2011. View Article : Google Scholar : PubMed/NCBI
|
|
3
|
Young RM, Jamshidi A, Davis G and Sherman
JH: Current trends in the surgical management and treatment of
adult glioblastoma. Ann Transl Med. 3:1212015.PubMed/NCBI
|
|
4
|
Gallego O: Nonsurgical treatment of
recurrent glioblastoma. Curr Oncol. 22:e273–E281. 2015. View Article : Google Scholar : PubMed/NCBI
|
|
5
|
Condon DM and Revelle W: The international
cognitive ability resource: Development and initial validation of a
public-domain measure. Intelligence. 43:52–64. 2014. View Article : Google Scholar
|
|
6
|
Parrish RS and Spencer HJ III: Effect of
normalization on significance testing for oligonucleotide
microarrays. J Biopharm Stat. 14:575–589. 2004. View Article : Google Scholar : PubMed/NCBI
|
|
7
|
Smyth GK: Limma: Linear models for
microarray data. Gentleman R, Carey V, Dudoit S, Irizarry R and
Huber W: Bioinformatics and Computational Biology Solutions Using R
and Bioconductor. Springer; New York, NY: pp. 397–420. 2005,
View Article : Google Scholar
|
|
8
|
Wang L, Cao C, Ma Q, Zeng Q, Wang H, Cheng
Z, Zhu G, Qi J, Ma H, Nian H and Wang Y: RNA-seq analyses of
multiple meristems of soybean: Novel and alternative transcripts,
evolutionary and functional implications. BMC Plant Biol.
14:1692014. View Article : Google Scholar : PubMed/NCBI
|
|
9
|
Huang da W, Sherman BT and Lempicki RA:
Systematic and integrative analysis of large gene lists using DAVID
bioinformatics resources. Nat Protoc. 4:44–57. 2009. View Article : Google Scholar : PubMed/NCBI
|
|
10
|
Liao Q, Liu C, Yuan X, Kang S, Miao R,
Xiao H, Zhao G, Luo H, Bu D, Zhao H, et al: Large-scale prediction
of long non-coding RNA functions in a coding-non-coding gene
co-expression network. Nucleic Acids Res. 39:3864–3878. 2011.
View Article : Google Scholar : PubMed/NCBI
|
|
11
|
Langfelder P and Horvath S: WGCNA: An R
package for weighted correlation network analysis. Bmc
Bioinformatics. 9:5592008. View Article : Google Scholar : PubMed/NCBI
|
|
12
|
Jeggari A, Marks DS and Larsson E:
miRcode: A map of putative microRNA target sites in the long
non-coding transcriptome. Bioinformatics. 28:2062–2063. 2012.
View Article : Google Scholar : PubMed/NCBI
|
|
13
|
Yang JH, Li JH, Shao P, Zhou H, Chen YQ
and Qu LH: starBase: A database for exploring microRNA-mRNA
interaction maps from Argonaute CLIP-Seq and Degradome-Seq data.
Nucleic Acids Res 39 (Database issue). D202–D209. 2011. View Article : Google Scholar
|
|
14
|
Shannon P, Markiel A, Ozier O, Baliga NS,
Wang JT, Ramage D, Amin N, Schwikowski B and Ideker T: Cytoscape: A
software environment for integrated models of biomolecular
interaction networks. Genome Res. 13:2498–2504. 2003. View Article : Google Scholar : PubMed/NCBI
|
|
15
|
John B, Enright AJ, Aravin A, Tuschl T,
Sander C and Marks DS: Human MicroRNA targets. PLoS Biol.
2:e3632004. View Article : Google Scholar : PubMed/NCBI
|
|
16
|
Fromm B, Billipp T, Peck LE, Johansen M,
Tarver JE, King BL, Newcomb JM, Sempere LF, Flatmark K, Hovig E and
Peterson KJ: A uniform system for the annotation of vertebrate
microRNA genes and the evolution of the human microRNAome. Annu Rev
Genet. 49:213–242. 2015. View Article : Google Scholar : PubMed/NCBI
|
|
17
|
Gao KM, Chen XC, Zhang JX, Wang Y, Yan W
and You YP: A pseudogene-signature in glioma predicts survival. J
Exp Clin Cancer Res. 34:232015. View Article : Google Scholar : PubMed/NCBI
|
|
18
|
Ramos AR, Elong Edimo W and Erneux C:
Phosphoinositide 5-phosphatase activities control cell motility in
glioblastoma: Two phosphoinositides PI(4,5)P2 and PI(3,4)P2 are
involved. Adv Biol Regul. 67:40–48. 2018. View Article : Google Scholar : PubMed/NCBI
|
|
19
|
Jhanwar-Uniyal M, Gillick JL, Neil J,
Tobias M, Thwing ZE and Murali R: Distinct signaling mechanisms of
mTORC1 and mTORC2 in glioblastoma multiforme: A tale of two
complexes. Adv Biol Regul. 57:64–74. 2015. View Article : Google Scholar : PubMed/NCBI
|
|
20
|
Lewis BP, Burge CB and Bartel DP:
Conserved seed pairing, often flanked by adenosines, indicates that
thousands of human genes are microRNA targets. Cell. 120:15–20.
2005. View Article : Google Scholar : PubMed/NCBI
|
|
21
|
Helgeson BE, Tomlins SA, Shah N, Laxman B,
Cao Q, Prensner JR, Cao X, Singla N, Montie JE, Varambally S, et
al: Characterization of TMPRSS2:ETV5 and SLC45A3:ETV5 gene fusions
in prostate cancer. Cancer Res. 68:73–80. 2008. View Article : Google Scholar : PubMed/NCBI
|
|
22
|
Monge M, Colas E, Doll A, Gonzalez M,
Gil-Moreno A, Planaguma J, Quiles M, Arbos MA, Garcia A, Castellvi
J, et al: ERM/ETV5 up-regulation plays a role during myometrial
infiltration through matrix metalloproteinase-2 activation in
endometrial cancer. Cancer Res. 67:6753–6759. 2007. View Article : Google Scholar : PubMed/NCBI
|
|
23
|
Breunig JJ, Levy R, Antonuk CD, Molina J,
Dutra-Clarke M, Park H, Akhtar AA, Kim GB, Town T, Hu X, et al: Ets
factors regulate neural stem cell depletion and gliogenesis in ras
pathway glioma. Cell Rep. 17:34072016. View Article : Google Scholar : PubMed/NCBI
|
|
24
|
Li X, Newbern JM, Wu Y, Morgan-Smith M,
Zhong J, Charron J and Snider WD: MEK is a key regulator of
gliogenesis in the developing brain. Neuron. 75:1035–1050. 2012.
View Article : Google Scholar : PubMed/NCBI
|
|
25
|
Seth A and Watson DK: ETS transcription
factors and their emerging roles in human cancer. Eur J Cancer.
41:2462–2478. 2005. View Article : Google Scholar : PubMed/NCBI
|
|
26
|
Oikawa T: ETS transcription factors:
Possible targets for cancer therapy. Cancer Sci. 95:626–633. 2004.
View Article : Google Scholar : PubMed/NCBI
|
|
27
|
Gasi Tandefelt D, Boormans J, Hermans K
and Trapman J: ETS fusion genes in prostate cancer. Endocr Relat
Cancer. 21:R143–R152. 2014. View Article : Google Scholar : PubMed/NCBI
|
|
28
|
Shaikhibrahim Z, Braun M, Nikolov P, Boehm
D, Scheble V, Menon R, Fend F, Kristiansen G, Perner S and Wernert
N: Rearrangement of the ETS genes ETV-1, ETV-4, ETV-5, and ELK-4 is
a clonal event during prostate cancer progression. Human Pathol.
43:1910–1916. 2012. View Article : Google Scholar
|
|
29
|
Rickman DS, Pflueger D, Moss B, VanDoren
VE, Chen CX, de la Taille A, Kuefer R, Tewari AK, Setlur SR,
Demichelis F and Rubin MA: SLC45A3-ELK4 is a novel and frequent
erythroblast transformation-specific fusion transcript in prostate
cancer. Cancer Res. 69:2734–2748. 2009. View Article : Google Scholar : PubMed/NCBI
|
|
30
|
Day BW, Stringer BW, Spanevello MD,
Charmsaz S, Jamieson PR, Ensbey KS, Carter JC, Cox JM, Ellis VJ,
Brown CL, et al: ELK4 neutralization sensitizes glioblastoma to
apoptosis through downregulation of the anti-apoptotic protein
Mcl-1. Neuro Oncol. 13:1202–1212. 2011. View Article : Google Scholar : PubMed/NCBI
|
|
31
|
Wang YN, Chen ZH and Chen WC: Novel
circulating microRNAs expression profile in colon cancer. A pilot
study Eur J Med Res. 22(51)2017.PubMed/NCBI
|