Introduction
It has been reported that there are ~3.19 glioma
cases in every 100,000 people in USA (1). Similar trends were reported in China
(2), with >101,600 new glioma
cases and >61,100 glioma-associated mortalities were estimated
in 2015; however, the clinical outcome of glioma is unfavorable,
with a 5-year overall survival rate of <5%. Although clinical
indicators have provided beneficial information (3,4),
determining the prognosis of patients with glioma remains notably
difficult, due to genetic differences between individuals (5,6).
Isocitrate dehydrogenase [NADP(+)]1/2 mutations have been
emphasized as prognostic biomarkers over the past decade and have
been used clinically (7–9). Nevertheless, single mutational
biomarkers remain inadequate for prognosis prediction.
Previous studies have screened single biomarkers for
the prognosis of glioma (10,11). It
has been reported that the mRNA and protein expression of RAB34 are
notably associated with poor survival rates in patients with glioma
(12). Similarly, overexpression of
Roundabout4 has been demonstrated to predict a poor clinical
outcome of glioma by affecting micro-vessel density (13). microRNAs (miRs), including miR-34a,
have been reported to be correlated with the survival of patients
with glioma (14). Nevertheless,
none of the aforementioned biomarkers, except for IDH1/2 mutation,
have been used clinically, and the biomarkers currently utilized in
the clinic remain limited. Multiple gene-based prognostic models,
which combine information from single biomarkers and effectively
remove the redundant information of genomes/transcriptomes, have
been reported (15–17). Clinically used models, including
Mammaprint and OncotypeDX, have been beneficial tools for prognosis
and therapy guidance (18–20); however, to the best of our knowledge,
these models have not been employed to determine the prognosis of
glioma to date.
In the present study, the prognostic genes in glioma
were selected by associating gene expression and overall survival
in The Cancer Genome Atlas (TCGA) cohort, and the prognostic effect
was further validated in 1,016 samples across five independent
datasets. The signatures were not significantly associated with
clinical indicators, and associated biological pathways were
therefore identified.
Materials and methods
Data pre-processing
The primary glioma samples from TCGA, GSE4412
(21), GSE16011 (22), GSE16581 (23) and GSE42669 (24) were used in the present study, whilst
the other sample types, with the exception of primary glioma, were
excluded. The gene expression data from the TCGA cohort (evaluated
using RNA-seq technique) was downloaded from the official website
of TCGA (https://gdc-docs.nci.nih.gov/). Following
upper-quantile normalization, the FPKM values of each gene was log
2 transformed. The cohorts generated from microarray (GSE4412,
GSE16011, GSE16581 and GSE42669) were downloaded from the Gene
Expression Omnibus (https://www.ncbi.nlm.nih.gov/geo) website using the
corresponding accession number. The raw data were normalized using
limma package of R software in a single cohort, and a gene
expression matrix was generated, according to the raw data, where
rows represented the genes and columns represented the samples. To
reduce the complexity, probes representing the same gene were
calculated using the mean average value. To eliminate the bias
brought by the platforms, z-scores were calculated in each cohort
for subsequent analyses.
Optimizing panel and model
development
Cox univariate regression was implemented by
associating the overall survival and gene expression information of
the TCGA (n=529) dataset. Genes significantly associated with
overall survival (P<0.01) were selected as candidate genes for
model development. Redundant information existed among the
candidate genes, due to complex regulations. To narrow the panel,
the redundant information was removed, utilization was facilitated,
and a machine learning algorithm called random forest variable
selection method was used in this step. Using the selected 31 genes
generated (Table I), Cox
multivariate regression was performed by associating the overall
survival and expression of these 31 genes. The coefficient of each
gene is listed in Table I.
 | Table I.Parameters of candidate genes. |
Table I.
Parameters of candidate genes.
|
| Cox univariate | Cox multivariate |
|---|
|
|
|
|
|---|
| Entrez_ID | HR | 95% CI | P-value | HR | 95% CI | P-value |
|---|
| 6383 | 1.2 | 1.1–1.3 | 0.00032a | 0.96 | 0.84–1.1 | 0.547 |
| 4493 | 1.2 | 1.1–1.3 |
8×10⁵a | 1.05 | 0.93–1.18 | 0.433 |
| 4223 | 1.1 | 1-1.1 | 0.00036a | 1.00 | 0.93–1.07 | 0.948 |
| 4016 | 1.1 | 1.1–1.2 | 0.00027a | 1.05 | 0.94–1.17 | 0.411 |
| 9922 | 1.4 | 1.1–1.6 |
0.00031a | 0.97 | 0.76–1.23 | 0.777 |
| 3383 | 1.2 | 1.1–1.3 |
0.00085a | 0.88 | 0.72–1.08 | 0.217 |
| 1116 | 1.1 | 1.1–1.1 | 1×10⁵a | 0.98 | 0.9–1.07 | 0.725 |
| 9332 | 1.1 | 1-1.2 | 4×10⁴a | 1.03 | 0.94–1.13 | 0.492 |
| 716 | 1.1 | 1.1–1.2 | 3×10⁵a | 1.06 | 0.94–1.2 | 0.311 |
| 622 | 1.3 | 1.1–1.5 | 3×10⁵a | 1.14 | 0.95–1.37 | 0.153 |
| 597 | 1.1 | 1.1–1.2 |
0.00076a | 1.06 | 0.92–1.23 | 0.385 |
| 10630 | 1.1 | 1.1–1.2 |
<0.001a | 1.02 | 0.91–1.14 | 0.727 |
| 4615 | 1.3 | 1.1–1.5 |
0.00015a | 0.86 | 0.68–1.1 | 0.236 |
| 3964 | 1.3 | 1.1–1.4 | 1×10⁴a | 1.07 | 0.84–1.37 | 0.574 |
| 3669 | 1.2 | 1.1–1.3 |
0.00045a | 1.01 | 0.87–1.18 | 0.855 |
| 487 | 0.32 | 0.18–0.56 | 7×10⁵a | 0.44 | 0.22–0.89 | 0.022a |
| 7253 | 0.67 | 0.53–0.84 |
0.00072a | 0.8 | 0.62–1.03 | 0.080 |
| 7132 | 1.2 | 1.1–1.4 |
0.00046a | 0.8 | 0.63–1 | 0.049a |
| 6988 | 1.3 | 1.1–1.5 | 8×10⁵a | 1.2 | 0.97–1.48 | 0.085 |
| 11000 | 1.2 | 1.1–1.3 | 4×10⁵a | 0.99 | 0.86–1.15 | 0.911 |
| 6279 | 1.1 | 1-1.2 |
0.00042a | 1.04 | 0.93–1.17 | 0.499 |
| 5154 | 1.2 | 1.1–1.2 |
0.00017a | 1.06 | 0.94–1.19 | 0.367 |
| 4599 | 1.1 | 1-1.2 |
0.00091a | 1.05 | 0.96–1.15 | 0.264 |
| 4478 | 1.3 | 1.1–1.4 | 1×10⁵a | 0.92 | 0.75–1.11 | 0.378 |
| 3281 | 0.73 | 0.61–0.87 |
0.00049a | 0.62 | 0.49–0.77 |
3.00E-05a |
| 8324 | 1.2 | 1.1–1.3 | 1×10⁵a | 1.05 | 0.93–1.19 | 0.433 |
| 6990 | 1.3 | 1.1–1.4 |
<0.001a | 1.06 | 0.88–1.28 | 0.556 |
| 4192 | 1.2 | 1.1–1.3 | 3×10⁵a | 1.06 | 0.94–1.21 | 0.343 |
| 2887 | 1.2 | 1.1–1.3 | 0.001a | 1 | 0.87–1.13 | 0.953 |
| 11068 | 1.4 | 1.2–1.7 |
0.00052a | 0.94 | 0.68–1.31 | 0.729 |
| 1819 | 1.5 | 1.3–1.8 |
<0.001a | 1.28 | 0.97–1.7 | 0.086 |
Gene panel optimization and model
development
Expression of genes significantly associated with
overall survival, as determined by Cox univariate regression
(P<0.01), were identified for further analysis in the TCGA
cohort. The random forest variable selection was conducted using
the following parameters: 100 iterations and 100 repeats.
Subsequently, the top selected gene list (panel) using this random
forest survival algorithm was optimized for model development. The
model was developed using Cox multivariate regression by
associating the optimized panel and overall survival information in
the TCGA cohort. The glioma risk score was calculated using the
following formula:
Risk score=∑inbi*ei
Where bi is the coefficient, and
ei is the relative expression of corresponding gene.
Statistical analysis
All analyses listed in the present study were
implemented on an R programming platform (www.r-project.org; v3.2.0). The clinical information
of samples in TCGA cohort was listed as following: 439 received
radiation and 98 did not. The median age was 59 years old (1st-3rd
quartile, 50–68 years, and 60 was used as a cut-off value); 235
females and 375 males. Genes significantly associated with survival
were identified using Cox univariate regression (P<0.01), and
the risk score was calculated using Cox multivariate regression in
TCGA cohort. The Gene Set Enrichment Analysis (GSEA) was
implemented on the publicly released GSEA 3.0 software (25). The nomogram was plotted with the R
package ‘rms’, and random forest variable selection was implemented
with the package ‘randomforestSRC’ (26,27). The
receiving operating characteristic (ROC) curve was calculated using
the package ‘pROC’ (28).
Kaplan-Meier method and log-rank test was used to determine the
survival difference between high-risk and low-risk groups.
Association between risk score and clinical indicators were assayed
using unpaired Student's t-test. P<0.05 was considered to
indicate a statistically significant difference.
Results
Prognostic value of SACH-CASS in the
TCGA cohort
The prognostic performance of the signatures was
assessed in the TCGA cohort. The samples of the TCGA cohort were
divided into high-score and low-score groups, according to the
median risk score value, and the survival difference between the
high- and low-risk groups was later compared. The patients in the
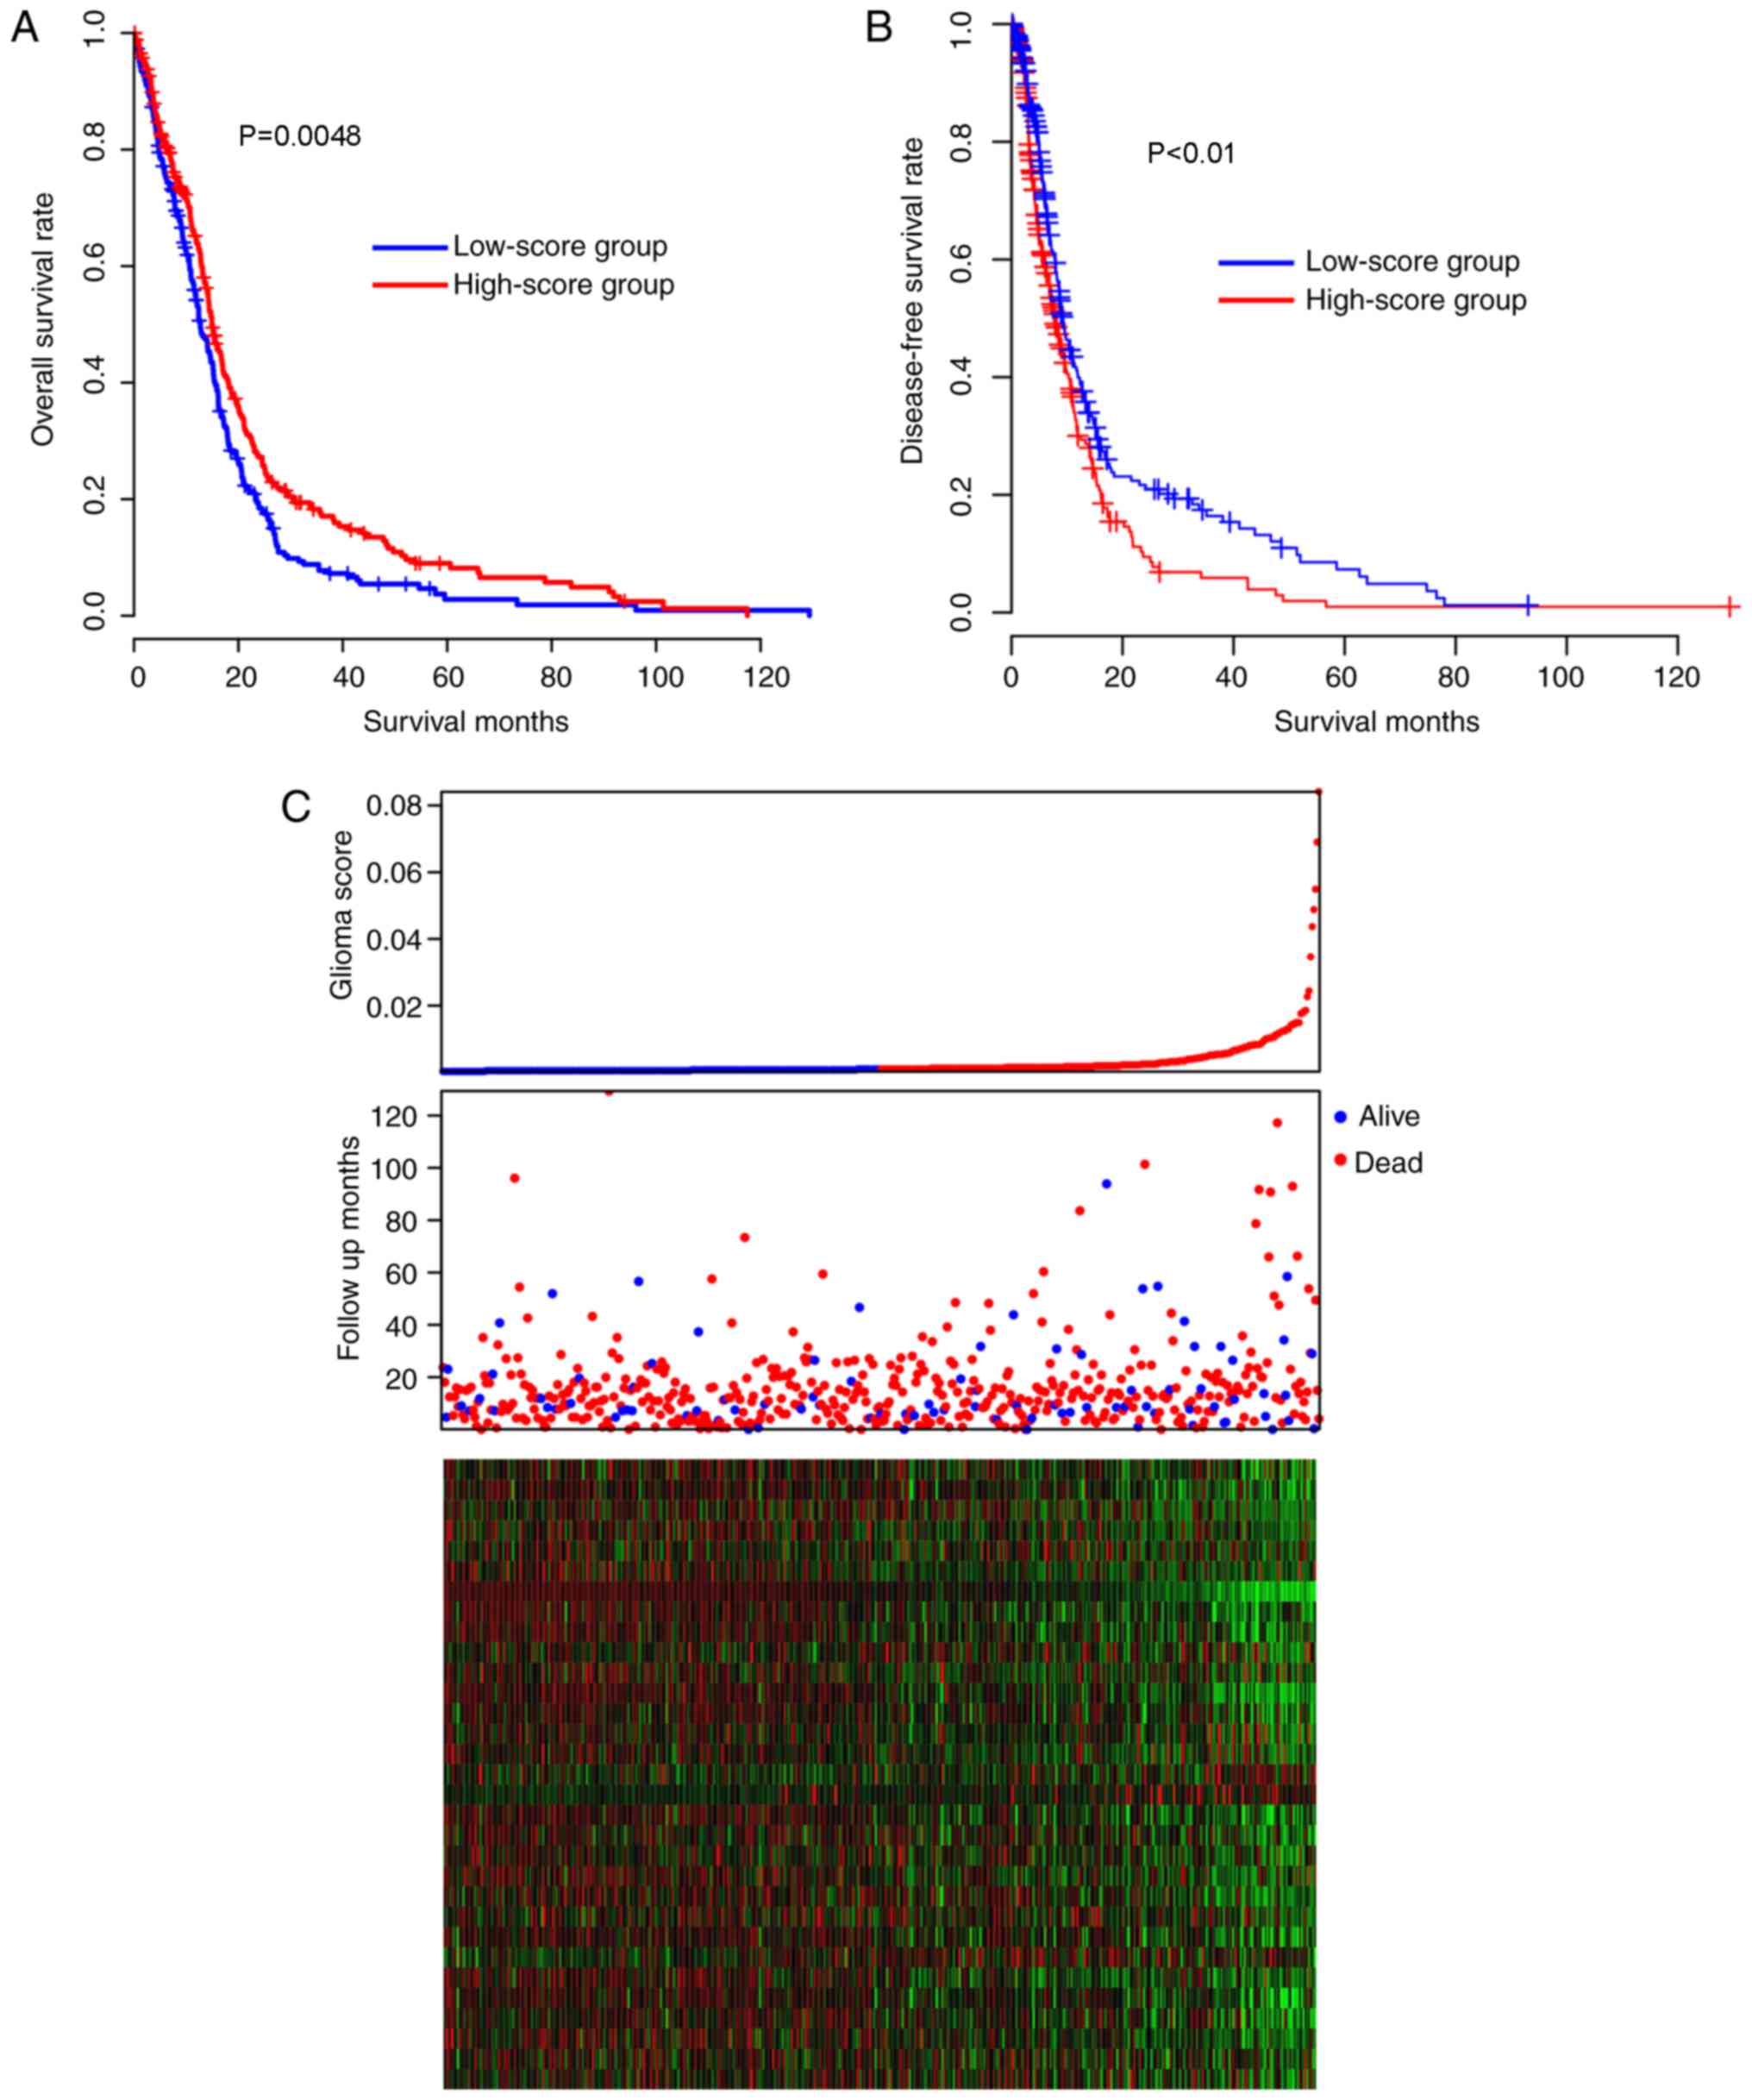
low-score group had a significantly (Kaplan-Meier test, P=0.00048]
reduced overall survival time [median survival time, 12.7 months;
95% confidence interval (CI), 11.7–15.1 months), compared with the
patients in the high-score group (median survival time, 14.9
months, 95% CI, 14.0–16.9 months; Fig.
1A). The disease-free survival difference between the high and
low-risk groups were also compared. The low-score group had
significantly increased disease-free survival time, compared with
the high-score group (Fig. 1B;
P<0.05). As depicted in Fig. 1C,
low-score samples were characterized by early incidence, high
expression of glioma-promoting genes and low expression of
glioma-suppressing genes (middle panel, red dots). Taken together,
these results indicated that the glioma scores are important and
beneficial clinical indicators for glioma in the TCGA cohort.
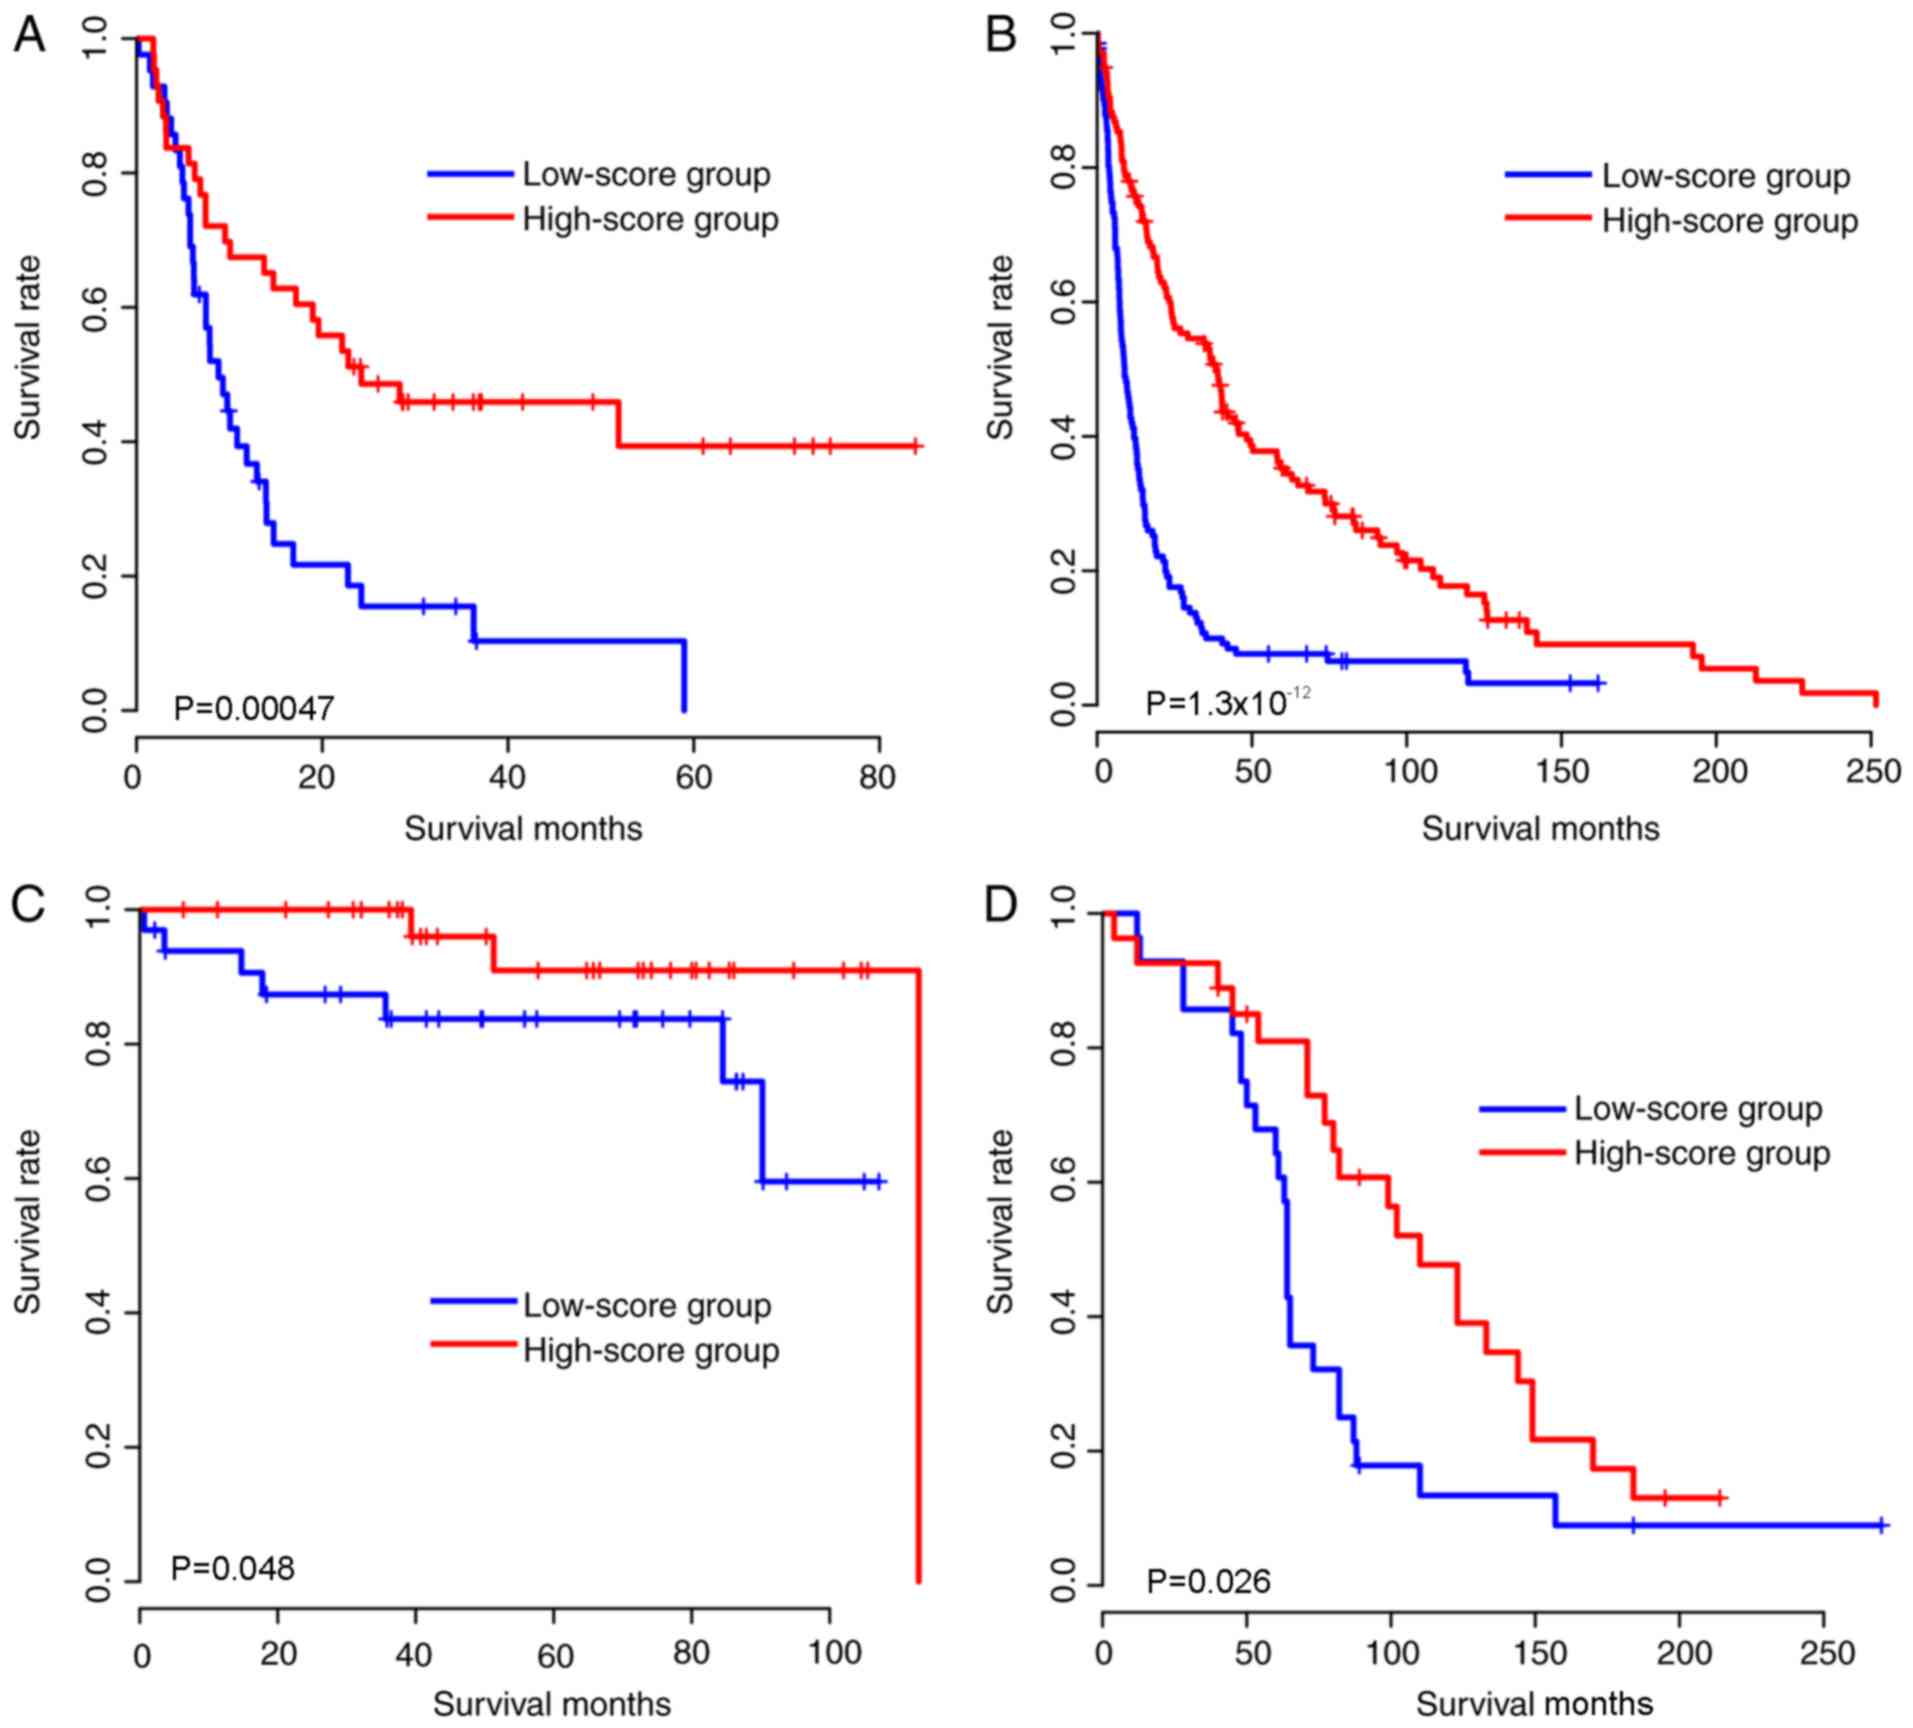
Robustness of risk score
Due to the model being developed based on expression
in the TCGA cohort, the validity of the model may result from
over-fitness, as the model may only be effective in the TCGA
cohort. Therefore, in order to evaluate the robustness of the risk
score in an unbiased manner, The coefficients of these 31 genes
were locked, therefore, the coefficients of these genes were
identical to the TCGA cohort. the risk score of each sample in the
validation cohorts (expression data were generated using
microarray) was calculated, including the samples from the
following: GSE4412, GSE16011, GSE16581 and GSE42669 cohorts.
Similarly, to the training cohort, the samples in each cohort were
subsequently divided into high-score and low-score groups according
to the median glioma risk score, and the survival difference
between high-score and low-score groups was compared (Fig. 2A-D). As expected, the gene expression
pattern was similar to that of the TCGA cohort (Fig. 2E-H). Taken together, the
aforementioned results indicated that the glioma risk scores are
robust in predicting glioma survival across cohorts and
platforms.
Existing clinicopathological
indicators and glioma risk score
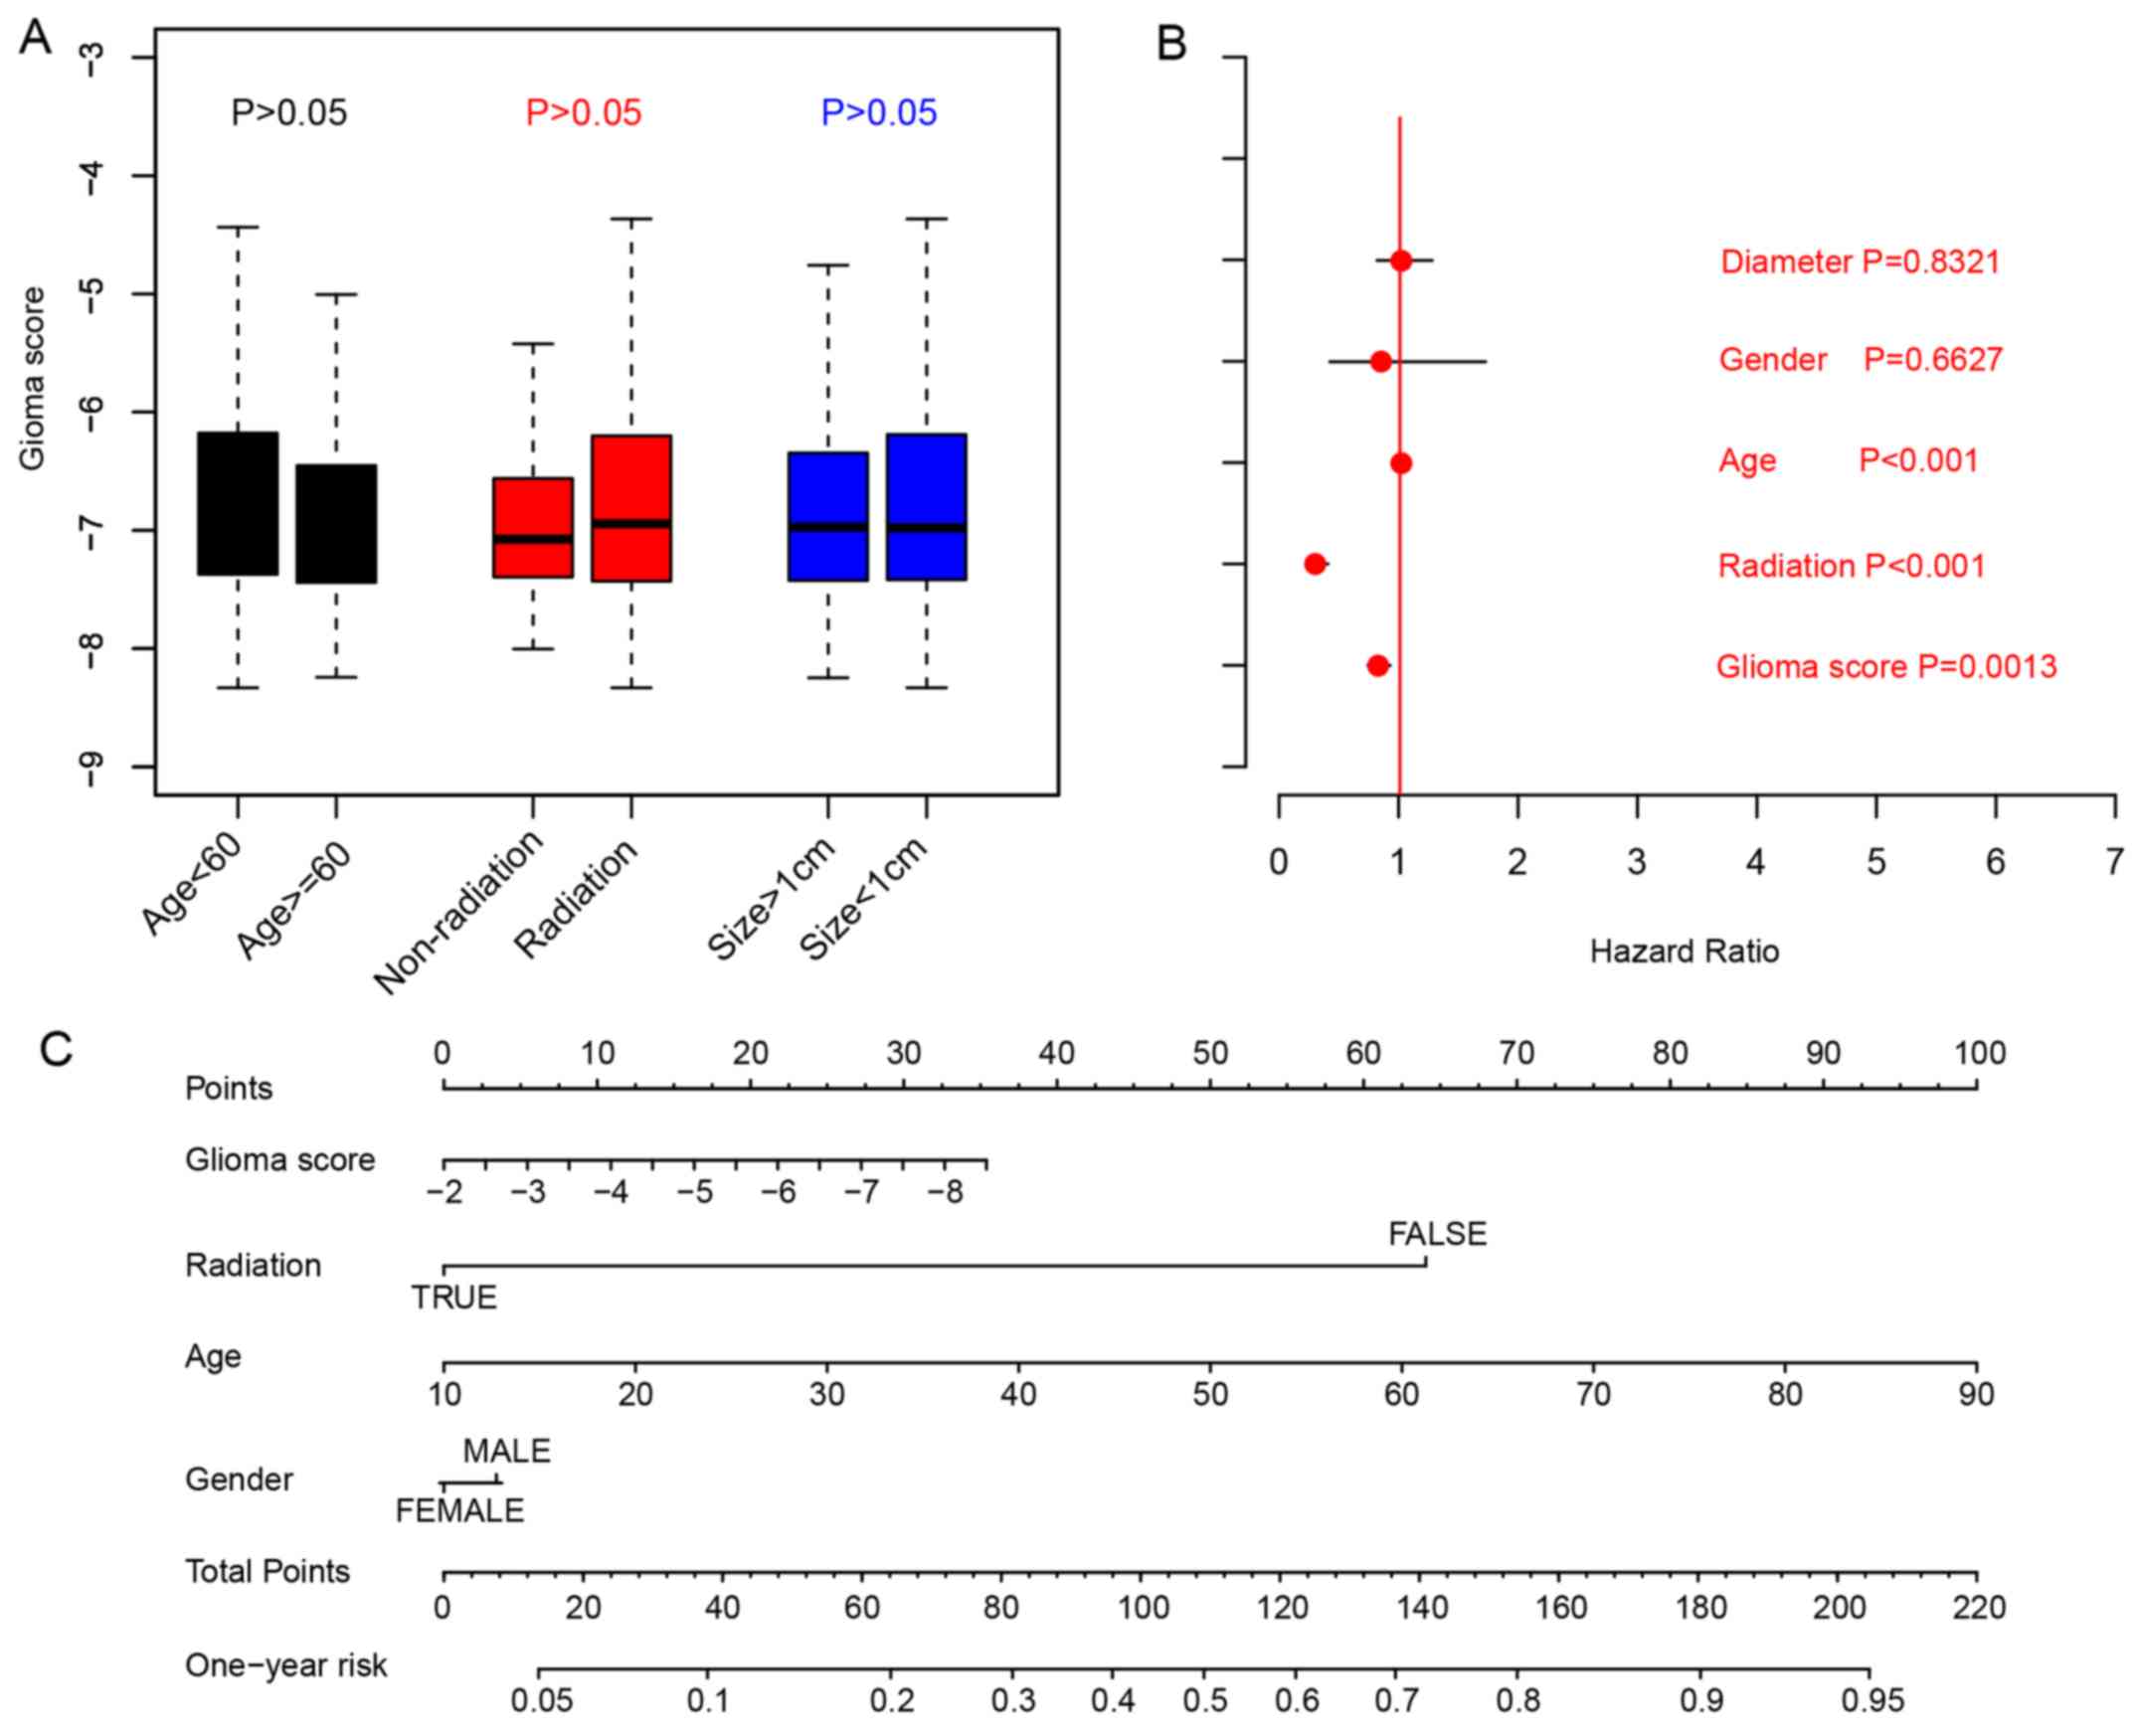
Associations between glioma risk scores and
clinicopathological indicators, including age, tumor size,
radiation were analyzed by comparing the glioma risk scores in
different sub-categories. The results indicated that the glioma
risk scores were not clinicopathological indicators for age
(P>0.05; cut-off, 60 years), radiation therapy or primary tumor
size (cut-off:10 mm; Fig. 3A;
Student's t-test). To evaluate the clinical significance of
clinical indicators and glioma risk scores, Cox multivariate
regression was implemented, and the results indicated that the
glioma scores are an important indicator for overall survival
(Fig. 3B). To facilitate the
utilization of other clinical indicators and glioma risk scores, a
1-year overall survival nomogram was calculated (Fig. 3C). In summary, these results
indicated that the glioma scores are an important indicator for the
prognosis of patients with glioma.
Biological relevance of risk
score
Due to the signatures being developed based on the
expression level of 31 genes and the glioma scores being
independent of the majority of clinical indicators, it was
suspected that the glioma scores predicted the survival of glioma
via reflecting the biological differences among individuals;
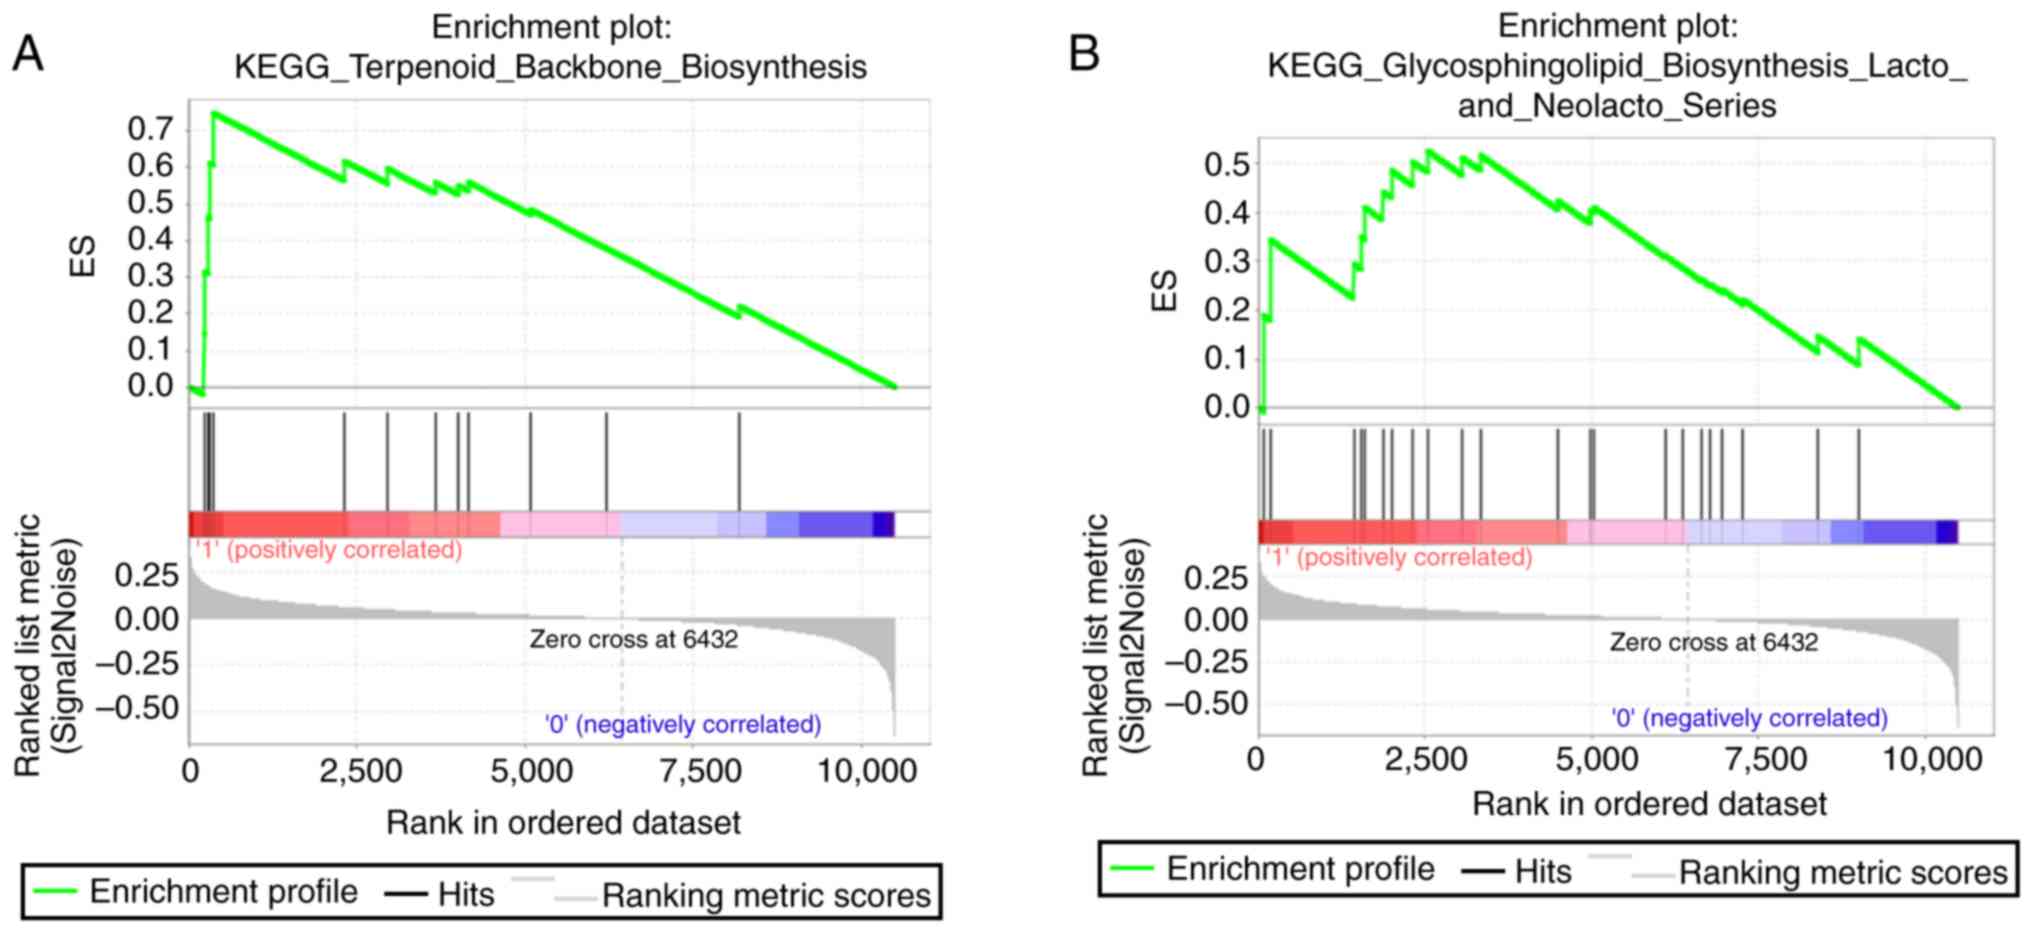
therefore, GSEA was performed by comparing the difference between
the high- and low-score groups. As expected, pathways, including
terpenoid backbone biosynthesis, glycosphingolipid biosynthesis
lacto and neolacto series, were identified (Fig. 4). In summary, the results indicated
that the glioma risk score may be associated with metabolic
pathways in glioma and therefore predict the survival of patients
with glioma.
Discussion
Genetic alterations of glioma have been frequently
reported previously (8,9,29,30).
Genetic heterogeneity across individuals has also been reported
(31). These data explained why
single biomarkers have frequently failed to predict the clinical
outcome of glioma. Previous studies have emphasized the multiple
gene expression-based models for prognosis, and models for other
cancer types have been developed (15,32); For
example, Mammaprint has been reported as a powerful tool for
therapy decision of breast cancer and OncotypeDX has been used in
many types of cancer (18,20), including ovarian cancer, breast
cancer and colorectal cancer; as such, the model appears to be a
successful predictor in independent cohorts using different
platforms.
One limitation of the present study is that the
detailed clinical information, including treatment and time to
recurrence, which were critical for determining the prognosis of
glioma, was unknown in all of the cohorts. Additionally, the
surgical technique (R0/R1) is also not described in the clinical
records. Another limitation is that the genes used for the
calculation of glioma scores were a relatively large panel;
however, it was considered that the panel is relatively small,
compared with the transcriptome, and a large panel may reflect the
biological status of glioma with greater accuracy.
Acknowledgements
Not applicable.
Funding
No funding was received.
Availability of data and materials
The data are available from the Gene Expression
Omnibus (https://www.ncbi.nlm.nih.gov/geo) with the provided
accession numbers of Gene Expression Omnibus (accession nos.
GSE4412, GSE16011, GSE16581 and GSE42669).
Authors' contributions
ZY and JY assisted in the experimental design. LF,
DX and YH assisted in data analysis. ZY, JY, LF, DX and YH were
responsible for the proofreading and the writing of the present
manuscript. All authors have read and approved the current version
of the manuscript.
Ethics approval and consent to
participate
Not applicable.
Patient consent for publication
Not applicable.
Competing interests
The authors declare that they have no competing
interests.
References
|
1
|
Ostrom QT, Bauchet L, Davis FG, Deltour I,
Fisher JL, Langer CE, Pekmezci M, Schwartzbaum JA, Turner MC, Walsh
KM, et al: The epidemiology of glioma in adults: A ‘state of the
science’ review. Neuro oncol. 16:896–913. 2014. View Article : Google Scholar : PubMed/NCBI
|
|
2
|
Chen W, Zheng R, Baade PD, Zhang S, Zeng
H, Bray F, Jemal A, Yu XQ and He J: Cancer statistics in China,
2015. CA Cancer J Clin. 66:115–132. 2016. View Article : Google Scholar : PubMed/NCBI
|
|
3
|
Coppola D, Balducci L, Chen DT, Loboda A,
Nebozhyn M, Staller A, Fulp WJ, Dalton W, Yeatman T and Brem S:
Senescence-associated-gene signature identifies genes linked to
age, prognosis, and progression of human gliomas. J Geriatr Oncol.
5:389–399. 2014. View Article : Google Scholar : PubMed/NCBI
|
|
4
|
Chen JW, Zhou CF and Lin ZX: The influence
of different classification standards of age groups on prognosis in
high-grade hemispheric glioma patients. J Neurol Sci. 356:148–152.
2015. View Article : Google Scholar : PubMed/NCBI
|
|
5
|
Cancer Genome Atlas Research Network, .
Comprehensive genomic characterization defines human glioblastoma
genes and core pathways. Nature. 455:1061–1068. 2008. View Article : Google Scholar : PubMed/NCBI
|
|
6
|
Cancer Genome Atlas Research Network, ;
Brat DJ, Verhaak RG, Aldape KD, Yung WK, Salama SR, Cooper LA,
Rheinbay E, Miller CR, Vitucci M, Morozova O, et al: Comprehensive,
integrative genomic analysis of diffuse lower-grade gliomas. N Engl
J Med. 372:2481–2498. 2015. View Article : Google Scholar : PubMed/NCBI
|
|
7
|
Yan H, Parsons DW, Jin G, McLendon R,
Rasheed BA, Yuan W, Kos I, Batinic-Haberle I, Jones S, Riggins GJ,
et al: IDH1 and IDH2 mutations in gliomas. N Engl J Med.
360:765–773. 2009. View Article : Google Scholar : PubMed/NCBI
|
|
8
|
Esmaeili M, Hamans BC, Navis AC, van
Horssen R, Bathen TF, Gribbestad IS, Leenders WP and Heerschap A:
IDH1 R132H mutation generates a distinct phospholipid metabolite
profile in glioma. Cancer Res. 74:4898–4907. 2014. View Article : Google Scholar : PubMed/NCBI
|
|
9
|
Shibahara I, Sonoda Y, Kanamori M, Saito
R, Yamashita Y, Kumabe T, Watanabe M, Suzuki H, Kato S, Ishioka C
and Tominaga T: IDH1/2 gene status defines the prognosis and
molecular profiles in patients with grade III gliomas. Int J Clin
Oncol. 17:551–561. 2012. View Article : Google Scholar : PubMed/NCBI
|
|
10
|
Thomas L, Di Stefano AL and Ducray F:
Predictive biomarkers in adult gliomas: the present and the future.
Curr Opin Oncol. 25:689–694. 2013. View Article : Google Scholar : PubMed/NCBI
|
|
11
|
Cohen AL and Colman H: Glioma biology and
molecular markers. Cancer Treat Res. 163:15–30. 2015. View Article : Google Scholar : PubMed/NCBI
|
|
12
|
Wang HJ, Gao Y, Chen L, Li YL and Jiang
CL: RAB34 was a progression- and prognosis-associated biomarker in
gliomas. Tumour Biol. 36:1573–1578. 2015. View Article : Google Scholar : PubMed/NCBI
|
|
13
|
Cai H, Xue Y, Liu W, Li Z, Hu Y, Li Z,
Shang X and Liu Y: Overexpression of roundabout4 predicts poor
prognosis of primary glioma patients via correlating with
microvessel density. J Neurooncol. 123:161–169. 2015. View Article : Google Scholar : PubMed/NCBI
|
|
14
|
Gao H, Zhao H and Xiang W: Expression
level of human miR-34a correlates with glioma grade and prognosis.
J Neurooncol. 113:221–228. 2013. View Article : Google Scholar : PubMed/NCBI
|
|
15
|
Wu X, Weng L, Li X, Guo C, Pal SK, Jin JM,
Li Y, Nelson RA, Mu B, Onami SH, et al: Identification of a
4-microRNA signature for clear cell renal cell carcinoma metastasis
and prognosis. PloS One. 7:e356612012. View Article : Google Scholar : PubMed/NCBI
|
|
16
|
Bou Samra E, Klein B, Commes T and Moreaux
J: Identification of a 20-gene expression-based risk score as a
predictor of clinical outcome in chronic lymphocytic leukemia
patients. Biomed Res Int. 2014:4231742014. View Article : Google Scholar : PubMed/NCBI
|
|
17
|
Liu Q, Diao R, Feng G, Mu X and Li A: Risk
score based on three mRNA expression predicts the survival of
bladder cancer. Oncotarget. 8:61583–61591. 2017.PubMed/NCBI
|
|
18
|
Cardoso F, van't Veer LJ, Bogaerts J,
Slaets L, Viale G, Delaloge S, Pierga JY, Brain E, Causeret S,
DeLorenzi M, et al: 70-Gene signature as an aid to treatment
decisions in early-stage breast cancer. N Engl J Med. 375:717–729.
2016. View Article : Google Scholar : PubMed/NCBI
|
|
19
|
Marisa L, de Reynies A, Duval A, Selves J,
Gaub MP, Vescovo L, Etienne-Grimaldi MC, Schiappa R, Guenot D,
Ayadi M, et al: Gene expression classification of colon cancer into
molecular subtypes: Characterization, validation, and prognostic
value. PLoS Med. 10:e10014532013. View Article : Google Scholar : PubMed/NCBI
|
|
20
|
You YN, Rustin RB and Sullivan JD:
Oncotype DX((R)) colon cancer assay for prediction of recurrence
risk in patients with stage II and III colon cancer: A review of
the evidence. Surg Oncol. 24:61–66. 2015. View Article : Google Scholar : PubMed/NCBI
|
|
21
|
Lee Y, Liu J, Patel S, Cloughesy T, Lai A,
Farooqi H, Seligson D, Dong J, Liau L, Becker D, et al: Genomic
landscape of meningiomas. Brain Pathol. 20:751–762. 2010.
View Article : Google Scholar : PubMed/NCBI
|
|
22
|
Gravendeel LA, Kouwenhoven MC, Gevaert O,
de Rooi JJ, Stubbs AP, Duijm JE, Daemen A, Bleeker FE, Bralten LB,
Kloosterhof NK, et al: Intrinsic gene expression profiles of
gliomas are a better predictor of survival than histology. Cancer
Res. 69:9065–9072. 2009. View Article : Google Scholar : PubMed/NCBI
|
|
23
|
Freije WA, Castro-Vargas FE, Fang Z,
Horvath S, Cloughesy T, Liau LM, Mischel PS and Nelson SF: Gene
expression profiling of gliomas strongly predicts survival. Cancer
Res. 64:6503–6510. 2004. View Article : Google Scholar : PubMed/NCBI
|
|
24
|
Joo KM, Kim J, Jin J, Kim M, Seol HJ,
Muradov J, Yang H, Choi YL, Park WY, Kong DS, et al:
Patient-specific orthotopic glioblastoma xenograft models
recapitulate the histopathology and biology of human glioblastomas
in situ. Cell Rep. 3:260–273. 2013. View Article : Google Scholar : PubMed/NCBI
|
|
25
|
Subramanian A, Tamayo P, Mootha VK,
Mukherjee S, Ebert BL, Gillette MA, Paulovich A, Pomeroy SL, Golub
TR, Lander ES and Mesirov JP: Gene set enrichment analysis: A
knowledge-based approach for interpreting genome-wide expression
profiles. Proc Natl Acad Sci USA. 102:15545–15550. 2005. View Article : Google Scholar : PubMed/NCBI
|
|
26
|
Ishwaran H and Kogalur UB: Consistency of
random survival forests. Stat Probab Lett. 80:1056–1064. 2010.
View Article : Google Scholar : PubMed/NCBI
|
|
27
|
Ishwaran H, Gerds TA, Kogalur UB, Moore
RD, Gange SJ and Lau BM: Random survival forests for competing
risks. Biostatistics. 15:757–773. 2014. View Article : Google Scholar : PubMed/NCBI
|
|
28
|
Robin X, Turck N, Hainard A, Tiberti N,
Lisacek F, Sanchez JC and Müller M: pROC: An open-source package
for R and S+ to analyze and compare ROC curves. BMC
Bioinformatics. 12:772011. View Article : Google Scholar : PubMed/NCBI
|
|
29
|
Li Z, Yan X, Sun Y and Yang X: Expression
of ADP-ribosyltransferase 1 is associated with poor prognosis of
glioma patients. Tohoku J Exp Med. 239:269–278. 2016. View Article : Google Scholar : PubMed/NCBI
|
|
30
|
Xu X, Wei Y, Wang S, Luo M and Zeng H:
Serine-arginine protein kinase 1 (SRPK1) is elevated in gastric
cancer and plays oncogenic functions. Oncotarget. 8:61944–61957.
2017.PubMed/NCBI
|
|
31
|
Morokoff A, Ng W, Gogos A and Kaye AH:
Molecular subtypes, stem cells and heterogeneity: Implications for
personalised therapy in glioma. J Clin Neurosci. 22:1219–1226.
2015. View Article : Google Scholar : PubMed/NCBI
|
|
32
|
Jamshidi N, Jonasch E, Zapala M, Korn RL,
Aganovic L, Zhao H, Tumkur Sitaram R, Tibshirani RJ, Banerjee S,
Brooks JD, et al: The radiogenomic risk score: Construction of a
prognostic quantitative, noninvasive image-based molecular assay
for renal cell carcinoma. Radiology. 277:114–123. 2015. View Article : Google Scholar : PubMed/NCBI
|