Introduction
Nasopharyngeal carcinoma (NPC) is a common
malignancy occurring in the head and neck. It is prevalent in the
eastern and southeastern parts of Asia, especially in southern
China, which accounts for 71% of new cases worldwide (1). In 2014, there were an estimated 44,600
new cases and 24,200 cases of NPC-associated mortality in China,
and the crude incidence and mortality rates of NPC were
3.26/100,000 and 1.77/100,000, respectively (2). One of the possible reasons for this may
be related to the occult characteristics of the occurrence site of
NPC. NPC is commonly located in the pharyngeal recess (fossa of
Rosenmüller), which is superior and posterior to the torus tubarius
(3); therefore, many patients with
NPC lack early characteristic symptoms and are diagnosed at an
advanced stage. Although previous research has demonstrated that
inherited factors, Epstein-Barr virus (EBV) infection and
environmental factors are important causative factors of NPC
(4), the molecular mechanisms in the
pathogenesis of NPC have not yet been fully explained. Thus,
studies in search of new targets for early diagnosis and treatment
of NPC may be beneficial to improve patient quality of life and
survival time.
At present, based on gene expression profiling, a
variety of studies have been performed to explore the molecular
mechanism underlying NPC. Using mRNA expression profiling, Bose
et al (5) have demonstrated
that loss of ATM serine/threonine kinase function may be an
important step in the pathogenesis of NPC. Cai et al
(6) discovered EBV-microRNA
(miRNA)-binder of Arl2 induces metastasis of NPC by regulating
phosphatase and tensin homolog-dependent pathways by miRNA
profiling. With the help of long non-coding (lnc)RNA and mRNA
expression profiling, ENST00000470135 was demonstrated to be
upregulated in highly metastatic NPC cell lines and is related to
the inhibition of migration, invasion and proliferation of NPC
cells in vitro (7).
In the present study, an integrated bioinformatics
approach was used to analyze the gene expression profiles of NPC
using existing data. Differentially expressed genes (DEGs) between
NPC and normal nasopharyngeal tissues were screened using R
software. Distributions of DEGs in chromosomes were explored based
on the annotation file and the CYTOBAND database of DAVID. The
functions of DEGs were explored by Gene Ontology (GO) and Kyoto
Encyclopedia of Genes and Genomes (KEGG) pathway enrichment
analysis. Additionally, a protein-protein interaction (PPI) network
for DEGs was constructed to identify hub genes, key modules and
important transcription factors (TFs). The results of the present
study may be conducive to understanding the occurrence and
development of NPC and may provide candidate molecular targets for
diagnosis and treatment of NPC.
Materials and methods
Microarray data collection
NPC gene expression profiling datasets GSE12452
(8) and GSE34573 (9) were downloaded from the Gene Expression
Omnibus (GEO; http://www.ncbi.nlm.nih.gov/geo) database of The
National Center for Biotechnology Information. GSE12452 contained
31 NPC specimens and 10 normal nasopharyngeal tissues, whereas
GSE34573 included 13 NPC specimens and 3 normal nasopharyngeal
tissues excised by laser microdissection. The datasets were based
on the GPL570 [HG-U133_Plus_2] Affymetrix Human Genome U133 Plus
2.0 Array platform. The annotation file (HG-U133_Plus_2
Annotations, CSV format, Release 36) is available for download from
the Affymetrix website (https://www.thermofisher.com/cn/zh/home/life-science/microarray-analysis/microarray-data-analysis/genechip-array-annotation-files.html).
Data processing and DEG analysis
Data processing and statistical analysis were
performed using packages from Bioconductor (http://www.bioconductor.org) for R software (version
3.4.1; http://www.r-project.org). A quality
assessment was conducted by ‘affyPLM’ and ‘RColorBrewer’ packages
to remove any disqualified samples (10,11). The
subsequent processing steps included robust multiarray average
normalization, calculation of missing values, and removal of batch
effects using the ‘affy’, ‘impute’ and ‘sva’ packages (12–14). The
expression data at the probes level were converted to gene symbols
level data. The average value was used for genes with multiple
probes. Subsequently, the limma package was used to screen DEGs
between NPC specimens and normal nasopharyngeal tissues (15). The criteria for DEGs were false
discovery rate <0.05 and |log fold change|>1. The DEGs were
identified and their distributions on chromosomes were explored
based on the annotation file and the CYTOBAND database of DAVID
(v6.8; http://david.ncifcrf.go) (16).
GO terms and KEGG pathway enrichment
analysis
The GO resource (http://www.geneontology.org) is an up-to-date
biological database that developed a set of structured, controlled
vocabularies to describe gene function analysis in terms of
biological processes (BP), molecular function (MF) and cellular
components (CC) (17). GO enrichment
determines whether some gene sets defined by GO terms have high or
low expression. KEGG (http://www.genome.ad.jp/kegg) is a knowledge database
for systematic analysis of gene function, linking genomic
information to higher order functional information (18). It stores graphical representations of
cellular processes, such as metabolism, membrane transport, signal
transduction and the cell cycle (18), and is widely used to identify
clusters of co-expressed genes sharing the same pathway. GO and
KEGG pathway enrichment analyses were performed to explore the
biological function of DEGs using the ‘clusterProfiler’ package
(http://bioconductor.org/packages/release/bioc/html/clusterProfiler.html)
in R (19). For GO analysis, the
cut-off criteria were P<0.01 and q<0.05. For KEGG analysis,
the cut-off criterion was P<0.05.
PPI network construction and network
module analysis
To explore the functional associations of DEGs, a
PPI network of NPC was predicted by the STRING database (version
10.5; http://www.string-db.org) (20). The highest confidence (0.9) was
selected for the minimum required interaction score. Subsequently,
the PPI network was visualized by Cytoscape software (version
3.6.0; http://www.cytoscape.org) (21). The Molecular Complex Detection
(MCODE) app (22) was used to
identify gene modules with the cut-off criterion of score ≥5. The
‘clusterProfiler’ package was used to compare the modules by their
enriched GO terms and KEGG pathways. The scores of gene nodes were
calculated by the CytoHubba app (23) to identify hub genes using 12
algorithms: Degree, Clustering Coefficient, Edge Percolated
Component; Maximum Neighborhood Component, Density of Maximum
Neighborhood Component, Maximal Clique Centrality, Bottleneck,
Eccentricity, Closeness, Radiality, Betweenness and Stress. The 50
top-ranked genes were screened by each algorithm, and the genes
common in >8 algorithms were considered to be candidate hub
genes. The GSE13597 dataset, based on the platform of GPL96,
submitted by Bose et al (5),
was used to verify the differential expression levels of candidate
hub genes between NPC and normal nasopharyngeal tissues.
Upstream transcriptional regulator
analysis
To investigate the potential regulatory mechanism of
DEGs, the iRegulon app (24), which
performs motif discovery and track discovery, was used to predict
upstream TFs targeting the DEGs. Normalized enrichment score (NES)
>3 was used as the cut-off value.
Results
DEG analysis
A total of 906 DEGs were identified between NPC and
normal nasopharyngeal tissues, including 434 (47.90%) upregulated
genes and 472 (52.10%) downregulated genes. The top five
significant genes ranked by adjusted P-value (Padj) were
mucin 4, cell surface associated (MUC4;
Padj=3.65×10⁻²⁰), uroplakin 1B
(Padj=2.33×10⁻¹⁶), tetratricopeptide repeat
domain 9 (Padj=2.33×10⁻¹⁶), mucin 1 (MUC1;
Padj=2.33×10⁻¹⁶) and β3 glycosyltransferase 7
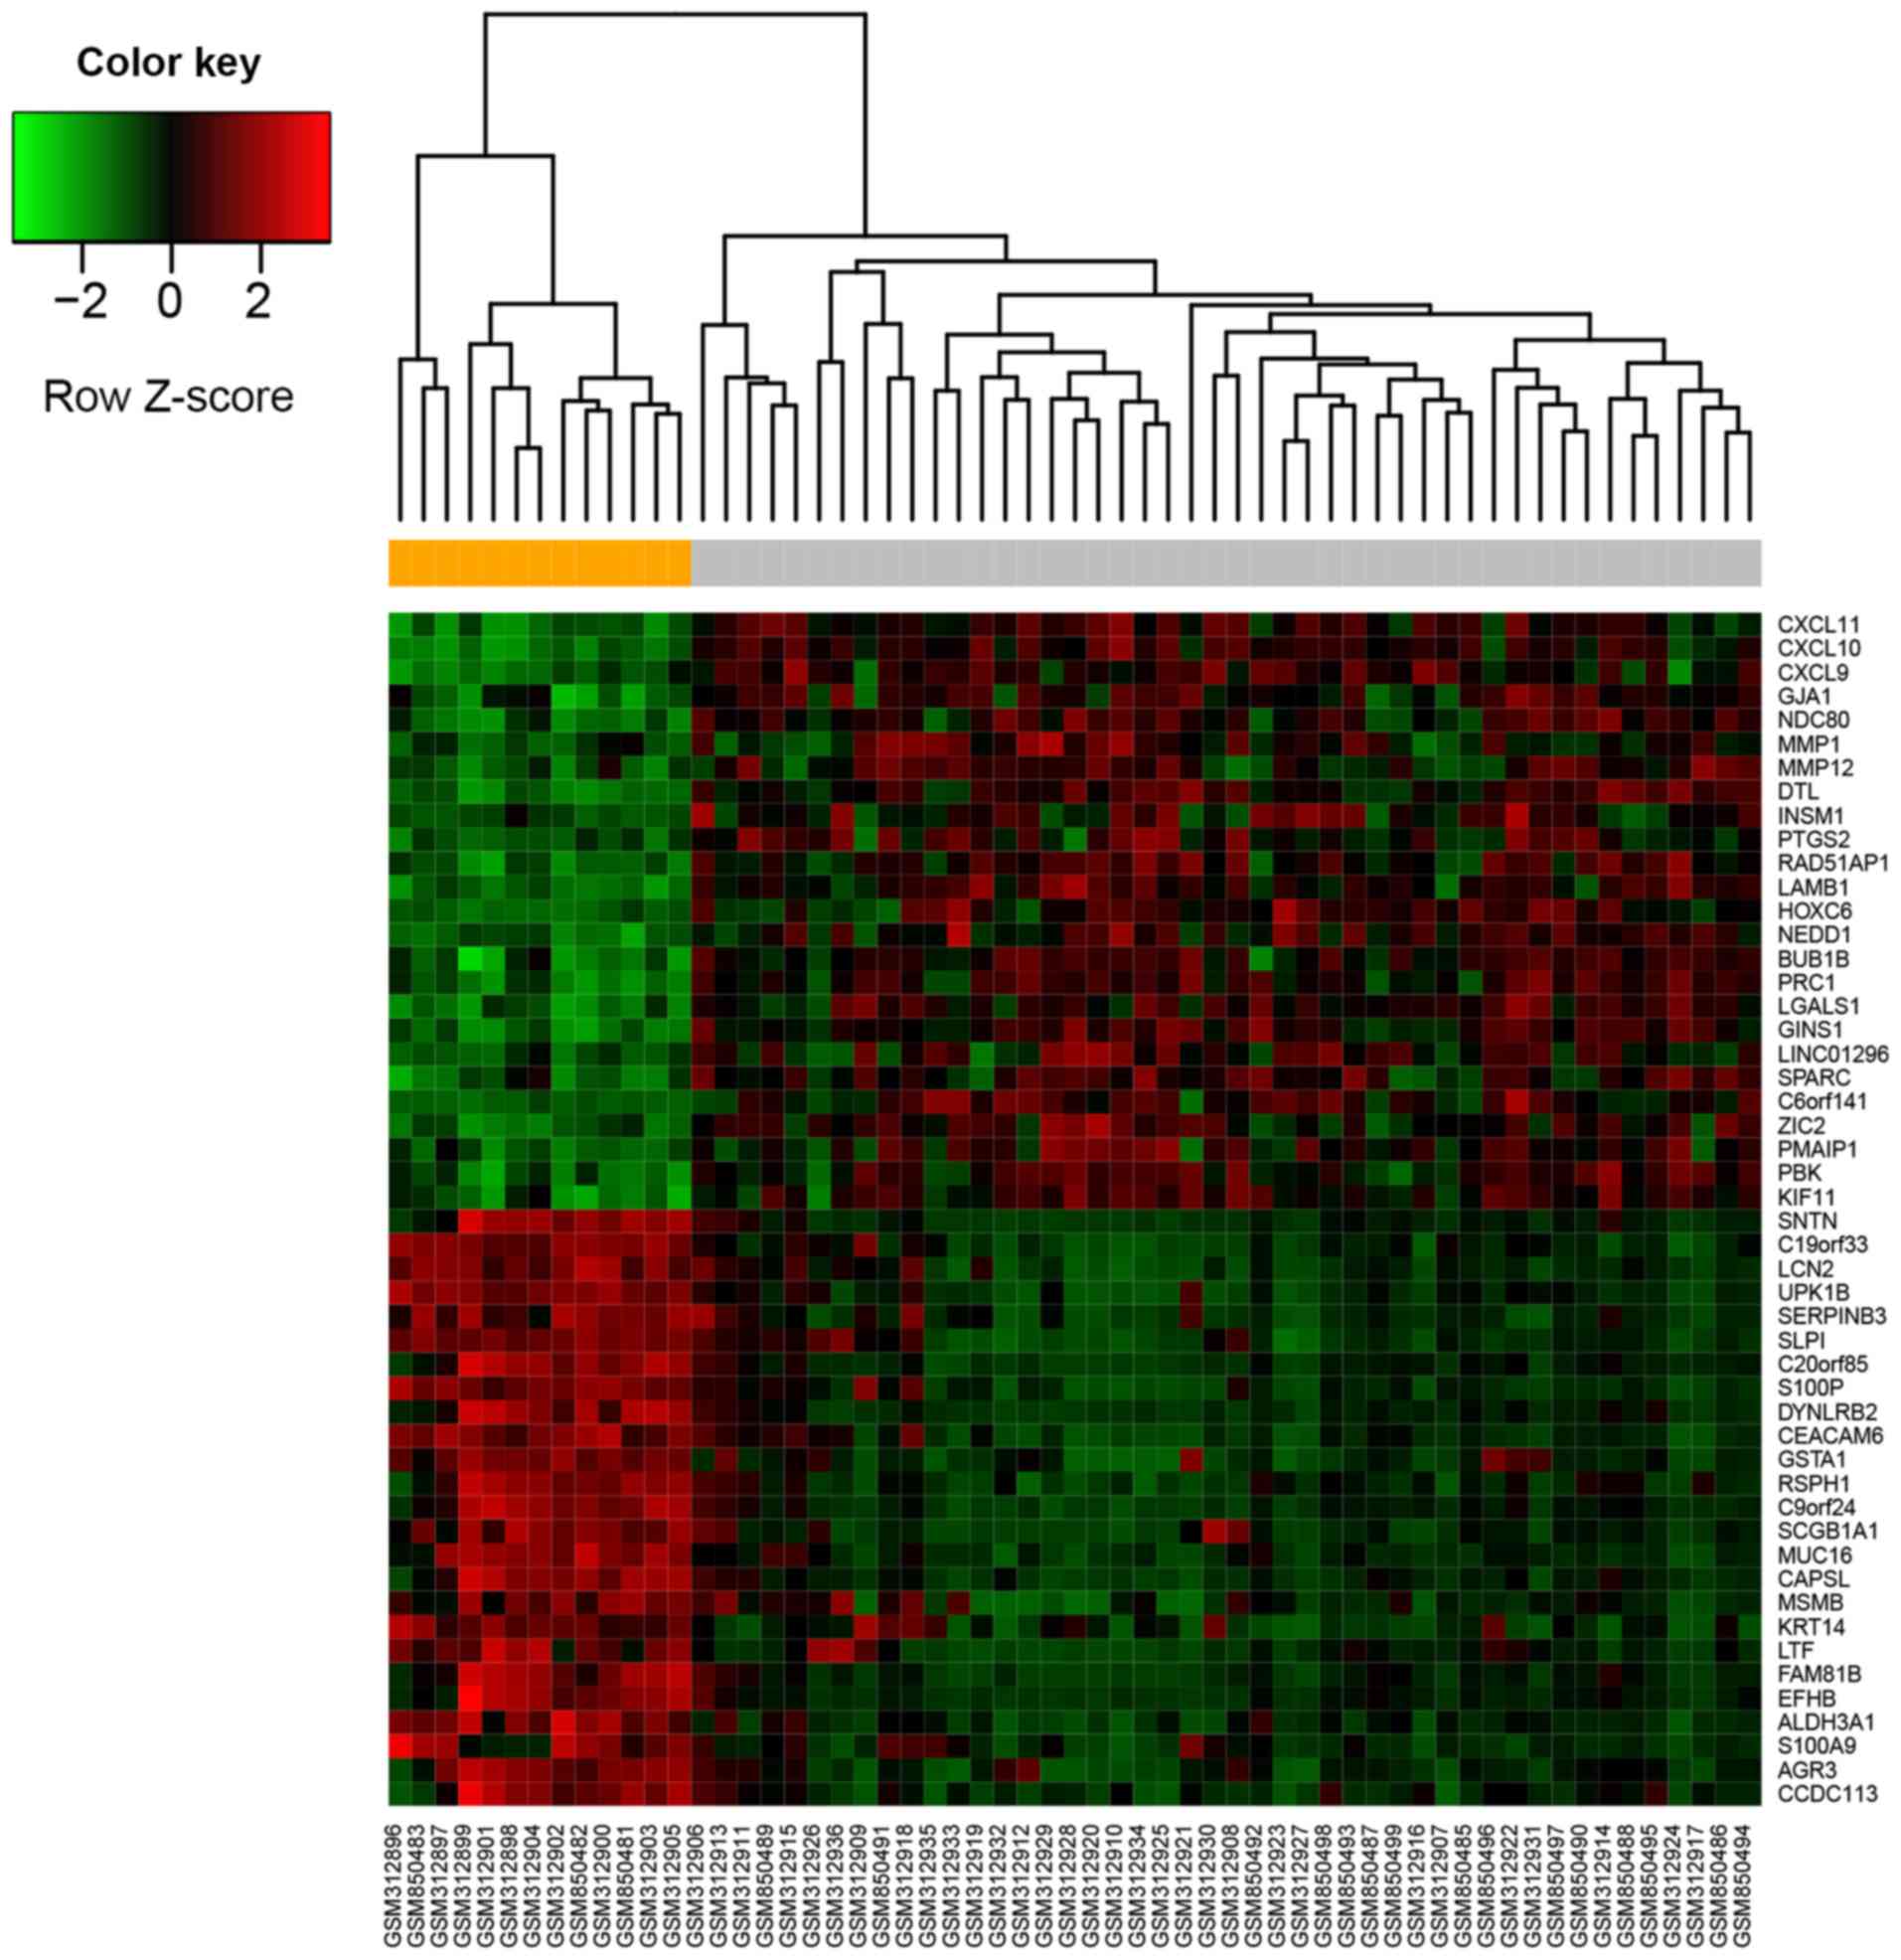
(Padj=2.33×10⁻¹⁶). A heatmap of DEGs (top 25
upregulated and top 25 downregulated genes ranked by log fold
change) is presented in Fig. 1. The
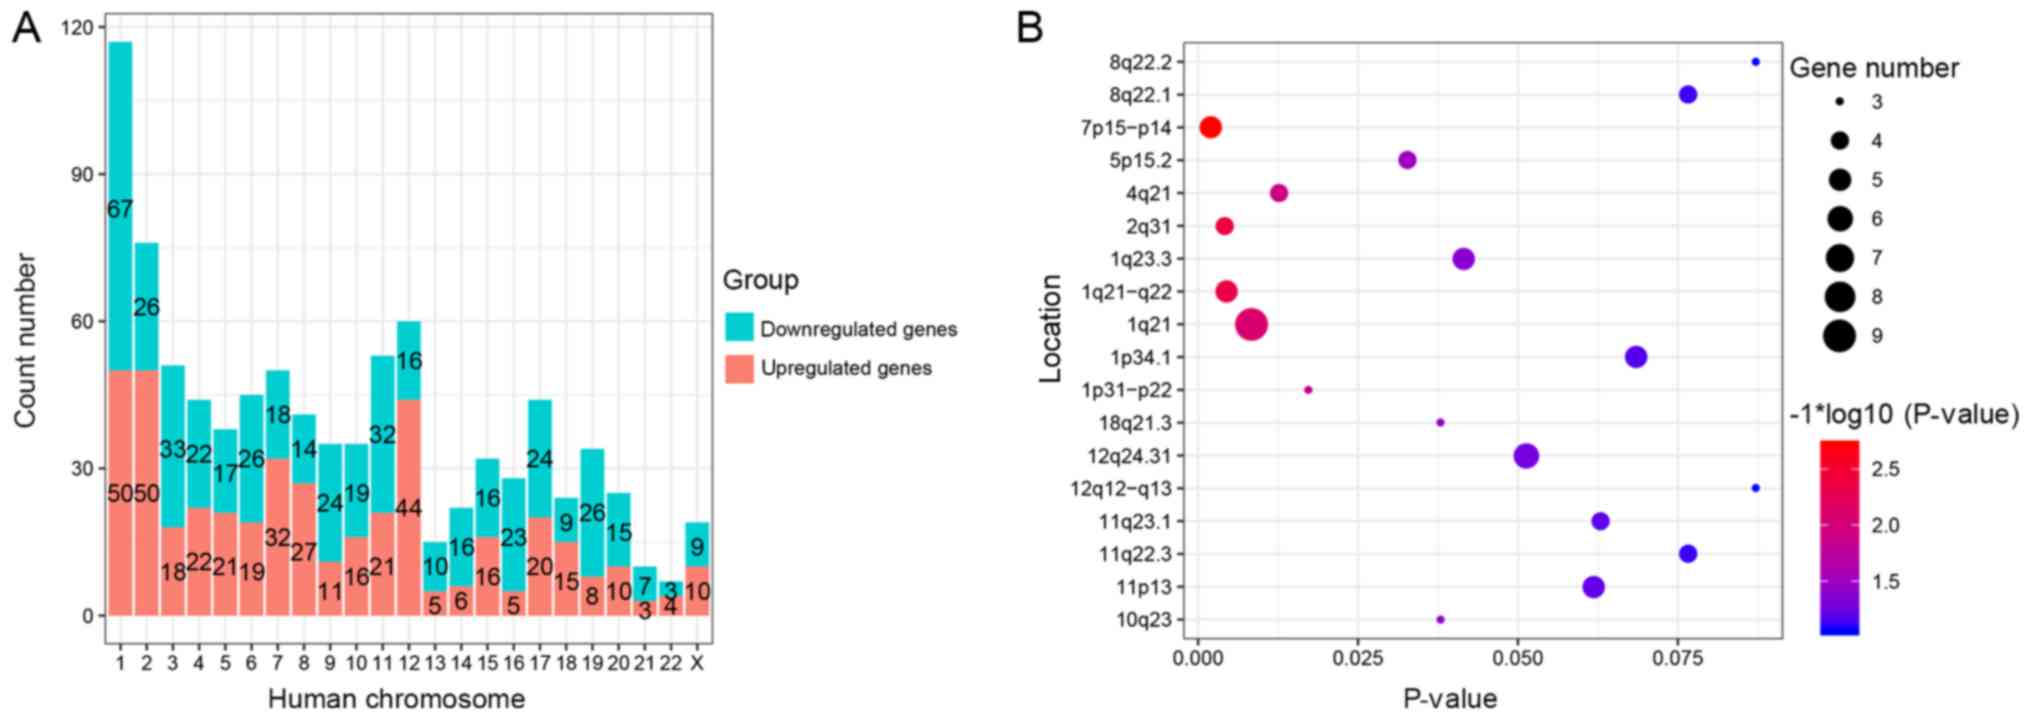
DEGs were distributed on all human chromosomes except for the Y
chromosome (Fig. 2A). Notably, among
the DEGs, the location of LOC105371220 was undefined by the
annotated file of the Affymetrix official website, so it could not
be included in Fig. 2A. The peak
count of DEGs was on chromosome 1 (117 DEGs), followed by
chromosome 2 (76 DEGs) and chromosome 12 (60 DEGs). Chromosome 21
and chromosome 22 contained the fewest DEGs, 10 and 7,
respectively. Chromosome 1 and chromosome 2 each contained 50
upregulated DEGs, which represented the peak of upregulated DEGs.
The highest count of downregulated DEGs was in chromosome 1, which
contained 67 downregulated DEGs. The CYTOBAND database of DAVID
revealed that the DEGs were located on chromosome 7p15-p14
[homeobox A3, gamma-glutamylcyclotransferase, homeobox A10
(HOXA10), anillin actin binding protein (ANLN) and
nuclear factor erythroid 2 like 3], 2q31 [FAST kinase domains 1,
cell division cycle-associated 7, collagen type III α1 chain
(COL3A1) and glutamate decarboxylase 1 (GAD1)],
1q21-q22 [small proline rich protein (SPRR)1A, SPRR1B, SPRR2B,
SPRR3 and selenium binding protein 1 (SELENBP1)], 1q21
[MUC1, cysteine rich C-terminal 1, S100 calcium binding
protein (S100)A8, S100A7, cingulin, S100A9, cornulin,
S100A2 and S100A12], 4q21 [C-X-C motif chemokine
ligand (CXCL)1, CXCL3, CXCL9 and CXCL10] and 1p31-p22
[chloride channel accessory (CLCA)2, CLCA4 and crystallin ζ)
(P<0.025; Fig. 2B).
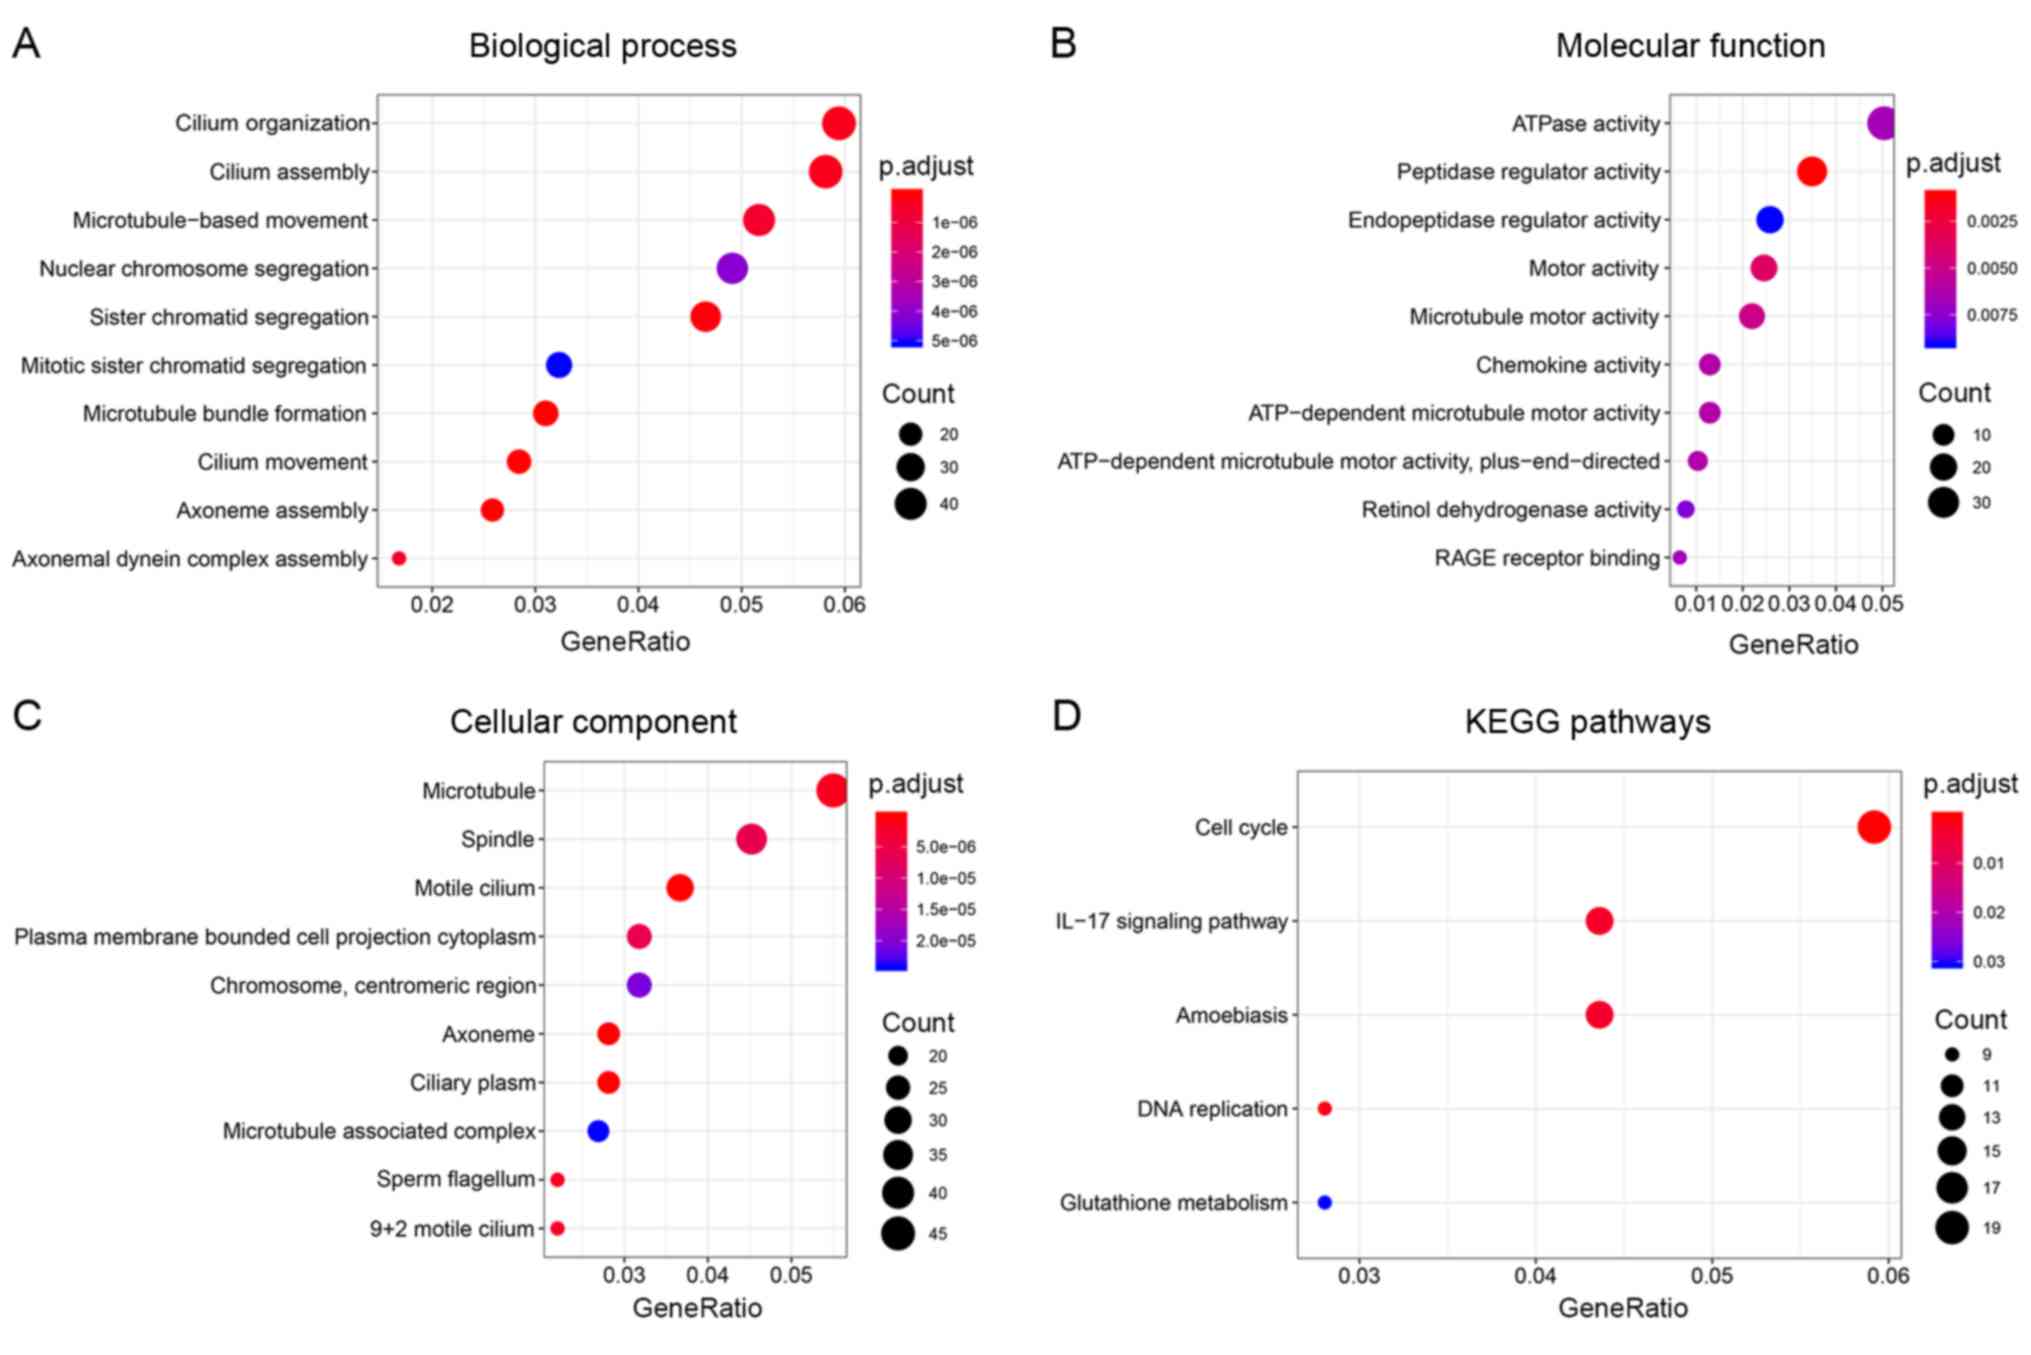
GO terms and KEGG pathway enrichment
analysis
To explore the biological function of DEGs, GO and
KEGG pathway enrichment analyses were conducted using the
‘clusterProfiler’ package in R. The results revealed that the DEGs
were significantly enriched in 68 GO terms for BP, 12 GO terms for
MF and 44 GO terms for CC with the cut-off criteria of p<0.05
and q<0.05. For BP, the three enriched terms with the lowest
P-value were ‘cilium movement’, ‘microtubule bundle formation’ and
‘axoneme assembly’ (Fig. 3A). For
MF, the enriched terms included ‘peptidase regulator activity’,
‘motor activity’ and ‘microtubule motor activity’ (Fig. 3B). For CC, the enriched terms were
‘motile cilium’, ‘axoneme’ and ‘ciliary plasm’ (Fig. 3C). Additionally, KEGG pathway
enrichment analysis indicated that five pathways were significantly
enriched, including ‘cell cycle’ (hsa04110), ‘DNA replication’
(hsa03030), ‘interleukin (IL)-17 signaling pathway’ (hsa04657),
‘amoebiasis’ (hsa05146) and ‘glutathione metabolism’ (hsa00480)
(Fig. 3D).
PPI network construction and network
module analysis
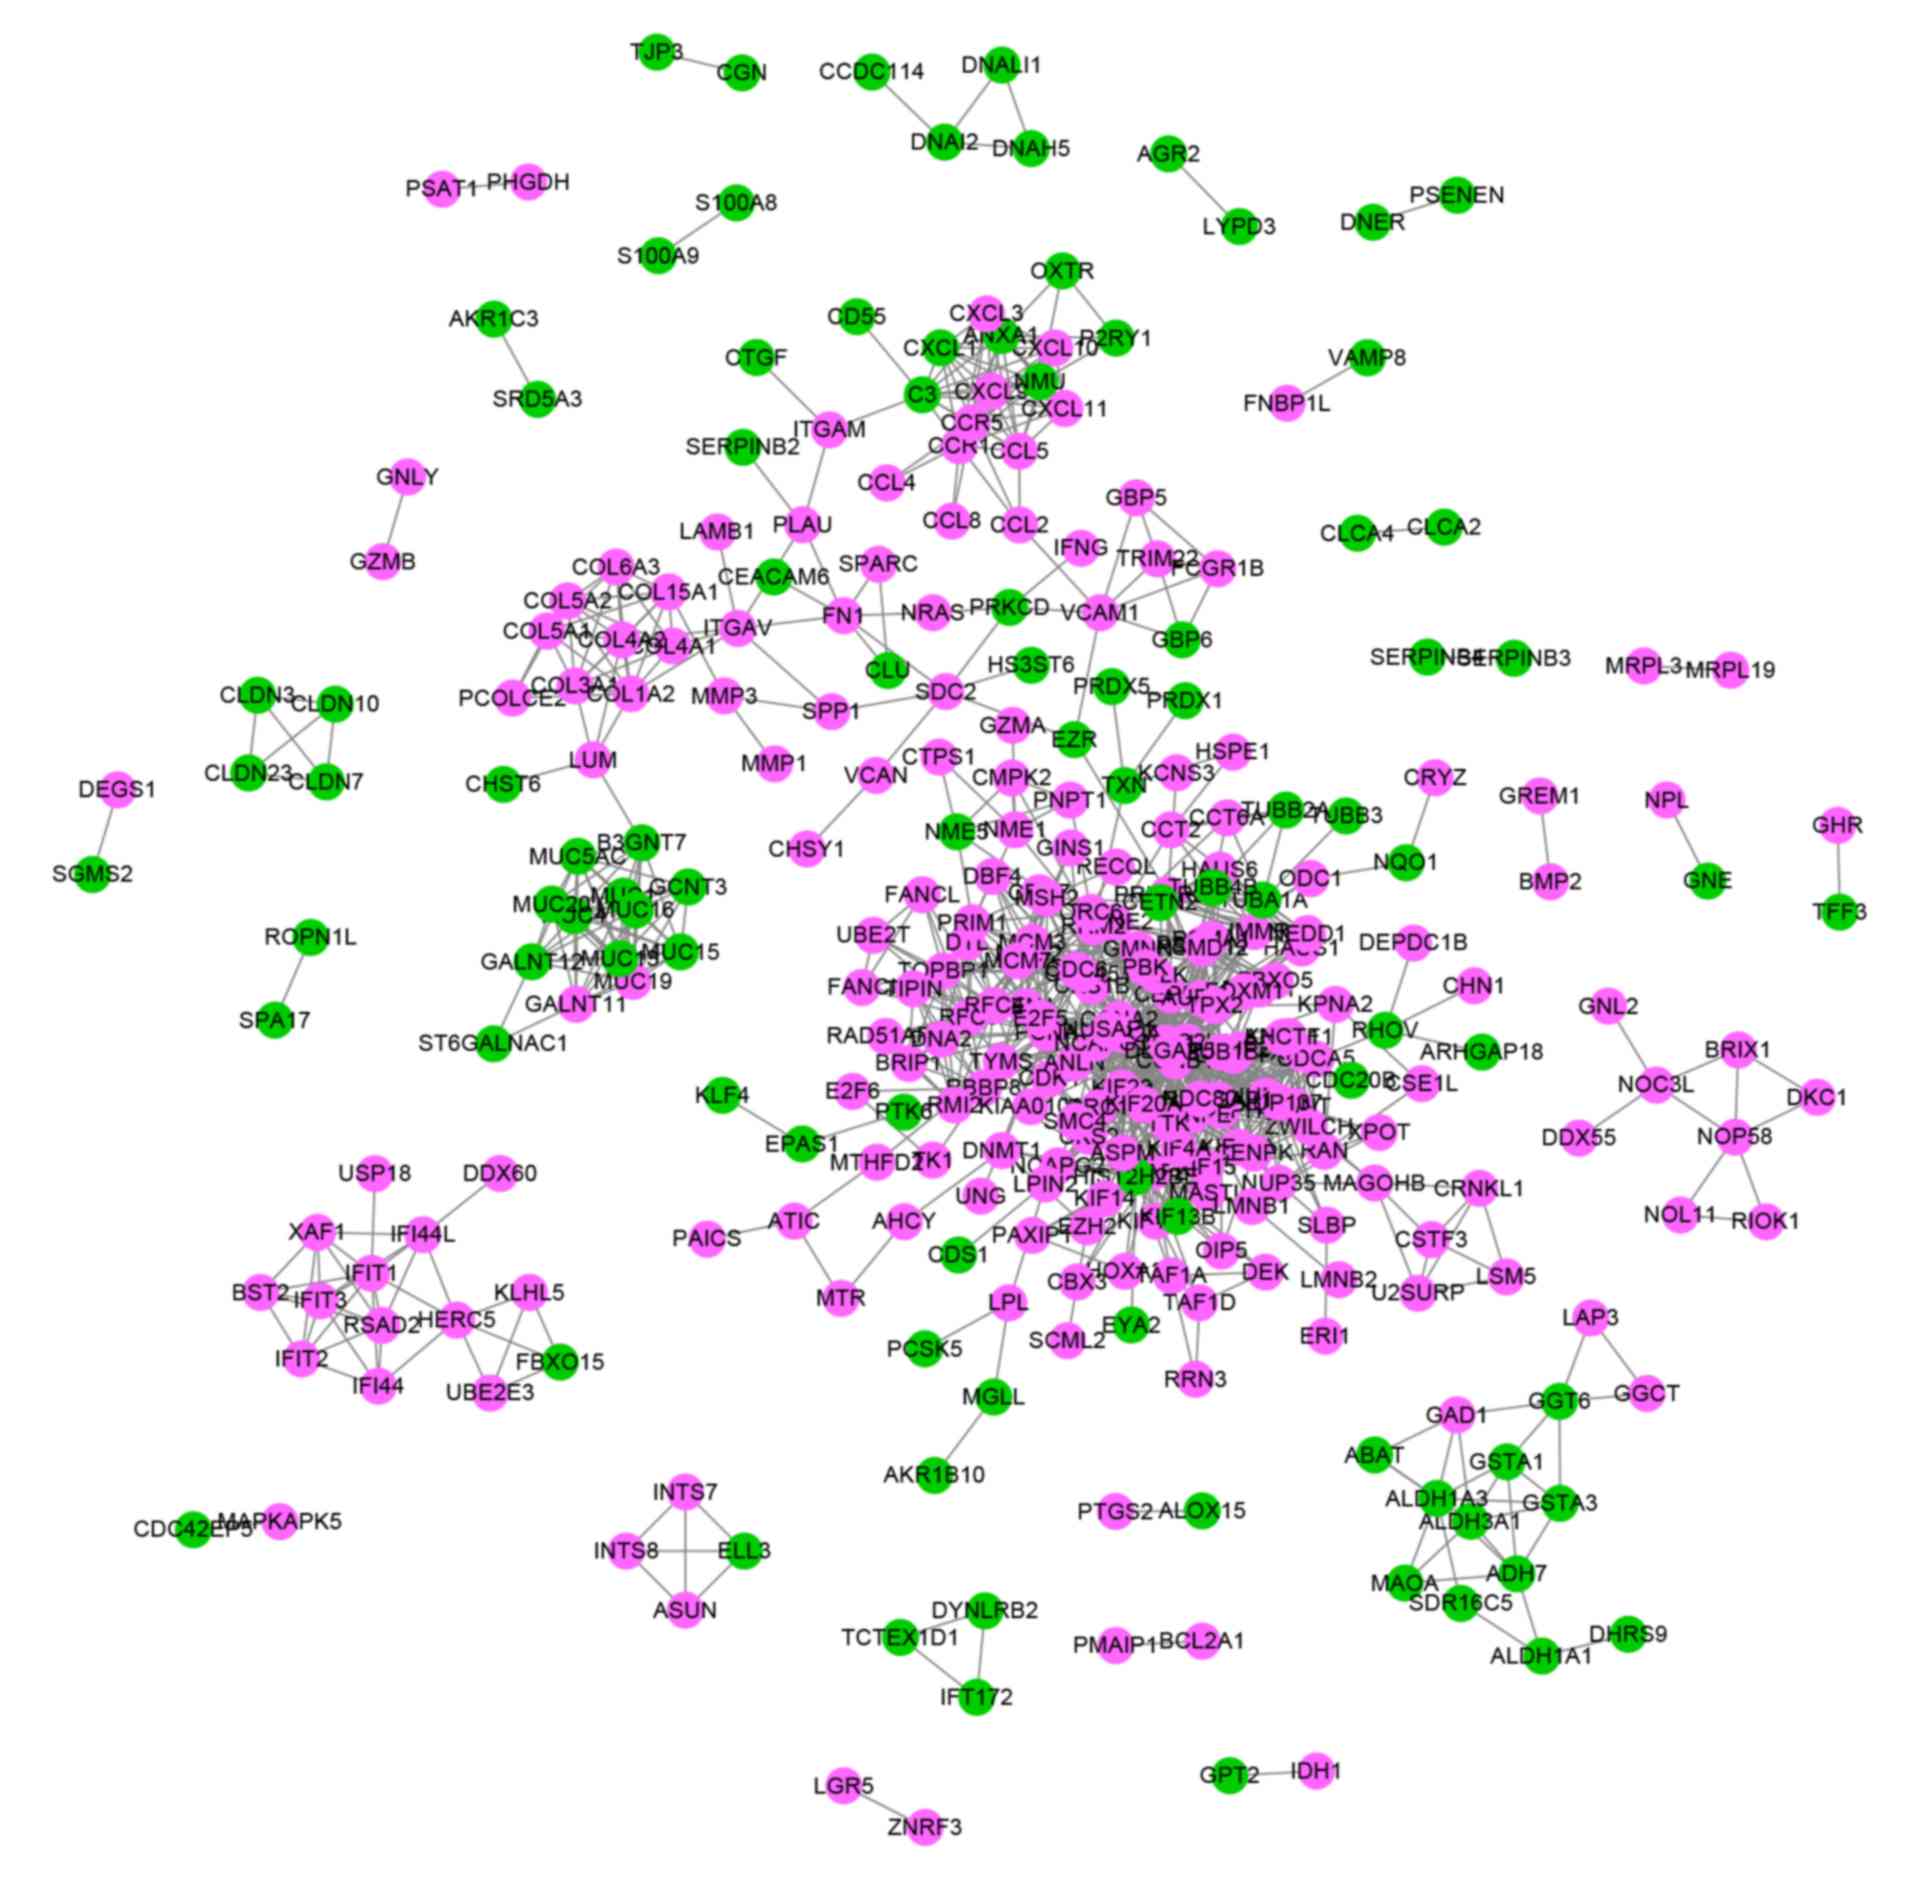
To investigate the functional associations of DEGs,
a PPI network containing 867 nodes and 1,241 edges was constructed
with the screened DEGs using the STRING database (Fig. 4). After analyzing the network with
the MCODE app in Cytoscape software, eight modules with a score ≥5
were identified (Table I). Then, the
DEGs in the modules were used to perform GO and KEGG pathway
enrichment analysis, and to make a comparison using the
‘compareCluster’ function of the ‘clusterProfiler’ package. This
differed from the aforementioned method of enrichment analysis
using all DEGs. The results indicated that the modules, with the
exception of module 6, which did not contain enough enriched genes
in the analysis, were involved in different functional categories
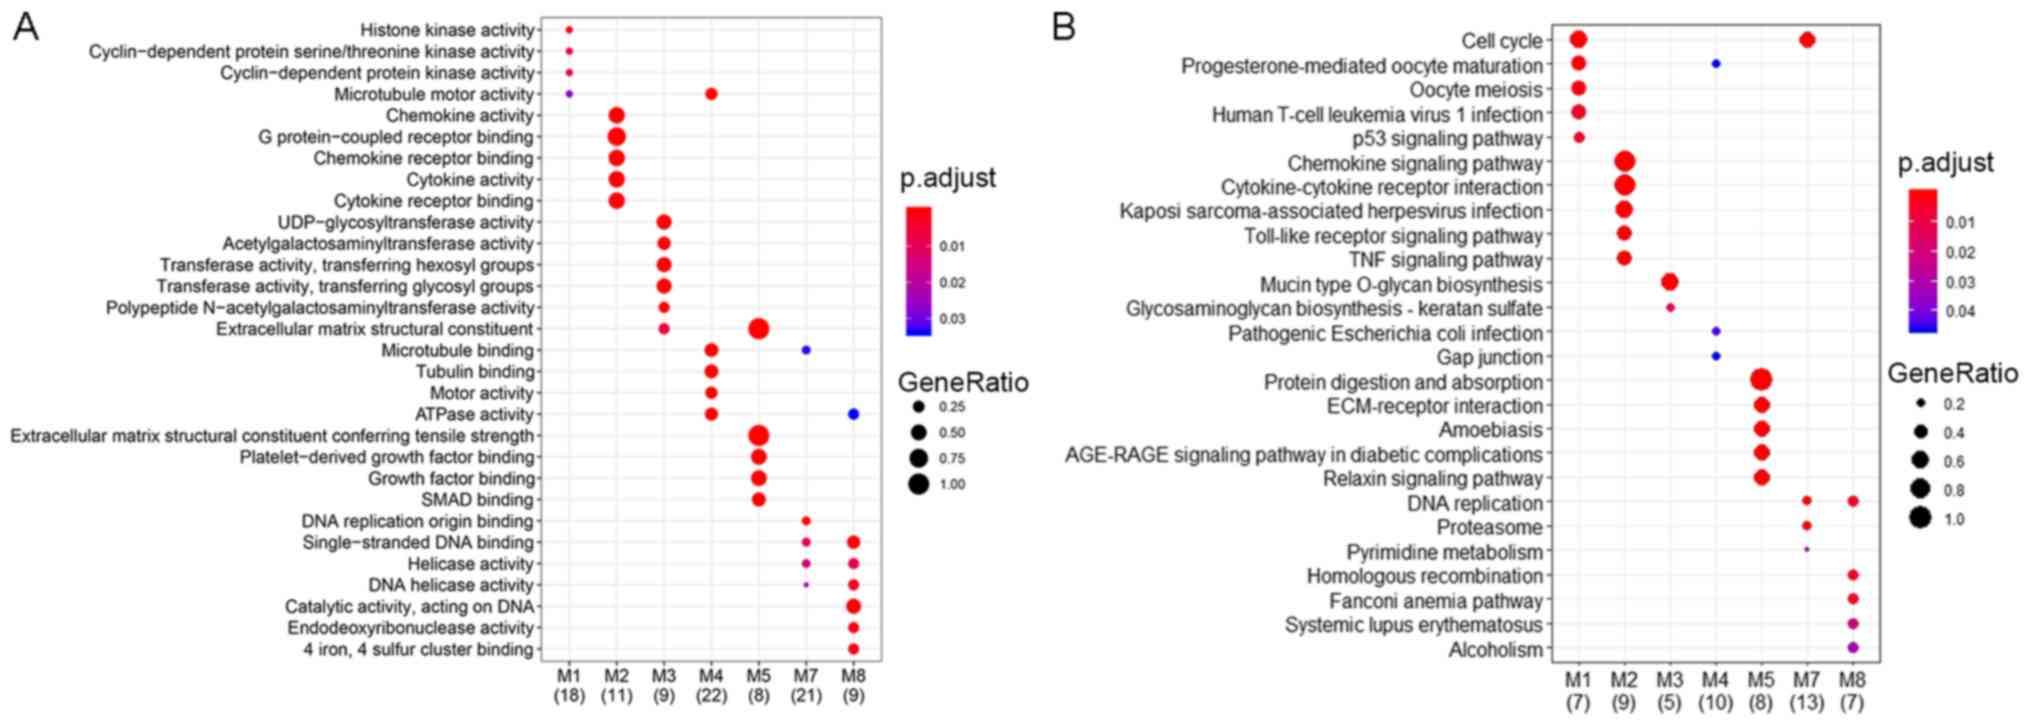
(Fig. 5). The results also
demonstrated that cyclin-dependent kinase 1 (CDK1) and
exportin 1 (XPO1) in module 1 were enriched in the pathway
of EBV infection (Table II).
Additionally, 14 candidate hub genes were identified using the
CytoHubba app; the genes were distributed in module 1 [cyclin B1
(CCNB1), cell division cycle-associated 5 (CDCA5),
CDK1, mitotic arrest deficient 2-like 1 (MAD2L1),
nucleoporin 107 (NUP107)], module 4 [aurora kinase A
(AURKA), cyclin A2 (CCNA2), protein kinase
cAMP-dependent type II regulatory subunit β (PRKAR2B), DNA
topoisomerase 2α (TOP2A), TPX2 microtubule nucleation factor
(TPX2)], module 7 [cell division cycle 6 (CDC6), Rac
GTPase-activating protein 1 (RACGAP1), ribonucleotide
reductase regulatory subunit M2 (RRM2)] and module 8 [H2A
histone family member Z (H2AFZ)]. The majority of these
genes were upregulated in NPC in the GSE12452 and GSE34573 datasets
(data not shown); however, in the GSE13597 dataset, only five genes
(AURKA, CDC6, MAD2L1, TOP2A and TPX2) exhibited
significant differences between NPC and normal nasopharyngeal
tissues (Fig. 6). CDCA5 was
not included in the Affymetrix annotation file of the GSE13597
dataset, so it was not included in Fig.
6. Therefore, five hub genes that might serve an important role
in the initiation and development of NPC were obtained.
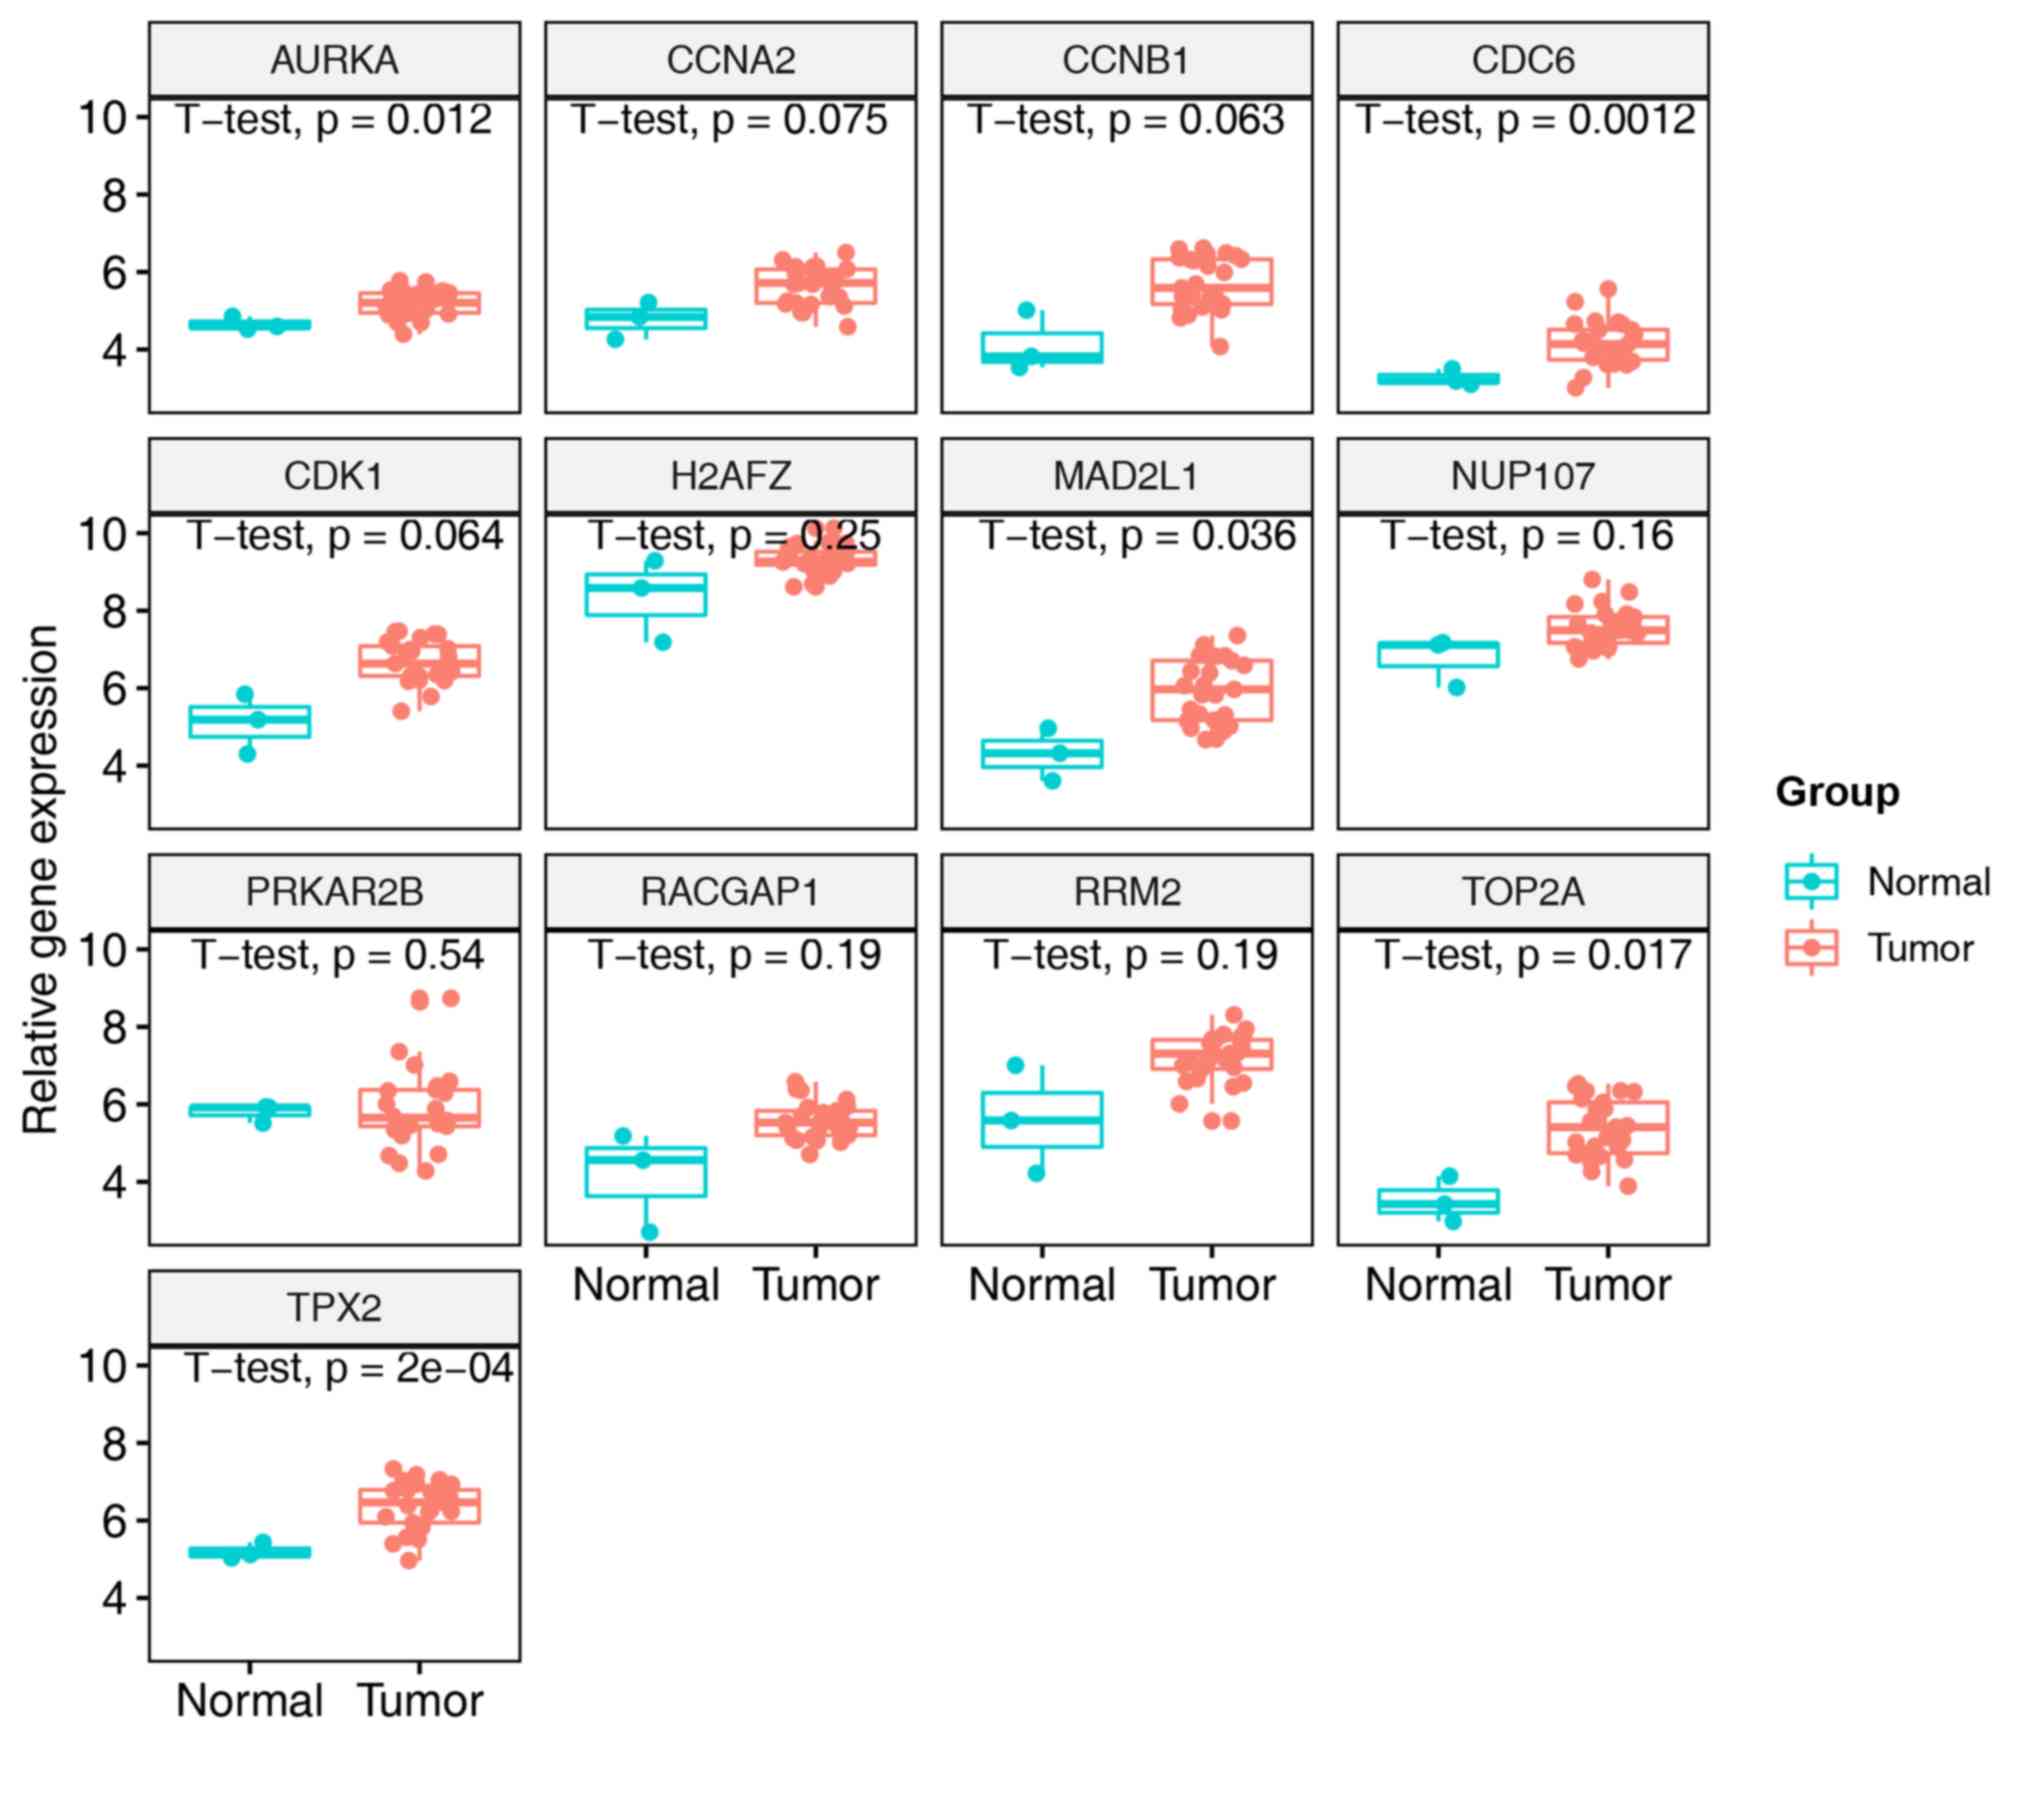 | Figure 6.Expression levels of candidate hub
genes in the GSE13597 dataset. Five candidate hub genes were
upregulated in NPC (P<0.05). AURKA, aurora kinase A;
CCNA2, cyclin A2; CCNB1, cyclin B1; CDC6, cell
division cycle 6; CDK1, cyclin-dependent kinase 1;
H2AFZ, H2A histone family member Z; MAD2L1, mitotic
arrest deficient 2-like 1; NUP107, nucleoporin 107;
PRKAR2B, protein kinase cAMP-dependent type II regulatory
subunit β; RACGAP1, Rac GTPase-activating protein 1
(RACGAP1); RRM2, ribonucleotide reductase regulatory
subunit M2; TOP2A, DNA topoisomerase 2α; TPX2, TPX2
microtubule nucleation factor. |
 | Table I.Modules identified from the
protein-protein interaction network of nasopharyngeal
carcinoma. |
Table I.
Modules identified from the
protein-protein interaction network of nasopharyngeal
carcinoma.
| Module | Score | Nodes | Edges | Node IDs |
|---|
| 1 | 19 | 19 | 171 | KIF18A, MAD2L1,
CENPE, ZWINT, CCNB1, MLF1IP, CENPH, NUP107, AHCTF1, XPO1, CENPK,
CDCA5, CENPF, BUB1B, CDK1, NDC80, ZWILCH, NUF2, KNTC1 |
| 2 | 11 | 11 | 55 | ANXA1, CCR1, CCR5,
CCL5, C3, CXCL11, NMU, CXCL3, CXCL9, CXCL10, CXCL1 |
| 3 | 10.909 | 12 | 60 | MUC13, MUC19, MUC4,
B3GNT7, MUC5AC, GALNT11, MUC16, GALNT12, MUC20, GCNT3, MUC1,
MUC15 |
| 4 | 9.524 | 22 | 100 | KIF15, DLGAP5,
PRC1, CETN2, HAUS1, HAUS6, TUBA1A, TOP2A, AURKA, TPX2, HMMR,
PRKAR2B, TUBB4B, KIF23, KIF11, KIF13B, NEDD1, KIF18B, KIF4A, NCAPG,
CCNA2, TTK |
| 5 | 8 | 8 | 28 | COL4A2, COL4A1,
COL1A2, COL3A1, COL5A1, COL15A1, COL5A2, COL6A3 |
| 6 | 6.571 | 8 | 23 | IFI44, IFIT1, XAF1,
IFIT3, RSAD2, IFIT2, IFI44L, BST2 |
| 7 | 5.429 | 22 | 57 | CDC6, CEP55,
NUSAP1, CDC7, TOPBP1, PSMD14, KIF20A, ASPM, ANLN, MELK, DBF4,
PRIM1, RACGAP1, ORC6, MCM3, MCM7, TIPIN, PSMD12, CDC45, PBK, PSMA1,
RRM2 |
| 8 | 5 | 9 | 20 | BRIP1, PCNA, H2AFZ,
DNA2, HIST2H2BE, SMC4, RBBP8, RMI2, RAD51AP1 |
| Table II.Enriched KEGG pathways in module
1. |
Table II.
Enriched KEGG pathways in module
1.
| ID | Description | Count | P-value | Gene symbol |
|---|
| hsa04110 | Cell cycle | 4 |
2.48×10⁻⁶ |
CCNB1/BUB1B/CDK1/MAD2L1 |
| hsa04914 |
Progesterone-mediated oocyte
maturation | 3 |
7.70×10⁻⁵ |
CCNB1/CDK1/MAD2L1 |
| hsa04114 | Oocyte meiosis | 3 |
1.51×10⁻⁴ |
CCNB1/CDK1/MAD2L1 |
| hsa05166 | Human T-cell
leukemia virus 1 infection | 3 |
1.26×10⁻³ |
XPO1/BUB1B/MAD2L1 |
| hsa04115 | p53 signaling
pathway | 2 |
1.88×10⁻³ | CCNB1/CDK1 |
| hsa04218 | Cellular
senescence | 2 |
8.99×10⁻³ | CCNB1/CDK1 |
| hsa03013 | RNA transport | 2 |
1.02×10⁻² | NUP107/XPO1 |
| hsa05169 | Epstein-Barr virus
infection | 2 |
1.39×10⁻² | XPO1/CDK1 |
| hsa05170 | Human
immunodeficiency virus 1 infection | 2 |
1.54×10⁻² | CCNB1/CDK1 |
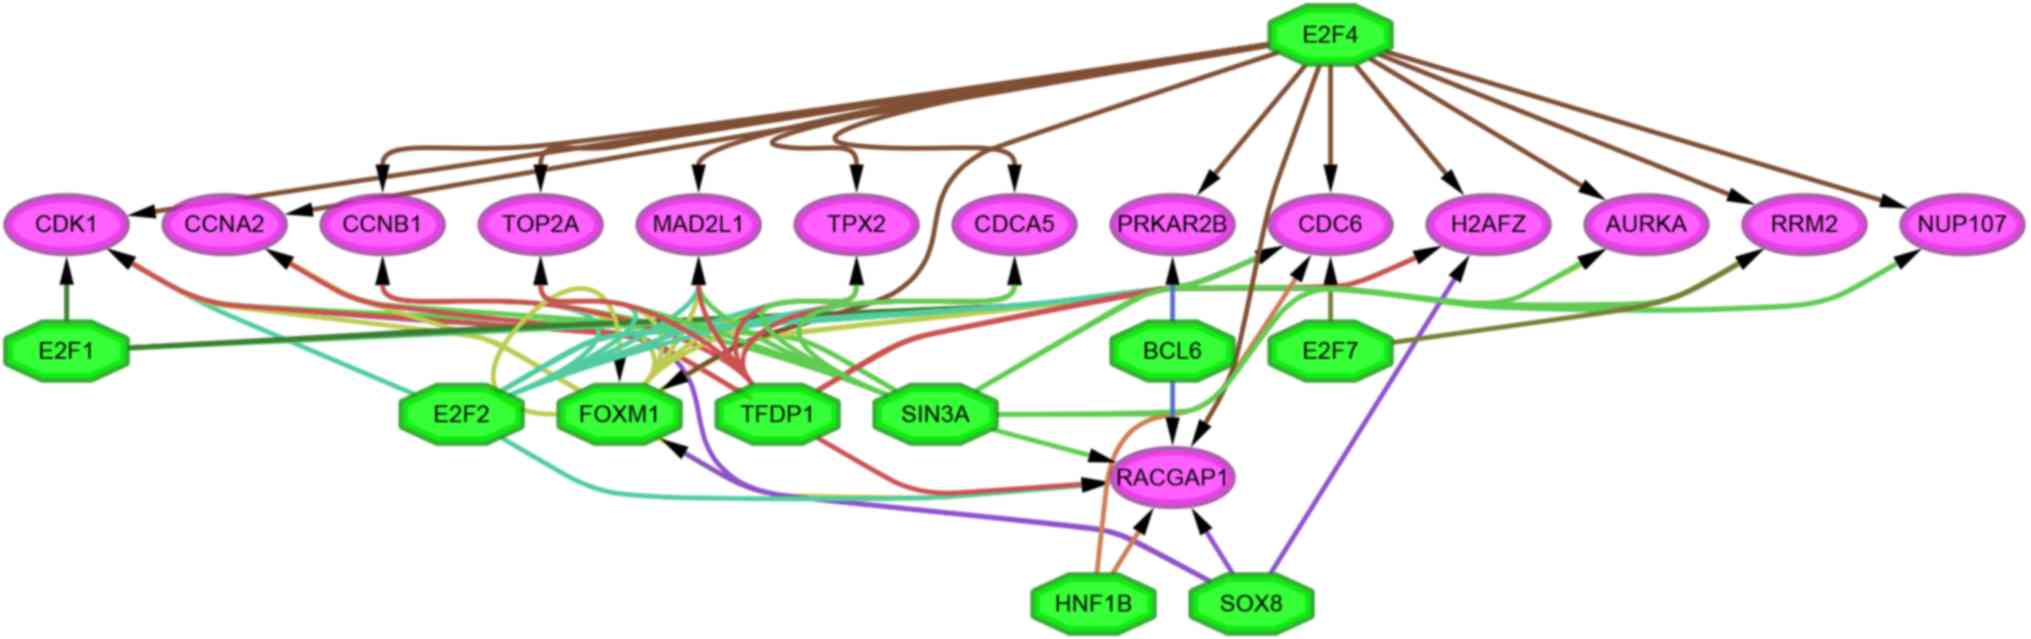
Upstream transcriptional regulator
analysis
The iRegulon app in Cytoscape was used to explore
the potential regulatory mechanism of DEGs. A total of 14 TFs
predicted to regulate 736 DEGs were identified (Table III). Among them, regulatory factor
X4 (RFX4) regulated more DEGs compared with the others
(n=362), but the TF with the highest NES score was E2F
transcription factor (E2F) 4 (NES score=6.925). In addition,
forkhead box M1 (FOXM1), E2F6 and E2F5 were
DEGs. Additionally, the results revealed that 10 TFs [BCL6
transcription repressor, E2F1, E2F2, E2F4, E2F7, FOXM1, HNF1
homeobox B, SIN3 transcription regulator family member A
(SIN3A), sex determining region Y box 8 (SOX8) and
transcription factor Dp-1 (TFDP1)] were predicted to
regulate 14 candidate hub genes. The possible regulatory
relationships between the TFs and the candidate hub genes are
presented in Fig. 7.
| Table III.Transcription factors targeting
differentially expressed genes of nasopharyngeal carcinoma
predicted by iRegulon. |
Table III.
Transcription factors targeting
differentially expressed genes of nasopharyngeal carcinoma
predicted by iRegulon.
|
ClusterCodea | Transcription
factor | NES
scoreb | Target
genesc (n) | Motifs/tracks
(n) |
|---|
| T1 | E2F4 | 6.925 | 173 | 3 |
| M1 | E2F5 | 6.301 | 217 | 26 |
| T2 | TFDP1 | 6.258 | 107 | 1 |
| T3 | FOXM1 | 4.926 | 161 | 5 |
| T4 | E2F7 | 4.824 | 47 | 1 |
| T5 | SIN3A | 4.600 | 187 | 2 |
| M3 | RFX4 | 4.485 | 362 | 8 |
| T6 | E2F1 | 3.945 | 87 | 1 |
| M4 | NFKB1 | 3.935 | 320 | 8 |
| M5 | SOX8 | 3.837 | 252 | 3 |
| M8 | E2F6 | 3.377 | 33 | 1 |
| T7 | E2F2 | 3.177 | 196 | 1 |
| M10 | BCL6 | 3.122 | 140 | 2 |
| M13 | HNF1B | 3.003 | 161 | 1 |
Discussion
Gene chips have been increasingly used in NPC
research; however, the DEGs screened by different platforms or
researchers vary significantly. Even studies on the same platform
may yield different results, which may be associated with the
differences in specimen sources, sample processing and experiment
batches. Integration and analysis of gene chip data to obtain more
consistent results has become problematic. Some researchers choose
to do meta-analysis of multiple gene expression profiles based on
different platforms or from a number of types of cells, whereas
others chose to integrate data based on the same platform (25–27).
Additional molecular biology experiments may be needed to conclude
which method provides more accurate results. Prior to the present
study, a number of NPC datasets in GEO databases were selected to
perform DEG filtering separately; using the same method, the number
of screened DEGs from two datasets (GSE12452 and GSE34573) based on
the same platform was similar (data not shown). GSE12452 is a
classical gene expression profile of NPC. GSE34573 was submitted
recently, and to the best of our knowledge, no other researchers
have integrated GSE34573 with other chips for bioinformatics
research; in the present study, GSE12452 and GSE34573 were chosen
as the research objects. In addition, the annotations to the gene
chips and the databases of gene functions and pathways, including
GO and KEGG databases, are constantly updated. More meaningful
results may be obtained by using the updated database for
additional gene function analysis in the future.
In this study, the raw data of GSE12452 and GSE34573
from GEO database were downloaded. After data processing and
statistical analysis with R software, 906 DEGs were obtained. These
DEGs were distributed on all human chromosomes except the Y
chromosome. Chromosome 1 contained the largest number of DEGs,
while chromosome 21 and chromosome 22 contained fewer DEGs. The
DEGs were identified to be enriched on chromosome 7p15-p14, 2q31,
1q21-q22, 1q21, 4q21 and 1p31-p22 based on the CYTOBAND database of
DAVID. Among the genes which were located on these chromosomal
regions, HOXA10, ANLN, COL3A1, GAD1, SELENBP1, S100A8, S100A9,
S100A2, CXCL1, CXCL9, CXCL10 and CLCA2 have been
reported to be associated with NPC. In the original publications
for GSE12452, only two chromosomal regions, 4p15.1-4q12 and
14q32-14q32.33, which were previously demonstrated to be linked to
NPC, were evaluated (8,28). The genes in these two regions were
found to be differentially expressed between tumor and normal
tissue specimens. However, other chromosome regions were not
identified in the previous publications. GSE34573 was designed to
examine both genetic copy number changes and gene expression
changes in the same samples (9). In
the original publication for GSE34573, 1,049 a priori
determined tumor-related genes were examined for differential
expression (9), but in the present
study, all genes on the chip were examined.
To explore the biological functions of the DEGs, GO
and KEGG enrichment analyses were conducted. The enriched GO terms
and pathways demonstrated a number of differences between NPC
specimens and normal nasopharyngeal tissues. The human nasopharynx
is lined with ciliated pseudostratified columnar epithelium, but
the cilia are absent in NPC cells (29). In the present study, GO terms ‘motile
cilium’, ‘ciliary plasm’ and ‘axoneme’ were enriched, and the
associated genes exhibited a consistent pattern of low expression
(data not shown). In addition, the ‘IL-17 signaling pathway’ was
enriched in the KEGG analysis. IL-17 is a proinflammatory cytokine
predominantly produced by T-helper 17 cells. In NPC, IL-17A has
been reported to promote the migration and invasion of NPC cells
via the p38 mitogen-activated protein kinase/NF-κB) signaling
pathway, which subsequently upregulates the expression of matrix
metallopeptidase (MMP) 2 and MMP9 and enhances
epithelial-mesenchymal transition (EMT) (30).
To reveal the interactions between DEGs of NPC, a
PPI network was constructed using the STRING database. By means of
the MCODE app in Cytoscape software, eight modules that might serve
an important role in the development of NPC were detected.
Subsequently, GO and KEGG pathway enrichment analyses were
performed to reveal the biological functions of these modules. The
results demonstrated that the genes in the seven modules displayed
different functions. For example, in module 2, the enriched GO
terms included ‘chemokine activity’, ‘G-protein coupled receptor
binding’ and ‘chemokine receptor binding’, and the enriched KEGG
pathways included ‘Chemokine signaling pathway’, ‘Cytokine-cytokine
receptor interaction’ and ‘Kaposi sarcoma-associated herpesvirus
infection’; while in module 5, the enriched GO terms included
‘extracellular matrix structural constituent’, ‘extracellular
matrix structural constituent conferring tensile strength’ and
‘platelet-derived growth factor binding’, and the enriched KEGG
pathways included ‘Protein digestion and absorption’, ‘ECM-receptor
interaction’ and ‘Amoebiasis’. In addition, the DEGs in module 1
were similar to previously identified modules (27), and ‘cell cycle’, ‘cell division’,
‘oocyte meiosis’ and ‘p53 signaling pathway’ were also identified
to be enriched in enrichment analysis; however, compared with
previous studies (25,27), more modules and information regarding
GO terms and KEGG pathways of the modules were provided in the
present study. Of note, CDK1 and XPO1 were
demonstrated to be involved in the pathway of EBV infection.
CDK1 encodes a catalytic subunit of M-phase promoting
factor, which is necessary for G1/S and G2/M phase transitions
during the eukaryotic cell cycle (31). EBV nuclear antigen (EBNA)
leader protein (LP) and EBNA1 are important for
EBV-induced B cell immortalization; it has been reported that
CDK1 mediates the phosphorylation of EBNA1 and
EBNA-LP at Ser35 and Ser393 sites, respectively (32,33). The
protein encoded by XPO1 is involved in the nuclear export of
cellular proteins; it binds to EBV SM protein, the spliced
BSLF2/BMLF1 protein (34), which is
an essential process for activity and cytoplasmic localization of
SM protein (35). Therefore, these
results suggested that CDK1 and XPO1 may be important
genes in the pathogenic process of NPC induced by EBV.
There are a number of algorithms used for the
identification of the hub genes. To improve the reliability of the
results of the present study, the top 50 genes of 12 algorithms
were investigated with the CytoHubba app. The genes common in >8
algorithms were regarded as the hub genes. The GSE13597 dataset was
used to determine the expression levels of the candidate hub genes.
A total of 14 candidate hub genes of NPC were identified. Among
these, seven have been reported previously: AURKA, CCNA2, CCNB1,
CDC6, CDK1, MAD2L1 and TOP2A (27). The other seven genes were identified
as candidate hub genes for the first time: CDCA5, H2AFZ, NUP107,
PRKAR2B, RACGAP1, RRM2 and TPX2. H2AFZ encodes
protein H2A.Z.1, which is an isoform of H2A.Z; as a protein
incorporated into chromatin, H2A.Z is associated with the
orchestration of DNA double-strand break repair, maintaining the
integrity of telomeres, genome stability and chromosome segregation
(36). In hepatocellular carcinoma,
H2A.Z.1 serves a pivotal role in liver tumorigenesis by selectively
regulating key molecules in the cell cycle and EMT (37). NUP107, a component of the
nuclear pore complex, regulates the exchange of molecules between
the nucleoplasm and cytoplasm in a selective manner (38). A variant in the 3′-UTR region of
NUP107 has been identified to be associated with sensitivity
to platinum-based chemotherapy in ovarian cancer (39). RACGAP1 encodes a
GTPase-activating protein, which is a component of the central
spindlin complex; it is involved in tumor cell proliferation,
migration, invasion and metastasis and serves an oncogenic role in
a number of malignancies such as breast cancer, hepatocellular
carcinoma and colorectal cancer (40). RRM2 encodes a subunit of
ribonucleotide reductase, which catalyzes the conversion of
ribonucleotides into deoxyribonucleotides; overexpression of
RRM2 predicts a poor prognosis for patients with NPC
(41). The protein encoded by
TPX2 is associated with the assembly of microtubules and
mitotic spindles during mammalian cell mitosis; it is necessary for
targeting AURKA to the microtubules of the mitotic spindle,
and elevated TPX2 expression is correlated with the
aggressiveness of ovarian and salivary gland cancer (42). However, among the 14 candidate hub
genes, only five (AURKA, CDC6, MAD2L1, TOP2A and
TPX2) were demonstrated to have expression differences
between NPC and normal nasopharyngeal tissues, which may be
associated with the small number of samples in the GSE13597
dataset, which contained 25 NPC specimens and three normal
nasopharyngeal tissues. Nevertheless, except for CDCA5 and
PRKAR2B, the candidate hub genes exhibited a tendency of
high expression in NPC.
In addition, 14 TFs regulating the DEGs of NPC were
identified in the present study. Among these, FOXM1, E2F1,
TFDP1 and NF-κB subunit 1 (NFKB1) have been previously
studied in NPC. FOXM1 is upregulated in NPC cells and
related to metastases in patients with NPC (43). Downregulation of FOXM1 by
thiostrepton or small interfering RNA leads to the inhibition of
NPC cell proliferation, migration, invasion, transformation ability
and angiogenesis (44,45). Several signaling pathways of
E2F1, including p21/CCND1/CDK6/E2F1, p15/p16/CDK4/E2F1, and
p16 (INK4A)/Rb/E2F1, have been reported to be involved in
carcinogenesis of NPC (46,47). Moreover, transactivation of
E2F1 and/or TFDP1 might contribute to overexpression
of stathmin 1 in NPC (48). Aberrant
NF-κB signaling has been demonstrated to be constitutively
activated by genetic alterations or EBV-encoded latent membrane
protein 1 (49,50). The remaining TFs (E2F4, E2F5,
E2F7, SIN3A, RFX4 and SOX8) were reported to be
associated with NPC for the first time in the present study.
In summary, based on an integrated bioinformatics
approach, five hub genes and 14 TFs were identified in NPC. Among
them, TPX2 were reported to be associated with the
pathogenesis of NPC for the first time. In addition, pathway
enrichment analysis for modules suggested that CDK1 and
XPO1 may be important genes in EBV-induced NPC. The
pathogenesis of NPC is complex and involves the majority of human
chromosomes, and EBV may be involved. Additionally, the results of
the enrichment analysis revealed that, in the course of NPC,
abnormalities of cell morphology, glutathione metabolism, immunity
and the formation and movement of cilium, microtubules and axoneme
are affected. In addition, DNA replication, cell cycle, chromosome
separation and other processes were involved, which ultimately lead
to malignant transformation of nasopharyngeal cells.
It must be noted that there were certain limitations
to the present study. Firstly, only two datasets were integrated
and analyzed, and the number of cases was small. Secondly, the
distribution of DEGs on different chromosomes was studied at the
level of mRNA, but chromosomal aberrations were not investigated.
Thirdly, the present study only validated the expression of hub
genes using datasets based on GSE13597 and lacks validation
experiments at the molecular level. However, these results may
promote the understanding of the molecular mechanisms underlying
NPC and provide useful clues for identifying molecular targets for
diagnosis and treatment of NPC in the future.
Acknowledgements
Not applicable.
Funding
The present study was supported by The Scientific
and Technological Project of Zhanjiang (grant no. 2012C3105022) and
The Foundation for Young Scholars of Guangdong Medical College
(grant no. 2012004).
Availability of data and materials
The datasets used and/or analyzed during the present
study are available from the corresponding author on reasonable
request.
Authors' contributions
JH, ZZ and SG conceived and designed the
experiments. ZZ, SG, SL and RL performed the experiments. ZZ and SG
analyzed the data. SL and RL participated in the acquisition of
data, prepared figures and/or tables and interpreted the data. ZZ,
SG and SL wrote the paper.
Ethics approval and consent to
participate
Not applicable.
Patient consent for publication
Not applicable.
Competing interests
The authors declare that they have no competing
interests.
References
|
1
|
Chua MLK, Wee JTS, Hui EP and Chan ATC:
Nasopharyngeal carcinoma. Lancet. 387:1012–1024. 2016. View Article : Google Scholar : PubMed/NCBI
|
|
2
|
Fu ZT, Guo XL, Zhang SW, Zeng HM, Sun KX,
Chen WQ and He J: Incidence and mortality of nasopharyngeal
carcinoma in China, 2014. Zhonghua Zhong Liu Za Zhi. 40:566–571.
2018.(In Chinese; Abstract available in Chinese from the
Publisher). PubMed/NCBI
|
|
3
|
Wei WI and Sham JS: Nasopharyngeal
carcinoma. Lancet. 365:2041–2054. 2005. View Article : Google Scholar : PubMed/NCBI
|
|
4
|
Tsao SW, Yip YL, Tsang CM, Pang PS, Lau
VM, Zhang G and Lo KW: Etiological factors of nasopharyngeal
carcinoma. Oral Oncol. 50:330–338. 2014. View Article : Google Scholar : PubMed/NCBI
|
|
5
|
Bose S, Yap LF, Fung M, Starzcynski J,
Saleh A, Morgan S, Dawson C, Chukwuma MB, Maina E, Buettner M, et
al: The ATM tumour suppressor gene is down-regulated in
EBV-associated nasopharyngeal carcinoma. J Pathol. 217:345–352.
2009. View Article : Google Scholar : PubMed/NCBI
|
|
6
|
Cai L, Ye Y, Jiang Q, Chen Y, Lyu X, Li J,
Wang S, Liu T, Cai H, Yao K, et al: Epstein-Barr virus-encoded
microRNA BART1 induces tumour metastasis by regulating
PTEN-dependent pathways in nasopharyngeal carcinoma. Nat
Commun. 6:73532015. View Article : Google Scholar : PubMed/NCBI
|
|
7
|
Wen X, Tang X, Li Y, Ren X, He Q, Yang X,
Zhang J, Wang Y, Ma J and Liu N: Microarray expression profiling of
long non-coding RNAs involved in nasopharyngeal carcinoma
metastasis. Int J Mol Sci. 17:E19562016. View Article : Google Scholar : PubMed/NCBI
|
|
8
|
Sengupta S, den Boon JA, Chen IH, Newton
MA, Dahl DB, Chen M, Cheng YJ, Westra WH, Chen CJ, Hildesheim A, et
al: Genome-wide expression profiling reveals EBV-associated
inhibition of MHC class I expression in nasopharyngeal carcinoma.
Cancer Res. 66:7999–8006. 2006. View Article : Google Scholar : PubMed/NCBI
|
|
9
|
Hu C, Wei W, Chen X, Woodman CB, Yao Y,
Nicholls JM, Joab I, Sihota SK, Shao JY, Derkaoui KD, et al: A
global view of the oncogenic landscape in nasopharyngeal carcinoma:
An integrated analysis at the genetic and expression levels. PLoS
One. 7:e410552012. View Article : Google Scholar : PubMed/NCBI
|
|
10
|
Neuwirth E: RColorBrewer: ColorBrewer
Palettes. R package version 1.1-2. https://cran.r-project.org/web/packages/RColorBrewer/index.html2014
|
|
11
|
Bolstad BM, Collin F, Brettschneider J,
Simpson K, Cope L, Irizarry RA and Speed TA: Quality assessment of
Affymetrix GeneChip data. Gentleman R, Carey VJ, Huber W, Irizarry
RA and Dudoit S: Bioinformatics and computational biology solutions
using R and bioconductor. Statistics for biology and health,
Springer. (New York, NY). 2005. View Article : Google Scholar
|
|
12
|
Leek JT, Johnson WE, Parker HS, Jaffe AE
and Storey JD: The sva package for removing batch effects and other
unwanted variation in high-throughput experiments. Bioinformatics.
28:882–883. 2012. View Article : Google Scholar : PubMed/NCBI
|
|
13
|
Gautier L, Cope L, Bolstad BM and Irizarry
RA: Affy-analysis of affymetrix genechip data at the probe level.
Bioinformatics. 20:307–315. 2004. View Article : Google Scholar : PubMed/NCBI
|
|
14
|
Troyanskaya O, Cantor M, Sherlock G, Brown
P, Hastie T, Tibshirani R, Botstein D and Altman RB: Missing value
estimation methods for DNA microarrays. Bioinformatics. 17:520–525.
2001. View Article : Google Scholar : PubMed/NCBI
|
|
15
|
Ritchie ME, Phipson B, Wu D, Hu Y, Law CW,
Shi W and Smyth GK: Limma powers differential expression analyses
for RNA-sequencing and microarray studies. Nucleic Acids Res.
43:e472015. View Article : Google Scholar : PubMed/NCBI
|
|
16
|
Huang da W, Sherman BT and Lempicki RA:
Systematic and integrative analysis of large gene lists using DAVID
bioinformatics resources. Nat Protoc. 4:44–57. 2009. View Article : Google Scholar : PubMed/NCBI
|
|
17
|
Ashburner M, Ball CA, Blake JA, Botstein
D, Butler H, Cherry JM, Davis AP, Dolinski K, Dwight SS, Eppig JT,
et al: Gene ontology: Tool for the unification of biology. The Gene
Ontology Consortium. Nat Genet. 25:25–29. 2000. View Article : Google Scholar : PubMed/NCBI
|
|
18
|
Kanehisa M and Goto S: KEGG: kyoto
encyclopedia of genes and genomes. Nucleic Acids Res. 28:27–30.
2000. View Article : Google Scholar : PubMed/NCBI
|
|
19
|
Yu G, Wang LG, Han Y and He QY:
clusterProfiler: An R package for comparing biological themes among
gene clusters. OMICS. 16:284–287. 2012. View Article : Google Scholar : PubMed/NCBI
|
|
20
|
Szklarczyk D, Morris JH, Cook H, Kuhn M,
Wyder S, Simonovic M, Santos A, Doncheva NT, Roth A, Bork P, et al:
The STRING database in 2017: Quality-controlled protein-protein
association networks, made broadly accessible. Nucleic Acids Res.
45:D362–D368. 2017. View Article : Google Scholar : PubMed/NCBI
|
|
21
|
Shannon P, Markiel A, Ozier O, Baliga NS,
Wang JT, Ramage D, Amin N, Schwikowski B and Ideker T: Cytoscape: A
software environment for integrated models of biomolecular
interaction networks. Genome Res. 13:2498–2504. 2003. View Article : Google Scholar : PubMed/NCBI
|
|
22
|
Bader GD and Hogue CW: An automated method
for finding molecular complexes in large protein interaction
networks. BMC Bioinformatics. 4:22003. View Article : Google Scholar : PubMed/NCBI
|
|
23
|
Chin CH, Chen SH, Wu HH, Ho CW, Ko MT and
Lin CY: CytoHubba: Identifying hub objects and sub-networks from
complex interactome. BMC Syst Biol. 4 (Suppl 8):S112014. View Article : Google Scholar
|
|
24
|
Janky R, Verfaillie A, Imrichova H, Van de
Sande B, Standaert L, Christiaens V, Hulselmans G, Herten K, Naval
Sanchez M, Potier D, et al: iRegulon: From a gene list to a gene
regulatory network using large motif and track collections. PLoS
Computat Biol. 10:e10037312014. View Article : Google Scholar
|
|
25
|
Tulalamba W, Larbcharoensub N, Sirachainan
E, Tantiwetrueangdet A and Janvilisri T: Transcriptome meta-
analysis reveals dysregulated pathways in nasopharyngeal carcinoma.
Tumor Biol. 36:5931–5942. 2015. View Article : Google Scholar
|
|
26
|
Liao KM, Chao TB, Tian YF, Lin CY, Lee SW,
Chuang HY, Chan TC, Chen TJ, Hsing CH, Sheu MJ and Li CF:
Overexpression of the PSAT1 gene in nasopharyngeal carcinoma is an
indicator of poor prognosis. J Cancer. 7:1088–1094. 2016.
View Article : Google Scholar : PubMed/NCBI
|
|
27
|
Chen F, Shen C, Wang X, Wang H, Liu Y, Yu
C, Lv J, He J and Wen Z: Identification of genes and pathways in
nasopharyngeal carcinoma by bioinformatics analysis. Oncotarget.
8:63738–63749. 2017.PubMed/NCBI
|
|
28
|
Dodd LE, Sengupta S, Chen IH, den Boon JA,
Cheng YJ, Westra W, Newton MA, Mittl BF, McShane L, Chen CJ, et al:
Genes involved in DNA repair and nitrosamine metabolism and those
located on chromosome 14q32 are dysregulated in nasopharyngeal
carcinoma. Cancer Epidemiol Biomarkers Prev. 15:2216–2225. 2006.
View Article : Google Scholar : PubMed/NCBI
|
|
29
|
Lowe JS and Anderson PG: Chapter
10-Respiratory System. Stevens & Lowe's Human Histology (Fourth
Edition). Lowe JS and Anderson PG: Mosby, Philadelphia: pp.
166–185. 2015, View Article : Google Scholar
|
|
30
|
Wang L, Ma R, Kang Z, Zhang Y, Ding H, Guo
W, Gao Q and Xu M: Effect of IL-17A on the migration and invasion
of NPC cells and related mechanisms. PLoS One. 9:e1080602014.
View Article : Google Scholar : PubMed/NCBI
|
|
31
|
Gavet O and Pines J: Progressive
activation of CyclinB1-Cdk1 coordinates entry to mitosis. Dev Cell.
18:533–543. 2010. View Article : Google Scholar : PubMed/NCBI
|
|
32
|
Zhu J, Liao G, Shan L, Zhang J, Chen MR,
Hayward GS, Hayward SD, Desai P and Zhu H: Protein array
identification of substrates of the Epstein-Barr virus protein
kinase BGLF4. J Virol. 83:5219–5231. 2009. View Article : Google Scholar : PubMed/NCBI
|
|
33
|
Kato K, Yokoyama A, Tohya Y, Akashi H,
Nishiyama Y and Kawaguchi Y: Identification of protein kinases
responsible for phosphorylation of Epstein-Barr virus nuclear
antigen leader protein at serine-35, which regulates its
coactivator function. J Gen Virol. 84:3381–3392. 2003. View Article : Google Scholar : PubMed/NCBI
|
|
34
|
Cook ID, Shanahan F and Farrell PJ:
Epstein-Barr virus SM protein. Virology. 205:217–227. 1994.
View Article : Google Scholar : PubMed/NCBI
|
|
35
|
Boyle SM, Ruvolo V, Gupta AK and
Swaminathan S: Association with the cellular export receptor CRM 1
mediates function and intracellular localization of Epstein-Barr
virus SM protein, a regulator of gene expression. J Virol.
73:6872–6881. 1999.PubMed/NCBI
|
|
36
|
Vardabasso C, Hasson D, Ratnakumar K,
Chung CY, Duarte LF and Bernstein E: Histone variants: Emerging
players in cancer biology. Cell Mol Life Sci. 71:379–404. 2014.
View Article : Google Scholar : PubMed/NCBI
|
|
37
|
Yang HD, Kim PJ, Eun JW, Shen Q, Kim HS,
Shin WC, Ahn YM, Park WS, Lee JY and Nam SW: Oncogenic potential of
histone-variant H2A.Z.1 and its regulatory role in cell cycle and
epithelial-mesenchymal transition in liver cancer. Oncotarget.
7:11412–11423. 2016.PubMed/NCBI
|
|
38
|
Bui KH, von Appen A, DiGuilio AL, Ori A,
Sparks L, Mackmull MT, Bock T, Hagen W, Andrés-Pons A, Glavy JS and
Beck M: Integrated structural analysis of the human nuclear pore
complex scaffold. Cell. 155:1233–1243. 2013. View Article : Google Scholar : PubMed/NCBI
|
|
39
|
Alanee S, Delfino K, Wilber A, Robinson K,
Brard L and Semaan A: Single nucleotide variant in Nucleoporin 107
may be predictive of sensitivity to chemotherapy in patients with
ovarian cancer. Pharmacogenet Genomics. 27:264–269. 2017.
View Article : Google Scholar : PubMed/NCBI
|
|
40
|
Imaoka H, Toiyama Y, Saigusa S, Kawamura
M, Kawamoto A, Okugawa Y, Hiro J, Tanaka K, Inoue Y, Mohri Y and
Kusunoki M: RacGAP1 expression, increasing tumor malignant
potential, as a predictive biomarker for lymph node metastasis and
poor prognosis in colorectal cancer. Carcinogenesis. 36:346–354.
2015. View Article : Google Scholar : PubMed/NCBI
|
|
41
|
Han P, Lin ZR, Xu LH, Zhong Q, Zhu XF,
Liang FY, Cai Q, Huang XM and Zeng MS: Ribonucleotide reductase M2
subunit expression and prognostic value in nasopharyngeal
carcinoma. Mol Med Rep. 12:401–409. 2015. View Article : Google Scholar : PubMed/NCBI
|
|
42
|
Liu Q, Yang P, Tu K, Zhang H, Zheng X, Yao
Y and Liu Q: TPX2 knockdown suppressed hepatocellular carcinoma
cell invasion via inactivating AKT signaling and inhibiting MMP2
and MMP9 expression. Chin J Cancer Res. 26:410–417. 2014.PubMed/NCBI
|
|
43
|
Jiang L, Wang P and Chen H: Overexpression
of FOXM1 is associated with metastases of nasopharyngeal carcinoma.
Ups J Med Sci. 119:324–332. 2014. View Article : Google Scholar : PubMed/NCBI
|
|
44
|
Jiang L, Wang P, Chen L and Chen H:
Down-regulation of FoxM1 by thiostrepton or small interfering RNA
inhibits proliferation, transformation ability and angiogenesis,
and induces apoptosis of nasopharyngeal carcinoma cells. Int J Clin
Exp Pathol. 7:5450–5460. 2014.PubMed/NCBI
|
|
45
|
Yu C, Chen L, Yie L, Wei L, Wen T, Liu Y
and Chen H: Targeting FoxM1 inhibits proliferation, invasion and
migration of nasopharyngeal carcinoma through the
epithelialto-mesenchymal transition pathway. Oncol Rep.
33:2402–2410. 2015. View Article : Google Scholar : PubMed/NCBI
|
|
46
|
Liu Z, Long X, Chao C, Yan C, Wu Q, Hua S,
Zhang Y, Wu A and Fang W: Knocking down CDK4 mediates the elevation
of let-7c suppressing cell growth in nasopharyngeal carcinoma. BMC
Cancer. 14:2742014. View Article : Google Scholar : PubMed/NCBI
|
|
47
|
Ding L, Li L, Yang J, Zhou S, Li W, Tang
M, Shi Y, Yi W and Cao Y: Latent membrane protein 1 encoded by
Epstein-Barr virus induces telomerase activity via p16INK4A/Rb/E2F1
and JNK signaling pathways. J Med Virol. 79:1153–1163. 2007.
View Article : Google Scholar : PubMed/NCBI
|
|
48
|
Hsu HP, Li CF, Lee SW, Wu WR, Chen TJ,
Chang KY, Liang SS, Tsai CJ and Shiue YL: Overexpression of
stathmin 1 confers an independent prognostic indicator in
nasopharyngeal carcinoma. Tumour Biol. 35:2619–2629. 2014.
View Article : Google Scholar : PubMed/NCBI
|
|
49
|
Chung GT, Lou WP, Chow C, To KF, Choy KW,
Leung AW, Tong CY, Yuen JW, Ko CW, Yip TT, et al: Constitutive
activation of distinct NF-κB signals in EBV-associated
nasopharyngeal carcinoma. J Pathol. 231:311–322. 2013. View Article : Google Scholar : PubMed/NCBI
|
|
50
|
Yi M, Cai J, Li J, Chen S, Zeng Z, Peng Q,
Ban Y, Zhou Y, Li X, Xiong W, et al: Rediscovery of NF-κB signaling
in nasopharyngeal carcinoma: How genetic defects of NF-κB pathway
interplay with EBV in driving oncogenesis? J Cell physiol.
233:5537–5549. 2018. View Article : Google Scholar : PubMed/NCBI
|