Introduction
Ovarian cancer (OC) affects the ovaries and may
spread to the lungs, peritoneum, liver and lymph nodes (1,2). Early
OC may be asymptomatic, while advanced OC is characterized by a
loss of appetite, pelvic pain, bloating and abdominal swelling
(3). As OC may be difficult to
diagnose in the early stages, patients with OC are often diagnosed
in the advanced stages of the disease and, as a result, have an
unfavorable prognosis (4). Globally,
OC affects 1.2 million females and was responsible for 161,100
mortalities in 2015 (5). Among
gynecological tumors, OC is the third most common and has the
highest mortality (6). The
mechanisms underlying OC remain to be elucidated.
Phospho-H2AX expression is negatively associated
with the disease-free interval in epithelial OC (EOC), and its
expression may allow early diagnosis of the disease as well as the
identification of patients at high risk of recurrence (7). As a potential oncogene, actinin α 4 may
serve as predictive marker of poor prognosis and tumor
chemoresistance in patients with advanced OC (8). Excision repair cross-complementation
group 5 was revealed to be a prognostic biomarker of OC and a
candidate target for the response to platinum chemotherapy
treatment of patients with OC (9).
Cyclin D1 (CCND1) overexpression is significantly associated
with chemosensitivity and results in poor prognosis in patients
with advanced serous EOC, therefore, CCND1 may serve as a
novel target for treating chemoresistant tumors (10,11).
Copy number variations (CNVs) of neurotrophic receptor tyrosine
kinase 3 (NTRK3) were associated with platinum-resistant and
platinum-sensitive relapses, and NTRK3 amplification
predicted the platinum-sensitive recurrence of OC (12). The upregulation and copy number (CN)
gain of cyclin E1 were detected in patients with ovarian clear cell
carcinoma, and resulted in poor patient outcomes (13). Although the aforementioned genes may
influence the prognosis of patients with OC, the pathways affecting
OC prognosis remain to be fully elucidated.
Platinum-based drugs are effective anticancer agents
and are widely used in the treatment of various solid tumors
(14). Up to 80% of patients with
EOC initially respond while the rest exhibit primary resistance
(15). However, ≥80% of patients
with EOC receiving platinum-based chemotherapy eventually develop
resistance (15). The pathways
underlying resistance to platinum drugs in OC have not been fully
elucidated (16). An increased
understanding of these pathways may serve to prevent or reverse
resistance, improving the effect of treatment and the survival rate
of patients with OC. The current study analyzed single nucleotide
polymorphisms (SNPs) and CNVs in patients with OC using
bioinformatics analyses. This resulted in the design of a risk
score system, which was associated with platinum response status.
The expression levels of several genes were associated with the
survival prognosis of patients with OC. The results obtained the
current study may provide novel and accurate markers for the
diagnosis, prognosis and clinical treatment of patients with
OC.
Materials and methods
Microarray data
The mRNA sequencing data from 419 OC tissue samples
were analyzed using an Illumina HiSeq 2000 RNA Sequencing platform.
SNP and CNV data from 481 OC tissue samples were analyzed using an
Affymetrix Genome-Wide SNP Array 6.0 (Affymetrix; Thermo Fisher
Scientific, Inc., Waltham, MA, USA). The datasets were downloaded
from The Cancer Genome Atlas (TCGA; cancergenome.nih.gov) database. After the barcodes of
the samples in the datasets were matched, a total of 230 OC samples
with platinum response status and survival time information were
obtained. These samples included 69 platinum-resistant samples and
161 platinum-sensitive samples and were used as the training set.
The GSE63885 dataset (17) was
downloaded from the Gene Expression Omnibus (GEO; http://www.ncbi.nlm.nih.gov/geo) database and
analyzed using a GPL570 [HG-U133_Plus_2] Affymetrix Human Genome
U133 Plus 2.0 Array platform. This dataset consisted of 101 OC
tissue samples, including 75 samples with known platinum response
status (34 resistant samples and 41 sensitive samples), and was
used as the validation set. The clinical information of the
patients from whom the samples in the training and validation sets
were obtained are presented in Table
I.
 | Table I.Clinical information of the ovarian
cancer samples in the training set and the validation set. |
Table I.
Clinical information of the ovarian
cancer samples in the training set and the validation set.
|
| Training set
(n=230) | Validation set
(n=75) |
|---|
|
|
|
|
|---|
| Variable | Resistance
(n=69) | Sensitive
(n=161) | P-value | Resistance
(n=34) | Sensitive
(n=41) | P-value |
|---|
| Age (years, mean ±
SD) | 61.77±11.47 | 58.55±11.32 |
5.24×10⁻² | – | – | – |
| Neoplasm
subdivision (bilateral/left/right/-) | 51/7/7/4 | 109/27/14/11 |
4.18×10⁻¹ | – | – | – |
| Stage
(II/III/IV) | 1/60/8 | 10/127/24 |
2.41×10⁻¹ | – | – | – |
| Histological grade
(G2/G3/G4/-) | 7/60/1/1 | 25/133/0/3 |
1.88×10⁻¹ | – | – | – |
| Lymphatic invasion
(yes/no/-) | 17/7/45 | 35/30/96 |
2.25×10⁻¹ | – | – | – |
| Recurrence
(yes/no) | 61/8 | 122/5/34 |
6.70×10⁻² | – | – | – |
| Mortality
(dead/alive) | 58/11 | 82/79 |
1.67×10⁻⁶ | 33/1 | 33/8 |
3.50×10⁻² |
| Overall survival
time (months, mean ± SD) | 29.71±14.34 | 48.59±25.33 |
1.34×10⁻¹¹ | 27.01±14.51 | 55.89±31.34 |
2.13×10⁻⁶ |
Data preprocessing and differential
expression analysis
The preprocessCore package (18) (version 1.40.0, http://bioconductor.org/packages/release/bioc/html/preprocessCore.html)
in R version 3.4.1 (https://www.r-project.org) was used to normalize the
mRNA sequencing data downloaded from TCGA database. The PICNIC
software (19) (the ‘predict
integral copy numbers in cancer’ algorithm, ftp.sanger.ac.uk/pub/cancer) was used to convert the
SNP data downloaded from the TCGA database from Cel format to
segment format and to obtain CN segment data (the zero segment
value indicated no CNV, and the other non-zero signal value
indicated loss or amplification mutation in the detection area).
Subsequently, a human gene annotation file (GRCh38.p10) (20), was downloaded from the GENCODE
database (release 27; http://www.gencodegenes.org/human) and genes were
annotated according to the CN area coordinates of each sample. For
GSE63885, format conversion, missing value supplement, background
correction and data normalization were conducted using the R
package oligo (21) (version 1.42.0;
www.bioconductor.org/packages/release/bioc/html/oligo.html).
Subsequent to dividing the samples in the TCGA
dataset into resistant and sensitive, the differentially expressed
genes (DEGs) and differentially expressed CNV genes (DECNs) were
identified using the R package limma (22) (version 3.34.7; bioconductor.org/packages/release/bioc/html/limma.html)
The results with false discovery rate (FDR)<0.05 and |log fold
change (FC)|>0.263 were selected. The overlapping genes between
DEGs and DECNs were selected. The genes with CNVs [including single
nucleotide polymorphism (SNP), insertion (INS) and deletion (DEL)]
were chosen for further analyses.
Identification of prognosis-associated
genes and clinical factors
The aforementioned selected genes and clinical
factors independently associated with prognosis were analyzed using
univariate and multivariate Cox regression analysis in the R
package survival (23) (version
2.41.1; cran.r-project.org/web/packages/survival/index.html).
P<0.05 was considered to indicate a statistically significant
difference.
Construction and assessment of the
risk score system
Based on the coefficients of the independent
prognostic factors in the multivariate Cox regression analysis, a
gene-based risk score system was constructed for OC. The risk score
of each sample was calculated according to the following formula:
Risk score=Σ(coefmRNA × ExpmRNA), where
coefmRNA is the prognostic coefficient of the mRNA in
the multivariate Cox regression analysis and ExpmRNA is
the expression level of the mRNA.
Using the median of the risk scores as a cut-off
point (24,25), the samples in the training set were
classified into high and low risk groups. The association between
the risk score and prognosis was evaluated using the Kaplan-Meier
(KM) survival curve (26) in the R
package survival, and then validated in the validation set. To
reveal the association of the risk score and platinum response
status, the associations between the risk score and prognosis were
evaluated in the resistant and sensitive group separately using
univariate and multivariate Cox regression analysis.
The association between clinical factors and
prognosis was also analyzed in the high and low risk groups. The
clinical factors which were significantly associated with prognosis
in high and low risk groups were analyzed with KM survival analysis
(26).
Association between chemotherapy
response and prognosis
The clinical factors significantly associated with
prognosis were identified from the samples with chemotherapy
response information using the Cox regression analysis in the R
package survival (23). A nomogram
was subsequently constructed using the R package rms (27) (version 5.1–2; cran.r-project.org/web/packages/rms/index.html). The
association between the platinum response status and prognosis of
patients with OC was assessed using the probabilities acquired from
the nomogram.
Differential expression and pathway
enrichment analysis
Using the R package limma (28), the DEGs in the high and low risk
groups were analyzed. The genes with FDR<0.05 and
|logFC|>0.263 were defined as DEGs. The correlation coefficient
of DEGs and risk scores of samples were calculated using Cor
function in R. Pathway enrichment analysis for the DEGs was
subsequently performed using Gene Set Enrichment Analysis software
3.0 (29) (software.broadinstitute.org/gsea/index.jsp). P<0.05
was considered to indicate a statistically significant
difference.
Results
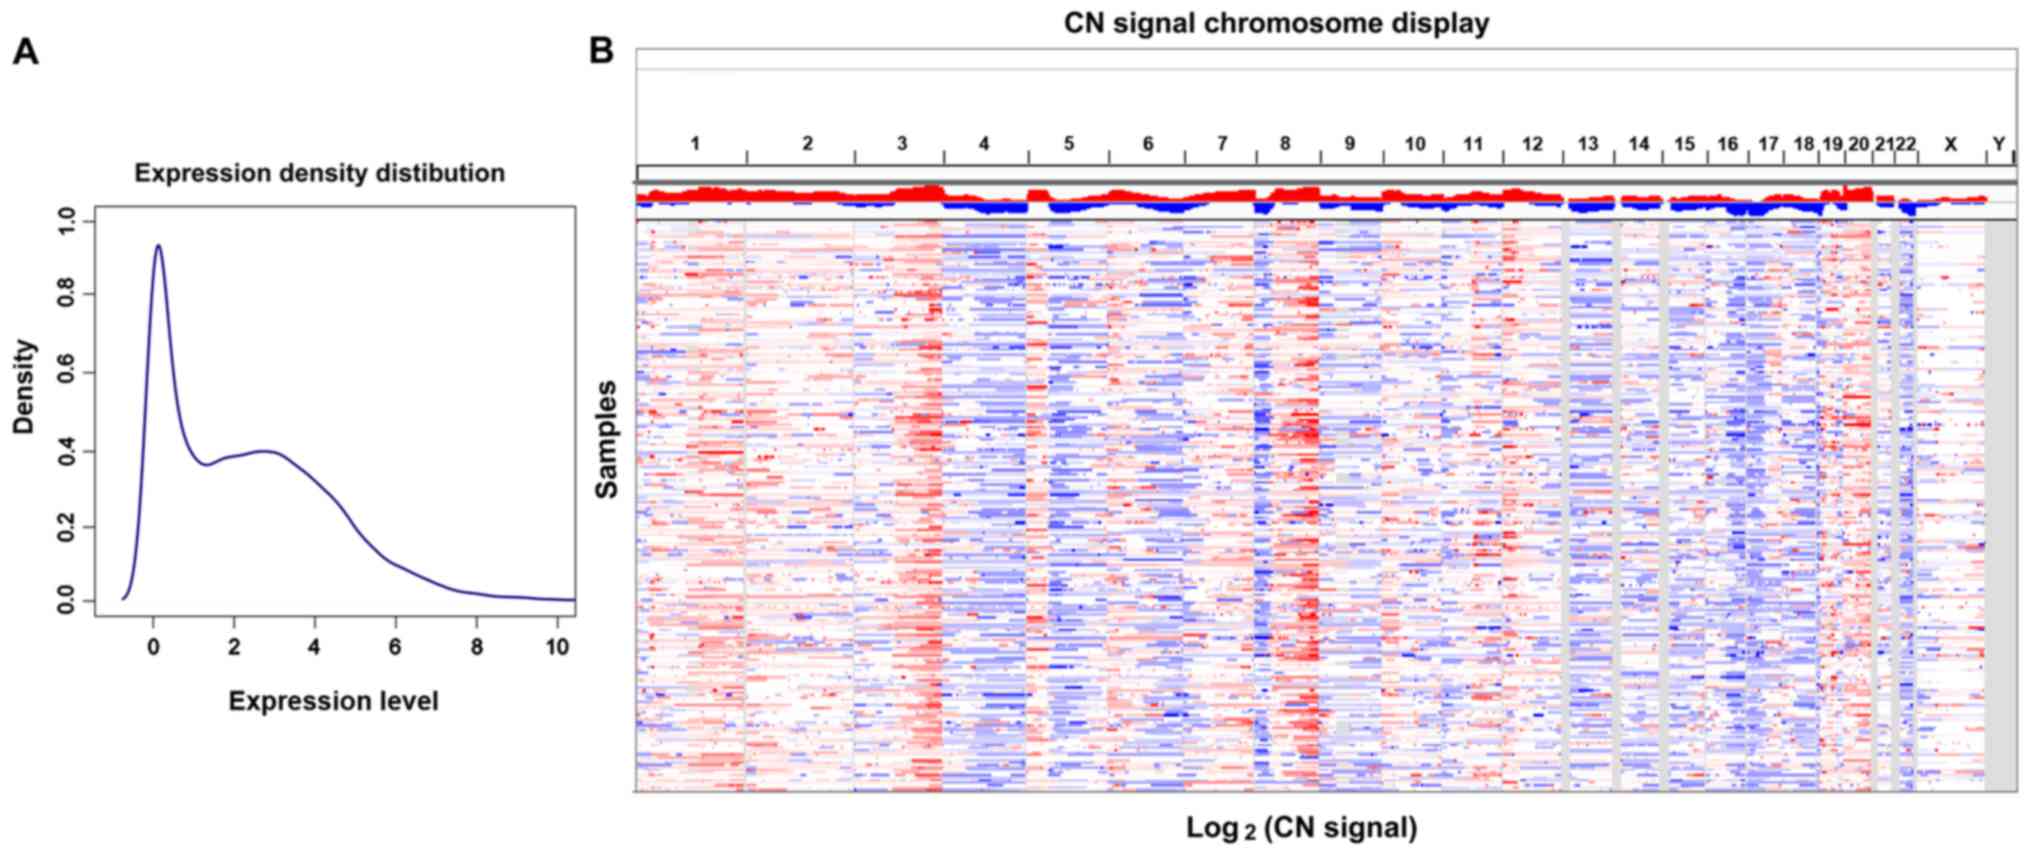
Differential expression analysis
The mRNA expression density distribution and CN
signal chromosome display of the TCGA OC dataset are presented in
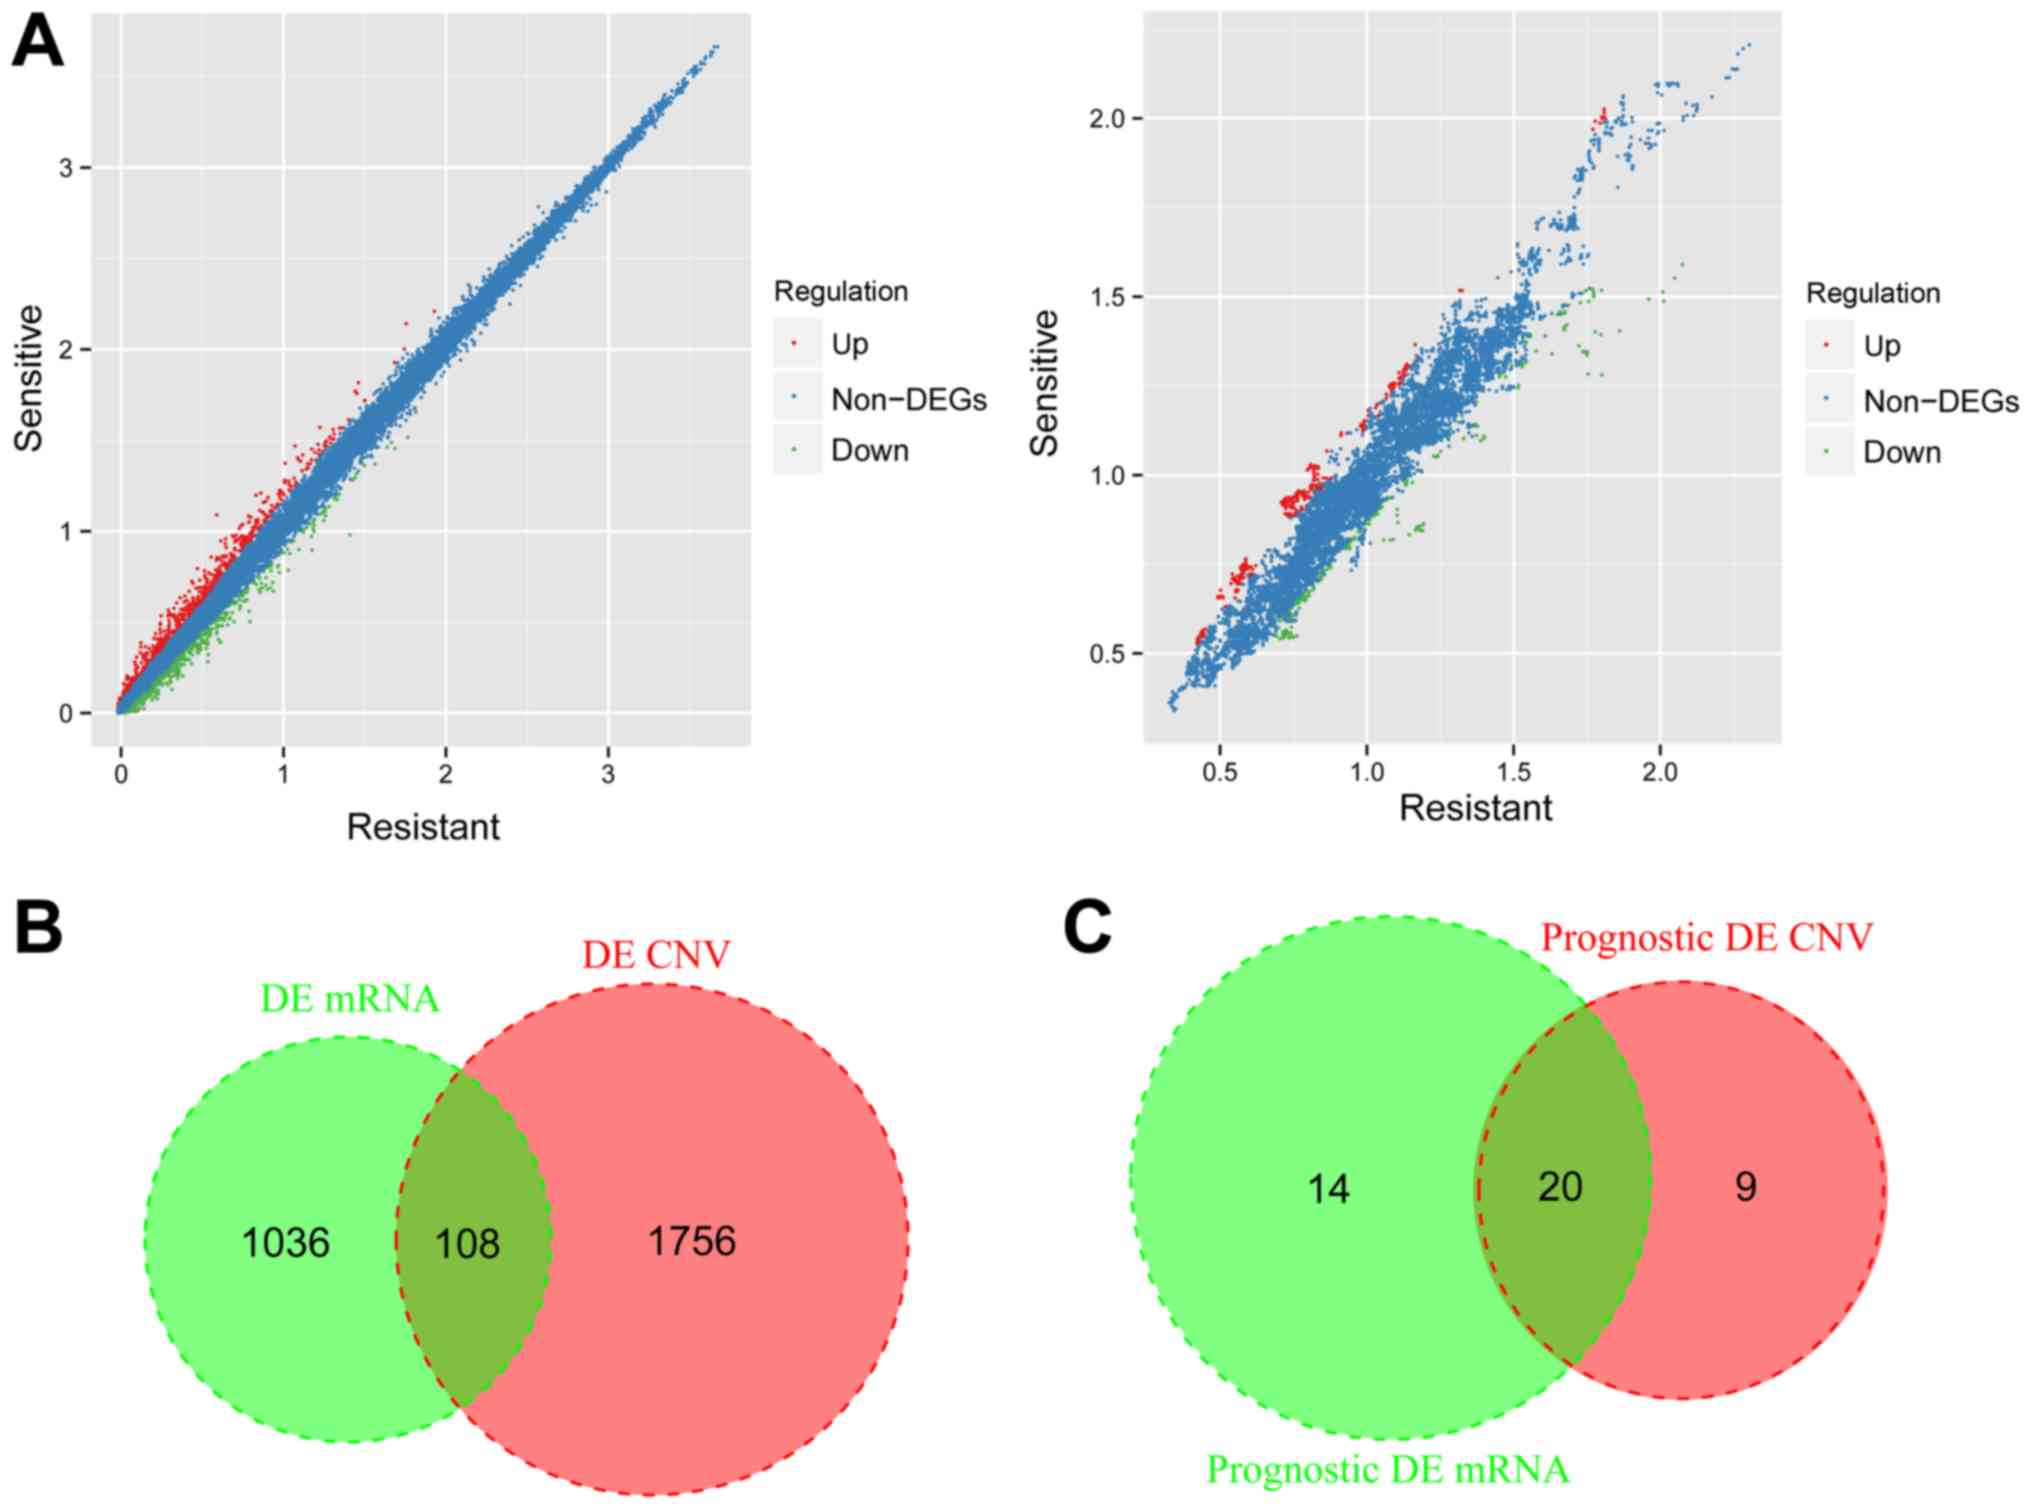
Fig. 1A and B. A total of 1,144 DEGs
(620 upregulated and 524 downregulated) and 1,864 DECNs (1,137
upregulated and 727 downregulated) were identified in the resistant
and sensitive samples (Fig. 2A).
After the DEGs and DECNs were compared, a total of 108 overlapping
genes were obtained (Fig. 2B). Among
the overlapping genes, 48 overlapping genes with CNVs (including 94
SNPs, 1 INS and 1 DEL) were selected and performed with the
following analyses.
Identification of prognosis-associated
genes and clinical factors
Combined with the expression levels and CN signal
levels of the 48 genes in the TCGA dataset, 34 prognosis-associated
genes in expression level and 29 prognosis-associated genes in CN
signal level were screened using univariate multivariate Cox
regression analysis. A total of 20 overlapping genes were
identified after comparing the two types of genes which were
significantly associated with prognosis in expression level and CN
signal level (Fig. 2C), including
calcium voltage-gated channel subunit α1 C (CACNA1C), CD274
molecule, CECR2 histone acetyl-lysine reader, contactin 6, DEAQ-box
RNA dependent ATPase 1, FERM domain-containing 1, growth
differentiation factor 3 (GDF3), gap junction protein α8,
neuroligin 1, NTRK3, PARN-like ribonuclease
domain-containing 1, seizure-related 6 homolog-like, solute carrier
family 22 member 3 (SLC22A3), solute carrier family 5 member
1, synemin (SYNM), synaptotagmin 9, T-box transcription
factor T (TBXT), tektin 5 (TEKT5), V-set and
transmembrane domain containing 2-like and ZFP57 zinc finger
protein.
The 20 overlapping genes were subjected to
multivariate Cox regression analysis, and a total of six
independent prognostic genes (TBXT, SYNM, TEKT5, GDF3,
SLC22A3 and CACNA1C) were identified (P<0.05;
Table II). The CNV data of the six
independent prognostic genes are presented in Table III.
| Table II.Multivariate analysis of the six
independent prognostic genes. |
Table II.
Multivariate analysis of the six
independent prognostic genes.
| Gene | Coefficient | Hazard ratio (95%
confidence interval) | P-value |
|---|
| T-box transcription
factor T | 1.113 | 3.046
(1.677–5.531) | 0.0003 |
| Synemin | −0.625 | 0.535
(0.367–0.779) | 0.0011 |
| Tektin 5 | 0.567 | 1.763
(1.174–2.6452) | 0.0062 |
| Growth
differentiation factor 3 | 0.374 | 1.453
(1.0701–1.973) | 0.0166 |
| Solute carrier
family 22 member 3 | 0.652 | 1.919
(1.036–3.555) | 0.0384 |
| Calcium
voltage-gated channel subunit α1 C | 0.56 | 1.752
(1.022–3.002) | 0.0415 |
| Table III.CNV data of the six independent
prognostic genes. |
Table III.
CNV data of the six independent
prognostic genes.
| Gene | Chromosome | CNV position | Strand | Variant
classification | Variant type | Reference
allele | Tumor seq allele
1 | Tumor seq allele
2 | Validation
status |
|---|
| T-box transcription
factor T | 6 | 166571861 | −1 | Missense
mutation | SNP | G | G | A | Valid |
| Solute carrier
family 22 member 3 | 6 | 160872083 | 1 | Missense
mutation | SNP | C | C | T | Unknown |
| Growth
differentiation factor 3 | 12 | 7848219 | −1 | Frame shift
del | DEL | C | C | – | Valid |
|
| 12 | 7848321 | −1 | Missense
mutation | SNP | G | G | T | Unknown |
| Calcium
voltage-gated channel subunit α1 C | 12 | 2224552 | 1 | Missense
mutation | SNP | C | C | A | Valid |
|
| 12 | 2760846 | 1 | Missense
mutation | SNP | G | G | T | Valid |
|
| 12 | 2788613 | 1 | Missense
mutation | SNP | G | G | T | Valid |
|
| 12 | 2622145 | 1 | Missense
mutation | SNP | G | G | A | Unknown |
|
| 12 | 2774154 | 1 | Missense
mutation | SNP | C | C | G | Valid |
|
| 12 | 2788812 | 1 | Missense
mutation | SNP | C | C | A | Valid |
|
| 12 | 2788717 | 1 | Silent | SNP | G | G | A | Valid |
|
| 12 | 2797734 | 1 | Missense
mutation | SNP | T | T | C | Valid |
|
| 12 | 2613667 | 1 | Intron | SNP | C | C | A | Valid |
|
| 12 | 2716201 | 1 | Missense
mutation | SNP | A | A | T | Valid |
|
| 12 | 2774755 | 1 | Silent | SNP | C | C | T | Valid |
| Synemin | 15 | 99672483 | 1 | Silent | SNP | A | A | G | Unknown |
|
| 15 | 99669768 | 1 | Silent | SNP | G | G | A | Unknown |
|
| 15 | 99671917 | 1 | Missense
mutation | SNP | G | G | C | Valid |
|
| 15 | 99672905 | 1 | Missense
mutation | SNP | C | C | G | Valid |
|
| 15 | 99653864 | 1 | Silent | SNP | C | C | T | Valid |
|
| 15 | 99672085 | 1 | Missense
mutation | SNP | G | G | T | Valid |
| Tektin 5 | 16 | 10721464 | −1 | Silent | SNP | G | G | A | Valid |
|
| 16 | 10721462 | −1 | Missense
mutation | SNP | G | G | A | Valid |
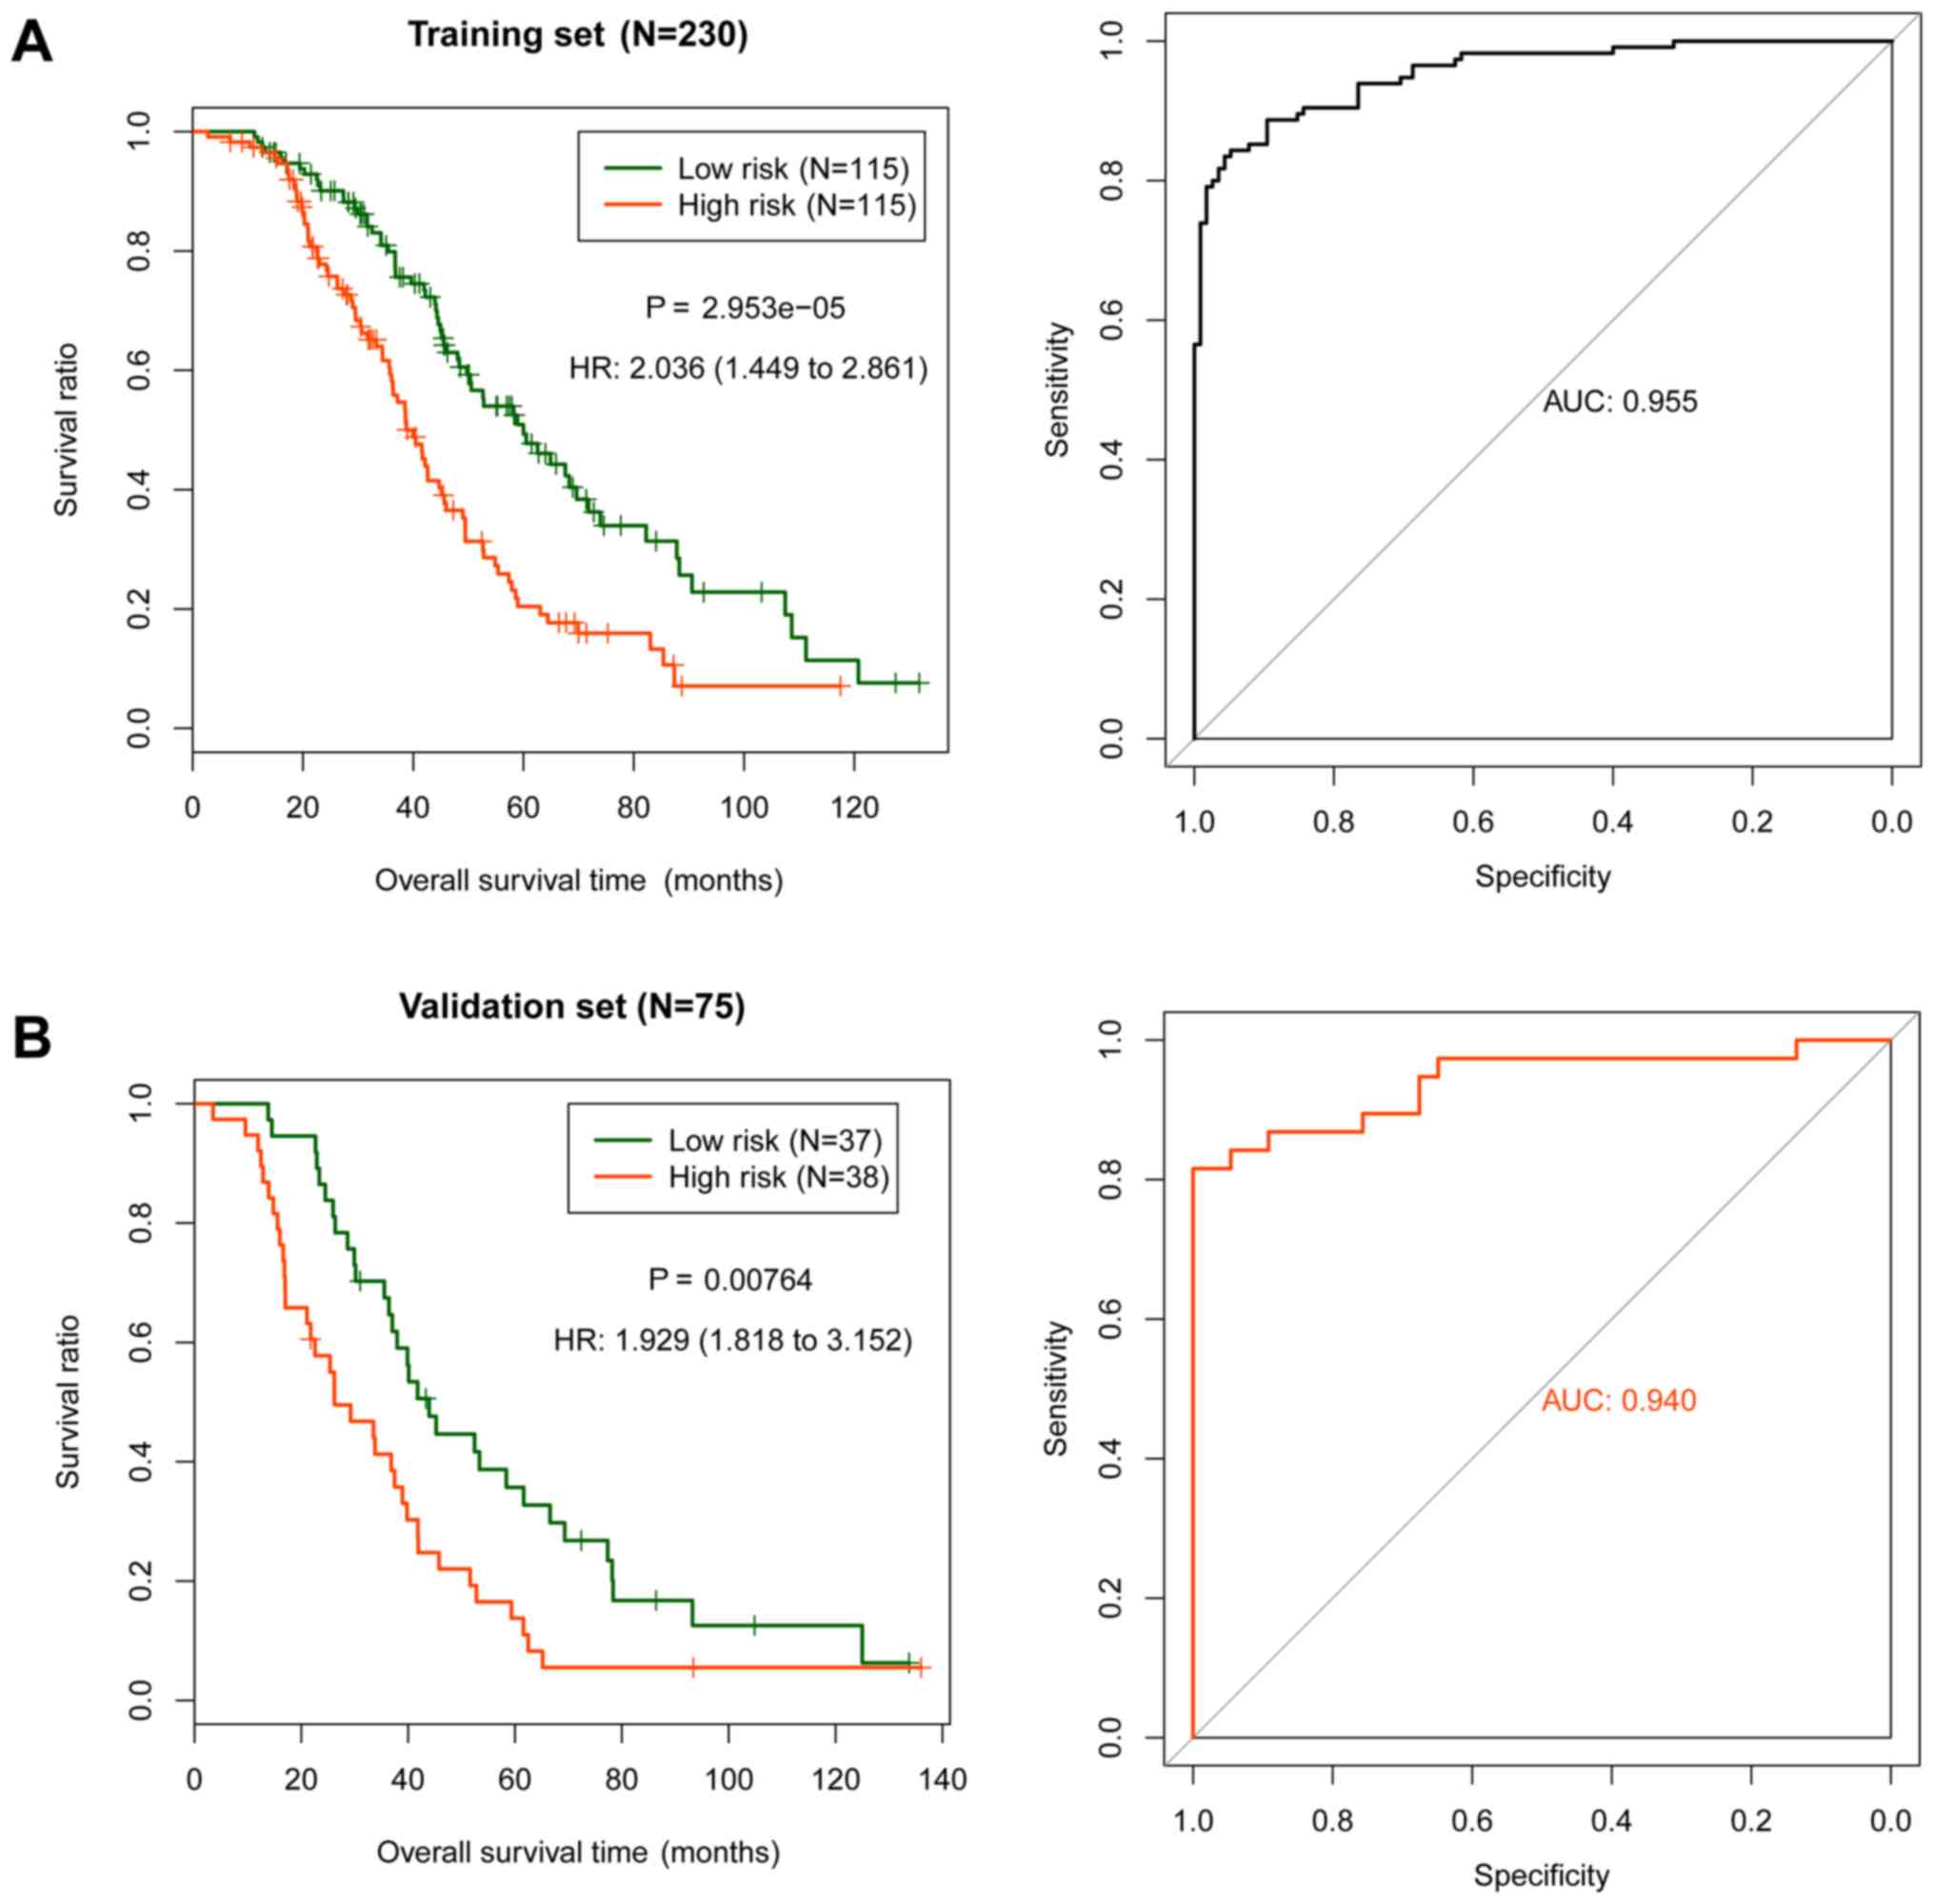
Construction and assessment of the
risk score system
Based on the multivariate Cox regression
coefficients of the six independent prognostic genes, the following
risk score system was developed (24,25):
Risk score=(1.113) × ExpTBXT + (−0.625) ×
ExpSYNM + (0.567) × ExpTEKT5 + (0.374) ×
ExpGDF3 + (0.652) × ExpSLC22A3 + (0.560) ×
ExpCACNA1C, where Exp is the relative expression level
of the genes. The risk scores of TCGA samples were calculated using
the above formula. The median was used as the cut-off point to
divide the samples in the training set into high and low risk
groups. The association between the risk groups and prognosis was
evaluated using the KM survival curve (Fig. 3A), and subsequently validated in the
validation set (Fig. 3B). The
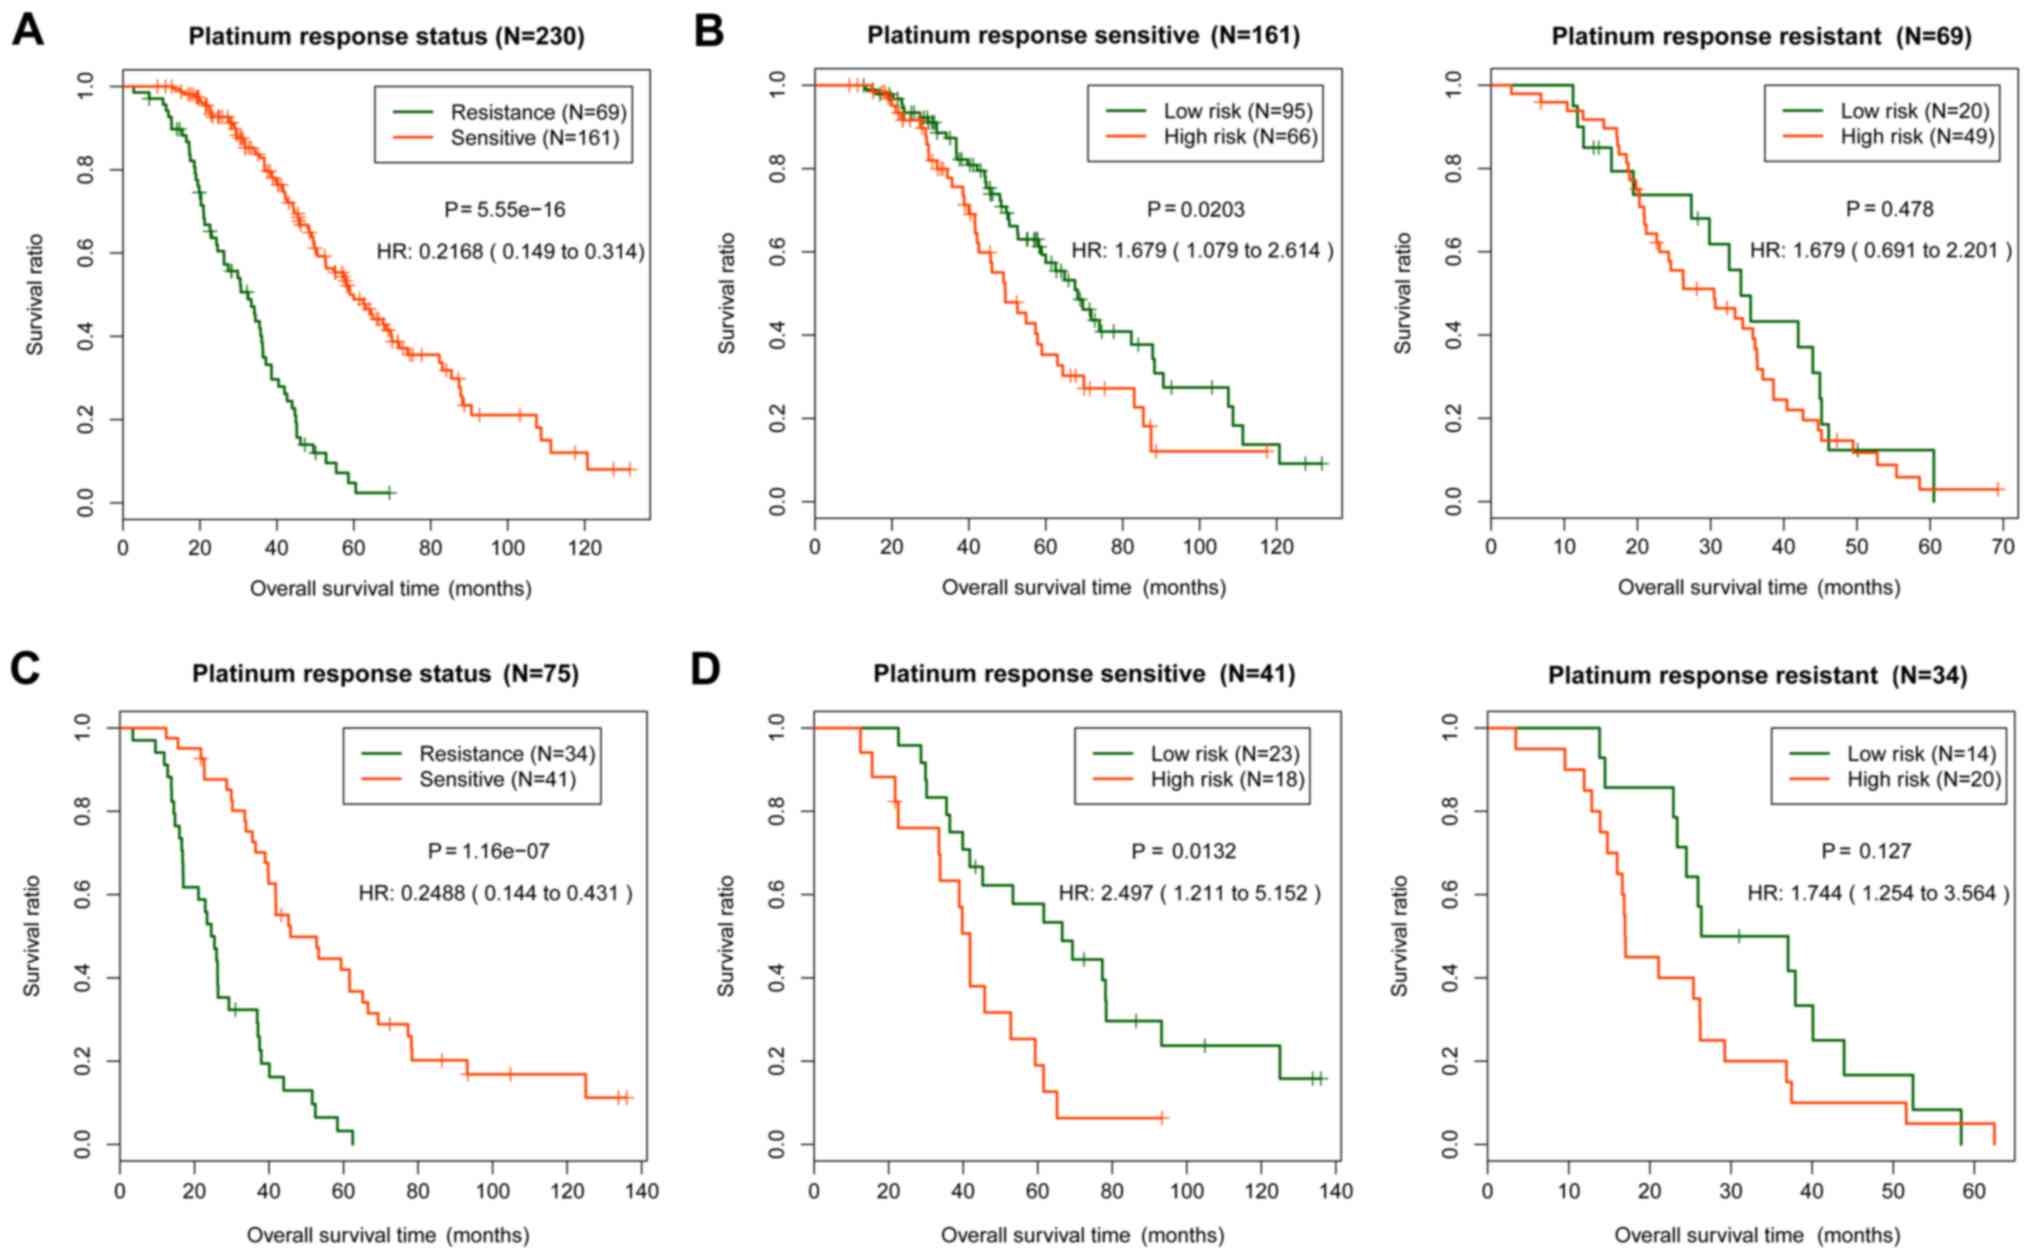
association between the predictive results of the risk score system
and platinum response status was further analyzed (Fig. 4). The platinum response status of the
samples in the training set (P=5.55×10⁻¹⁶; Fig. 4A) and the validation set
(P=1.16×10−07; Fig. 4C)
were significantly associated with the actual prognosis. In the
platinum sensitive samples, the predictive results of the training
set (P=0.0203; Fig. 4B) and the
validation set (P=0.0132; Fig. 4D)
were significantly associated with survival prognosis. In the
platinum resistant samples, the association between the predictive
results and prognosis was not significant (Fig. 4B and D). Therefore, the risk score
system could accurately predict the prognosis of the sensitive
samples.
The samples in the training dataset were divided
into high and low risk groups according to the median of the risk
scores. The association between clinical factors and prognosis was
determined. The platinum response status and predicted status based
on the risk scores had a significant association with prognosis
[platinum response status, P=1.05×10⁻¹²; hazard ratio
(HR)=0.246; predicted status, P=0.0298; HR=1.489], which suggested
that response to platinum treatment improves prognosis and patients
with platinum sensitivity may have an improved prognosis compared
with platinum-resistant patients (Table
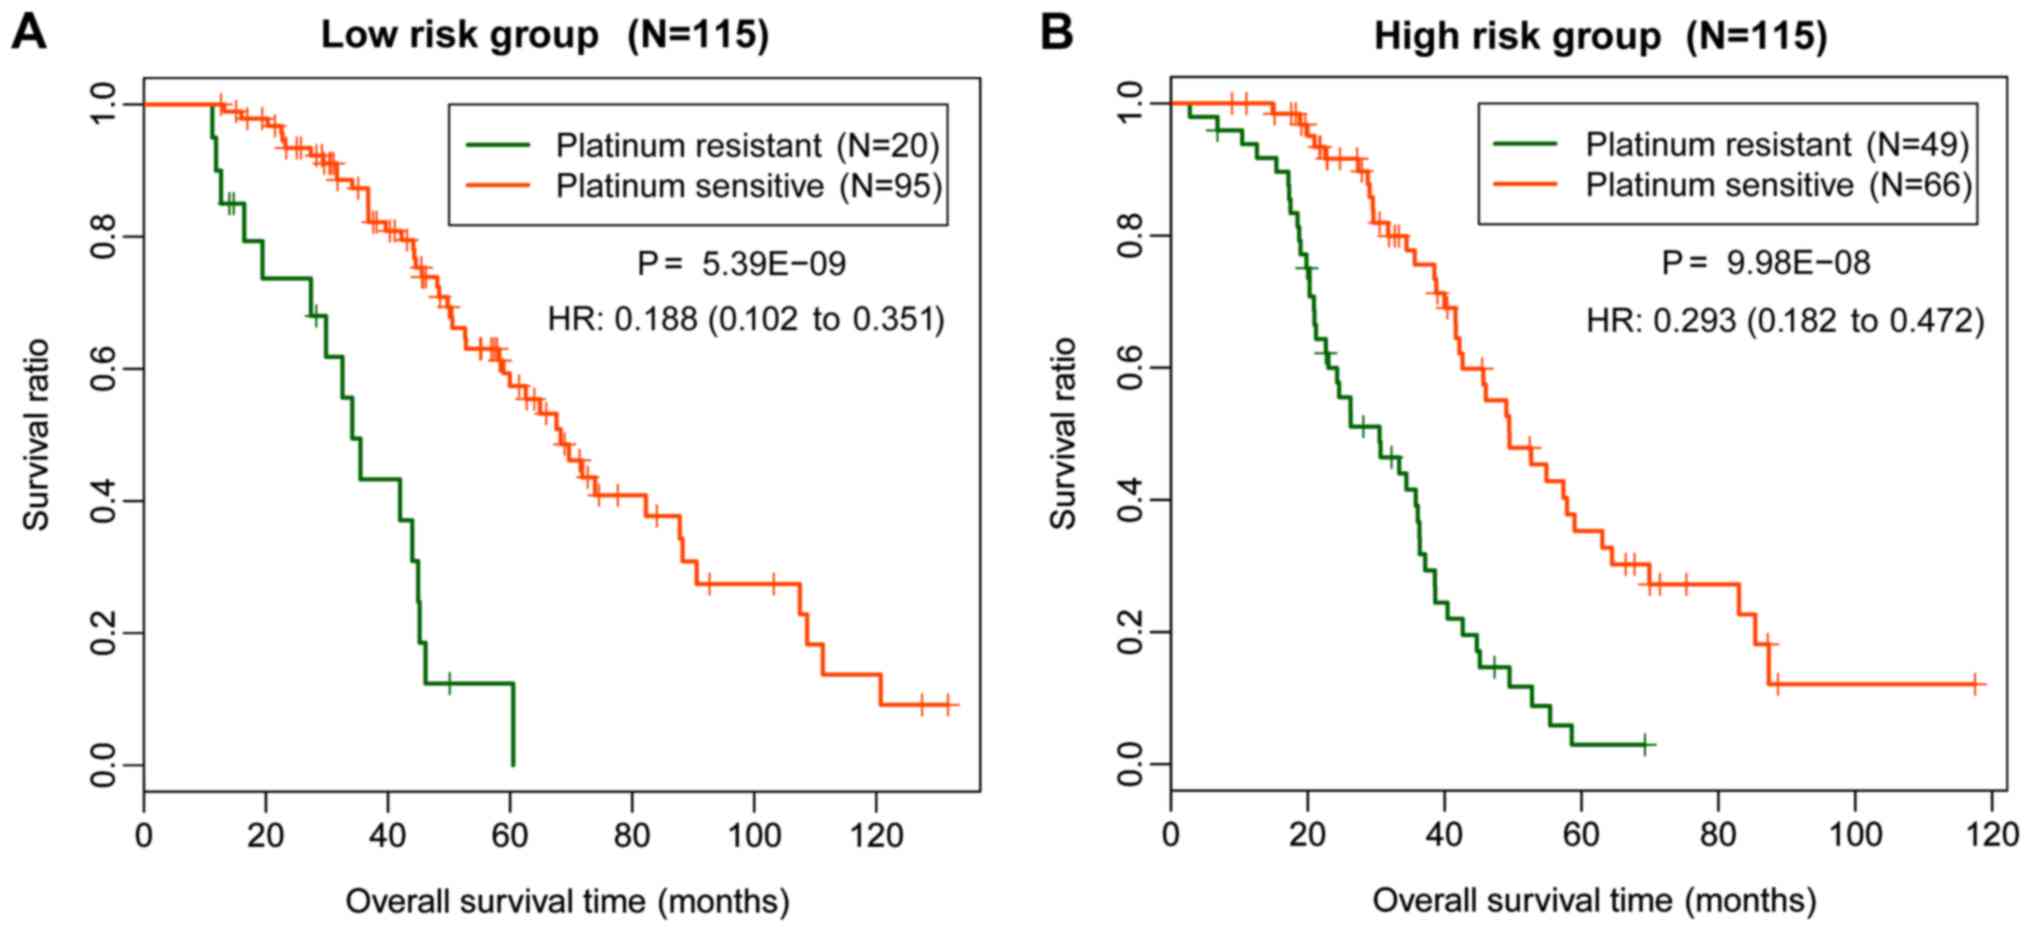
IV). Statistical analysis revealed that the platinum response
status was significantly associated with the prognosis of low
(P=5.39×10−09; Fig. 5A)
and high (P=9.98×10−08; Fig.
5B) risk groups (Table V). The
results obtained in the current study indicated that patients with
platinum sensitivity in the low and high risk groups had improved
survival prognosis compared with patients with platinum
resistance.
| Table IV.Results of the Cox regression
analysis for identification of the clinical factors significantly
associated with prognosis. |
Table IV.
Results of the Cox regression
analysis for identification of the clinical factors significantly
associated with prognosis.
|
| Univariate
analysis | Multivariate
analysis |
|---|
|
|
|
|
|---|
| Variable | HR | 95% CI | P-value | HR | 95% CI | P-value |
|---|
| Age | 1.008 | 0.993–1.024 | 0.2970 | – | – | – |
| Platinum response
status | 0.217 | 0.149–0.314 |
5.55×10⁻¹⁶ | 0.246 | 0.168–0.362 |
1.05×10⁻¹² |
| Neoplasm
subdivision | 0.844 | 0.632–1.127 | 0.2490 | – | – | – |
| Stage | 1.052 | 0.727–1.524 | 0.7870 | – | – | – |
| Lymphatic
invasion | 0.959 | 0.529–1.736 | 0.8890 | – | – | – |
| Histological
grade | 1.272 | 0.805–2.009 | 0.3020 | – | – | – |
| Recurrence | 0.695 | 0.352–1.372 | 0.2910 | – | – | – |
| Predicted
status | 2.036 | 1.449–2.861 |
2.95×10−05 | 1.489 | 1.039–2.132 | 0.0298 |
| Table V.Results of stratified analysis of
clinical factors in high and low risk groups. |
Table V.
Results of stratified analysis of
clinical factors in high and low risk groups.
| Variable | Low risk (n=115) HR
(95% CI) | P-value | High risk (n=115)
HR (95% CI) | P-value |
|---|
| Age | 0.996
(0.974–1.02) | 0.7900 | 1.016
(0.996–1.037) | 0.1180 |
| Platinum response
status | 0.188
(0.102–0.351) |
5.39×10−09 | 0.293
(0.182–0.472) |
9.98×10−08 |
| Neoplasm
subdivision | 0.692
(0.446–1.075) | 0.0984 | 1.227
(0.832–1.811) | 0.3001 |
| Pathological
Stage | 0.953
(0.562–1.615) | 0.8590 | 1.174
(0.668–2.062) | 0.5770 |
| Histological
grade | 1.569
(0.670–3.671) | 0.2950 | 1.312
(0.743–2.317) | 0.3480 |
| Recurrence | 1.412
(1.195–2.25) | 0.7310 | 0.757
(0.362–1.585) | 0.4590 |
Association between chemotherapy
response and prognosis
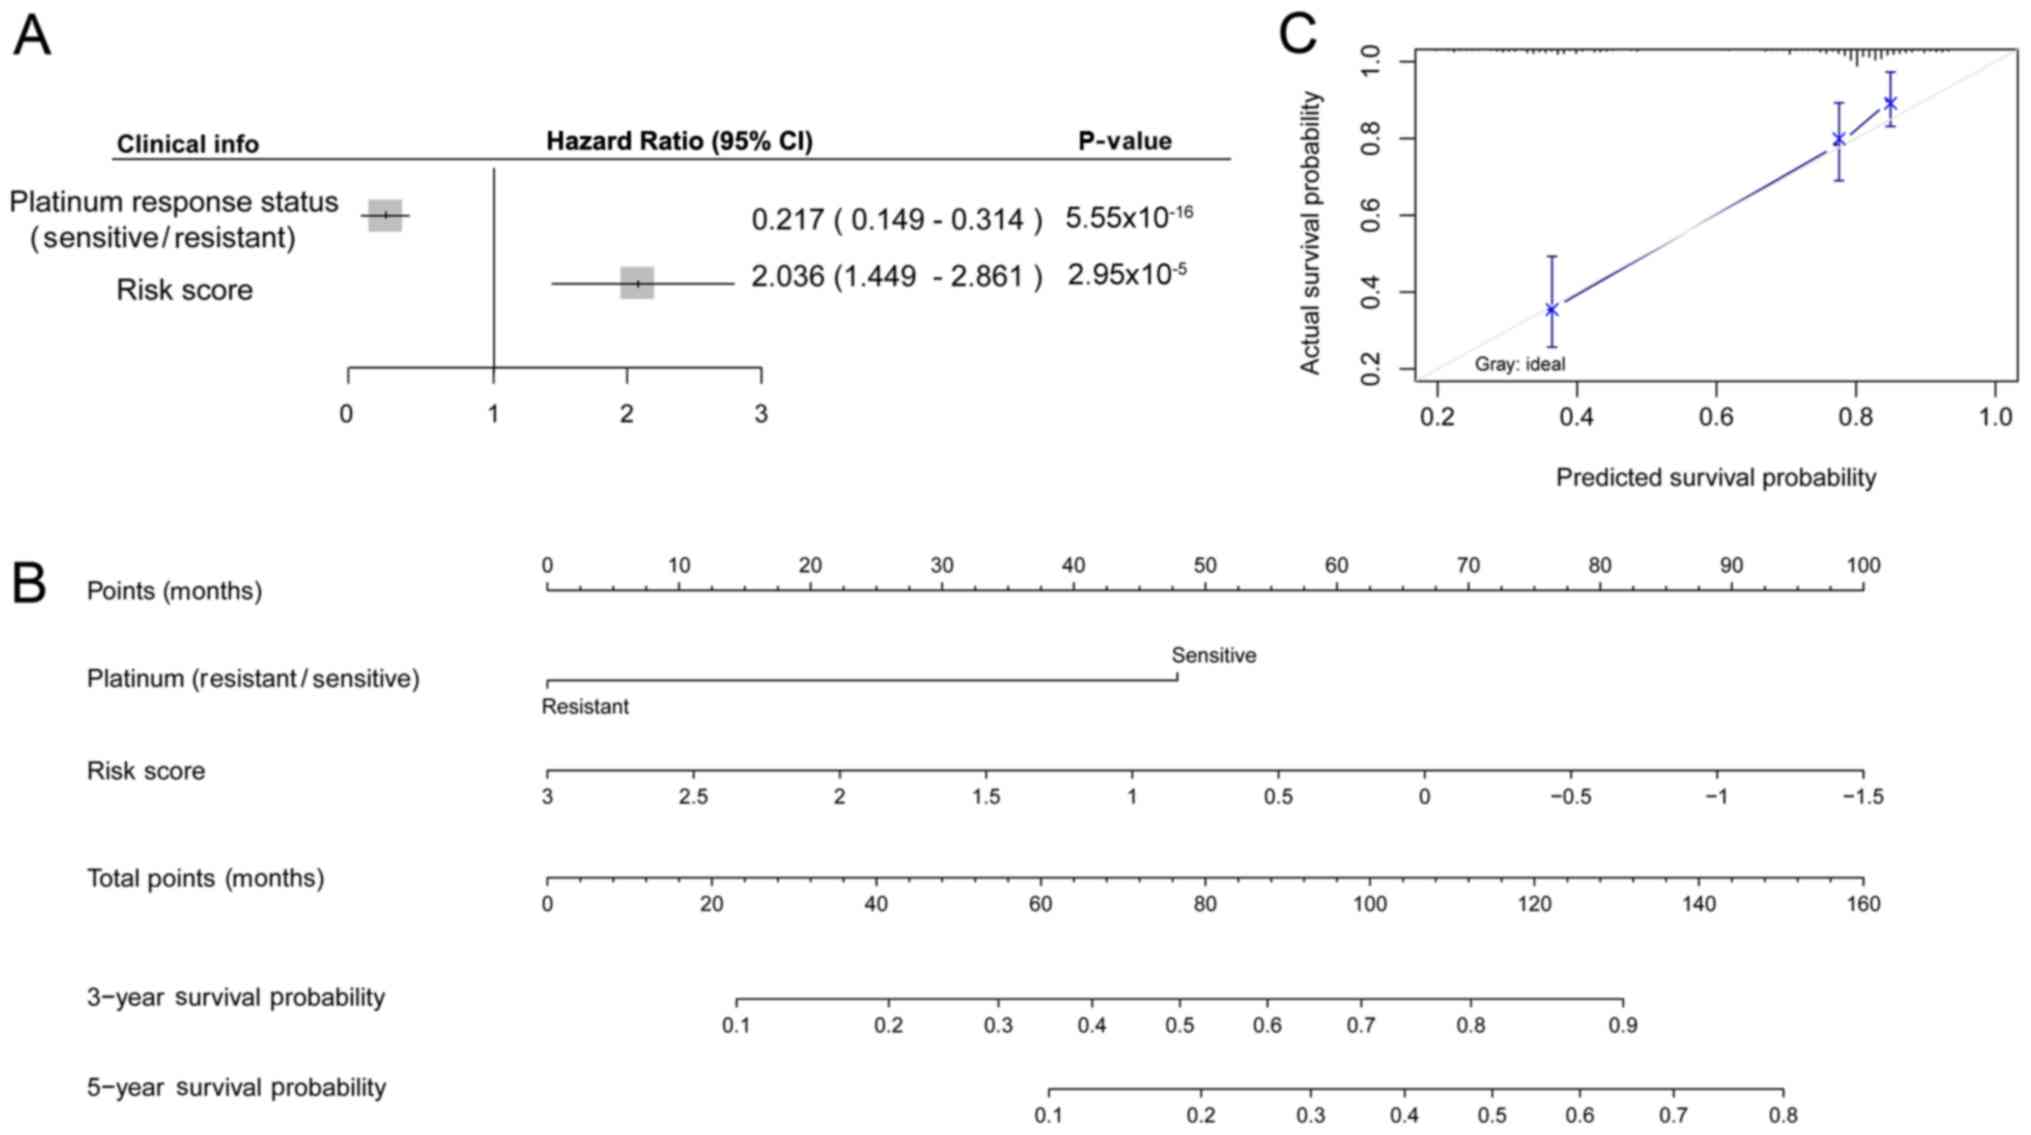
Cox regression analysis was performed for the
platinum response status and risk scores, revealing that the
sensitive status improved prognosis in OC (HR=0.217) and that the
risk score worsened the prognosis (the higher the risk score, the
worse the prognosis; Fig. 6A).
Subsequently, nomogram analysis was performed based on the platinum
response status and risk score. The platinum response status and
risk score were used as independent prognostic factors to predict
the 3-year survival probability and 5-year survival probability,
and the results demonstrated that patients with the sensitive
status and low risk scores had improved prognosis compared with
patients with platinum resistance and high risk scores (Fig. 6B). The calibration curve for the
predicted 5-year survival probability and the actual survival
probability revealed that the predicted curve and the ideal curve
were similar. The predicted results were therefore consistent with
the actual survival status according to the clinical information in
the dataset (Fig. 6C).
Differential expression and pathway
enrichment analyses
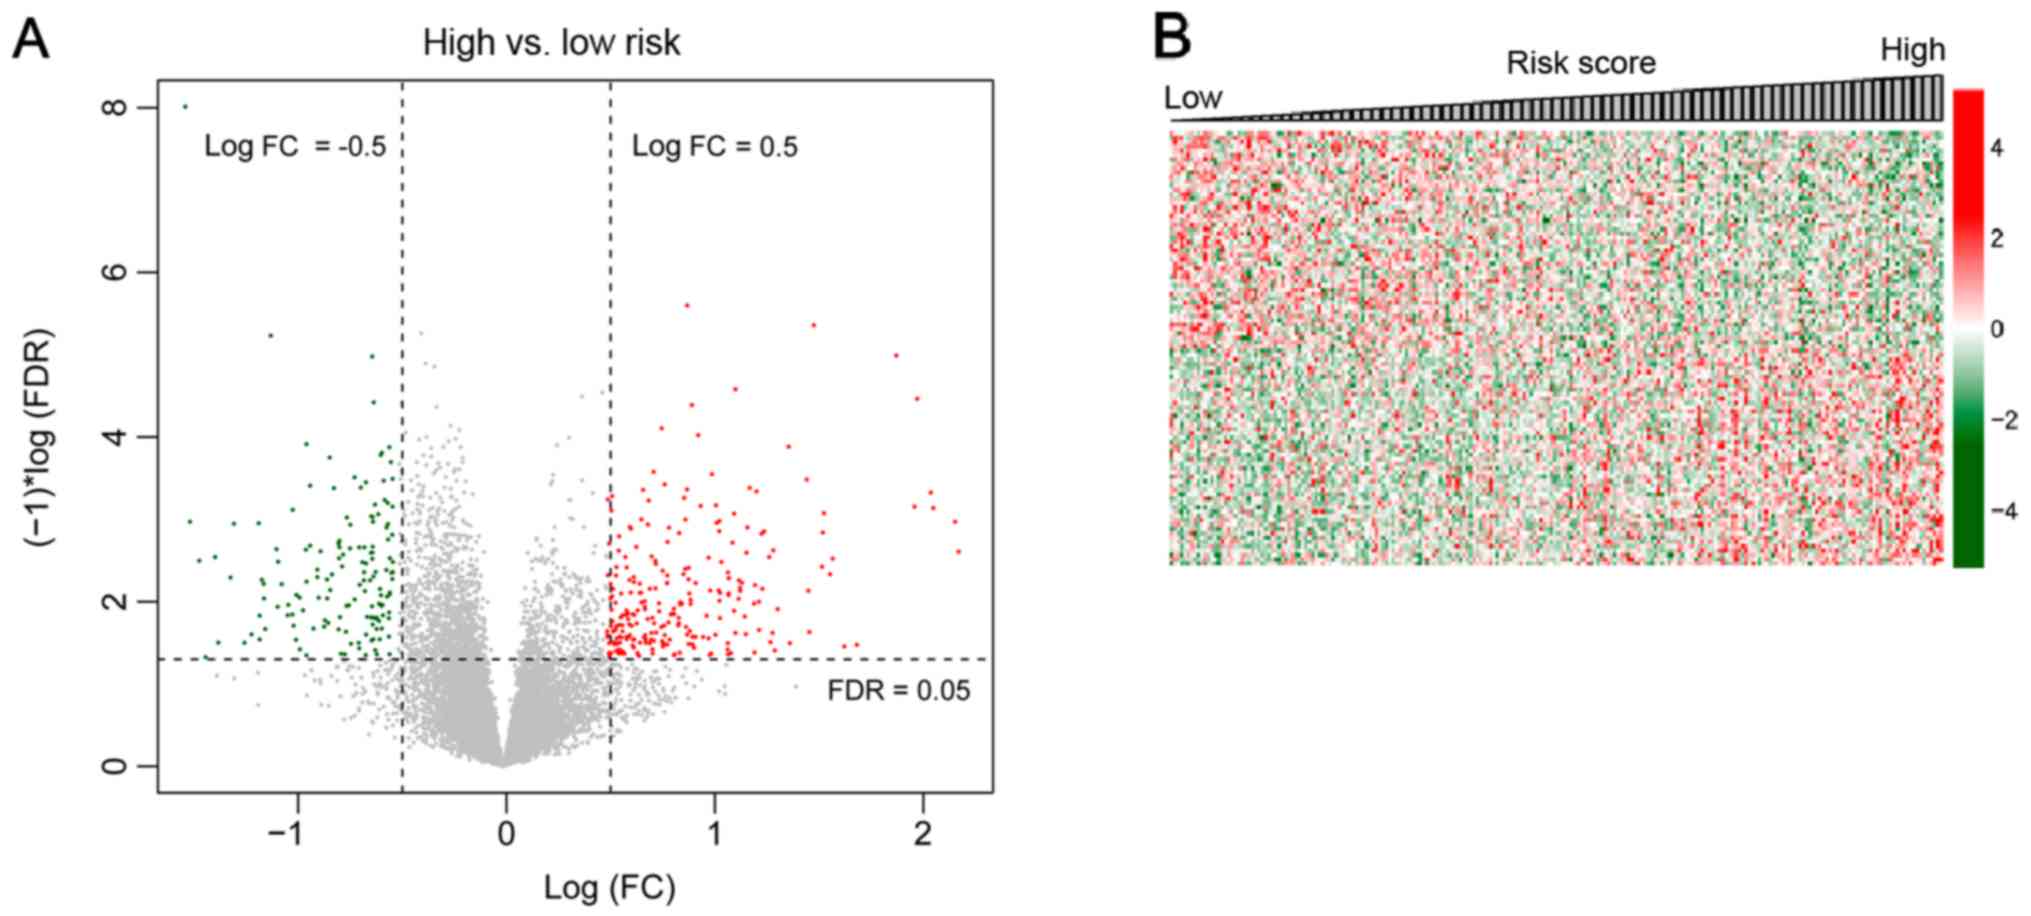
The OC samples in the TCGA set were divided into
high and low risk groups. A total of 574 DEGs (297 upregulated and
277 downregulated) were identified in the high and low risk groups.
The volcano plot of the 574 DEGs is presented in Fig. 7A. The correlation coefficient of DEGs
and risk scores of samples were calculated using Cor function in R.
The top 100 DEGs (the top 50 for positive and negative association,
respectively) were selected for analysis based on the association
of the DEGs with the risk scores. The expression heatmap is
presented in Fig. 7B. Pathway
enrichment analysis revealed that DEGs were significantly enriched
in eight pathways, including chemokine signaling pathway, toll-like
receptor signaling pathway, cytokine-cytokine receptor interaction,
RIG I-like receptor signaling pathway, natural killer cell-mediated
cytotoxicity, apoptosis, T cell receptor signaling pathway and Fc ε
receptor 1 signaling pathway (Table
VI).
| Table VI.Eight significantly enriched pathways
between high and low risk groups. |
Table VI.
Eight significantly enriched pathways
between high and low risk groups.
| Name | ES | NES | NOM P-value |
|---|
| Chemokine signaling
pathway | −0.71585 | −2.25369 | <0.001 |
| Toll-like receptor
signaling pathway | −0.76181 | −2.08654 | <0.001 |
| Cytokine-cytokine
receptor interaction | −0.51545 | −1.92261 | 0.0061 |
| RIG I-like receptor
signaling pathway | −0.77359 | −1.89329 | 0.0085 |
| Natural killer cell
mediated cytotoxicity | −0.59467 | −1.78868 | 0.0143 |
| Apoptosis | −0.63801 | −1.69221 | 0.0178 |
| T cell receptor
signaling pathway | −0.72389 | −1.65438 | 0.0242 |
| Fc ε receptor 1
signaling pathway | −0.68246 | −1.54939 | 0.0391 |
Discussion
In the present study, 1,144 DEGs and 1,864 DECNs in
platinum resistant samples and platinum sensitive samples were
screened. A total of 108 overlapping genes between the DEGs and
DECNs were identified, from which 48 genes with CNVs were selected
for subsequent analyses. There were 20 genes significantly
associated with prognosis in the expression level and CN signal
level, from which six independent prognostic genes (T, SYNM,
TEKT5, GDF3, SLC22A3 and CACNA1C) were selected. The
platinum response status had a significant association with
prognosis and platinum sensitivity resulted in improved prognosis.
Subsequently, a risk score system based on the six independent
prognostic factors was constructed and evaluated. Nomogram analysis
indicated that patients with sensitive status and low risk scores
had improved prognosis compared with patients with a resistant
status and high risk scores. A total of 574 DEGs were identified in
high and low risk groups, and these genes were enriched in eight
pathways.
The Tektin (TEKT) family consists of several
filament-forming proteins in male germ cells, including TEKT1,
TEKT2, TEKT3, TEKT4 and TEKT5 (30). TEKT5 was reported to be a
cancer/testis antigen, suggesting that TEKT5 may be used for
the diagnosis and immunotherapy of patients with testicular cancer
(31). SYNM is a potential
tumor suppressor gene in breast cancer, and its promoter
methylation status may be used to predict the risk of recurrence in
patients with breast cancer (32).
SYNM is an intermediate filament-associated protein that may
function in the formation of hepatocellular carcinoma, and its
alteration may result in the pleomorphism of tumor cells (33). Since TEKT5 and SYNM
were revealed to be involved in the pathogenesis of different types
of cancer in the aforementioned studies, they may also be
implicated in the pathogenesis of OC.
The plasma concentration of GDF15 is
increased in OC, and increased plasma concentration is negatively
associated with survival time and is an independent prognostic
predictor (34,35). GDF15 upregulation contributes
to the growth and invasion of rapamycin-sensitive OC cells;
therefore, rapamycin inhibition may be effective for treating
patients with GDF15-overexpressing OC (36). GDF3 is a member of the
transforming growth factor β family and is expressed in several
types of tumors (37). GDF3
blocking combined with retinoic acid may be a promising therapeutic
strategy for different types of solid cancer (37). GDF3 is markedly downregulated
in breast cancer tissues, and its reconstitution may be a applied
for inhibiting the aggressive growth of the tumor (38). Therefore, upregulation of GDF3
may also be associated with the poor prognosis of patients with
OC.
SLC22A16 is expressed in ovarian clear-cell
adenocarcinoma and it can promote the uptake of doxorubicin
compounds directed against the cancer cells (39,40).
SLC22A3 affects the absorption of numerous basic drugs and
endogenous amines in multiple tissues (41). SLC22A3 is downregulated in
aggressive prostate cancer and is a key risk factor for the disease
(41). SLC22A3 is essential
for the cytotoxicity induced by oxaliplatin as it facilitates its
uptake into tumors (42).
SLC22A3 expression may therefore serve as a marker for the
efficacy of chemotherapy in different types of cancer (42). The results obtained in the
aforementioned studies suggest that SLC22A3 may affect the
efficacy of chemotherapy in patients with OC.
A limitation of the current study was a lack of
experimental validation (43,44).
Although bioinformatics reveals genes and pathways involved in
platinum-based chemotherapy for ovarian cancer, future experiments
are required to verify these results.
In conclusion, a six-mRNA risk score system was
constructed to predict the prognosis of patients with OC. The risk
score system-based nomogram may be applied for identifying patients
with OC who will benefit from platinum chemotherapy.
Acknowledgements
Not applicable.
Funding
No funding was received.
Availability of data and materials
The datasets used during the current study are
available from the corresponding author on reasonable request.
Authors' contributions
QW performed data analysis and wrote the manuscript.
ZL, JM, QZ, NW, LQ, JZ and CC substantially contributed to data
analysis and manuscript revision. BL conceived and designed the
study. All authors read and approved the final manuscript.
Ethics approval and consent to
participate
Not applicable.
Patient consent for publication
Not applicable.
Competing interests
The authors declare that they have no competing
interests.
References
|
1
|
Jayson GC, Kohn EC, Kitchener HC and
Ledermann JA: Ovarian cancer. Lancet. 384:1376–1388. 2014.
View Article : Google Scholar : PubMed/NCBI
|
|
2
|
Cree IA: Cancer biology. Methods Mol Biol.
731:1–11. 2011. View Article : Google Scholar : PubMed/NCBI
|
|
3
|
Ebell MH, Culp MB and Radke TJ: A
systematic review of symptoms for the diagnosis of ovarian cancer.
Am J Prev Med. 50:384–394. 2016. View Article : Google Scholar : PubMed/NCBI
|
|
4
|
Mozzetti S, Ferlini C, Concolino P,
Filippetti F, Raspaglio G, Prislei S, Gallo D, Martinelli E,
Ranelletti FO, Ferrandina G and Scambia G: Class III β-Tubulin
overexpression is a prominent mechanism of paclitaxel resistance in
ovarian cancer patients. Clin Cancer Res. 11:298–305.
2005.PubMed/NCBI
|
|
5
|
GBD 2015 Mortality and Causes of Death
Collaborators: Global, regional, and national life expectancy,
all-cause mortality, and cause-specific mortality for 249 causes of
death, 1980–2015: A systematic analysis for the global burden of
disease study 2015. Lancet. 388:1459–1544. 2016. View Article : Google Scholar : PubMed/NCBI
|
|
6
|
McGuire S: World Cancer Report 2014.
Geneva, Switzerland: World Health Organization, International
Agency for Research on Cancer, WHO Press, 2015. Adv Nutr.
7:418–419. 2016. View Article : Google Scholar : PubMed/NCBI
|
|
7
|
Mei L, Hu Q, Peng J, Ruan J, Zou J, Huang
Q, Liu S and Wang H: Phospho-histone H2AX is a diagnostic and
prognostic marker for epithelial ovarian cancer. Int J Clin Exp
Pathol. 8:5597–5602. 2015.PubMed/NCBI
|
|
8
|
Yamamoto S, Tsuda H, Honda K, Onozato K,
Takano M, Tamai S, Imoto I, Inazawa J, Yamada T and Matsubara O:
Actinin-4 gene amplification in ovarian cancer: A candidate
oncogene associated with poor patient prognosis and tumor
chemoresistance. Mod Pathol. 22:499–507. 2009. View Article : Google Scholar : PubMed/NCBI
|
|
9
|
Walsh CS, Ogawa S, Karahashi H, Scoles DR,
Pavelka JC, Tran H, Miller CW, Kawamata N, Ginther C, Dering J, et
al: ERCC5 is a novel biomarker of ovarian cancer prognosis. J Clin
Oncol. 26:2952–2958. 2008. View Article : Google Scholar : PubMed/NCBI
|
|
10
|
Hashimoto T, Yanaihara N, Okamoto A,
Nikaido T, Saito M, Takakura S, Yasuda M, Sasaki H, Ochiai K and
Tanaka T: Cyclin D1 predicts the prognosis of advanced serous
ovarian cancer. Exp Ther Med. 2:213–219. 2011. View Article : Google Scholar : PubMed/NCBI
|
|
11
|
Dai J, Wei RJ, Li R, Feng JB, Yu YL and
Liu PS: A study of CCND1 with epithelial ovarian cancer cell
proliferation and apoptosis. Eur Rev Med Pharmacol Sci.
20:4230–4235. 2016.PubMed/NCBI
|
|
12
|
Ge L, Li N, Liu M, Xu NZ, Wang MR and Wu
LY: Copy number variations of neurotrophic tyrosine receptor kinase
3 (NTRK3) may predict prognosis of ovarian cancer. Medicine
(Baltimore). 96:e76212017. View Article : Google Scholar : PubMed/NCBI
|
|
13
|
Ayhan A, Kuhn E, Wu RC, Ogawa H,
Bahadirli-Talbott A, Mao TL, Sugimura H, Shih IM and Wang TL: CCNE1
copy-number gain and overexpression identify ovarian clear cell
carcinoma with a poor prognosis. Mod Pathol. 30:297–303. 2017.
View Article : Google Scholar : PubMed/NCBI
|
|
14
|
Gonzalez VM, Fuertes MA, Alonso C and
Perez JM: Is cisplatin-induced cell death always produced by
apoptosis? Mol Pharmacol. 59:657–663. 2001. View Article : Google Scholar : PubMed/NCBI
|
|
15
|
Yakirevich E, Sabo E, Naroditsky I, Sova
Y, Lavie O and Resnick MB: Multidrug resistance-related phenotype
and apoptosis-related protein expression in ovarian serous
carcinomas. Gynecol Oncol. 100:152–159. 2006. View Article : Google Scholar : PubMed/NCBI
|
|
16
|
Norouzi-Barough L, Sarookhani MR, Sharifi
M, Moghbelinejad S, Jangjoo S and Salehi R: Molecular mechanisms of
drug resistance in ovarian cancer. J Cell Physiol. 233:4546–4562.
2018. View Article : Google Scholar : PubMed/NCBI
|
|
17
|
Lisowska KM, Olbryt M, Dudaladava V,
Pamuła-Piłat J, Kujawa K, Grzybowska E, Jarząb M, Student S,
Rzepecka IK, Jarząb B and Kupryjańczyk J: Gene expression analysis
in ovarian cancer-faults and hints from DNA microarray study. Front
Oncol. 4:62014. View Article : Google Scholar : PubMed/NCBI
|
|
18
|
Bolstad BM, Irizarry RA, Astrand M and
Speed TP: A comparison of normalization methods for high density
oligonucleotide array data based on variance and bias.
Bioinformatics. 19:185–193. 2003. View Article : Google Scholar : PubMed/NCBI
|
|
19
|
Greenman CD, Bignell G, Butler A, Edkins
S, Hinton J, Beare D, Swamy S, Santarius T, Chen L, Widaa S, et al:
PICNIC: An algorithm to predict absolute allelic copy number
variation with microarray cancer data. Biostatistics. 11:164–175.
2010. View Article : Google Scholar : PubMed/NCBI
|
|
20
|
Harrow J, Frankish A, Gonzalez JM,
Tapanari E, Diekhans M, Kokocinski F, Aken BL, Barrell D, Zadissa
A, Searle S, et al: GENCODE: The reference human genome annotation
for The ENCODE Project. Genome Res. 22:1760–1774. 2012. View Article : Google Scholar : PubMed/NCBI
|
|
21
|
Parrish RS and Spencer HJ III: Effect of
normalization on significance testing for oligonucleotide
microarrays. J Biopharm Stat. 14:575–589. 2004. View Article : Google Scholar : PubMed/NCBI
|
|
22
|
Ritchie ME, Phipson B, Wu D, Hu Y, Law CW,
Shi W and Smyth GK: Limma powers differential expression analyses
for RNA-sequencing and microarray studies. Nucleic Acids Res.
43:e472015. View Article : Google Scholar : PubMed/NCBI
|
|
23
|
Wang P, Wang Y, Hang B, Zou X and Mao JH:
A novel gene expression-based prognostic scoring system to predict
survival in gastric cancer. Oncotarget. 7:55343–55351.
2016.PubMed/NCBI
|
|
24
|
Bao Z, Zhang W and Dong D: A potential
prognostic lncRNA signature for predicting survival in patients
with bladder urothelial carcinoma. Oncotarget. 8:10485–10497. 2017.
View Article : Google Scholar : PubMed/NCBI
|
|
25
|
Zeng JH, Liang L, He RQ, Tang RX, Cai XY,
Chen JQ, Luo DZ and Chen G: Comprehensive investigation of a novel
differentially expressed lncRNA expression profile signature to
assess the survival of patients with colorectal adenocarcinoma.
Oncotarget. 8:16811–16828. 2017.PubMed/NCBI
|
|
26
|
Jager KJ, van Dijk PC, Zoccali C and
Dekker FW: The analysis of survival data: The Kaplan-Meier method.
Kidney Int. 74:560–565. 2008. View Article : Google Scholar : PubMed/NCBI
|
|
27
|
Eng KH, Schiller E and Morrell K: On
representing the prognostic value of continuous gene expression
biomarkers with the restricted mean survival curve. Oncotarget.
6:36308–36318. 2015. View Article : Google Scholar : PubMed/NCBI
|
|
28
|
Smyth GK: Limma: Linear models for
microarray data. Bioinformatics and Computational Biology Solutions
Using R and Bioconductor. Gentleman R, Carey V, Dudoit S, Irizarry
R and Huber W: Springer; New York, NY: pp. 397–420. 2005,
View Article : Google Scholar
|
|
29
|
Ackermann M and Strimmer K: A general
modular framework for gene set enrichment analysis. BMC
Bioinformatics. 10:472009. View Article : Google Scholar : PubMed/NCBI
|
|
30
|
Amos LA: The tektin family of
microtubule-stabilizing proteins. Genome Biol. 9:2292008.
View Article : Google Scholar : PubMed/NCBI
|
|
31
|
Hanafusa T, Mohamed AE, Domae S, Nakayama
E and Ono T: Serological identification of Tektin5 as a
cancer/testis antigen and its immunogenicity. BMC Cancer.
12:5202012. View Article : Google Scholar : PubMed/NCBI
|
|
32
|
Noetzel E, Rose M, Sevinc E, Hilgers RD,
Hartmann A, Naami A, Knüchel R and Dahl E: Intermediate filament
dynamics and breast cancer: Aberrant promoter methylation of the
Synemin gene is associated with early tumor relapse. Oncogene.
29:4814–4825. 2010. View Article : Google Scholar : PubMed/NCBI
|
|
33
|
Ho CC, Ho HC, Liu YH, Pei RJ, Cheng CC,
Lee KY, Yeh KT and Lai YS: Altered synemin could affect the
organization of intermediate filament in human hepatocellular
carcinoma. J Med. 35:171–180. 2004.PubMed/NCBI
|
|
34
|
Staff AC, Bock AJ, Becker C, Kempf T,
Wollert KC and Davidson B: Growth differentiation factor-15 as a
prognostic biomarker in ovarian cancer. Gynecol Oncol. 118:237–243.
2010. View Article : Google Scholar : PubMed/NCBI
|
|
35
|
Bock AJ, Stavnes HT, Kempf T, Tropè CG,
Berner A, Davidson B and Staff AC: Expression and clinical role of
growth differentiation factor-15 in ovarian carcinoma effusions.
Int J Gynecol Cancer. 20:1448–1455. 2010.PubMed/NCBI
|
|
36
|
Griner SE, Joshi JP and Nahta R: Growth
differentiation factor 15 stimulates rapamycin-sensitive ovarian
cancer cell growth and invasion. Biochem Pharmacol. 85:46–58. 2013.
View Article : Google Scholar : PubMed/NCBI
|
|
37
|
Tykwinska K, Lauster R, Knaus P and
Rosowski M: Growth and differentiation factor 3 induces expression
of genes related to differentiation in a model of cancer stem cells
and protects them from retinoic acid-induced apoptosis. PLoS One.
8:e706122013. View Article : Google Scholar : PubMed/NCBI
|
|
38
|
Li Q, Ling Y and Yu L: GDF3 inhibits the
growth of breast cancer cells and promotes the apoptosis induced by
Taxol. J Cancer Res Clin Oncol. 138:1073–1079. 2012. View Article : Google Scholar : PubMed/NCBI
|
|
39
|
Ota K, Ito K, Akahira J, Sato N, Onogawa
T, Moriya T, Unno M, Abe T, Niikura H, Takano T and Yaegashi N:
Expression of organic cation transporter SLC22A16 in human
epithelial ovarian cancer: A possible role of the adriamycin
importer. Int J Gynecol Pathol. 26:334–340. 2007. View Article : Google Scholar : PubMed/NCBI
|
|
40
|
Ota K, Akahira JI, Sato N, Moriya T, Unno
M, Abe T, Ito K and Yaegashi N: Expression of the organic cation
transporter SLC22A16 can be a feature of human epithelial ovarian
cancers with different histological type. J Clin Oncol.
23:51312005. View Article : Google Scholar
|
|
41
|
Chen L, Hong C, Chen EC, Yee SW, Xu L,
Almof EU, Wen C, Fujii K, Johns SJ, Stryke D, et al: Genetic and
epigenetic regulation of the organic cation transporter 3, SLC22A3.
Pharmacogenomics J. 13:110–120. 2013. View Article : Google Scholar : PubMed/NCBI
|
|
42
|
Yokoo S, Masuda S, Yonezawa A, Terada T,
Katsura T and Inui K: Significance of organic cation transporter 3
(SLC22A3) expression for the cytotoxic effect of oxaliplatin in
colorectal cancer. Drug Metab Dispos. 36:2299–2306. 2008.
View Article : Google Scholar : PubMed/NCBI
|
|
43
|
Tan DS, Rothermundt C, Thomas K, Bancroft
E, Eeles R, Shanley S, Ardern-Jones A, Norman A, Kaye SB and Gore
ME: ‘BRCAness’ syndrome in ovarian cancer: A case-control study
describing the clinical features and outcome of patients with
epithelial ovarian cancer associated with BRCA1 and BRCA2
mutations. J Clin Oncol. 26:5530–5536. 2008. View Article : Google Scholar : PubMed/NCBI
|
|
44
|
Gallagher DJ, Konner JA, Bell-McGuinn KM,
Bhatia J, Sabbatini P, Aghajanian CA, Offit K, Barakat RR, Spriggs
DR and Kauff ND: Survival in epithelial ovarian cancer: A
multivariate analysis incorporating BRCA mutation status and
platinum sensitivity. Ann Oncol. 22:1127–1132. 2011. View Article : Google Scholar : PubMed/NCBI
|