Introduction
Gastric cancer is the fourth most frequent
malignancy and the second most frequent cause of cancer-associated
mortality worldwide (1). Although
curative resection offers the best prognosis, a substantial number
of patients experience recurrence or metastasis even after R0
resection due to micrometastasis (2). Adjuvant chemotherapy after curative
gastrectomy reportedly increases survival and controlled
micrometastasis (3).
Immunotherapies, such as immune-checkpoint inhibitors, are emerging
alternatives for controlling cancer micrometastasis and improving
the prognosis of patients with malignancies (4–7).
Tumor-infiltrating immune cells are found in various
malignancies; therefore, immunological markers may be predictive of
the prognosis of patients with cancer (8–10). T
cells are involved in the recruitment and activation of effector
cells and amplification of the specific immune response to
pathogens and cancer cells (11).
Cancer cells express tumor antigens, which makes them susceptible
to recognition and lysis by T cells (12). Programmed death-1 (PD-1) is an
immunoinhibitory receptor expressed by chronically stimulated
CD4+ and CD8+ T cells after activation
(13,14). The interaction between PD-1 and its
ligand, PD-1 ligand-1 (PD-L1), contributes to the maintenance of
peripheral tolerance to self-antigens in normal hosts (15). PD-L1 is expressed by various solid
tumors, such as renal cell carcinoma, breast cancer, pancreatic
cancer, colorectal cancer, and esophageal cancer and is associated
with a diminished antitumor T cell response (4,6,16) In addition, PD-L1 expression is
associated with a poor prognosis in patients with various solid
malignancies, such as esophageal cancer, pancreatic cancer, and
gastric carcinoma (7,17,18).
Despite the expression of tumor rejection antigens and
tumor-specific cytotoxic T cells, the immune system fails to mount
a response against gastric cancer; however, the mechanisms
underlying this immune evasion are unclear (19).
In the present study, an immunohistochemical
analysis of PD-1 and PD-L1 was conducted using gastric cancer
tissue microarrays (TMAs) and PD-1 and PD-L1 expression in T cells
in gastric cancer was evaluated. The association among expression
levels of PD-1 and PD-L1, clinicopathological factors and survival
were also analyzed.
Patients and methods
Patients
Between January 2004 and December 2012, 170 patients
who were diagnosed with gastric adenocarcinoma and received
gastrectomy at St. Vincent's Hospital, The Catholic University of
Korea (Suwon, Republic of Korea), were retrospectively analyzed.
Patients with a history of other malignancies or recurrent tumors
were excluded. In total, 170 formalin-fixed paraffin-embedded
gastric adenocarcinoma tissue samples isolated from patients who
underwent surgical treatment at St. Vincent's Hospital, The
Catholic University of Korea between January 2004 and December 2012
were analyzed in the present study. The study protocol was approved
by the Institutional Review Board at St. Vincent's Hospital, The
Catholic University of Korea (Suwon, Republic of Korea). Clinical
data, including age, sex, overall survival (OS) time, metastasis
and recurrence, were obtained through medical chart reviews.
Pathological data, including Tumor-Node-Metastasis (TNM) stage
(20), histologic type according to
Lauren classification (20), and
presence of perivascular invasion were evaluated by
immunohistochemistry. The surgical treatment comprised of gastric
resection, according to the localization of the primary tumor, and
lymph node dissection, in line with the recommendations of the
Japanese Research Society for Gastric Cancer (21). All tissues were examined by a
pathologist and were classified in accordance with the guidelines
of the Japanese Classification of Gastric Carcinoma (20).
For flow cytometry, an additional 30 gastric cancer
tissue samples from another sample of patients were obtained from
resected specimens between January and March 2017. This sample of
patients included 19 men and 11 women, and the mean age was 64
years (range, 40–84 years). Peripheral blood (~30 ml) was collected
from patients prior to surgery. The gastric tumor samples were
freshly frozen in liquid nitrogen immediately after surgical
resection. The blood and the tumor samples were kept at −70°C until
flow cytometry was performed. The study protocol was approved by
the Institutional Review Board at St. Vincent's Hospital, The
Catholic University of Korea (Suwon, Republic of Korea). Patients
whose tissues were used for flow cytometry provided written
informed consent. The follow-up program consisted of computed
tomography scans, endoscopic examination, blood tests and chest
radiography at 6-month intervals. OS was defined as the time
between the date of diagnosis and the mortality date from any cause
or the date of the last follow-up visit. Patients deceased due to
surgical treatments or other causes were excluded from the present
study. Disease-free survival (DFS) was defined as the time from
tumor resection to the earlier of the following outcomes: i)
Disease recurrence (loco-regional or metastatic); ii) last
follow-up without evidence of disease; or iii) death without
evidence of disease.
Construction of the tissue microarray
block
All surgical specimens were fixed in 10% buffered
formalin at 4°C for 24–48 h and embedded in paraffin. Single
representative core biopsy specimens with a diameter of 2-mm were
taken from the tumor blocks using a core biopsy tool (SeongKohn
Trader's Corp.), arranged on a new TMA mould, and re-embedded in
paraffin. The TMA blocks, containing 60 cores, were cut into
4-µm-thick sections and stained at room temperature with 0.5%
haematoxylin for 4 min and 1% eosin for 30 sec. The tissues were
then examined under a high-power field light microscope
(magnification, ×400) and tumors occupying >10% of the core area
were selected as tumor sites.
Immunohistochemistry
Sections (thickness, 4 µm) from the TMA blocks were
mounted on Superfrost glass slides, deparaffinised in xylene, and
rehydrated in a graded series of ethanol (100, 95, 90, 80, 70%
ethanol). To block endogenous peroxidase activity, the tissue
slides were incubated with 3% H2O2 for 15
min. Tissue slides were subsequently heated at 100°C for 25 min in
a microwave in EDTA (pH 8.0) for antigen retrieval. The sections
were incubated overnight at 4°C with 1:100 dilutions of primary
antibodies against PD-1 (cat. no. ab52587; Abcam) and PD-L1 (cat.
no. ab58810; Abcam). Immunostaining was conducted using the
ImmPRESS (cat. no. MP7401-50; Vector Laboratories, Inc.) system and
the 3,3′-diaminobenzidine kit (cat. no. Sk4100; Vector
Laboratories, Inc.). The sections were counterstained with 0.5%
Meyer's hematoxylin for 4 min, dehydrated, cleared, and mounted at
room temperature.
The immunostained slides were independently examined
by two pathologists. The evaluation was performed twice, and the
pathologists were blinded to the clinicopathological features of
the patients, including the specific diagnosis and prognosis of
each individual patient. PD-1 positivity was defined as staining of
>40% of T cells in a high-power field light microscope
(magnification, ×400) at the centre of the tumor. CD3 antibody
(dilution 1:100; cat. no. ab5690; Abcam) was used to identify the
intratumoral lymphocytes in immunohistochemistry staining. A
biotinylated goat anti-rabbit antibody (dilution 1:100; cat. no.
BA-1000; Vector Laboratories, Inc.) was used as the secondary
antibody. PD-1 uptake in CD3-positive cells were defined as PD-1
positive. PD-L1-positive expression was defined by a cytoplasmic
staining pattern in the tumor tissues. The PD-L1 staining intensity
was graded as follows: i) 0, no staining; ii) 1, weak staining;
iii) 2, moderate staining; and iv) 3, strong staining. Tumors with
moderate or intense staining were classified as positive and tumors
with no or weak staining as negative.
Preparation of peripheral blood
mononuclear cells and tumor infiltrating lymphocytes
Peripheral blood samples (30 ml) were drawn from
patients before surgery and centrifuged at 1,800 × g for 3 min
through a Ficoll-Paque (GE Healthcare) gradient to isolate
peripheral blood mononuclear cells (PBMCs). Freshly excised tumor
tissues were homogenized and digested with 1.5 mg/ml collagenase D
(Sigma-Aldrich; Merck KGaA). The resulting cell suspensions were
filtered through a mesh filter (BD Biosciences). Due to the large
amount of tissue required to isolate sufficient tumor infiltrating
lymphocytes (TILs) for flow cytometry, TILs were obtained from 30
aforementioned additional patients.
Flow cytometry
Fluorescence-activated cell sorting (FACS) analysis
was performed using a Navios flow cytometer (Beckman Coulter, Inc.)
running Navios Platform 3.0 software (Beckman Coulter, Inc.). The
following antibodies were used to classify cells: Anti-CD3-FITC
(dilution 1:100; cat. no. 9515-02; SouthernBiotech), anti-CD4
phycoerythrin (PE; dilution 1:100; cat. no. 9522-09;
SouthernBiotech), anti-CD8 PC5 (dilution 1:100; cat. no. 9536-16;
SouthernBiotech), anti-PD-1 PC7 (dilution 1:200; cat. no.
25-2799-42; ebioscience; Thermo Fisher Scientific, Inc.),
anti-PD-L1 PC7 (dilution 1:200; cat. no. 558017; BD Biosciences),
anti-IgG1 FITC (dilution 1:100, cat. no. 0102-02; SouthernBiotech),
anti-IgG1 PE (dilution 1:100; cat. no. 0102-09; SouthernBiotech),
anti-IgG1 PC5 (cat. no. 0102-16; SouthernBiotech,), and anti-IgG1
PC7 (dilution 1:100; cat. no. 25-4714-42; ebioscience; Thermo
Fisher Scientific, Inc.). The gating strategy is provided in
Fig. S1. The present study used
isotype control antibodies for discriminating non-specific
background staining (Table I).
 | Table I.Isotype control antibodies. |
Table I.
Isotype control antibodies.
| Antibody | Model number | Manufacturer | City | Country |
|---|
| CD3 FITC | 9515-02 |
SouthernBiotech | Birmingham, AL | USA |
| CD4 PE | 9522-09 |
SouthernBiotech | Birmingham, AL | USA |
| CD8 PC5 | 9536-16 |
SouthernBiotech | Birmingham, AL | USA |
| PD1 PC7 | 25-2799-42 | ebioscience; Thermo
Fisher Scientific, Inc. | Waltham,
Massachusetts | USA |
| PDL1 PC7 | 558017 | BD Biosciences | San Jose, CA | USA |
| IgG1 FITC | 0102-02 |
SouthernBiotech | Birmingham, AL | USA |
| IgG1 PE | 0102-09 |
SouthernBiotech | Birmingham, AL | USA |
| IgG1 PC5 | 0102-16 |
SouthernBiotech | Birmingham, AL | USA |
| IgG1 PC7 | 25-4714-42 | ebioscience; Thermo
Fisher Scientific, Inc. | Waltham,
Massachusetts | USA |
Statistical analysis
Continuous variables are expressed as the mean ± SD.
Two-sided P-values were determined by χ2 test. The
Kaplan-Meier method was used to estimate OS and DFS time. Cox
regression multivariate models were used to identify independent
prognostic factors. In order to perform Cox multivariate analysis,
binary variable is required, therefore, the patients were divided
into two groups: i) <60 years old; and ii) >60 years old
(22). Unpaired Student's t-tests
and χ2 tests were used to compare the frequency of TILs
among the subgroups. A value of P<0.05 was considered to
indicate a statistically significant difference.
Results
Demographic data
The clinicopathological data of the patients
analyzed in the present study are presented in Table II. Out of 170 patients, 103 (60.6%)
were male and 67 (39.4%) were female, with a mean age of 67.7±11.9
years (range, 27–85 years). A total of 27 (15.9%) patients had TNM
stage I gastric adenocarcinoma, 56 (32.9%) had stage II, 75 (44.1%)
had stage III, and 12 (7.0%) had stage IV.
| Table II.Baseline clinical characteristics of
patients with gastric cancer. |
Table II.
Baseline clinical characteristics of
patients with gastric cancer.
| Basic
characteristics | Values |
|---|
| Mean age ± SD,
years | 67.7±11.9 |
| Sex, n (%) |
|
|
Male | 103 (60.6) |
|
Female | 67 (39.4) |
| Histologic type, n
(%) |
|
|
Well-differentiated | 7 (4.1) |
|
Moderately-differentiated | 77 (45.3) |
|
Poorly-differentiated | 83 (48.8) |
|
Mucinous | 3 (1.8) |
| Signet component, n
(%) |
|
| No | 127 (74.7) |
|
Yes | 43 (25.3) |
| Lauren
classification, n (%) |
|
|
Intestinal | 81 (47.6) |
|
Diffuse | 66 (38.8) |
|
Mixed | 23 (13.6) |
| Lymphatic invasion,
n (%) |
|
|
Present | 108 (63.5) |
|
Absent | 62 (36.5) |
| Venous invasion, n
(%) |
|
|
Present | 41 (24.1) |
|
Absent | 129 (75.9) |
| Perineural
invasion, n (%) |
|
|
Present | 74 (43.5) |
|
Absent | 96 (56.5) |
| T stage, n (%) |
|
| T1 | 17 (10.0) |
|
T2-4 | 153 (90.0) |
| N stage, n (%) |
|
| N0 | 53 (31.2) |
|
N1-3 | 117 (68.8) |
| M stage, n (%) |
|
| M0 | 139 (81.8) |
| M1 | 31 (18.2) |
| TNM stage, n
(%) |
|
| I | 27 (15.9) |
|
II–IV | 143 (84.1) |
| Total cases | 170 |
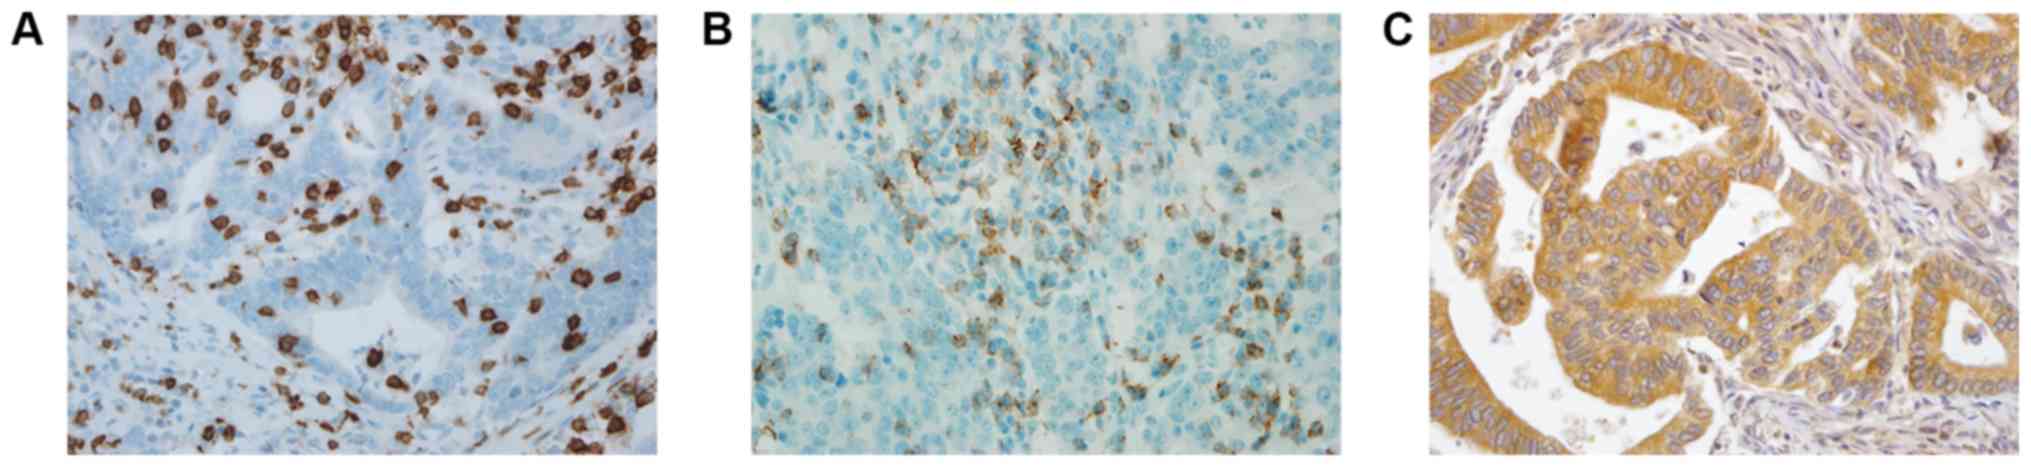
PD-1 and PD-L1 expression in gastric
cancer tissue and clinicopathologic features
Images of immunohistochemical staining for PD-1 and
PD-L1 are shown in Fig. 1. PD-1 and
PD-L1 were expressed in 30.0 and 60.5% of the gastric cancer
tissues, respectively. The association between PD-1 and PD-L1
expression levels and the clinicopathological variables are
presented in Table III. The
expression of PD-1 was significantly higher in patients with
perineural invasion (P=0.015). The expression of PD-L1 was
significantly higher in patients with advanced T stage (P=0.035) or
advanced TNM stage (P=0.050).
| Table III.Association between expression of
PD-1, PD-L1 and clinicopathological parameters. |
Table III.
Association between expression of
PD-1, PD-L1 and clinicopathological parameters.
|
| PD-1
expression |
| PD-L1
expression |
|
|---|
|
|
|
|
|
|
|---|
| Variables | Negative | Positive | P-value | Negative | Positive | P-value |
|---|
| Mean age ± SD,
years | 62.9±12.7 | 62.5±11.4 | 0.636 | 63.5±12.4 | 62.1±11.7 | 0.456 |
| Sex, n (%) |
|
| 0.498 |
|
| 0.265 |
|
Male | 70 (58.8) | 33 (64.7) |
| 37 (55.2) | 66 (64.1) |
|
|
Female | 49 (41.2) | 18 (35.3) |
| 30 (44.8) | 37 (35.9) |
|
| Histologic type, n
(%) |
|
| 0.253 |
|
| 0.035a |
|
Well-differentiated | 6 (5.0) | 1 (2.0) |
| 0 (0) | 7 (6.8) |
|
|
Moderately-differentiated | 49 (41.2) | 28 (54.9) |
| 27 (41.9) | 50 (48.5) |
|
|
Poorly-differentiated | 61 (51.3) | 22 (43.1) |
| 37 (55.6) | 45 (44.6) |
|
|
Mucinous | 3 (2.5) | 0 (0) |
| 2 (2.5) | 1 (1.9) |
|
| Signet component, n
(%) |
|
| 0.178 |
|
| 0.475 |
| No | 85 (71.4) | 42 (82.4) |
| 48 (71.6) | 79 (76.7) |
|
|
Yes | 34 (28.6) | 9 (17.6) |
| 19 (28.4) | 24 (23.3) |
|
| Lauren
classification, n (%) |
|
| 0.707 |
|
| 0.39 |
|
Intestinal | 54 (72.9) | 27 (52.9) |
| 27 (40.3) | 54 (52.4) |
|
|
Diffuse | 49 (80.4) | 17 (33.3) |
| 30 (44.8) | 36 (34.9) |
|
|
Mixed | 16 (61.5) | 7 (13.8) |
| 10 (14.9) | 13 (12.7) |
|
| Lymphatic invasion,
n (%) |
|
| 0.487 |
|
| 0.258 |
|
Absent | 41 (34.5) | 21 (41.2) |
| 28 (41.8) | 34 (33.0) |
|
|
Present | 78 (65.5) | 30 (58.8) |
| 39 (58.2) | 69 (67.0) |
|
| Venous invasion, n
(%) |
|
| 0.784 |
|
| 0.583 |
|
Absent | 91 (76.5) | 38 (74.5) |
| 49 (73.1) | 80 (77.7) |
|
|
Present | 28 (23.5) | 13 (25.5) |
| 18 (26.9) | 23 (22.3) |
|
| Perineural
invasion, n (%) |
|
| 0.015a |
|
| 0.115 |
|
Absent | 99 (83.1) | 15 (39.4) |
| 43 (64.2) | 53 (51.5) |
|
|
Present | 20 (16.9) | 36 (70.6) |
| 24 (35.8) | 50 (48.5) |
|
| T stage, n (%) |
|
| 0.289 |
|
| 0.035a |
| T1 | 10 (8.4) | 7 (13.7) |
| 11 (16.4) | 6 (5.8) |
|
|
T2-4 | 109 (91.6) | 44 (86.3) |
| 56 (83.6) | 97 (94.2) |
|
| N stage, n (%) |
|
| 0.943 |
|
| 0.401 |
| N0 | 38 (31.9) | 16 (31.4) |
| 24 (35.8) | 30 (29.1) |
|
|
N1-3 | 81 (68.1) | 35 (68.6) |
| 43 (64.2) | 73 (70.9) |
|
| M stage, n (%) |
|
| 0.153 |
|
| 0.93 |
| M0 | 94 (79.0) | 45 (88.2) |
| 55 (82.1) | 84 (81.6) |
|
| M1 | 25 (21.0) | 6 (11.8) |
| 12 (17.9) | 19 (18.4) |
|
| TNM stage, n
(%) |
|
| 0.137 |
|
| 0.05 |
| I | 16 (13.4) | 11 (21.6) |
| 15 (22.4) | 12 (11.7) |
|
|
II–IV | 103 (86.6) | 40 (78.4) |
| 52 (77.6) | 91 (88.3) |
|
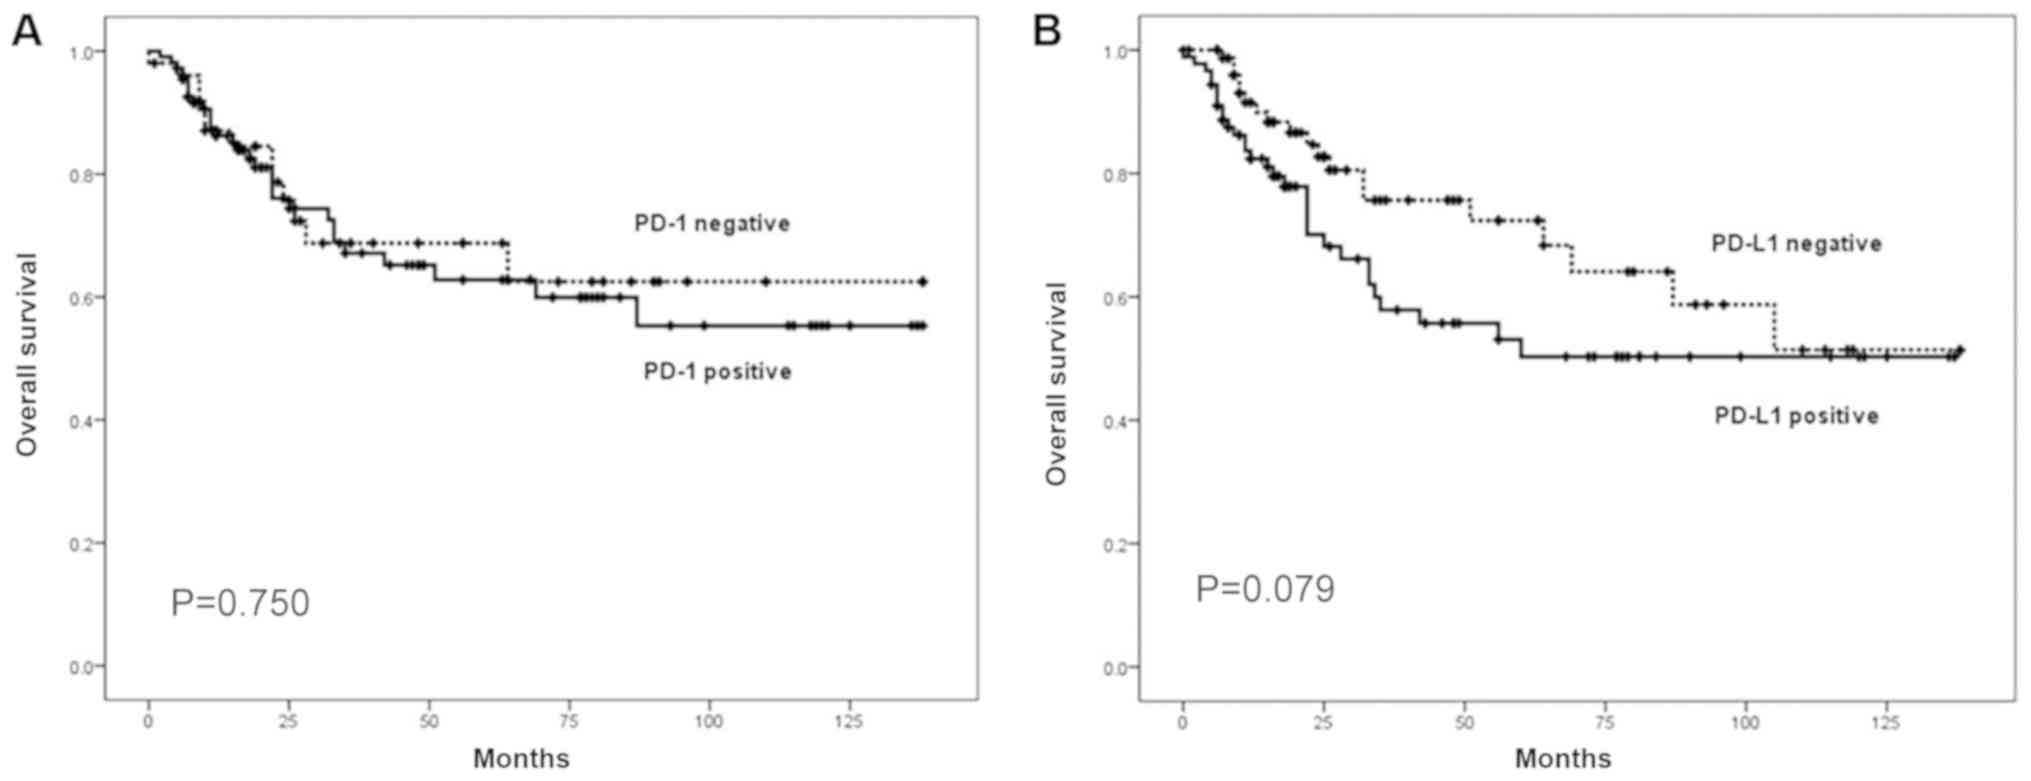
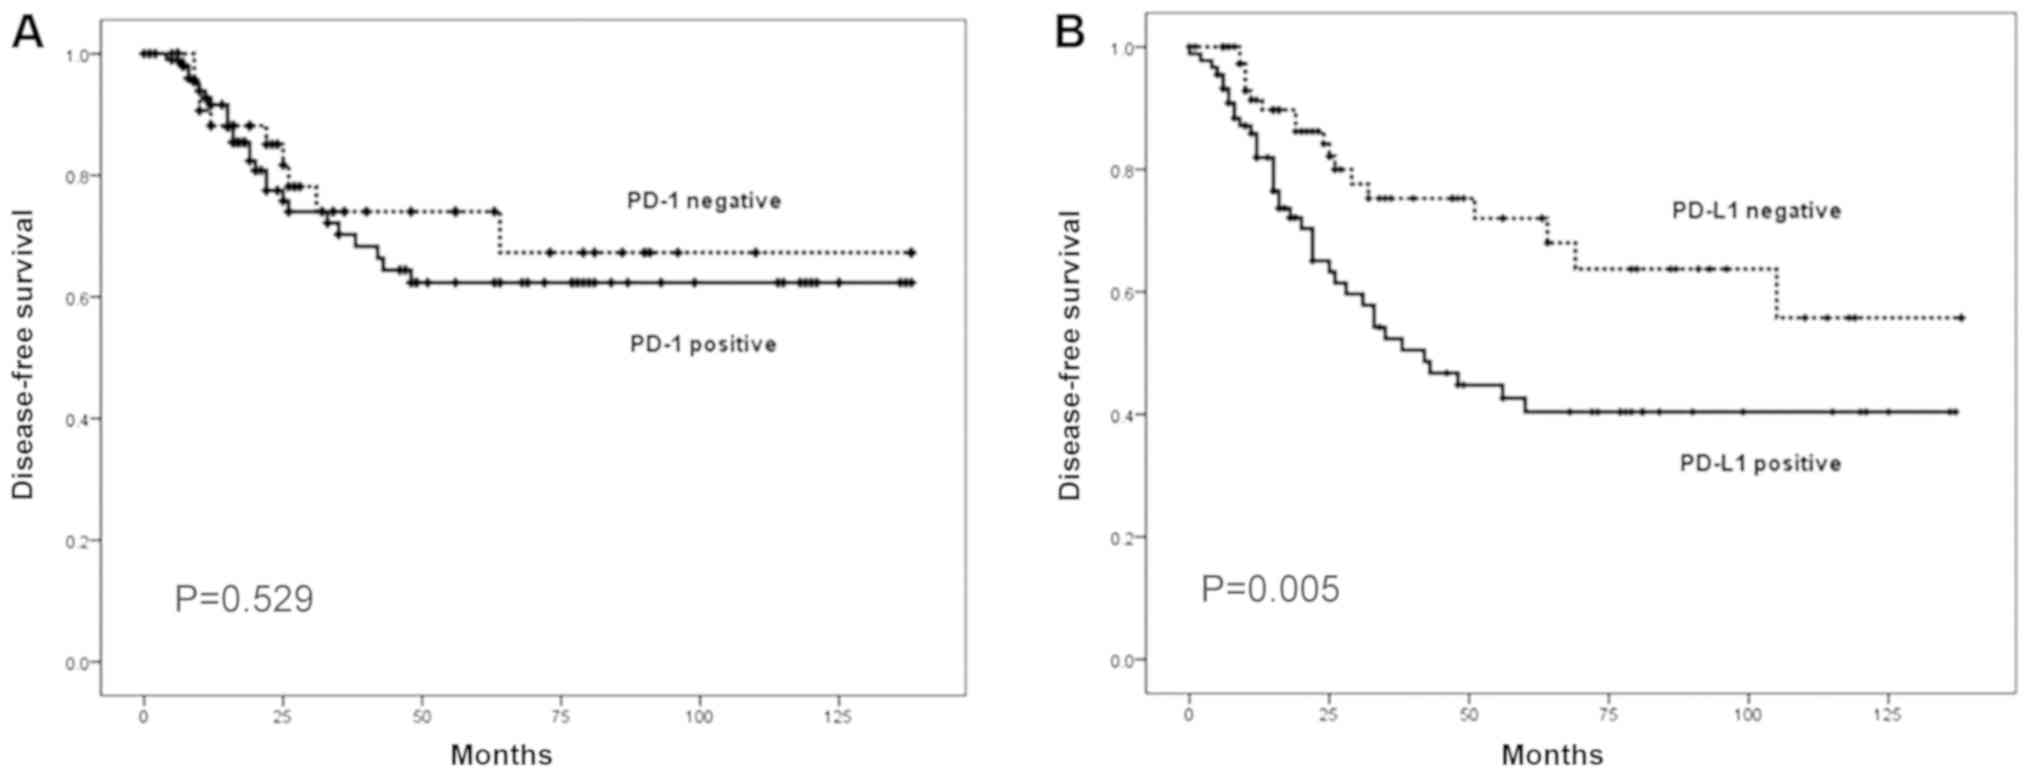
Effect of PD-1 and PD-L1 expression on
survival
Analyses of survival, according to PD-1 and PD-L1
expression, are presented in Figs. 2
and 3. The patients positive for
PD-L1 expression had a shorter DFS time compared with those
negative for PD-L1 expression (P=0.005). Multivariate analysis
using the Cox proportional hazards model identified venous invasion
and TNM stage as independent prognostic factors associated with OS
and DFS time in patients with gastric cancer (Table IV). In addition, PD-L1 expression
was significantly associated with patient prognosis (P=0.015).
| Table IV.Cox multivariate analysis of
clinicopathological risk factors affecting survival rate of
patients with gastric cancer. |
Table IV.
Cox multivariate analysis of
clinicopathological risk factors affecting survival rate of
patients with gastric cancer.
|
| Overall survival
rate | Disease-free
survival rate |
|---|
|
|
|
|
|---|
| Variables | HR (95% CI) | P-value | HR (95% CI) | P-value |
|---|
| Age, years |
| 0.121 |
| 0.06 |
|
<60 | 1 |
| 1 |
|
|
≥60 | 0.972
(0.939–1.007) |
| 0.967
(0.933–1.001) |
|
| Lymphatic
invasion |
| 0.996 |
| 0.613 |
|
Absent | 1 |
| 1 |
|
|
Present | 0.997
(0.394–3.384) |
| 1.344
(0.426–4.238) |
|
| Venous
invasion |
| 0.012a |
| 0.029a |
|
Absent | 1 |
| 1 |
|
|
Present | 3.663
(1.330–10.092) |
| 3.143
(1.127–8.763) |
|
| Perineural
invasion |
|
|
|
|
|
Absent | 1 | 0.208 | 1 | 0.087 |
|
Present | 1.818
(0.718–4.607) |
| 2.202
(0.893–5.429) |
|
| TNM stage |
| 0.05 |
| 0.008a |
| I | 1 |
| 1 |
|
| II | 1.160
(0.549–3.863) |
| 1.998
(0.977–3.042) |
|
|
III | 2.265
(1.066–5.727) |
| 3.178
(1.872–9.372) |
|
| IV | 5.483
(3.399–11.372) |
| 5.051
(1.753–11.372) |
|
| PD-L1
expression |
| 0.497 |
| 0.015a |
|
Negative | 1 |
| 1 |
|
|
Positive | 1.373
(0.550–3.426) |
| 3.033
(1.237–7.440) |
|
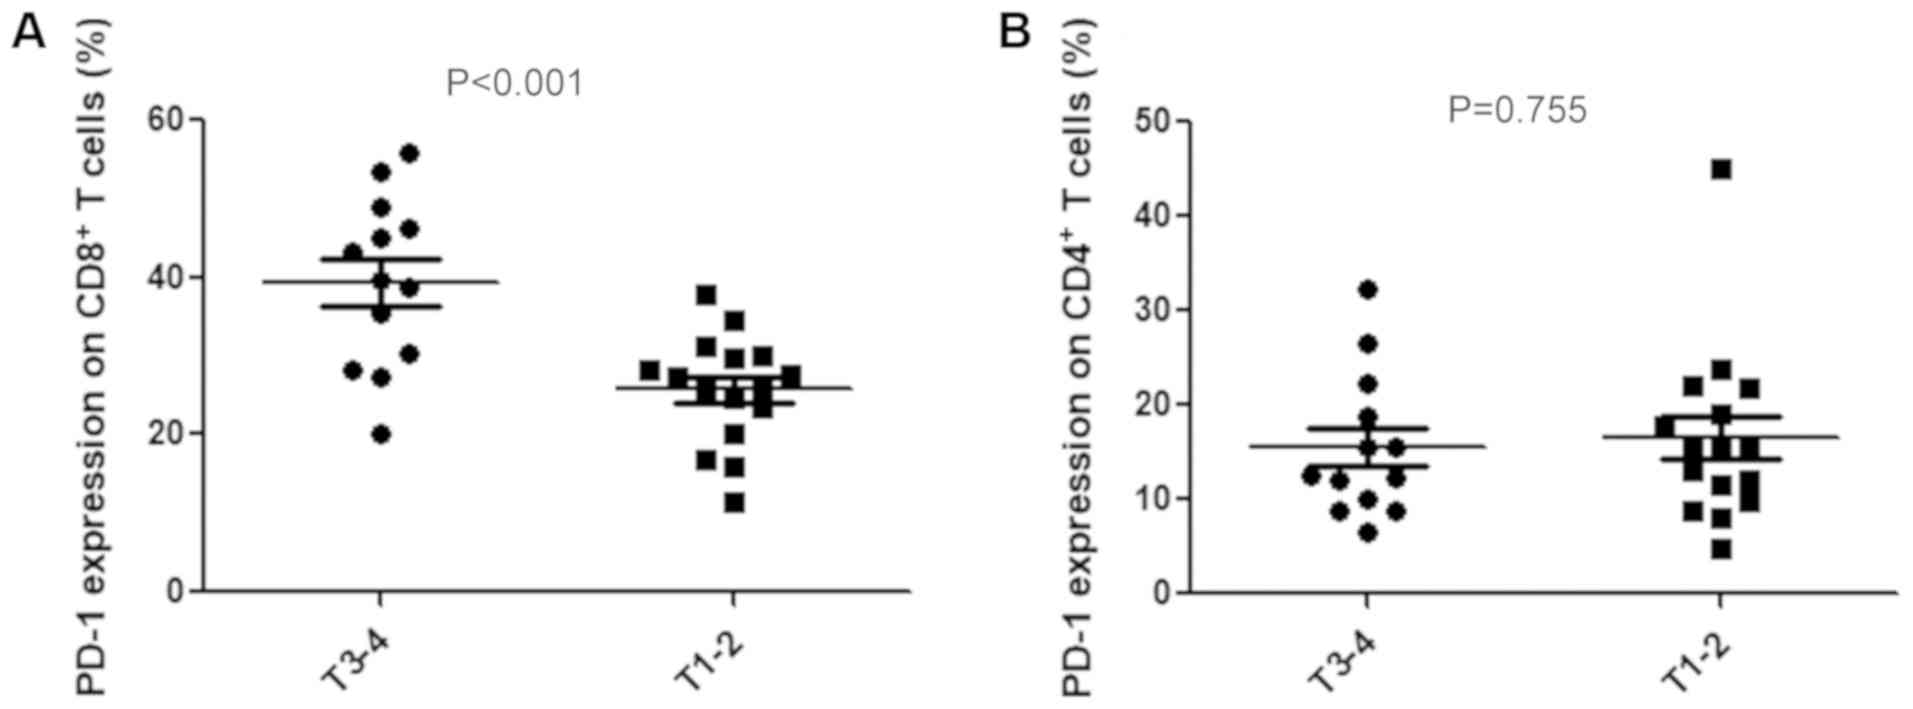
PD-1 and PD-L1 expression on
circulating CD4+ and CD8+ T cells and clinicopathologic
features
To assess PD-1 expression on T cells,
CD4+ and CD8+ T cells were isolated from
PBMCs by flow cytometry. Cells were not stimulated before detecting
PD-L1 expression on T cells. The association between the expression
level of PD-1 on T cells and the clinicopathological
characteristics of patients with gastric cancer was subsequently
analyzed. PD-1 expression on CD8+ T cells was
significantly associated with depth of invasion (39.4±2.9% vs.
25.7±1.7%; P<0.001; Fig.
4A). However, PD-1 expression on CD4+ T cells was
not associated with depth of invasion (19.2±3.17% vs. 15.3±2.6%;
P=0.755; Fig. 4B). No significant
associations were identified between the expression levels of these
two proteins and histologic types, lymph node metastasis or TNM
stages.
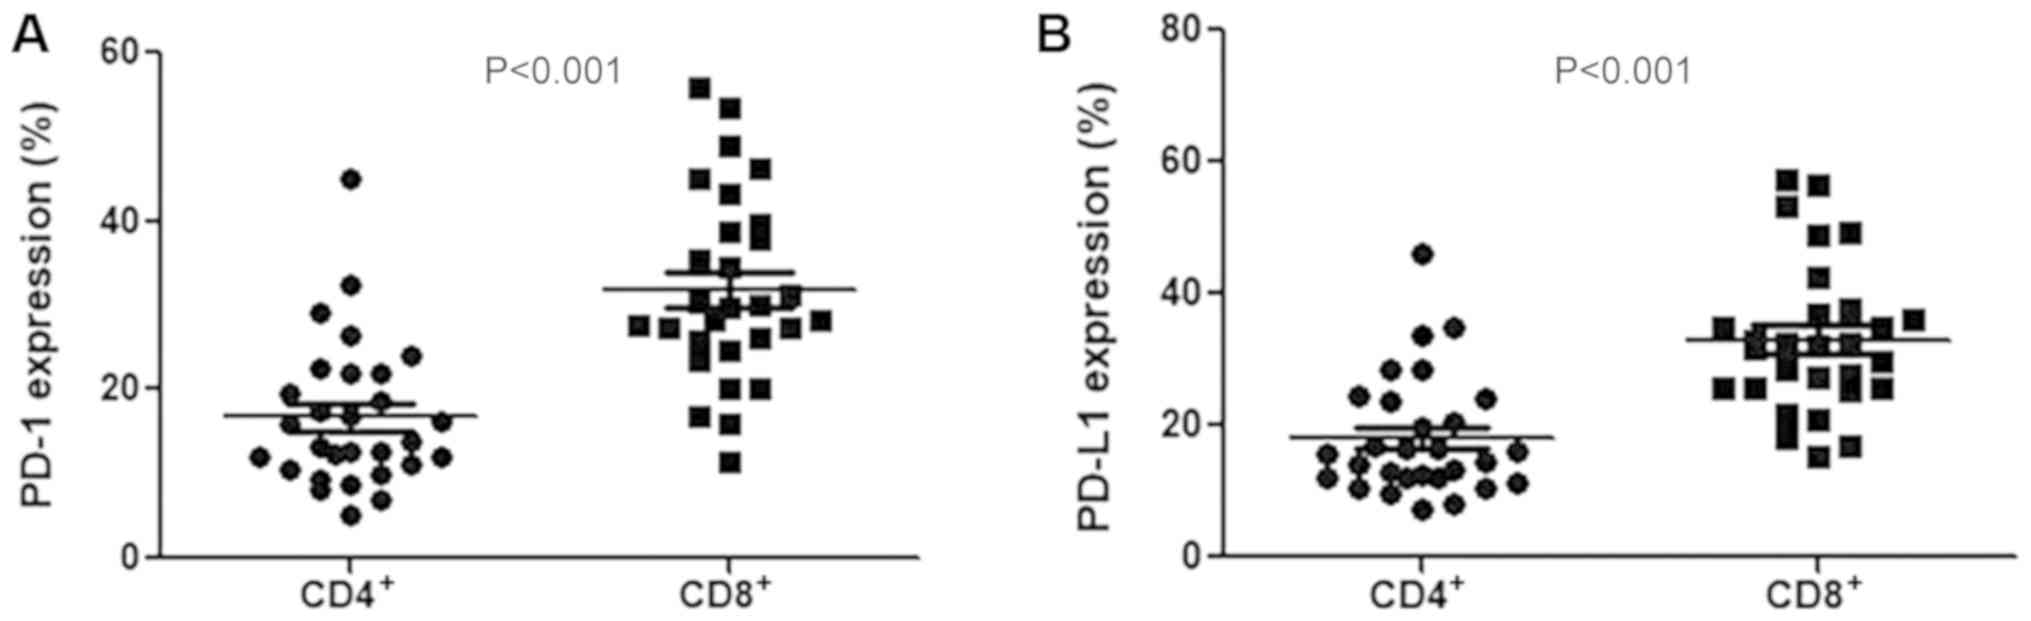
PD-1 and PD-L1 expression on CD4+ and
CD8+ T cells in gastric cancer tissue
PD-1 and PD-L1 expression levels on CD4+
T cells and CD8+ T cells were subsequently determined
from gastric cancer tissues. PD-1 expression was significantly
higher on CD8+ T cells compared with CD4+ T
cells (Fig. 5A). PD-L1 expression
was also significantly higher on CD8+ T cells compared
with CD4+ T cells (Fig.
5B).
Discussion
The host immune system can recognize and destroy
cancer cells (23). Therefore,
immune evasion of cancer cells may play a critical role in the
development and progression of tumors (23). PD-L1, a member of the B7 family of
immune-regulatory cell surface proteins, suppresses the
cell-mediated immune response by interacting with its receptor,
PD-1 (24). Overexpression of PD-L1
by tumor cells has been reported in various types of cancer, such
as pancreatic cancer, esophageal cancer, breast cancer, and gastric
cancer and impairs T cell-mediated antitumor immunity (4).
In the present study, the expression of PD-1 and
PD-L1 was determined in a large series of gastric cancer tissue
samples to examine the association of the expression levels of
these factors with clinicopathological characteristics and survival
rates. The present results showed that PD-1 and PD-L1 expression is
upregulated in gastric cancer cells, in line with previous reports
(19,25–28). In
addition, the expression levels of PD-1 and PD-L1 have been
reported to be significantly associated with several adverse
prognostic factors (27–30). Sun et al (29) reported that high PD-L1 expression in
tumors was associated with decreased survival rate and poor
prognosis in gastric cancer. In the present study, PD-L1 expression
was associated with a more advanced T stage and TNM stage, which is
consistent with the results reported by Eto et al (27). However, these results are not in line
with the results reported by Kim et al (19), who found that PD-L1 expression tended
to increase with decreasing tumor stage. In the present study, PD-1
expression was higher in patients with perineural invasion, which
is a marker of poor prognosis (16).
Therefore, high expression of PD-1 and PD-L1 may be associated with
aggressive behavior of gastric cancer.
Previous studies have assessed the association of
survival outcomes with PD-1 and PD-L1 expression in gastric cancer
(29,30). Kim et al (19) reported that PD-L1 expression was
associated with improved OS and DFS. Eto et al (27) reported that patients with and without
PD-1 expression had similar OS rates; however, DFS was
significantly decreased in the PD-1-positive group than in the PD-1
negative group. PD-L1 expression did not influence OS or DFS. In
the present study, PD-L1 expression was significantly associated
with a poorer DFS, while PD-1 expression was not significantly
associated with prognosis. The present results suggested that PD-L1
expression may be a prognostic marker in gastric cancer.
PD-1 and PD-L1 play important roles in the
regulation of the immune system and maintenance of peripheral
tolerance through T cell activation and tolerance induction
(15). PD-1 is expressed on T cells
in response to inflammatory stimuli, and tumor cells express PD-L1
to inhibit T cell mediated antitumor immunity, where PD-L1 binds to
PD-1 on TILs (15,31). In the present study, PD-1 expression
on CD4+ and CD8+ T cells was increased
significantly in patients with advanced gastric cancer compared
with patients with early gastric cancer, suggesting that PD-1
expression is associated with tumor progression. However, the
prognostic significance of PD-1 expression on T cells is unclear
due to the small sample size of patients with early gastric cancer
included in the present study. Therefore, further investigation of
the prognostic significance of PD-1 expression on T cells in
patients with gastric cancer is required.
PD-1 is expressed on the surface of activated
macrophages, T lymphocytes, B lymphocytes, natural killer cells and
on some myeloid cells such as myeloid dendritic cells (32). PD-L1, also known as B7-H1/CD274, is a
B7 family member expressed primarily by hematopoietic and
parenchymal cells that regulates self-tolerance in vivo by
binding to PD-1 on T lymphocytes (32). In a previous study, PDL-1 was
identified on the tumor surface and on parenchymal or antigen
presenting cells (28). In a recent
study by Arrieta et al (33),
PD-L1 expression was examined on circulating CD3+,
CD3+CD4+ and CD3+CD8+
cytotoxic cells from patients with advanced non-small cell lung
cancer, and PD-L1 receptor expression ratio was found to have lower
percentages, 0.02–8.7% on CD3+CD4+ T and
0.08–8.78% on CD3+CD8+ cytotoxic T cells.
Furthermore, Xu et al (34).
reported that patients with colorectal cancer presented with
significantly higher levels of circulating
Tim-3+PD-1+CD8+ T cells compared
to the healthy controls (medians of 3.12 and 1.99%, respectively;
P=0.04). However, Saito et al (26). reported that PD-1 expression on
CD4+ T cells obtained from PBMC, normal gastric mucosa,
and gastric cancer tissue was 31.0±7.2, 59.5±10.6, and 73.4±9.9%,
respectively. They also reported that the frequency of
PD-1+ CD4+ T-cells from gastric cancer tissue
with PD-L1 expression was significantly higher than that from
gastric cancer tissue without PD-L1 expression (49.7±10.4% vs.
30.6±9.7%, respectively) (35). This
study indicated high expression of PDL-1 on CD4+ and
CD8+ T cells, which was in accordance with Saito et
al (26,35). The distinction between the data of
the present study and the data by Saito et al (26,35)
compared with Arrieta et al (33) and Xu et al (34) are probably due to the tumors in
different organs.
Thompson et al (28) reported that CD8+ T cell
infiltration in tumors and at peritumoural interfaces was increased
in PD-L1-positive compared with PD-L1-negative patients. In
addition, 89% of stroma PD-L1 positive tumors had high CD8
densities, suggesting an association with CD8+ T cells,
which produce cytokines such as interferon γ and express PD-L1
(28). In a meta-analysis, Gu et
al (36) demonstrated that
patients with Epstein-Barr virus infection (EBV+) and
microsatellite instability (MSI) are more likely to express PD-L1.
EBV+ and MSI gastric cancer exhibits lymphocytic
infiltration in tumor stroma; therefore, the lymphoid stroma in
these tumors has a large number of CD8 T cells, which are capable
of mounting a robust antitumor inflammatory response (36). In addition, PD-L1 expression is
associated with a concomitant and significant increase in the
number of CD8 T cells at the tumor invasive front (37). In the present study, PD-1 and PD-L1
expression levels were significantly higher on circulating
CD8+ T cells than on circulating CD4+ T
cells. The present results suggested evasion of the adaptive immune
response in these tumors, which may be overcome by administration
of anti-PD-1/PD-L1. However, the interaction between
CD8+ T cells and immune evasion, mediated by increased
PD-1 and PD-L1 expression, requires further examination.
The present study presented several limitations.
First, digital imaging analyses for the assessment of PD-1 and
PD-L1 immunohistochemical outcomes could not be performed, which
could be problematic for inter-observer variation. Second, a
retrospective cohort study was conducted to evaluate the prognostic
significance of PD-1 and PD-L1; however, the clinicopathological
characteristics among the patients analyzed were heterogeneously
distributed. Therefore, selection bias might have influenced the
outcome. The finding that PD-L1 expression showed no effect on OS
may be due to the small sample size. In addition, when, the
patients were divided into two groups according to PD-L1 expression
status, bias might have occurred due to the difference of
distribution in Lauren classification and differentiation between
the two groups. Third, the absence of data using five-color
staining and analyzing the markers together is a limitation of this
study. Fourth, there are some other cells, such as
CD4+CD8+ and CD4−CD8−,
that can also express PD-1 and PD-L1 (38) and these cells may also be important
for the tumor progression. However, the expression of PD-1 and
PD-L1 in the other cells, such as CD4+CD8+
and CD4−CD8− was not examined in the present
study.
In conclusion, upregulation of PD-1 on
CD4+ and CD8+ T cells may play a role in the
immune evasion of gastric cancer. Furthermore, PD-L1 expression may
be an independent indicator of poor prognosis in patients with
gastric cancer.
Supplementary Material
Supporting Data
Acknowledgements
Not applicable.
Funding
This study was supported by a research grant (grant
no. SVHR-2015-11) from St. Vincent's Hospital, The Catholic
University of Korea (Suwon, Republic of Korea).
Availability of data and materials
All data generated or analyzed during this study are
included in this published article.
Authors' contributions
KHJ, SYK and EYS designed the study. JHK, JKJ, HJC
and EYS performed the experiments. KHJ and SYK analyzed the data.
KHJ and JHK wrote the manuscript.
Ethics approval and consent to
participate
The study protocol was approved by the Institutional
Review Board (approval no. VC14SISI0230) at St. Vincent's Hospital,
The Catholic University of Korea (Suwon, Republic of Korea). For
tissue sample collection, the study protocol was approved by the
Institutional Review Board (approval no. VC16TISI0196) at St.
Vincent's Hospital, The Catholic University of Korea (Suwon,
Republic of Korea). The patients whose tissues were used for flow
cytometry provided written informed consent.
Patient consent for publication
Patients provided written informed consent for the
publication of any associated data and accompanying images.
Competing interests
The authors declare that they have no competing
interests.
References
|
1
|
Jemal A, Bray F, Center MM, Ferlay J, Ward
E and Forman D: Global cancer statistics. CA Cancer J Clin.
61:69–90. 2011. View Article : Google Scholar : PubMed/NCBI
|
|
2
|
Park CH, Song KY and Kim SN: Treatment
results for gastric cancer surgery: 12 years' experience at a
single institute in Korea. Eur J Surg Oncol. 34:36–41. 2008.
View Article : Google Scholar : PubMed/NCBI
|
|
3
|
Sakuramoto S, Sasako M, Yamaguchi T,
Kinoshita T, Fujii M, Nashimoto A, Furukawa H, Nakajima T, Ohashi
Y, Imamura H, et al: Adjuvant chemotherapy for gastric cancer with
S-1, an oral fluoropyrimidine. N Engl J Med. 357:1810–1820. 2007.
View Article : Google Scholar : PubMed/NCBI
|
|
4
|
Curiel TJ, Wei S, Dong H, Alvarez X, Cheng
P, Mottram P, Krzysiek R, Knutson KL, Daniel B, Zimmermann MC, et
al: Blockade of B7-H1 improves myeloid dendritic cell-mediated
antitumor immunity. Nat Med. 9:562–567. 2003. View Article : Google Scholar : PubMed/NCBI
|
|
5
|
Dong H, Strome SE, Salomao DR, Tamura H,
Hirano F, Flies DB, Roche PC, Lu J, Zhu G, Tamada K, et al:
Tumor-associated B7-H1 promotes T-cell apoptosis: A potential
mechanism of immune evasion. Nat Med. 8:793–800. 2002. View Article : Google Scholar : PubMed/NCBI
|
|
6
|
Strome SE, Dong H, Tamura H, Voss SG,
Flies DB, Tamada K, Salomao D, Cheville J, Hirano F, Lin W, et al:
B7-H1 blockade augments adoptive T-cell immunotherapy for squamous
cell carcinoma. Cancer Res. 63:6501–6505. 2003.PubMed/NCBI
|
|
7
|
Thompson RH, Gillett MD, Cheville JC,
Lohse CM, Dong H, Webster WS, Krejci KG, Lobo JR, Sengupta S, Chen
L, et al: Costimulatory B7-H1 in renal cell carcinoma patients:
Indicator of tumor aggressiveness and potential therapeutic target.
Proc Natl Acad Sci USA. 101:17174–17179. 2004. View Article : Google Scholar : PubMed/NCBI
|
|
8
|
Naito Y, Saito K, Shiiba K, Ohuchi A,
Saigenji K, Nagura H and Ohtani H: CD8+ T cells infiltrated within
cancer cell nests as a prognostic factor in human colorectal
cancer. Cancer Res. 58:3491–3494. 1998.PubMed/NCBI
|
|
9
|
Schumacher K, Haensch W, Röefzaad C and
Schlag PM: Prognostic significance of activated CD8(+) T cell
infiltrations within esophageal carcinomas. Cancer Res.
61:3932–3936. 2001.PubMed/NCBI
|
|
10
|
Nakano O, Sato M, Naito Y, Suzuki K,
Orikasa S, Aizawa M, Suzuki Y, Shintaku I, Nagura H and Ohtani H:
Proliferative activity of intratumoral CD8(+) T-lymphocytes as a
prognostic factor in human renal cell carcinoma: Clinicopathologic
demonstration of antitumor immunity. Cancer Res. 61:5132–5136.
2001.PubMed/NCBI
|
|
11
|
Li X, Kostareli E, Suffner J, Garbi N and
Hämmerling GJ: Efficient Treg depletion induces T-cell infiltration
and rejection of large tumors. Eur J Immunol. 40:3325–3335. 2010.
View Article : Google Scholar : PubMed/NCBI
|
|
12
|
Antony PA, Piccirillo CA, Akpinarli A,
Finkelstein SE, Speiss PJ, Surman DR, Palmer DC, Chan CC, Klebanoff
CA, Overwijk WW, et al: CD8+ T cell immunity against a
tumor/self-antigen is augmented by CD4+ T helper cells and hindered
by naturally occurring T regulatory cells. J Immunol.
174:2591–2601. 2005. View Article : Google Scholar : PubMed/NCBI
|
|
13
|
Workman CJ and Vignali DA: Negative
regulation of T cell homeostasis by lymphocyte activation gene-3
(CD223). J Immunol. 174:688–695. 2005. View Article : Google Scholar : PubMed/NCBI
|
|
14
|
Rodig N, Ryan T, Allen JA, Pang H, Grabie
N, Chernova T, Greenfield EA, Liang SC, Sharpe AH, Lichtman AH and
Freeman GJ: Endothelial expression of PD-L1 and PD-L2
down-regulates CD8+ T cell activation and cytolysis. Eur J Immunol.
33:3117–3126. 2003. View Article : Google Scholar : PubMed/NCBI
|
|
15
|
Keir ME, Freeman GJ and Sharpe AH: PD-1
regulates self-reactive CD8+ T cell responses to antigen in lymph
nodes and tissues. J Immunol. 179:5064–5070. 2007. View Article : Google Scholar : PubMed/NCBI
|
|
16
|
Hirano F, Kaneko K, Tamura H, Dong H, Wang
S, Ichikawa M, Rietz C, Flies DB, Lau JS, Zhu G, et al: Blockade of
B7-H1 and PD-1 by monoclonal antibodies potentiates cancer
therapeutic immunity. Cancer Res. 65:1089–1096. 2005.PubMed/NCBI
|
|
17
|
Huang B, Chen L, Bao C, Sun C, Li J, Wang
L and Zhang X: The expression status and prognostic significance of
programmed cell death 1 ligand 1 in gastrointestinal tract cancer:
A systematic review and meta-analysis. Onco Targets Ther.
8:2617–2625. 2015.PubMed/NCBI
|
|
18
|
Zhang L, Qiu M, Jin Y, Ji J, Li B, Wang X,
Yan S, Xu R and Yang D: Programmed cell death ligand 1 (PD-L1)
expression on gastric cancer and its relationship with
clinicopathologic factors. Int J Clin Exp Pathol. 8:11084–11091.
2015.PubMed/NCBI
|
|
19
|
Kim JW, Nam KH, Ahn SH, Park DJ, Kim HH,
Kim SH, Chang H, Lee JO, Kim YJ, Lee HS, et al: Prognostic
implications of immunosuppressive protein expression in tumors as
well as immune cell infiltration within the tumor microenvironment
in gastric cancer. Gastric Cancer. 19:42–52. 2016. View Article : Google Scholar : PubMed/NCBI
|
|
20
|
Japanese Gastric Cancer Association:
Japanese Classification of Gastric Carcinoma-2nd English Edition.
Gastric Cancer. 1:10–24. 1998. View Article : Google Scholar : PubMed/NCBI
|
|
21
|
Japanese Gastric Cancer Association:
Japanese gastric cancer treatment guidelines 2010 (ver. 3). Gastric
Cancer. 14:113–123. 2011. View Article : Google Scholar : PubMed/NCBI
|
|
22
|
Huang R, Huang D, Dai W and Yang F:
Overexpression of HMGA1 correlates with the malignant status and
prognosis of breast cancer. Mol Cell Biochem. 404:251–257. 2015.
View Article : Google Scholar : PubMed/NCBI
|
|
23
|
Urban JL and Schreiber H: Tumor antigens.
Annu Rev Immunol. 10:617–644. 1992. View Article : Google Scholar : PubMed/NCBI
|
|
24
|
Dong H, Zhu G, Tamada K and Chen L: B7-H1,
a third member of the B7 family, co-stimulates T-cell proliferation
and interleukin-10 secretion. Nat Med. 5:1365–1369. 1999.
View Article : Google Scholar : PubMed/NCBI
|
|
25
|
Takaya S, Saito H and Ikeguchi M:
Upregulation of immune checkpoint molecules, PD-1 and LAG-3, on
CD4+ and CD8+ T Cells after gastric cancer surgery. Yonago Acta
Med. 58:39–44. 2015.PubMed/NCBI
|
|
26
|
Saito H, Kuroda H, Matsunaga T, Osaki T
and Ikeguchi M: Increased PD-1 expression on CD4+ and CD8+ T cells
is involved in immune evasion in gastric cancer. J Surg Oncol.
107:517–522. 2013. View Article : Google Scholar : PubMed/NCBI
|
|
27
|
Eto S, Yoshikawa K, Nishi M, Higashijima
J, Tokunaga T, Nakao T, Kashihara H, Takasu C, Iwata T and Shimada
M: Programmed cell death protein 1 expression is an independent
prognostic factor in gastric cancer after curative resection.
Gastric Cancer. 19:466–471. 2016. View Article : Google Scholar : PubMed/NCBI
|
|
28
|
Thompson ED, Zahurak M, Murphy A, Cornish
T, Cuka N, Abdelfatah E, Yang S, Duncan M, Ahuja N, Taube JM, et
al: Patterns of PD-L1 expression and CD8 T cell infiltration in
gastric adenocarcinomas and associated immune stroma. Gut.
66:794–801. 2017. View Article : Google Scholar : PubMed/NCBI
|
|
29
|
Sun J, Xu K, Wu C, Wang Y, Hu Y, Zhu Y,
Chen Y, Shi Q, Yu G and Zhang X: PD-L1 expression analysis in
gastric carcinoma tissue and blocking of tumor-associated PD-L1
signaling by two functional monoclonal antibodies. Tissue Antigens.
69:19–27. 2007. View Article : Google Scholar : PubMed/NCBI
|
|
30
|
Wu C, Zhu Y, Jiang J, Zhao J, Zhang XG and
Xu N: Immunohistochemical localization of programmed death-1
ligand-1 (PD-L1) in gastric carcinoma and its clinical
significance. Acta Histochem. 108:19–24. 2006. View Article : Google Scholar : PubMed/NCBI
|
|
31
|
Fukunaga A, Miyamoto M, Cho Y, Murakami S,
Kawarada Y, Oshikiri T, Kato K, Kurokawa T, Suzuoki M, Nakakubo Y,
et al: CD8+ tumor-infiltrating lymphocytes together with CD4+
tumor-infiltrating lymphocytes and dendritic cells improve the
prognosis of patients with pancreatic adenocarcinoma. Pancreas.
28:e26–e31. 2004. View Article : Google Scholar : PubMed/NCBI
|
|
32
|
Keir ME, Butte MJ, Freeman GJ and Sharpe
AH: PD-1 and its ligands in tolerance and immunity. Annu Rev
Immunol. 26:677–704. 2008. View Article : Google Scholar : PubMed/NCBI
|
|
33
|
Arrieta O, Montes-Servin E,
Hernandez-Martinez JM, Cardona AF, Casas-Ruiz E, Crispin JC, Motola
D, Flores-Estrada D and Barrera L: Expression of PD-1/PD-L1 and
PD-L2 in peripheral T-cells from non-small cell lung cancer
patients. Oncotarget. 8:101994–102005. 2017. View Article : Google Scholar : PubMed/NCBI
|
|
34
|
Xu B, Yuan L, Gao Q, Yuan P, Zhao P, Yuan
H, Fan H, Li T, Qin P, Han L, et al: Circulating and
tumor-infiltrating Tim-3 in patients with colorectal cancer.
Oncotarget. 6:20592–20603. 2015.PubMed/NCBI
|
|
35
|
Saito H, Kono Y, Murakami Y, Shishido Y,
Kuroda H, Matsunaga T, Fukumoto Y, Osaki T, Ashida K and Fujiwara
Y: Highly activated PD-1/PD-L1 pathway in gastric cancer with PD-L1
expression. Anticancer Res. 38:107–112. 2018.PubMed/NCBI
|
|
36
|
Gu L, Chen M, Guo D, Zhu H, Zhang W, Pan
J, Zhong X, Li X, Qian H and Wang X: PD-L1 and gastric cancer
prognosis: A systematic review and meta-analysis. PLoS One.
12:e01826922017. View Article : Google Scholar : PubMed/NCBI
|
|
37
|
Ma C, Patel K, Singhi AD, Ren B, Zhu B,
Shaikh F and Sun W: Programmed death-ligand 1 expression is common
in gastric cancer associated with epstein-barr virus or
microsatellite instability. Am J Surg Pathol. 40:1496–1506. 2016.
View Article : Google Scholar : PubMed/NCBI
|
|
38
|
Blank C, Gajewski TF and Mackensen A:
Interaction of PD-L1 on tumor cells with PD-1 on tumor-specific T
cells as a mechanism of immune evasion: Implications for tumor
immunotherapy. Cancer Immunol Immunother. 54:307–314. 2005.
View Article : Google Scholar : PubMed/NCBI
|