Introduction
Several epigenetic biomarkers in peripheral blood
and circulating cell-free DNA in serum and plasma have been
reported for cancer diagnosis. The DNA methylation biomarkers of
various cancers include: Adenomatous polyposis coli protein
(APC), glutathione S-transferase Pi 1 (GSTP1), Ras association
domain family member 1A (RASSF1A), and retinoic acid
receptor (RAR)-β2 for breast cancer; BRCA1, HIC ZBTB
transcriptional repressor 1, paired box 5, progesterone
receptor, and thrombospondin 1 for ovarian cancer;
Cyclin D2, plasminogen activator urokinase, suppressor of
cytokine signaling 1, thrombospondin, and von Hippel-Lindau
tumor suppressor for pancreatic cancer; GSTP1, RASSF1,
and RARB2 for prostate cancer; P15, P16, and
RASSF1A for hepatocellular carcinoma; and APC,
O-6-methylguanine-DNA methyltransferase, RASSF2A, WNT inhibitory
factor−1, and Septin 9 (SEPT9) for colorectal cancer
(CRC). All of the reported biomarkers exhibit different
sensitivities and specificities for cancer detection (1). Furthermore, in colon, liver, lung, and
nasopharynx cancers, significant DNA hypomethylation of long
interspersed nucleotide element-1 (LINE-1) has been reported
(2). Each candidate gene has been
investigated using appropriate methods; PCR and pyrosequencing are
suitable for quantitatively measuring DNA methylation levels.
Typically, hypermethylation and hypomethylation are measured at
specific loci from the promoter regions. However, the molecular
mechanism underlying DNA methylation changes in circulating cells,
cancer cells or white blood cells (WBCs), has not been
determined.
In a previous study, we reported LINE-1
hypermethylation in micrometastatic lymph nodes and the surrounding
cells in patients with breast cancer. Secretions from breast cancer
cells were shown to increase LINE-1 methylation in cancer stromal
cells (3). Therefore, we hypothesize
that cancer secretions can alter the DNA methylation of circulating
WBCs.
In CRC, cancer cells grow uncontrollably in the
colon or rectal area (4). The
majority of CRC develops from the inner lining of organs called
polyps, with ~5% of polyps becoming cancerous (5,6). CRC is
the third most common cancer and the fourth leading cause of death
worldwide (7). The majority of cases
of CRC occur in patients >50 years of age (8). In addition, several factors can
increase the risk of CRC, including diet, obesity, lack of physical
activity, alcohol consumption, tobacco use, family history of CRC,
and hereditary conditions (9).
Currently, the gold standard tool for CRC screening is colonoscopy,
which has high sensitivity for the detection of CRC (10).
In the present study, whether CRC secretions cause
methylation changes in the circulating WBCs of patients with CRC
was examined. Connection up- and downregulation expression analysis
of microarrays (CU-DREAM) (11) was
used to compare the methylation profile of normal control
peripheral blood mononuclear cells (PBMCs) after co-culturing with
CRC cell lines and the RNA expression profiles of WBCs from
patients with CRC. Methylation changes in the candidate genes in
the WBCs of patients with CRC were evaluated using real-time
methylation-specific PCR (RT-MSP).
Materials and methods
Ethical statement
The present study was approved by the Ethical
Committee of the Faculty of Medicine, Chulalongkorn University (IRB
no. 326/60). All samples were obtained from patients diagnosed with
CRC between January 2016 and January 2018 in Chulalongkorn Memorial
Hospital. All study subjects provided written informed consent.
Blood samples and formalin-fixed
paraffin-embedded (FFPE) tissue
The blood samples for the co-culture model were
obtained from 3 healthy males and 2 healthy females with no immune
disorders or chronic diseases. The blood samples for the
methylation tests were obtained from 32 CRC patients and 57 normal
controls. Various FFPE tissues were examined in the present study
by immunohistochemical staining using anti-matrix metalloproteinase
(MMP)-9 antibodies; the tissue samples were comprised of normal
colon biopsies (5 cases), tumor colon biopsies (5 cases) and a
complete metastatic lymph node (1 case). Normal controls and CRC
patients were investigated directly by colonoscopy. The biopsies
were stained with hematoxylin and eosin (H&E) for
histopathological confirmation of the components by a
pathologist.
PBMC isolation
Firstly, whole blood was diluted with an equal
amount of 1X phosphate-buffered saline (PBS). The diluted blood
solution was placed on top of Ficoll-Paque gradient media (GE
Healthcare Bio-Sciences) in tubes for centrifugation at room
temperature for 20 min at 1,020 × g. Next, the PBMCs were carefully
collected from the interface layer between the blood plasma and
Ficoll solution. The collected PBMCs were washed with 1X PBS and
then centrifuged at 640 × g twice, and were then resuspended in
freezing media [10% DMSO in fetal bovine serum (FBS; Thermo Fisher
Scientific, Inc.)] at a concentration of 1×10⁷ PBMCs/ml
(12).
Cell lines and co-culture
conditions
The following human CRC cell lines were obtained
from the American Type Culture Collection (ATCC): SW480
(ATCC® CCL-228™), representing early-stage CRC in a
50-year-old male and HT29 (ATCC® HTB-38™), representing
early-stage CRC in a 44-year-old female. All cell lines were grown
in Dulbecco's modified Eagle's medium (DMEM; Gibco; Thermo Fisher
Scientific, Inc.) supplemented with 10% FBS, 0.1 mg/ml
streptomycin, and 100 U/ml penicillin at 37°C in a humidified
atmosphere (95% air: 5% CO2). The cell lines were grown
in 25 CC culture flasks (Corning Inc.) and were harvested at 80%
confluence with 0.05% trypsin. The cell lines were washed with 1X
PBS.
The co-culture technique was used to study the
effects of substances released from CRC cells and PBMCs. Cancer
cells and PBMCs were co-cultured in Transwell® culture
plates (Costar; Corning Inc.). CRC cells were seeded in 24-well
culture plates (5×10⁴ cells/well), which were then
filled with medium (DMEM with 10% FBS) and incubated in a
CO2 incubator at 37°C in a humidified atmosphere for 24
h. PBMCs were co-cultured with CRC cells in permanent membrane
cultures (1×10⁵ cells/well), which were incubated for 4
h in a CO2 incubator at 37°C in a humidified atmosphere
before harvesting for DNA extraction.
DNA extraction
In the present study, genomic DNA was extracted from
two sample types: Co-cultured PBMCs and blood samples. The
co-cultured PBMCs were centrifuged at 700 × g for 15 min and the
supernatant was discarded. The PBMC pellets were then washed with
1X PBS and centrifuged 700 × g for 15 min. The blood samples were
added to an equal amount of red blood cell lysis buffer to lyse the
red blood cells, then centrifuged at 700 × g for 15 min; the
resulting supernatant was discarded. The WBC pellets were washed
with 1X PBS and centrifuged at 700 × g for 15 min twice. All cell
pellets were supplemented with 500 µl of extraction buffer
containing 10% SDS and proteinase K 0.5 mg/ml. Then, the cell
solutions were mixed together and incubated for 72 h in a water
bath at 50°C. The DNA was extracted using a phenol: Chloroform:
Isoamyl alcohol (25:24:1) solution and the mixtures were
centrifuged at 4°C and 14,000 × g for 15 min. The upper aqueous
phase was carefully collected and transferred to a fresh tube, and
then absolute ethanol was added for DNA precipitation before
centrifugation at 4°C and 14,000 × g for 15 min. The supernatant
was discarded and the DNA was washed with 70% ethanol at 4°C then
centrifuged at 14,000 × g for 15 min twice. The obtained DNA was
air-dried and then dissolved in distilled water. DNA samples were
converted by sodium bisulfite treatment using the EZ DNA
Methylation-Gold™ kit (Zymo Research Corp.) according to the
manufacturer's instructions.
Methylation microarray
The genome-wide DNA methylation profiling of the
co-cultured PBMCs was carried out using the recently developed
Illumina Infinium MethylationEPIC BeadChip (Illumina, Inc.), which
accesses the DNA methylation profile across ~850,000 CpGs. Samples
in the present study included duplicate female control PBMCs and
duplicate male control PBMCs. The duplicate female PBMCs were
co-cultured with HT29 cells and the duplicate male PBMCs were
co-cultured with SW480 cells. The methylation profiling obtained in
the present study is available in the Gene Expression Omnibus (GEO)
database under the reference, GSE110274.
Retrieval of data from GenBank
Gene expression profiles obtained by microarray were
obtained from GEO datasets (www.ncbi.nlm.nih.gov/gds) using keywords including
‘colorectal cancer’ and ‘blood’. GSE11545 (Applied Biosystems;
Thermo Fisher Scientific, Inc.) (13) and GSE10715 (Affymetrix; Thermo Fisher
Scientific, Inc.) (14) were used to
represent the expression profiling of peripheral blood samples.
GSE110274 (Illumina, Inc.) is the methylation profile obtained from
the present experiment with co-cultured PBMCs.
CU-DREAM
In the present study, gene expression probes were
always in genes and were tagged with their host genes. Unlike the
expression probes, some methylation probes were in genes, while
some methylation probes were not. The methylation probes were
classified by their location. Intragenic probes were in genes and
upstream probes were located 5,000 bp upstream of genes. All
intragenic and upstream probes were tagged with their host genes. A
comparison between experimental and control groups resulted in
upregulated (up) or downregulated (dn) or ‘neural’ at every probes.
A gene was said to be ‘up’ if there was at least a single probe in
which the level of the experimental group was significantly higher
(Student's t-test). The association between gene expression and
methylation was identified by means of 2×2 contingency tables. A
table consisted of 4 numbers denoted by a, b, c and d. The first
and the second rows were up- or down-methylated genes and the rest,
respectively. The first and the second columns were up- or
down-expressed genes and the rest, respectively. Each 2×2
contingency table produced odds ratios (ORs) and Chi-square
P-values (11).
RT-MSP of MMP9 and procollagen-lysine,2-oxoglutarate
5-dioxygenase 1 (PLOD1). The present study examined the methylation
status of genes including MMP9 and PLOD1 in the WBCs
from patients with CRC and normal controls using RT-MSP. The PCR
Master Mix was prepared using PowerUp™ SYBR® Green
Master Mix (Thermo Fisher Scientific, Inc.) with primer sets
specific for methylated bisulfite-modified DNA for the
quantification of methylation levels and unmethylated
bisulfite-modified DNA as an internal control. The PCR reactions of
MMP9 and PLOD1 were quantified using Applied
Biosystems QuantStudio 6 Flex Real-Time PCR System (Thermo Fisher
Scientific, Inc.). For each gene, the primers were designed from
the CpG position in the intragenic region. The primer sequences for
MMP9 amplification were: Forward methylated primer,
5′-TTGTTATTTTTTTTTTATTTTCGAGGGTC-3′ and reverse methylated primer,
5′-GTAATACTACACCAAAACAAACCG-3′; forward unmethylated primer,
5′-GTTTGTTATTTTTTTTTTATTTTTGAGGGTT-3′ and reverse unmethylated
primer, 5′-TTTTTCATAATACTACACCAAAACAAACCA-3′. The thermocycling
conditions for MMP9 were as follows: 45 cycles of 95°C for
45 sec and 54°C for 45 sec. The primer sequences for PLOD1
amplification were: Forward methylated primer,
5′-TAAAAGGTTATTTGATTTTTGATGTC-3′ and reverse methylated primer,
5′-TCAAAAAAACAAAAAAACCTACG-3′; forward unmethylated primer,
5′-TTGTAAAAGGTTATTTGATTTTTGATGTT-3′ and reverse unmethylated
primer, 5′-TTTTTCTCAAAAAAACAAAAAAACCTACA-3′. The thermocycling
conditions for PLOD1 were as follows: 45 cycles of 95°C for
45 sec and 54°C for 45 sec.
The DNA methylation levels for each sample were
measured and compared to standard curves for methylated MMP9
and PLOD1. Firstly, the standard curves were created using
completely methylated bisulfite converted DNAs (Qiagen, Inc.)
diluted to give DNA concentrations of 10, 1, 0.1 and 0.01 ng/µl,
respectively. The diluted DNA samples were then subjected to
RT-MSP, and the MMP9 and PLOD1 methylation levels
were calculated from the obtained Cq values. The formulae for the
standard curves for methylated MMP9 and PLOD1 were
y=3×1028xX−20.22 (Fig. S1) and
y=4×1024xX−17.09 (Fig. S2), respectively. Thus, the Cq values
for each sample can be measured for the absolute quantification of
DNA methylation levels (15).
Immunohistochemistry
FFPE tissue samples were embedded in paraffin
according to the protocol used in the Surgical Pathology
Department. Sections (3 µm) were fixed in formalin solution and
dehydrated in alcohol solution. The sections were then incubated
with rabbit polyclonal anti-MMP9 (dilution 1:500; cat. no.
HPA001238; Sigma-Aldrich; Merck KGaA) for 1 h for detection.
Immunohistochemical staining was performed using an ultraView
Universal 3,3′-diaminobenzidine tetrahydrochloride (DAB) Detection
kit (Roche Diagnostics) containing horseradish peroxide and DAB,
followed by counterstaining with hematoxylin on a BenchMark XT
(Roche Diagnostics) automated system. The positive WBCs can be
visualized by a brown colored precipitate.
Statistical analysis
All statistical analyses were performed using SPSS
for Windows, version 17.0 (SPSS Inc.). The mean and the standard
error of the mean (SEM) were calculated and Student's t-tests were
performed to determine significant differences in methylation
changes in the WBCs from patients with CRC and normal controls. The
P-values obtained were two-sided and P<0.05 was considered to
indicate a statistically significant difference. Receiver operating
characteristic (ROC) curve analysis was carried out to
differentiate the capacities of MMP9 and PLOD1 for
methylation changes between patients with CRC and normal
controls.
Results
Bioinformatics analysis of DNA
methylation and mRNA array profiling
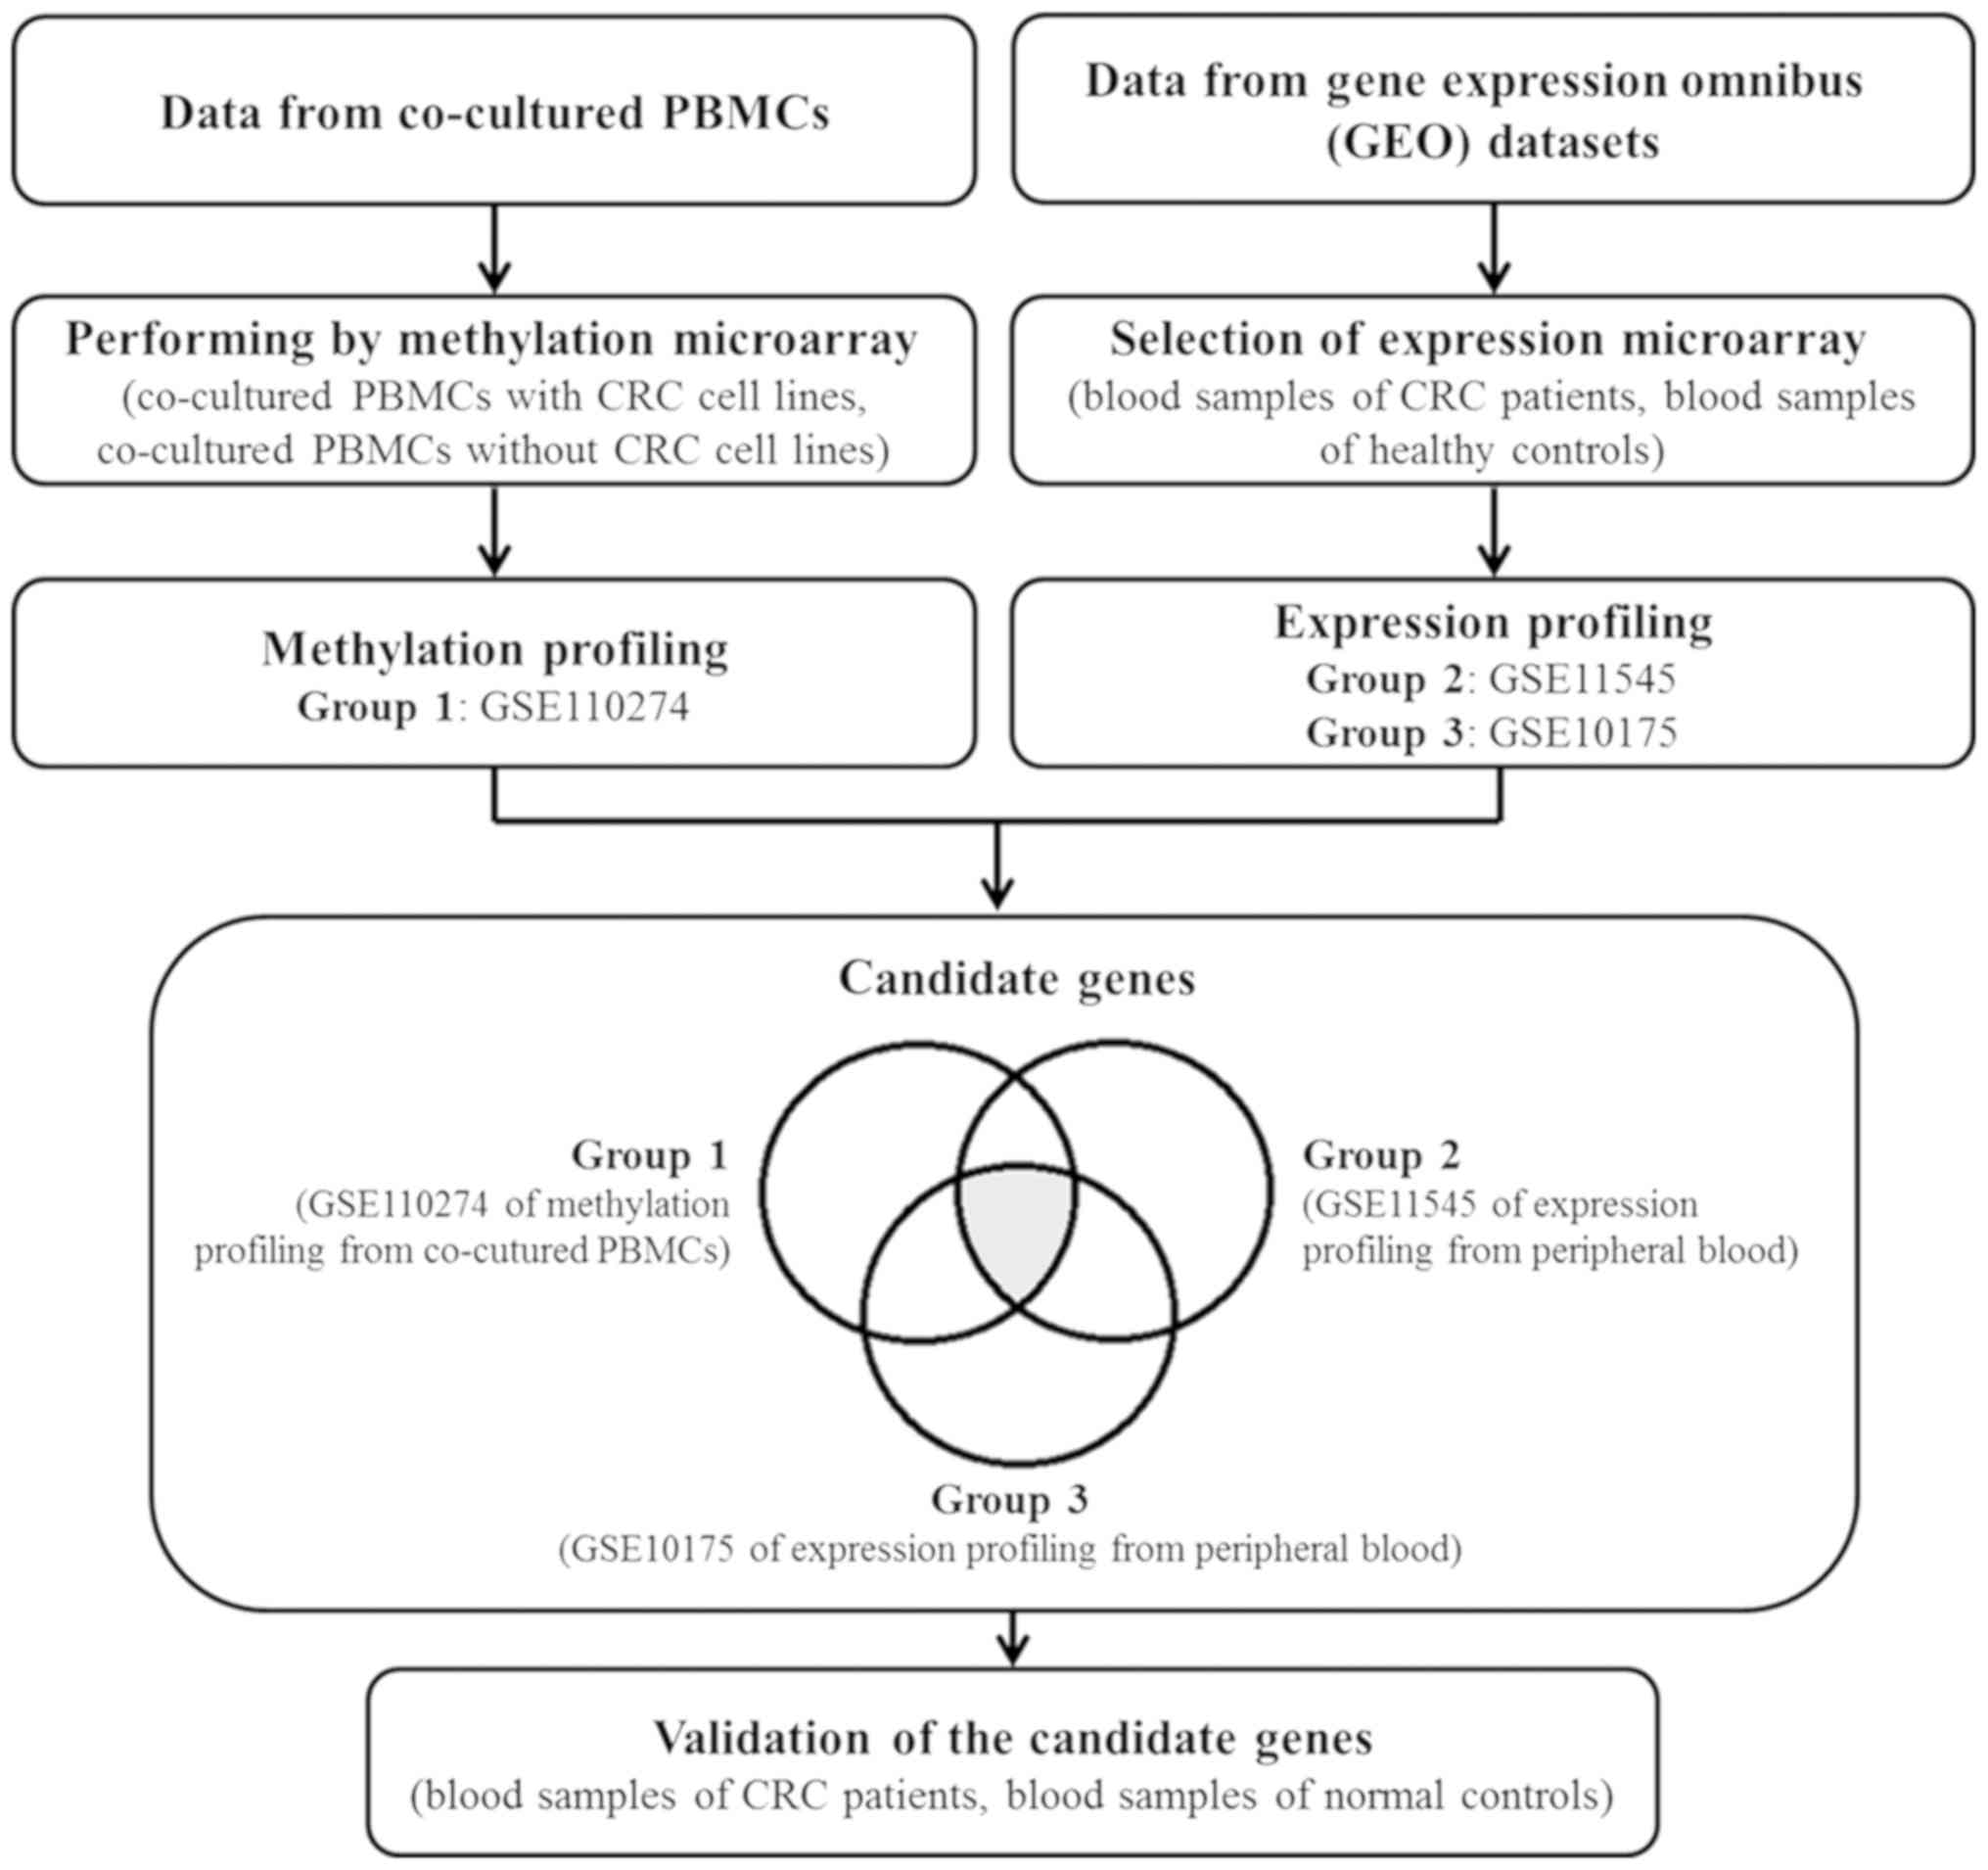
The flowchart in Fig.
1 illustrates the process followed in the present study. The
methylation profile of Group 1 (GSE110274) from co-cultured PBMCs
and the RNA expression profiles of Groups 2 and 3 (GSE11545 and
GSE10715) from peripheral blood samples were interpreted to
identify the genes in common using CU-DREAM analysis. The candidate
genes were hypermethylated and upregulated genes from group (a)
with a P<0.01 and an OR of >1. The results of the analysis
are presented in Tables I and
SI, along with the P-values, ORs,
and 95% confidence intervals (95% CIs). Genes from the PBMCs that
were methylated at intragenic locations as a result of co-culturing
with CRC cell lines were found to be upregulated in the WBCs of CRC
patients (P<3×10⁻¹⁴). An association between the DNA
methylation of upstream locations and upregulation was also
observed (P<4×10⁻³).
 | Table I.Connection up- and down- regulation
expression analysis of microarrays of DNA methylation changes
(GSE110274) and mRNA levels in the white blood cells of patients
with colorectal cancer (GSE11545 and GSE10715). |
Table I.
Connection up- and down- regulation
expression analysis of microarrays of DNA methylation changes
(GSE110274) and mRNA levels in the white blood cells of patients
with colorectal cancer (GSE11545 and GSE10715).
| Experiments | MET+, RNA+ | MET+, RNA- | MET-, RNA+ | MET-, RNA- | Lower 95% CI | Upper 95% CI | Odds ratio | P-value |
|---|
| Intragenic_
Group1_up & Group2_up | 760 | 7,252 | 292 | 5,369 | 1.68 | 2.22 | 1.93 |
8.52×10⁻²¹ |
| Intragenic_
Group1_up & Group3_up | 1,273 | 8,994 | 636 | 6,609 | 1.33 | 1.63 | 1.47 |
3.70×10⁻¹⁴ |
| Upstream_ Group1_up
& Group3_up | 824 | 5,556 | 1,064 | 9,971 | 1.26 | 1.53 | 1.39 |
2.17×10⁻¹¹ |
| Upstream_ Group1_up
& Group2_up | 489 | 5,297 | 561 | 7,295 | 1.06 | 1.36 | 1.20 |
4.54×10⁻³ |
The candidate genes were selected from overlapping
genes from the 3 data groups and were classified by biological
process based on gene ontology, as shown in Table II. The validation genes were
selected based on gene function, biological process, and the
reported literature. PLOD1 was selected as a validation gene
from genes overlapping the 3 data groups: GSE110274, GSE11545, and
GSE10715. MMP9 was selected as a validation gene from the
two data groups: GSE110274 and GSE10715.
| Table II.Candidate genes determined by
biological process from Gene Ontology. |
Table II.
Candidate genes determined by
biological process from Gene Ontology.
| Biological
Process | Gene name |
|---|
| Biological adhesion
(GO:0022610) | VCAN, ICAM3,
ITGA2B, ITGA5, PLOD1, PLXND1, CENTB1 |
| Biological
regulation (GO:0065007) | CAPZB, ECE1, NUCB1,
SSH2, STK24, TNFRSF1A, TYK2, ZFPM1, LPPR2, PLXND1 |
| Cellular component
organization or biogenesis (GO:0071840) | ATXN2, BAP1, CAPZB,
CFL1, CLN6, COTL1, PLXND1, TBL1X, TRIP6, VPS4A, SSH2, STK24 |
| Cellular process
(GO:0009987) | ACRBP, ACTR1A,
ARF3, ARHGAP27, ARHGDIB, ATXN2, B3GNT8, BAP1, CAPZB, CBL, CFL1,
CKAP4, CLN6, COTL1, CTSD, DDEF1, DGAT1, ECE1, ELL, EMILIN2, FMNL1,
GDI1, GNB2, HIRA, ICAM3, LILRB2, LPAR2, LPPR2, LRRC4, MTRF1L,
OTUD5, PARVG, PLP2, PLXND1, PXN, RNF24, RRAGC, SLC16A3, SPEN, SSH1,
STAT5B, STXBP2, TBL1X, TCF7L2, TIMP2, TYK2, UBA7, VCAN, WDR42A,
ZFPM1, ZNF672, EXOC3, LPP, SSH2, STK24 |
| Developmental
process (GO:0032502) | ACRBP, ADAM8,
B3GNT8, EFHD2, FGD2, FGD3, PLXND1, PXN, SSH1, STAT5B, TNFRSF1A,
TRIP6, TYK2, VCAN, WDR42A, ZFPM1, ANKRD11, LPP, PXN, SSH2, STK24,
TRIOBP |
| Immune system
process (GO:0002376) | AZU1, IRF9, STAT5B,
TNFRSF1A, TYK2, ZFPM1 |
| Localization
(GO:0051179) | ACTR1A, ARF3, EHD1,
EXOC7, PLXND1, PRAF2, SLC16A3, SLC35A4, SORL1, STXBP2, TYK2, EXOC3,
RIN3 |
| Locomotion
(GO:0040011) | PLXND1, SEMA4A,
TYK2 |
| Metabolic process
(GO:0008152) | AZU1, B3GNT8, BAP1,
CAPN1, CDA, CKAP4, CLPTM1, DGAT1, DRAP1, ECE1, ELL, GTPBP1, IRF9,
LCAT, LPPR2, LRRC4, MED16, MTRF1L, NADK, PCGF1, PLXND1, PRAF2,
RNF24, RRAGC, RYBP, SLC2A4RG, SLC35A4, SORL1, SPEN, STAT5B, TBL1X,
TCF7L2, TIMP2, TYK2, UBA7, VPS4A, WDR42A, ZNF672, GALNT2, MXD4,
SND1, STK24, ZFPL1, ZFPM1 |
| Multicellular
organismal process (GO:0032501) | ACRBP, ADAM8,
ATXN7L1, BAP1, ECE1, EHD1, GDI1, GNB2, GPSM3, PLXND1, SSH1, STXBP2,
TNFRSF1A, VCAN, ZFPM1, ANKRD11, SSH2, STK24 |
| Reproduction
(GO:0000003) | ACRBP, ADAM8,
B3GNT8 |
| Response to
stimulus (GO:0050896) | LPPR2, LRRC4,
RRAGC, SEMA4A, STAT5B, TCF7L2, TIMP2, TNFRSF1A, TYK2, STK24 |
MMP9 and PLOD1 methylation test by
RT-MSP
MMP9 and PLOD1 were selected to
validate the DNA methylation of the WBCs from 32 CRC patients
(Table SII) and 57 normal controls
by RT-MSP. The present study measured the Cq values of each sample
and then calculated the absolute methylation levels from the
standard curves derived from the Cq values of the diluted
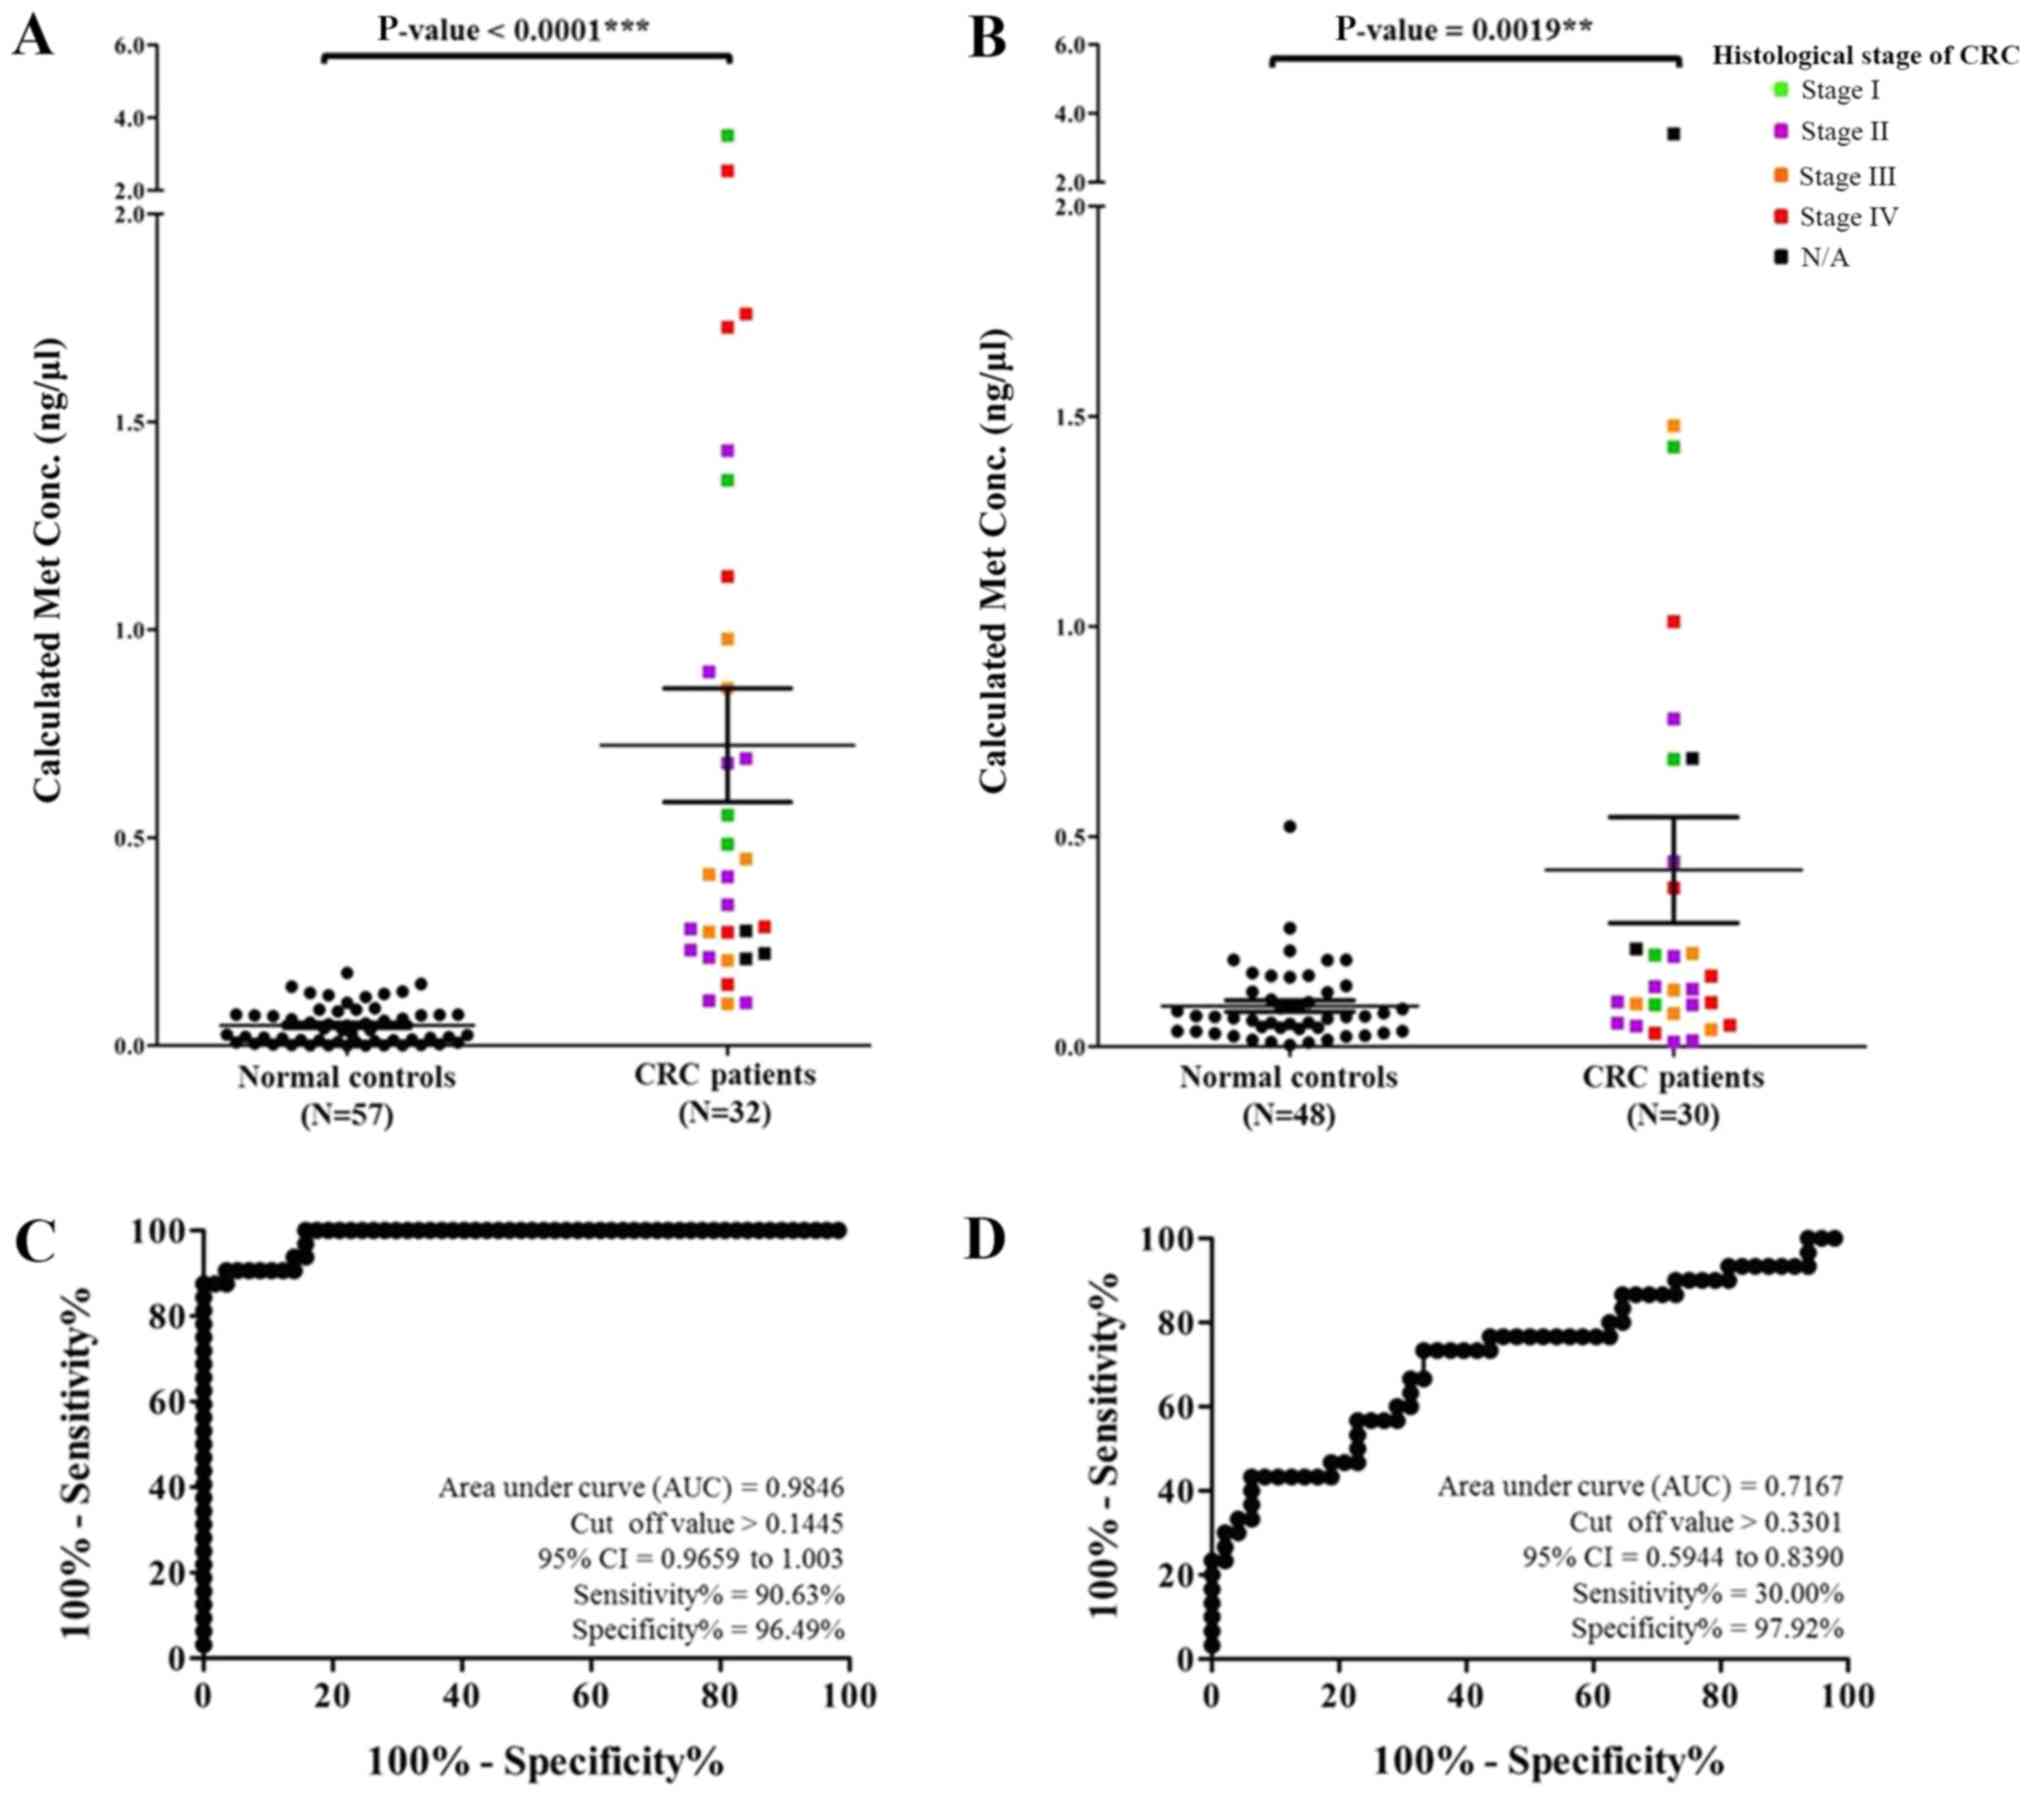
methylated DNA. The concentration of methylated MMP9 of the
samples ranged from 0.0004 to 3.5088 ng/µl. The mean and SEM of the
methylated MMP9 levels from the CRC patients and normal
controls were 0.7226±0.1369 and 0.0487±0.0061 ng/µl, respectively
(P<0.0001), as shown in Fig. 2A.
The comparison of methylated MMP9 levels in CRC patients and
normal controls revealed high sensitivity, specificity, positive
predictive value (PPV), and negative predictive value (NPV) of
90.63, 96.49, 93.33 and 93.22%, respectively, with a cut-off at
0.1445 and area under the ROC curve of 0.9846, as shown in Fig. 2C. Furthermore, the concentration of
methylated PLOD1 of the samples ranged from 0.0044 to 3.4091
ng/µl. The mean and SEM levels of methylated PLOD1 from the
CRC patients and normal controls were 0.4204±0.1259 and
0.0967±0.0131 ng/µl, respectively (P=0.0019), as shown in Fig. 2B. The examination of methylated
PLOD1 revealed low sensitivity and high specificity values
of 30.00 and 97.92%, respectively, with a cut-off at 0.3301 and
area under the ROC curve of 0.7167, as shown in Fig. 2D.
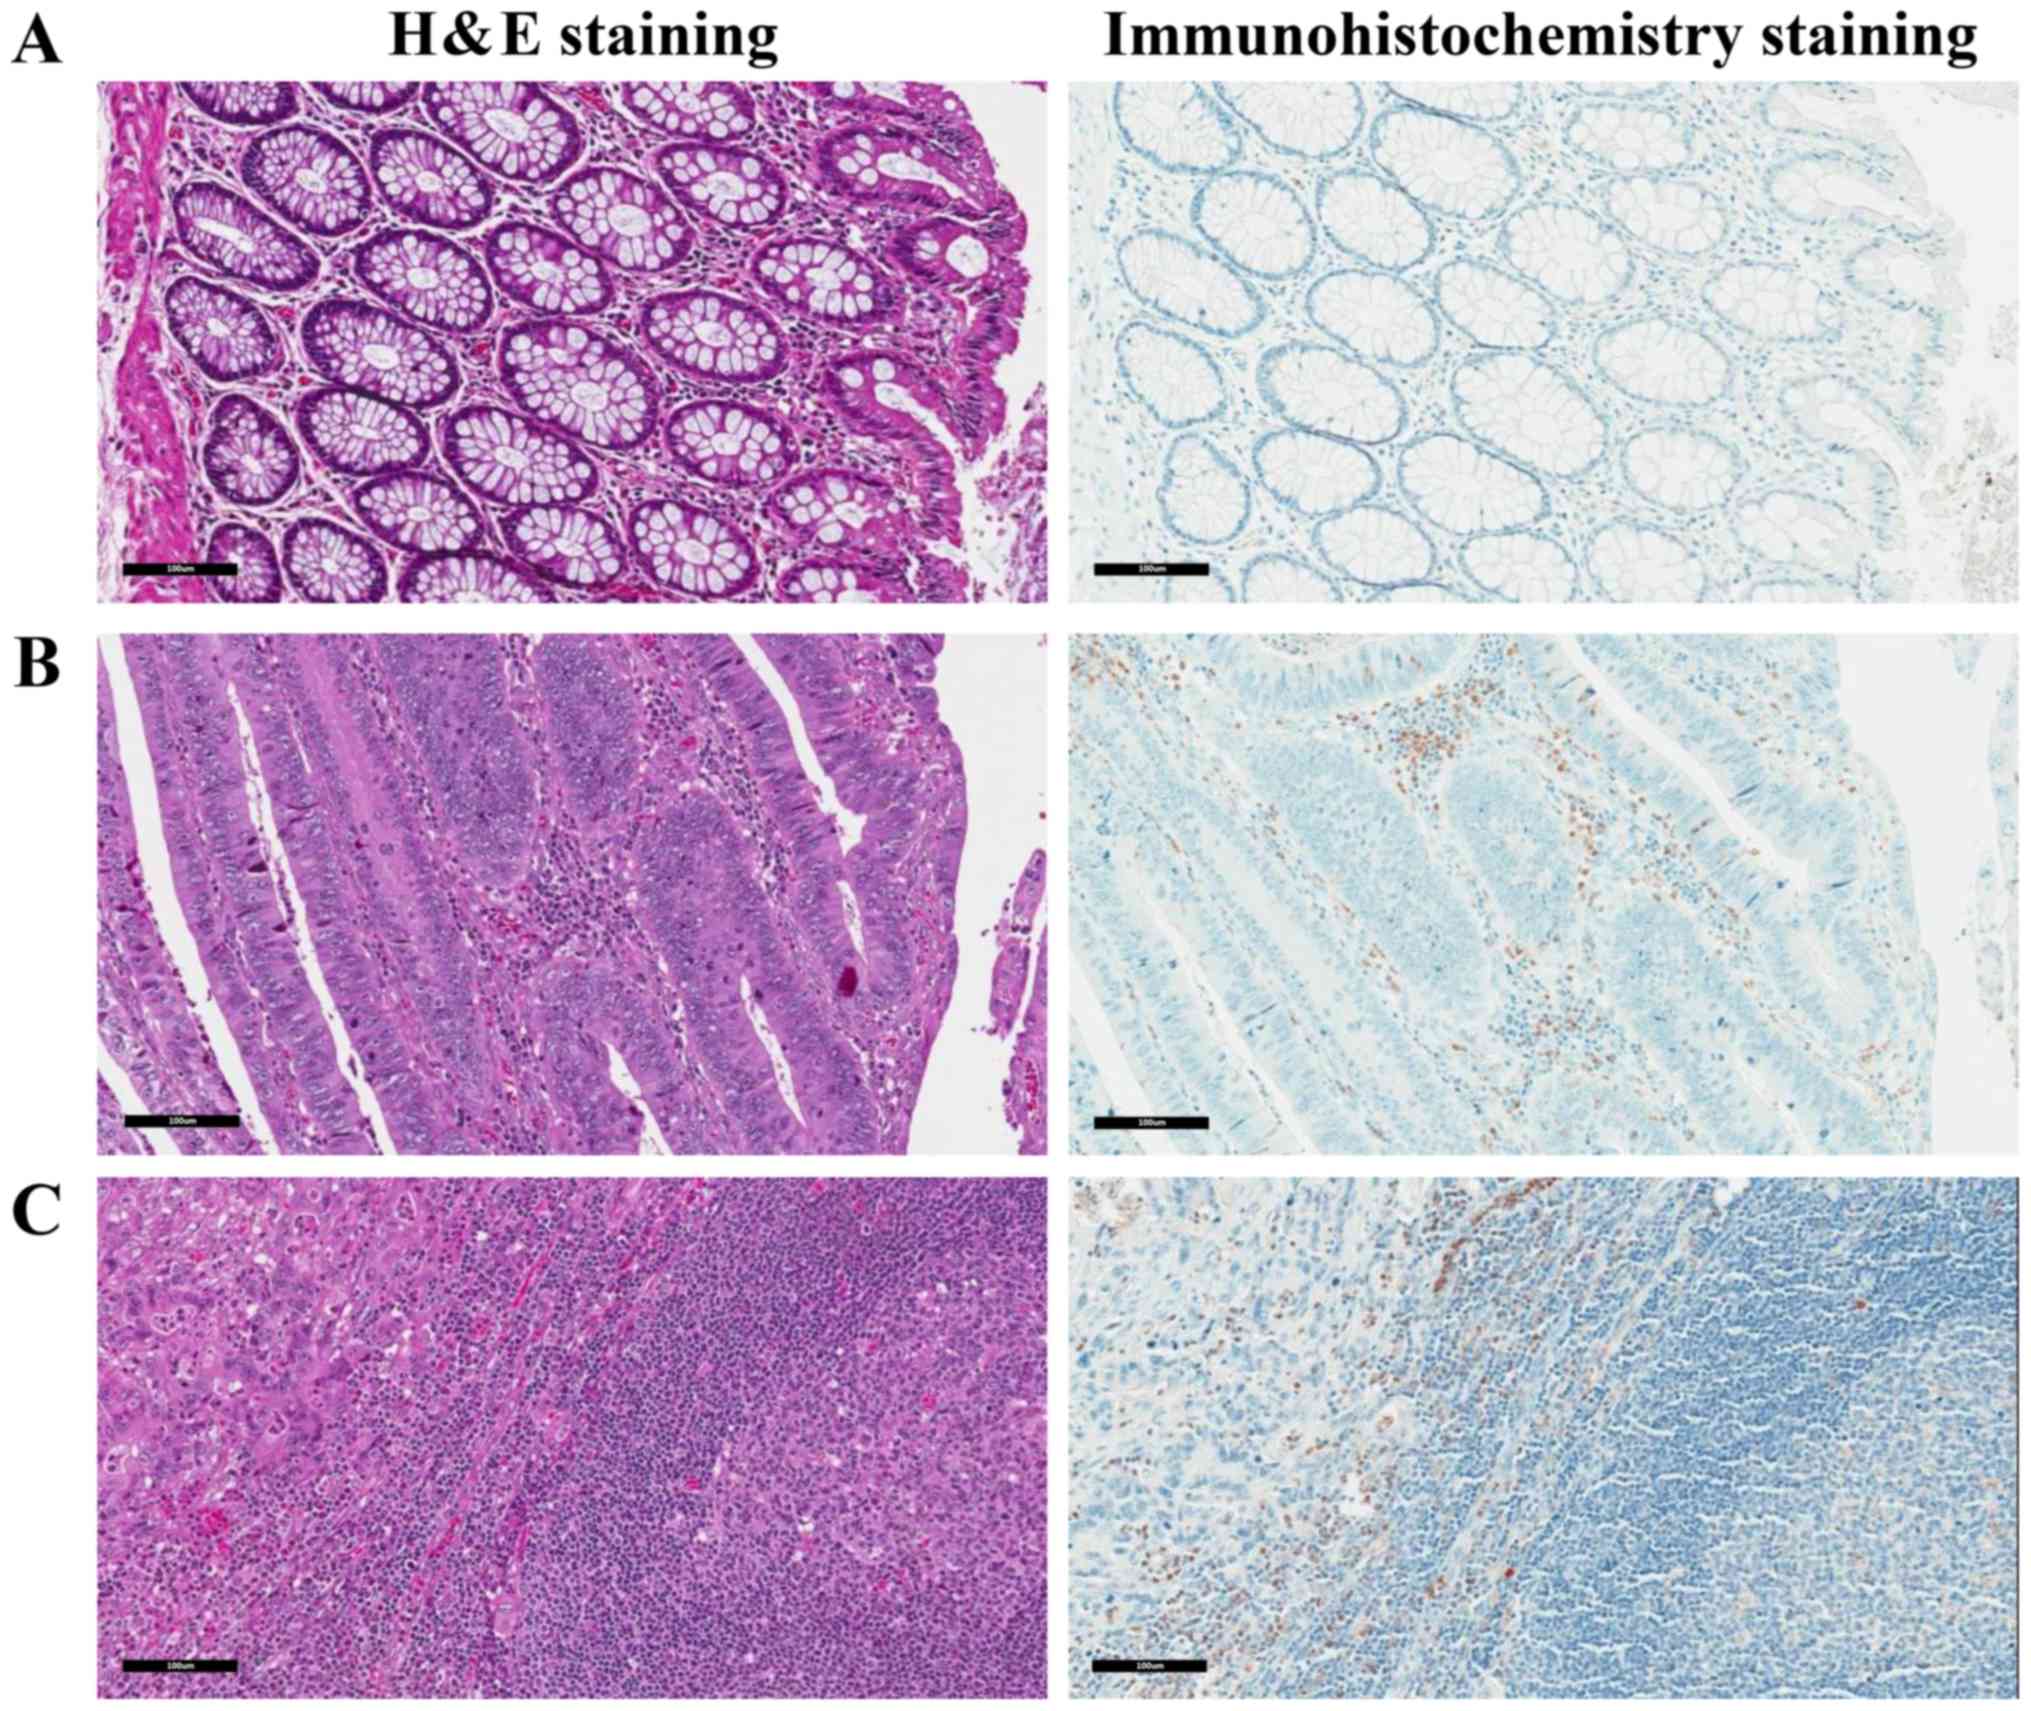
Immunohistochemical staining
differentiates colorectal tissue
The present study validated the expression of MMP9
in WBCs via the immunohistochemical staining of CRC samples. The
samples were stained with H&E and immunostained using
anti-MMP-9 antibody. The normal epithelial area of CRC patients
showed a low number of MMP9-positive WBCs (Fig. 3A). A large number of MMP9-positive
WBCs were observed to infiltrate the WBCs of CRC patients (Fig. 3B). The metastatic lymph node from a
late-stage CRC patient also showed a large number of MMP9-positive
WBCs in the lymph node containing CRC metastases (Fig. 3C).
Discussion
DNA methylation in circulating cells can be derived
from two cell types: Circulating tumor cells and WBCs (16). The number of circulating tumor cells
is generally low and is dependent on the tumor size and metastasis
status. Therefore, circulating cancer cell-derived tumor markers,
in general, have low sensitivity. Previously, we demonstrated that
breast cancer cells secrete factors that promote the expression of
Mucin 1 (MUC1) by plasma cells (B lymphocytes in peripheral
tissues). We also detected a large number of MUC1-positive plasma
cells in micrometastatic lymph nodes (3). Therefore, tumor-induced molecular
changes in WBCs can be used as a highly sensitive tumor marker. As
cell secretion is a biologically active process, a large number of
WBCs receive secretory molecules from cancer cells, regardless of
the tumor size. The present study proved that in addition to
infiltrating cells, CRC secretions can alter circulating WBCs and
these changes can be used as sensitive circulating tumor markers.
However, further exploration is required to determine whether the
induced WBCs were infiltrating WBCs that migrated into the
circulation or if CRC secretions play an endocrine role, targeting
circulating WBCs.
The nature of CRC secretions inducing DNA
methylation in WBC genomes remains to be explored. Several
cytokines, including fibroblast growth factor 2,
granulocyte-macrophage colony stimulating factor, interleukin
(IL)-1β, IL-6, macrophage inflammatory protein-1α, platelet-derived
growth factor-BB, tumor necrosis factor-α, and vascular
endothelial growth factor have been reported at higher levels
in the blood of patients with CRC (17). These cytokines potentially play a
role in the DNA methylation of WBCs. Nevertheless, there are other
types of cancer cell secretory molecules, including microRNA,
exosomes, cells, mRNA, DNA, and proteins (18–20). All
of these molecules should be evaluated to determine if they can
induce DNA methylation.
The most commonly known role of DNA methylation is
the downregulation of gene expression via the methylation of
promoters. CRC secretions were reported to methylate intragenic or
upstream locations and increase mRNA levels. Gene body methylation
sequences are frequently affected in highly expressed genes
(21). The hypomethylated intragenic
LINE-1 was reported to decrease the expression of cancer-associated
genes in the formation of L1-RNA-AGO2 complexes (22,23).
Similarly, the hypermethylated intragenic LINE-1 upregulates genes
from these complexes as well (3).
Hypermethylation in the upstream region was reported to play a role
in regulating alternative promoters (24,25). We
hypothesized that DNA methylation of upstream sequences might lead
to the use of alternate but stronger promoters, resulting in
upstream methylation increasing mRNA levels.
PLOD1 and MMP9 were selected to
represent hypermethylated and upregulated genes for validation. The
present study selected both genes from the results that had the
highest OR and P-value. Both genes were hypermethylated at
intragenic locations in PBMCs and upregulated in WBCs. Primers were
designed for the methylation tests according to MMP9 and
PLOD1 oligonucleotide gene probes. The results of the
methylation test presented hypermethylation. The present study then
examined the protein expression of MMP9 in the WBCs of colon
cancer tissues and lymph nodes of colon cancer patients. The
immunohistochemistry results demonstrated positive staining of MMP9
in WBCs. Thus, these examinations produced similar results. The
methylation of the MMP9 gene is in the gene body and
upregulation of gene body methylation has been reported previously
(21,22).
PLOD1 is related to collagen synthesis and
assembly. This gene has been reported in the literature as being
involved in CRC, especially in tumor progression (26,27).
MMP9 is involved in the degradation of collagen from
extracellular matrix components in normal physiological processes.
Several studies have revealed a correlation between MMP9 and
CRC, including in tumor angiogenesis, tumor invasion and
inflammatory response (28–32). Epigenetic modifications are
significantly involved with gene expression in cancer development
(33). Thus, CRC progression may
alter the epigenetic regulation of these genes.
To the best of our knowledge, this is the first
report of MMP9 and PLOD1 methylation in the PBMCs of
CRC. To apply these biomarkers for screening tests, the present
study selected WBC isolation to examine methylation status, which
is easier and faster than PBMC isolation. We tested the colon
tissues of patients with colon cancer. The results of protein
expression between WBCs and PBMCs revealed similar levels therefore
we chose WBCs instead of PBMCs.
Intragenic methylation of MMP9 is a good
candidate for further clinical studies, including CRC screening,
due to its high sensitivity (90.63%), specificity (96.49%), PPV
(93.33%), and NPV (93.22%). Conversely, the validation results from
the PLOD1 methylation test were unsatisfactory, with low
sensitivity (30.00%) but high specificity (97.92%). These
methylation changes were not found to correlate with tumor grade or
stage. Many biomarkers have been reported for CRC screening. For
example, methylation tests have been reported for the
hypermethylated DNA promoter regions of ALX homeobox 4, bone
morphogenetic protein 3, neuronal pentraxin 2, RARb, Syndecan 2,
SEPT9, and Vimentin, with an overall sensitivity of
90.70% and specificity of 72.50% in plasma samples (34). In particular, SEPT9 was
reported to have a sensitivity of 48.20–90.00% and specificity of
88.00–91.50% (35,36). In global DNA, hypomethylation of
LINE-1 was reported to have a sensitivity of 52.78% and specificity
of 86.81% in blood samples (2,37). The
majority of cases of hereditary CRC syndrome involve point
mutations of tumor-suppressor genes, such as APC and
p53, with detection rates of 30.40 and 34.20%, respectively,
and oncogenes, such as K-ras, with a detection rate of
34.00% and a mutation frequency of 75.00% in tumor tissues found in
serum (38,39). In gene expression tests, MMP2
and MMP9 were significantly expressed in plasma samples
(40). In the protein expression
tests using ELISA in blood samples, TIMP metallopeptidase
inhibitor-1 was reported to have a sensitivity of 63.00% and
specificity of 98.00% (41).
In conclusion, CRC cells release secretions that
induce DNA methylation changes in circulating WBCs. Both upstream
and intragenic methylation of the genes were revealed to be
associated with higher levels of the mRNAs. Finally, CRC-induced
DNA methylation in circulating WBCs is a promising tumor marker for
cancer screening studies.
Supplementary Material
Supporting Data
Acknowledgements
The authors would like to thank Mr. Preecha
Ruangvejvorachai (Department of Patholgy, Faculty of Medicine,
Chulalongkorn University) for his assistance in
immunohistochemistry and Mr. Prakasit Rattanatanyong (Department of
Anatomy, Faculty of Medicine, Chulalongkorn University) for his
technical support.
Funding
The present study was funded by National Research
Council of Thailand, The Thailand Research Fund (grant no.
DPG5980005), The Anantara Siam Bangkok Hotel accompany with The
Four Seasons Hotel Care for Cancer Fun Run in coordination with the
Thai Red Cross Society and Chulalongkorn University.
Availability of data and materials
The datasets used during the present study are
available from the corresponding author on reasonable request.
Authors' contributions
PB performed the experiments, analyzed and
interpreted the data, and wrote the manuscript. PA, NKo and VA
collected the specimens. CA and CP conducted the microarray and
bioinformatics analyses. Nki and AM contributed to the conception
and design of the study, and wrote the manuscript.
Ethics approval and consent to
participate
The present study was approved by the Ethical
Committee of the Faculty of Medicine, Chulalongkorn University (IRB
no. 326/60). All study subjects provided written informed
consent.
Patient consent for publication
Not applicable.
Competing interests
The authors declare that they have no competing
interests.
Glossary
Abbreviations
Abbreviations:
|
CRC
|
colorectal cancer
|
|
WBCs
|
white blood cells
|
|
PBMCs
|
peripheral blood mononuclear cells
|
|
MSP
|
methylation-specific PCR
|
|
LINE-1
|
long interspersed nucleotide
element-1
|
|
CU-DREAM
|
connection up- and downregulation
expression analysis of microarrays
|
|
FFPE
|
formalin-fixed paraffin-embedded
|
|
H&E
|
hematoxylin and eosin
|
|
PPV
|
positive predictive value
|
|
NPV
|
negative predictive value
|
References
|
1
|
Li L, Choi JY, Lee KM, Sung H, Park SK,
Oze I, Pan KF, You WC, Chen YX, Fang JY, et al: DNA methylation in
peripheral blood: A potential biomarker for cancer molecular
epidemiology. J Epidemiol. 22:384–394. 2012. View Article : Google Scholar : PubMed/NCBI
|
|
2
|
Kitkumthorn N, Tuangsintanakul T,
Rattanatanyong P, Tiwawech D and Mutirangura A: LINE-1 methylation
in the peripheral blood mononuclear cells of cancer patients. Clin
Chim Acta. 413:869–874. 2012. View Article : Google Scholar : PubMed/NCBI
|
|
3
|
Puttipanyalears C, Kitkumthorn N,
Buranapraditkun S, Keelawat S and Mutirangura A: Breast cancer
upregulating genes in stromal cells by LINE-1 hypermethylation and
micrometastatic detection. Epigenomics. 8:475–486. 2016. View Article : Google Scholar : PubMed/NCBI
|
|
4
|
Cooper GM and Hausman RE: The development
and causes of cancer. The cell: A molecular approach (2nd).
725–766. 2000.
|
|
5
|
Shussman N and Wexner SD: Colorectal
polyps and polyposis syndromes. Gastroenterol Rep (Oxf). 2:1–15.
2014. View Article : Google Scholar : PubMed/NCBI
|
|
6
|
Bujanda L, Cosme A, Gil I and
Arenas-Mirave JI: Malignant colorectal polyps. World J
Gastroenterol. 16:3103–3111. 2010. View Article : Google Scholar : PubMed/NCBI
|
|
7
|
Ferlay J, Soerjomataram I, Dikshit R, Eser
S, Mathers C, Rebelo M, Parkin DM, Forman D and Bray F: Cancer
incidence and mortality worldwide: Sources, methods and major
patterns in GLOBOCAN 2012. Int J Cancer. 136:E359–E386. 2015.
View Article : Google Scholar : PubMed/NCBI
|
|
8
|
Levin B, Lieberman DA, McFarland B,
Andrews KS, Brooks D, Bond J, Dash C, Giardiello FM, Glick S,
Johnson D, et al: Screening and surveillance for the early
detection of colorectal cancer and adenomatous polyps, 2008: A
joint guideline from the American Cancer Society, the US
Multi-Society Task Force on colorectal cancer, and the American
College of Radiology. Gastroenterology. 134:1570–1595. 2008.
View Article : Google Scholar : PubMed/NCBI
|
|
9
|
Ramsey SD, Burke W, Pinsky L, Clarke L,
Newcomb P and Khoury MJ: Family history assessment to detect
increased risk for colorectal cancer: Conceptual considerations and
a preliminary economic analysis. Cancer Epidemiol Biomarkers Prev.
14:2494–2500. 2005. View Article : Google Scholar : PubMed/NCBI
|
|
10
|
Simon K: Colorectal cancer development and
advances in screening. Clin Interv Aging. 11:967–76. 2016.
View Article : Google Scholar : PubMed/NCBI
|
|
11
|
Aporntewan C and Mutirangura A: Connection
up-and down-regulation expression analysis of microarrays
(CU-DREAM): A physiogenomic discovery tool. Asian Biomed.
5:257–262. 2011. View Article : Google Scholar
|
|
12
|
Mallone R, Mannering SI, Brooks-Worrell
BM, Durinovic-Belló I, Cilio CM, Wong FS and Schloot NC: Isolation
and preservation of peripheral blood mononuclear cells for analysis
of islet antigen-reactive T cell responses: Position statement of
the T-Cell Workshop Committee of the Immunology of Diabetes
Society. Clin Exp Immunol. 163:33–49. 2011. View Article : Google Scholar : PubMed/NCBI
|
|
13
|
Stathopoulos GP and Armakolas A:
Differences in gene expression between individuals with multiple
primary and single primary malignancies. Int J Mol Med. 24:613–622.
2009. View Article : Google Scholar : PubMed/NCBI
|
|
14
|
Galamb O, Sipos F, Solymosi N, Spisak S,
Krenacs T, Toth K, Tulassay Z and Molnar B: Diagnostic mRNA
expression patterns of inflamed, benign, and malignant colorectal
biopsy specimen and their correlation with peripheral blood
results. Cancer Epidemiol Biomarkers Prev. 17:2835–2845. 2008.
View Article : Google Scholar : PubMed/NCBI
|
|
15
|
Angsuwatcharakon P, Rerknimitr R, Kongkam
P, Ridtitid W, Ponauthai Y, Srisuttee R, Kitkumthorn N and
Mutirangura A: Identification of pancreatic cancer in biliary
obstruction patients by FRY site-specific methylation. Asian Pac J
Cancer Prev. 17:4487–4490. 2016.PubMed/NCBI
|
|
16
|
Pixberg C, Raba K, Müller F, Behrens B,
Honisch E, Niederacher D, Neubauer H, Fehm T, Goering W, Schulz W,
et al: Analysis of DNA methylation in single circulating tumor
cells. Oncogene. 36:3223–3231. 2017. View Article : Google Scholar : PubMed/NCBI
|
|
17
|
Krzystek-Korpacka M, Diakowska D,
Kapturkiewicz B, Bębenek M and Gamian A: Profiles of circulating
inflammatory cytokines in colorectal cancer (CRC), high cancer risk
conditions, and health are distinct. Possible implications for CRC
screening and surveillance. Cancer Lett. 337:107–114. 2013.
View Article : Google Scholar : PubMed/NCBI
|
|
18
|
Bhome R, Del Vecchio F, Lee GH, Bullock
MD, Primrose JN, Sayan AE and Mirnezami AH: Exosomal microRNAs
(exomiRs): Small molecules with a big role in cancer. Cancer Lett.
420:228–235. 2018. View Article : Google Scholar : PubMed/NCBI
|
|
19
|
Schwarzenbach H, Hoon DS and Pantel K:
Cell-free nucleic acids as biomarkers in cancer patients. Nat Rev
Cancer. 11:426–437. 2011. View Article : Google Scholar : PubMed/NCBI
|
|
20
|
Villarreal L, Méndez O, Salvans C, Gregori
J, Baselga J and Villanueva J: Unconventional secretion is a major
contributor of cancer cell line secretomes. Mol Cell Proteomics.
12:1046–1060. 2013. View Article : Google Scholar : PubMed/NCBI
|
|
21
|
Ball MP, Li JB, Gao Y, Lee JH, LeProust
EM, Park IH, Xie B, Daley GQ and Church GM: Targeted and
genome-scale strategies reveal gene-body methylation signatures in
human cells. Nat Biotechnol. 27:361–368. 2009. View Article : Google Scholar : PubMed/NCBI
|
|
22
|
Aporntewan C, Phokaew C, Piriyapongsa J,
Ngamphiw C, Ittiwut C, Tongsima S and Mutirangura A:
Hypomethylation of intragenic LINE-1 represses transcription in
cancer cells through AGO2. PLoS One. 6:e179342011. View Article : Google Scholar : PubMed/NCBI
|
|
23
|
23. Kitkumthorn N and Mutirangura A: Long
interspersed nuclear element-1 hypomethylation in cancer: Biology
and clinical applications. Clin Epigenetics. 2:315–330. 2011.
View Article : Google Scholar : PubMed/NCBI
|
|
24
|
Banville D, Stocco R and Shen SH: Human
protein tyrosine phosphatase 1C (PTPN6) gene structure: Alternate
promoter usage and exon skipping generate multiple transcripts.
Genomics. 27:165–173. 1995. View Article : Google Scholar : PubMed/NCBI
|
|
25
|
Vinayanuwattikun C, Sriuranpong V,
Tanasanvimon S, Chantranuwat P and Mutirangura A:
Epithelial-specific methylation marker: A potential plasma
biomarker in advanced non-small cell lung cancer. J Thorac Oncol.
6:1818–1825. 2011. View Article : Google Scholar : PubMed/NCBI
|
|
26
|
Afik R, Zigmond E, Vugman M, Klepfish M,
Shimshoni E, Pasmanik-Chor M, Shenoy A, Bassat E, Halpern Z, Geiger
T, et al: Tumor macrophages are pivotal constructors of tumor
collagenous matrix. J Exp Med. 213:2315–2331. 2016. View Article : Google Scholar : PubMed/NCBI
|
|
27
|
Xiong GF and Xu R: Function of cancer
cell-derived extracellular matrix in tumor progression. J Cancer
Metastasis Treat. 2:357–364. 2016. View Article : Google Scholar
|
|
28
|
Said AH, Raufman JP and Xie G: The role of
matrix metalloproteinases in colorectal cancer. Cancers (Basel).
6:366–375. 2014. View Article : Google Scholar : PubMed/NCBI
|
|
29
|
Illemann M, Bird N, Majeed A, Sehested M,
Laerum OD, Lund LR, Danø K and Nielsen BS: MMP-9 is differentially
expressed in primary human colorectal adenocarcinomas and their
metastases. Mol Cancer Res. 4:293–302. 2006. View Article : Google Scholar : PubMed/NCBI
|
|
30
|
Georgescu EF, Mogoantă S, Costache A,
Pârvănescu V, Totolici BD, Pătraşcu Ş and Stănescu C: The
assessment of matrix metalloproteinase-9 expression and
angiogenesis in colorectal cancer. Rom J Morphol Embryol.
56:1137–1144. 2015.PubMed/NCBI
|
|
31
|
Herszenyi L, Hritz I, Lakatos G, Varga MZ
and Tulassay Z: The behavior of matrix metalloproteinases and their
inhibitors in colorectal cancer. Int J Mol Sci. 13:13240–13263.
2012. View Article : Google Scholar : PubMed/NCBI
|
|
32
|
Shuman Moss LA, Jensen-Taubman S and
Stetler-Stevenson WG: Matrix metalloproteinases: Changing roles in
tumor progression and metastasis. Am J Pathol. 181:1895–1899. 2012.
View Article : Google Scholar : PubMed/NCBI
|
|
33
|
Luczak MW and Jagodziński PP: The role of
DNA methylation in cancer development. Folia Histochem Cytobiol.
44:143–154. 2006.PubMed/NCBI
|
|
34
|
Rasmussen SL, Krarup HB, Sunesen KG,
Johansen MB, Stender MT, Pedersen IS, Madsen PH and
Thorlacius-Ussing O: Hypermethylated DNA, a circulating biomarker
for colorectal cancer detection. PLoS One. 12:e01808092017.
View Article : Google Scholar : PubMed/NCBI
|
|
35
|
Warren JD, Xiong W, Bunker AM, Vaughn CP,
Furtado LV, Roberts WL, Fang JC, Samowitz WS and Heichman KA:
Septin 9 methylated DNA is a sensitive and specific blood test for
colorectal cancer. BMC Med. 9:1332011. View Article : Google Scholar : PubMed/NCBI
|
|
36
|
Church TR, Wandell M, Lofton-Day C, Mongin
SJ, Burger M, Payne SR, Castaños-Vélez E, Blumenstein BA, Rösch T,
Osborn N, et al: Prospective evaluation of methylated SEPT9 in
plasma for detection of asymptomatic colorectal cancer. Gut.
63:317–325. 2014. View Article : Google Scholar : PubMed/NCBI
|
|
37
|
Danese E and Montagnana M: Epigenetics of
colorectal cancer: Emerging circulating diagnostic and prognostic
biomarkers. Ann Transl Med. 5:2792017. View Article : Google Scholar : PubMed/NCBI
|
|
38
|
Wright M, Beaty JS and Ternent CA:
Molecular Markers for Colorectal Cancer. Surg Clin North Am.
97:683–701. 2017. View Article : Google Scholar : PubMed/NCBI
|
|
39
|
Wang JY, Hsieh JS, Chang MY, Huang TJ,
Chen FM, Cheng TL, Alexandersen K, Huang YS, Tzou WS and Lin SR:
Molecular detection of APC, K-ras, and p53 mutations in the serum
of colorectal cancer patients as circulating biomarkers. World J
Surg. 28:721–726. 2004. View Article : Google Scholar : PubMed/NCBI
|
|
40
|
Tutton MG, George ML, Eccles SA, Burton S,
Swift RI and Abulafi AM: Use of plasma MMP-2 and MMP-9 levels as a
surrogate for tumour expression in colorectal cancer patients. Int
J Cancer. 107:541–50. 2003. View Article : Google Scholar : PubMed/NCBI
|
|
41
|
Holten-Andersen MN, Christensen IJ,
Nielsen HJ, Stephens RW, Jensen V, Nielsen OH, Sørensen S,
Overgaard J, Lilja H, Harris A, et al: Total levels of tissue
inhibitor of metalloproteinases 1 in plasma yield high diagnostic
sensitivity and specificity in patients with colon cancer. Clin
Cancer Res. 8:156–164. 2002.PubMed/NCBI
|