Introduction
Mitotic arrest deficiency 2 (MAD2) was the first
mammalian gene of the mitotic spindle checkpoint pathway to be
characterized (1). MAD2 localizes
at kinetochores following chromosome condensation and prior to
anaphase (2), and plays a
significant role in the transition from metaphase to anaphase by
inhibiting the anaphase promoting complex/cyclosome (APC/C). This
process ensures that all the chromosomes are correctly aligned at
the metaphase plate prior to daughter cell segregation (3,4).
Therefore, MAD2 is a key component of the mitotic spindle
checkpoint pathway, which plays a crucial role in preventing loss
or gain of chromosomes within cells (5). A compromised mitotic spindle
checkpoint results in an abnormal number of chromosomes, known as
chromosomal instability (CIN) (6).
CIN, characterized by an alteration in chromosome number and
commonly detected as aneuploidy (7,8), has
been reported in most types of human cancer. Although the
underlying molecular mechanisms have yet to be clarified, it is
notable that the overexpression of MAD2 in transgenic mice results
in CIN, and initiates carcinogenesis in a wide variety of tumors
(9). Another study showed that MAD2
is critical for the malignant transformation of epithelial cells,
promoting aneuploidy and predisposing human prostate epithelial
cells to carcinogen-induced malignant transformation (10). This finding suggests that a
compromised mitotic spindle checkpoint, through the overexpression
of MAD2, may be a significant step in the malignant progression of
human cancer. Overexpression of MAD2 is observed in a variety of
cancer (11–21). Certain reports suggested a
correlation between the overexpression of MAD2 and a variety of
clinicopathological characteristics, such as histological grade
(differentiation), metastasis and prognosis (14–20).
Almost all of these studies have concluded that the overexpression
of MAD2 is a risk factor for poor prognosis. Therefore, the
overexpression of MAD2 induces not only carcinogenesis, but also
cancer progression.
Ovarian epithelial carcinoma is classified into four
morphologically distinct categories: serous, mucinous, endometrioid
and clear cell. Each category may be histopathologically
sub-classified into benign, malignant, and borderline or low
malignant potential (LMP). Mucinous tumors of the ovary account for
12–15% of all ovarian neoplasms, the majority being benign
(approximately 75%). Borderline and adeno-carcinoma account for 10
and 15% of cases, respectively (22). Almost all mucinous borderline tumors
are classified as stage I based on the International Federation of
Gynecology and Obstetrics (FIGO) criteria and have an excellent
prognosis following surgical treatment. The corrected actuarial
survival rates are 98% at 5 years and 96% at 10 years (23,24).
Late-stage mucinous ovarian carcinomas are extremely rare and have
a poor prognosis since they respond poorly to first-line
platinum-based chemotherapy compared with other epithelial ovarian
tumors (25). Mucinous ovarian
tumors have unique clinicopathological characteristics associated
with the development and progression of mucinous ovarian carcinoma.
A number of studies have suggested that, unlike other histologic
subtypes such as serous tumors, a proportion of mucinous ovarian
carcinomas progress from a benign cyst to a borderline tumor prior
to developing into a carcinoma. The coexistence of cells within
mucinous ovarian tumors with varying degrees of malignancy
increases the possibility of disease progression (26,27).
Previous findings have shown that a k-ras mutation may be an early
event in mucinous ovarian tumorigenesis as the same k-ras mutations
were observed in benign and borderline regions (27). Results of another study have
indicated that benign tumors co-expressed a subset of genes that
were differentially regulated in borderline tumors and carcinomas
(28).
In this study, we examined the expression of MAD2 in
mucinous ovarian tumors with varying degrees of malignancy.
Materials and methods
Patients and samples
We reviewed 128 cases of mucinous ovarian tumor
initially treated at Osaka City University Medical School Hospital,
Japan, between 1999 and 2010. Tumor samples were obtained following
primary surgery. The cases were divided into three groups: benign
(group B; n=30), borderline malignant (group BM; n=55) and
malignant (group M; n=43). Based on the FIGO criteria, the cases in
group BM were classified as stage I (n=52), stage II (n=1), stage
III (n=2) and stage IV (n=0), and the cases in group M as stage I
(n=25), stage II (n=8), stage III (n=8) and stage IV (n=2)
(Table I). Written informed consent
was obtained from all patients prior to immunohistochemical
examination, and this study was approved by the Ethics Committee of
Osaka City University (IRB no. 2180).
 | Table IPatient characteristics. |
Table I
Patient characteristics.
| Group B | Group BM | Group M |
|---|
| No. of cases | 30 | 55 | 43 |
| Age |
| Mean | 52.5 | 47.3 | 53.4 |
| Range | 17–70 | 13–88 | 23–78 |
| FIGO stage |
| I | | 52 (94.5%) | 25 (58.1%) |
| II | | 1 (1.8%) | 8 (18.6%) |
| III | | 2 (3.8%) | 8 (18.6%) |
| IV | | 0 (0%) | 2 (4.7%) |
Immunohistochemical analysis
Expression of MAD2 was investigated in
paraffin-embedded sections using a MAD2 antibody and the
avidin-biotin peroxidase complex method. Paraffin sections (4-μm)
were de-paraffinized and immersed in 3% hydrogen peroxidase in
methanol to block endogenous peroxidase activity. An antigen
retrieval procedure was then performed by immersing the slides in
10 mM citrate buffer (pH 6.0) and heating the sections in an
autoclave at 110°C for 20 min. The sections were then washed in
phosphate-buffered saline (PBS). The protocol for the Dako LSAB 2
peroxidase kit (Dako, Kyoto, Japan) was followed.
The sections were incubated with the primary
antibodies for 2 h at room temperature. The primary antibody used
for this study was monoclonal rabbit anti-human MAD2 (1:200;
ProteinTech Group, Chicago, USA). Sections were rinsed with PBS for
15 min and incubated for 10 min with the secondary antibody
(biotinylated goat anti-mouse and rabbit immunoglobulin G; Dako).
The sections were incubated with the streptavidin-peroxidase
complex and 3,3′-diaminobenzidine was used as the chromogen. The
sections were then counterstained with Mayer’s hematoxylin. The
specificity of the immunohistochemical reactions was checked by
omitting the primary antibody. Quantitative analysis of MAD2
expression was based on the scoring method of Sinicrope et
al (29). The mean percentage
of positive tumor cells was determined in five separate areas
(magnification, ×400) and assigned to one of the following
categories: 0, <5%; 1, 5–25%; 2, 25–50%; 3, 50–75%; or 4,
>75%. The intensity of immunostaining was scored as: 1+, weak;
2+, moderate; or 3+, intense. For each specimen, the percentage of
positive tumor cells was multiplied by the staining intensity to
produce a weighted score.
Statistical analysis
The Kaplan-Meier and log-rank tests were used for
the prognostic analyses. StatView 5.0 (Abacus Concepts, Berkley,
CA, USA) was used for data analysis. Statistical significance was
set at <0.05. Continuous variables were expressed as the mean ±
standard deviation (SD) or the mean ± standard error (SE) as shown
in the figures. Weighted scores were compared using the
Mann-Whitney U test and Spearman’s rank correlation
coefficient.
Results
Patient characteristics
We reviewed 128 cases of mucinous ovarian tumors. Of
the 128 cases, 30 cases were benign, 43 cases borderline malignant
and 55 cases were malignant. The mean age group B was 52.5 years
(range 17–70), that of group BM was 47.3 years (range 17–88), and
that of group M was 53.4 years (range 23–78). No significant
difference was observed among the three groups (Table I). There were significantly more
advanced cases in group M than in group BM (P<0.05).
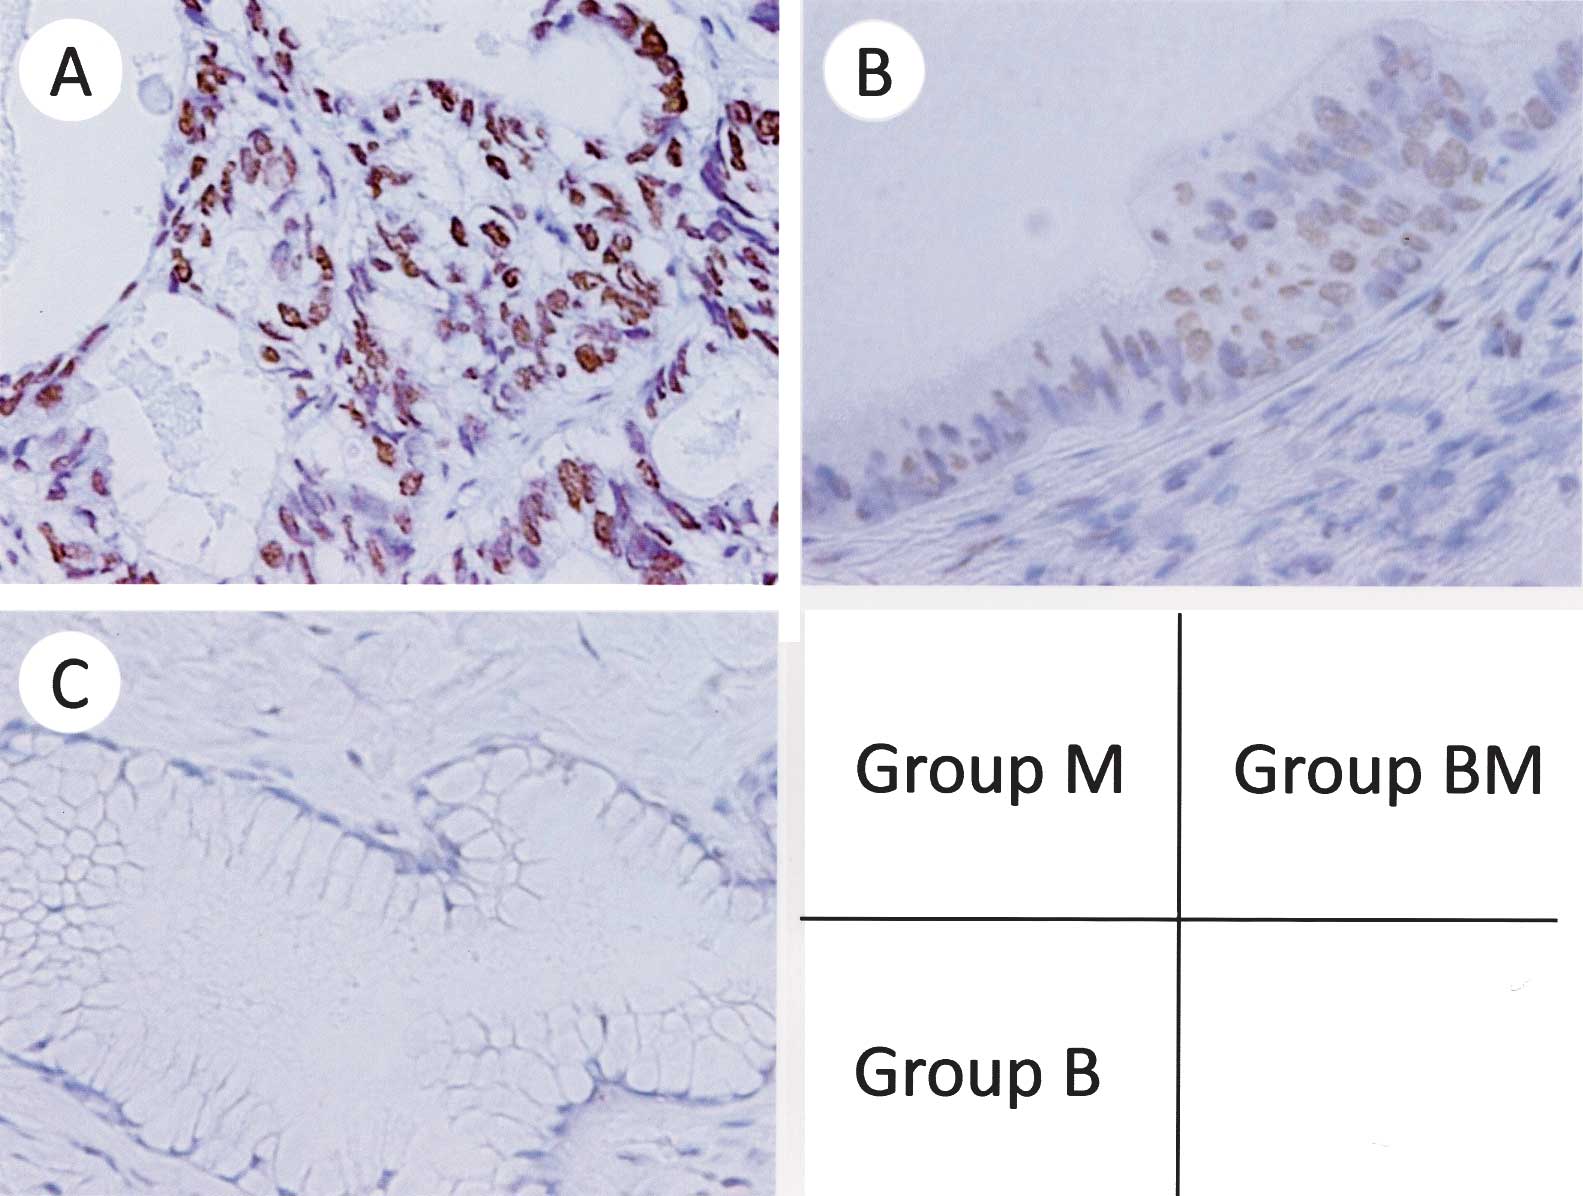
MAD2 expression
MAD2 was expressed in the nuclei of the tumor cells
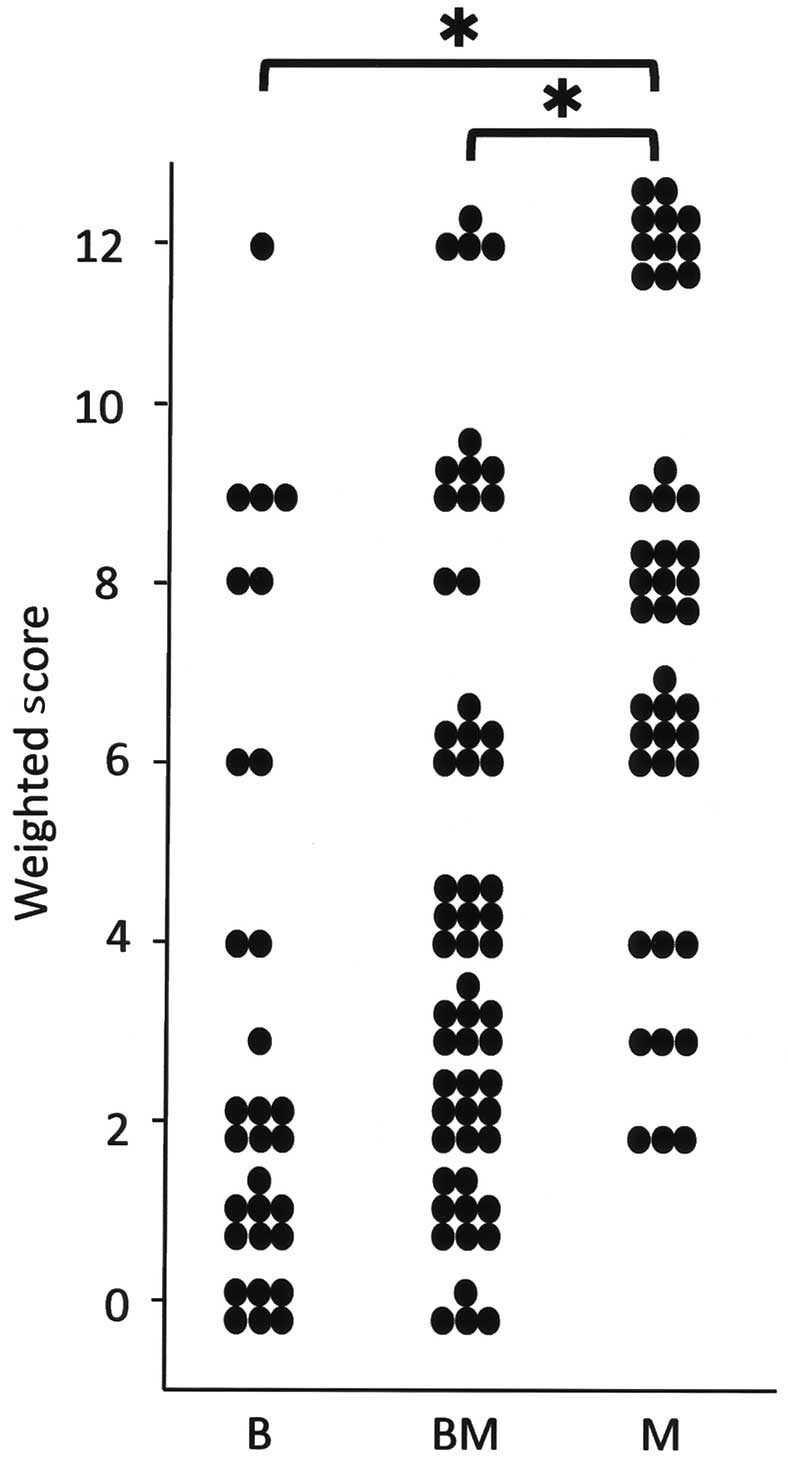
(Fig. 1). The mean weighted score
of group B was 3.2, that of group BM was 4.3, and that of group M
was 7.6 (Table II). MAD2
expression was significantly greater in group M than in groups B
and BM (P<0.05), although MAD2 expression tended to be higher in
group BM than in group B (Fig. 2).
Thus, there was a moderate correlation between MAD2 expression and
the degree of malignancy in mucinous ovarian tumors (r=0.51,
P<0.05).
| Table IIThe weighted scores in groups B, BM
and M. |
Table II
The weighted scores in groups B, BM
and M.
| Weighted-score | No. of cases |
|---|
|
|
|---|
| Group B | Group BM | Group M |
|---|
| 0 | 6 | 19
(63.3%) | 4 | 21
(38.2%) | 0 | 3
(7.0%) |
| 1 | 7 | 8 | 0 |
| 2 | 6 | 9 | 3 |
| 3 | 1 | 5
(16.7%) | 7 | 23
(41.8%) | 3 | 16
(37.2%) |
| 4 | 2 | 9 | 3 |
| 6 | 2 | 7 | 10 |
| 8 | 2 | 6
(20.0%) | 2 | 11
(20.0%) | 9 | 24
(55.8%) |
| 9 | 3 | 4 | 11 |
| 12 | 1 | 5 | 11 |
| Weighted score
mean | 3.2 | | 4.3 | | 7.6 | |
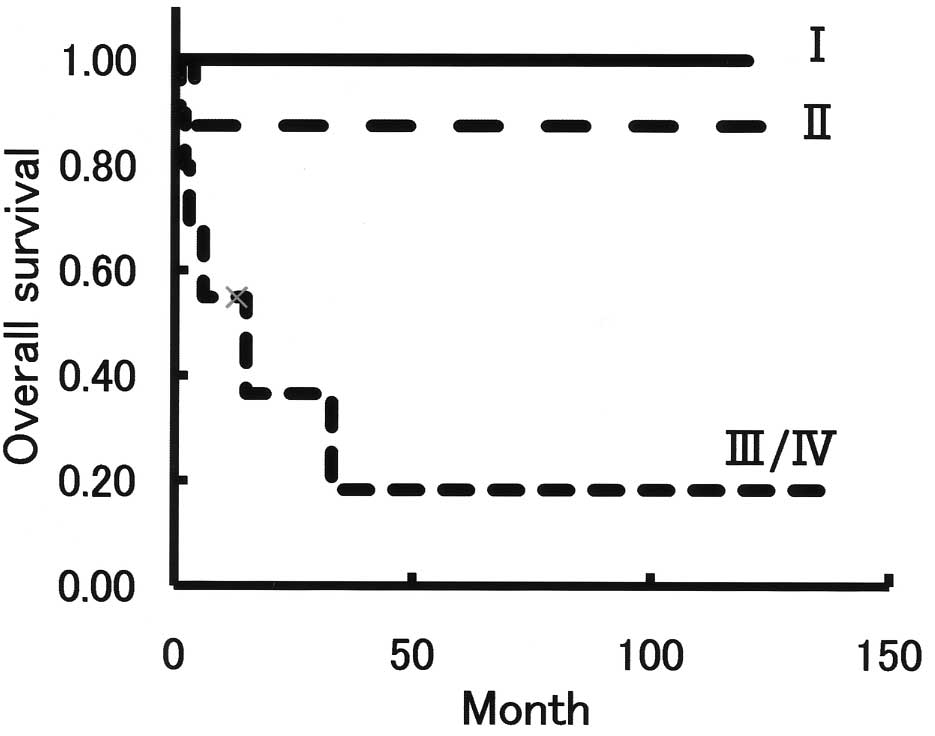
Survival
A total of 43 cases in group M were classified as
stage I (n=25), 8 as stage II and 10 as stage III/IV according to
FIGO criteria. The overall survival for stage III/IV cases was
significantly shorter than that for stages I and II (Fig. 3), with an estimated mean survival of
36 months versus 120 months and 117 months, respectively
(P<0.05).
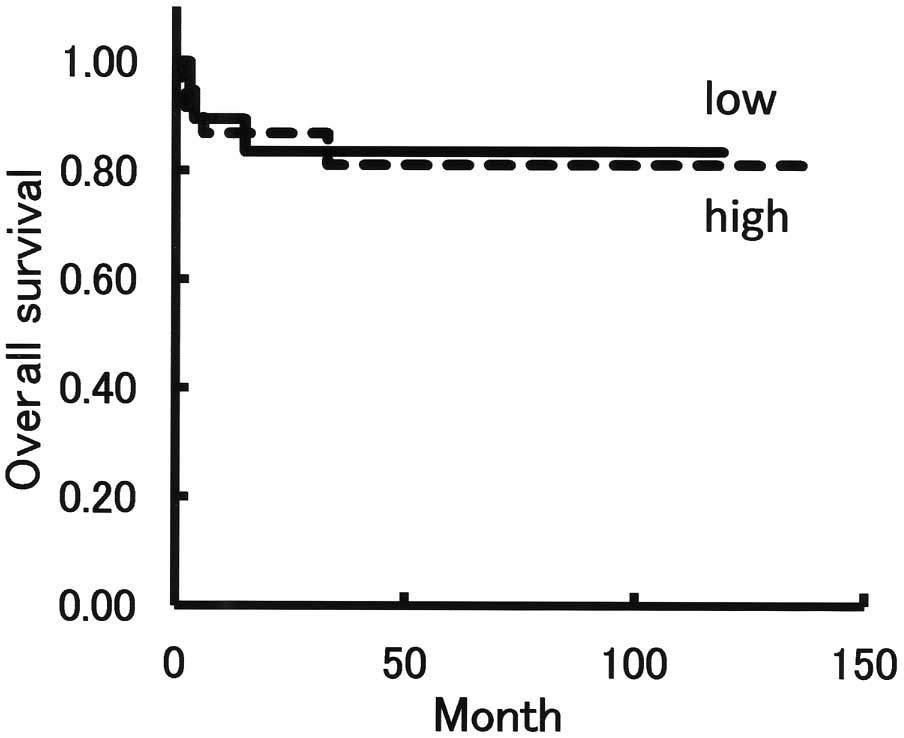
Correlation between clinical background
and the expression of MAD2 in group M
A total of 43 cases within group M were
sub-classified into low expression (n=19) and high expression
(n=24) of MAD2. The weighted scores for the low expression group
were 2–6, and those in the high expression group were 8–12. The
mean age of the low expression group was 53.2 years (range 31–82)
and that of the high expression group was 53.6 (range 23–71). Based
on the FIGO criteria, the low expression cases were classified as
stage I (n=11), stage II (n=6), stage III (n=1) and stage IV (n=1).
The high expression cases were classified as stage I (n=14), stage
II (n=2), stage III (n=7) and stage IV (n=1). Six patients within
the low expression group relapsed, and 3 patients succumbed to the
disease, whereas 4 patients within the high expression group
relapsed and all of them succumbed to the disease (Table III). No difference was found
between the low and high expression groups in terms of overall
survival (Fig. 4), with an
estimated mean survival time of 101 months versus 116 months
(P=0.903).
| Table IIIClinical background of cases in group
M and a low and high expression of MAD2. |
Table III
Clinical background of cases in group
M and a low and high expression of MAD2.
| Low expression
(score: 2,3,4,6) | High expression
(score: 8,9,12) |
|---|
| No. of cases | 19 | 24 |
| Age |
| Mean | 53.2 | 53.6 |
| Range | 31–82 | 23–71 |
| FIGO stage |
| I | 11 | 14 |
| II | 6 | 2 |
| III | 1 | 7 |
| IV | 1 | 1 |
| Overall
survival |
| Mean | 100.6 | 115.8 |
| Range | 3–119 | 1–140 |
| Relapse | 6 | 4 |
| Mortality | 3 | 4 |
Discussion
The aim of the present study was to investigate the
correlation between MAD2 expression and carcinogenesis in mucinous
ovarian tumors. The results show that MAD2 expression was
significantly greater in group M than in groups B and BM. In
addition, MAD2 expression tended to be higher in group BM than in
group B (Fig. 2). Thus, there
appears to be a moderate correlation between MAD2 expression and
the degree of malignancy (Fig. 2).
These findings suggest that the overexpression of MAD2 may be
correlated to carcinogenesis in mucinous ovarian tumors. The benign
epithelium histologically adjacent to the borderline tumor or
carcinoma was also examined in the mucinous ovarian tumors, and the
results have shown that MAD2 expression in the benign epithelium
adjacent to the borderline tumor or carcinoma was higher than that
in the original benign tumor. This suggests the possibility of a
correlation between MAD2 expression and carcinogenesis in mucinous
ovarian tumors.
A number of studies have emphasized the relationship
between the overexpression of MAD2 and a variety of
clinicopathological characteristics, including histologic grade
(differentiation), metastasis and prognosis (14–20).
Almost all of the authors of these studies have concluded that the
overexpression of MAD2 is a risk factor for a high histologic
grade, metastasis (e.g., to lymph nodes) and a poor prognosis. For
example, 48 cases of human osteosarcoma were reviewed and the
incidence of metastasis and survival time was assessed. MAD2 was
expressed in all 48 cases. Cases were classified into three groups
according to the mean percentage of MAD2-positive cells: (+)
25–49%, (++) 50–74%, and (+++) 75–100%. The median metastasis times
for patients with a MAD2 score of 1+, 2+ and 3+ were 62, 54 and 30
months, respectively. The median survival times for patients with a
MAD2 score of 1+, 2+ and 3+ were 75, 54 and 36 months,
respectively. Overexpression of MAD2 was associated with early
metastasis and a poor prognosis (19). In the present study, 48 cases in
group M were sub-classified into low expression (n=19) and high
expression (n=24) groups. The low expression group comprised cases
with a weighted score from 2 to 6, and the high expression group
comprised cases with a weighted score from 8 to 12. However, no
difference was found between the low and high expression groups in
terms of survival (Fig. 4).
Moreover, the overexpression of MAD2 was not associated with any
clinicopathological characteristics (Table III).
Findings of recent reports have shown that, once
neoplastic transformation has occurred, the continued
overexpression of MAD2 is no longer required for tumor maintenance
(9). However, CIN induced by the
overexpression of MAD2 leads to lung tumor relapse following
oncogene withdrawal (21). Thus,
the continued overexpression of MAD2 may be a risk factor for tumor
progression and relapse. In the present study, 48 cases in group M
were sub-classified into relapse (n=10) and non-relapse (n=32)
groups. We then examined the degree of MAD2 expression according to
the weighted scores. No difference was found among the groups (data
not shown). A total of 48 cases in group M were sub-classified
according to FIGO criteria as follows: stage I (n=25), stage II
(n=8), and stage III/IV (n=10). MAD2 expression was then examined
according to the weighted scores. No statistically significant
difference was observed among the groups (Mann-Whitney U test),
although as observed for the stage III/IV, the expression of MAD2
was higher in stage I than in stage II (data not shown). The reason
there was no significant difference is the small number of cases in
group M, particularly stage III/IV cases. If more cases were
included, the difference is likely to significant.
In conclusion, the results of the present study
suggest that the overexpression of MAD2 is present in the majority
of cases of mucinous ovarian carcinoma and may be correlated to the
carcinogenesis of mucinous ovarian tumors. However, the
overexpression of MAD2 may not in itself be sufficient for the
carcinogenesis of mucinous ovarian tumors. Additionally, the degree
of MAD2 expression was not associated with any clinicopathological
characteristics.
Acknowledgements
We thank the gynecologists at Osaka City University
Medical School Hospital for their support. This study was supported
by the Osaka Medical Research Foundation for Incurable
Diseases.
References
|
1
|
Hardwick KG: Checkpoint signaling: Mad2
conformers and signal propagation. Curr Biol. 15:R122–R124. 2005.
View Article : Google Scholar : PubMed/NCBI
|
|
2
|
Lopez-Girona A, Furnari B, Mondesert O and
Russell P: Nuclear localization of Cdc25 is regulated by DNA damage
and a 14-3-3 protein. Nature. 397:172–175. 1999. View Article : Google Scholar : PubMed/NCBI
|
|
3
|
Wang X, Jin DY, Ng RW, Feng H, Wong YC,
Cheung AL and Tsao SW: Significance of MAD2 expression to mitotic
checkpoint control in ovarian cancer cells. Cancer Res.
62:1662–1668. 2002.PubMed/NCBI
|
|
4
|
Li R and Murray A: Feedback control of
mitosis in budding yeast. Cell. 66:519–531. 1991. View Article : Google Scholar : PubMed/NCBI
|
|
5
|
Orr-Weaver TL and Weinberg RA: A
checkpoint on the road to cancer. Nature. 392:223–224. 1998.
View Article : Google Scholar : PubMed/NCBI
|
|
6
|
Yoon DS, Wersto RP, Zhou W, Chrest FJ,
Garret ES, Kwon TK and Gabrielson E: Variable levels of chromosomal
instability and mitotic spindle checkpoint defects in breast
cancer. Am J Pathol. 161:391–397. 2002. View Article : Google Scholar : PubMed/NCBI
|
|
7
|
Lengauer C, Kinzler KW and Vogelstein B:
Genetic instability in colorectal cancer. Nature. 386:623–627.
1997. View
Article : Google Scholar : PubMed/NCBI
|
|
8
|
Lengauer C, Kinzler KW and Vogelstein B:
Genetic instability in human cancer. Nature. 396:643–649. 1998.
View Article : Google Scholar
|
|
9
|
Sotillo R, Hernando E, Diaz-Rodriguez E,
Teruya-Feldstein J, Cordon-Cardo C, Lowe SW and Benezra R: Mad2
overexpression promotes aneuploidy and tumorigenesis in mice.
Cancer Cell. 11:9–23. 2007. View Article : Google Scholar : PubMed/NCBI
|
|
10
|
To-Ho KW, Cheung HW, Ling MT, Wong YC and
Wang X: MAD2ΔC induces aneuploidy and promotes
anchorage-independent growth in human prostate epithelial cells.
Oncogene. 27:347–357. 2008.
|
|
11
|
Alizadeh AA, Eisen MB, Davis RE, et al:
Distinct types of diffuse large B-cell lymphoma identified by gene
expression profiling. Nature. 403:503–511. 2000. View Article : Google Scholar : PubMed/NCBI
|
|
12
|
Chen X, Cheung ST, So S, et al: Gene
expression patterns in human liver cancers. Mol Biol Cell.
13:1929–1939. 2002. View Article : Google Scholar PubMed/NCBI
|
|
13
|
Garber ME, Troyanskaya OG, Schluens K, et
al: Diversity of gene expression in adenocarcinoma of the lung.
Proc Natl Acad Sci USA. 98:13784–13789. 2001. View Article : Google Scholar : PubMed/NCBI
|
|
14
|
Li GQ and Zhang HF: Mad2 and p53
expression profiles in colorectal cancer and its clinical
significance. World J Gastroenterol. 9:1972–1975. 2003.PubMed/NCBI
|
|
15
|
Li GQ and Zhang HF: Mad2 and p27
expression profiles in colorectal cancer and its clinical
significance. World J Gastroenterol. 10:3218–3220. 2004.PubMed/NCBI
|
|
16
|
Zhang SH, Xu AM, Chen XF, Li DH, Sun MP
and Wang YJ: Clinicopathologic significance of mitotic arrest
defective protein2 overexpression in hepatocellular carcinoma. Hum
Pathol. 39:1827–1834. 2008. View Article : Google Scholar : PubMed/NCBI
|
|
17
|
Wang L, Yin F, Du Y, Du W, Chen B, Zhang
Y, Wu K, Ding J, Liu J and Fan D: MAD2 as a key component of
mitotic checkpoint: A probable prognostic factor for gastric
cancer. Am J Clin Pathol. 131:793–801. 2009. View Article : Google Scholar : PubMed/NCBI
|
|
18
|
Tanaka K, Nishioka J, Kato K, Nakamura A,
Mouri T, Miki C, Kusunoki M and Nobori T: Mitotic checkpoint
protein hsMAD2 as a marker predicting liver metastasis of human
gastric cancer. Jpn J Cancer Res. 92:952–958. 2001. View Article : Google Scholar
|
|
19
|
Yu L, Guo WC, Zhao SH, Tang J and Chen JL:
Mitotic arrest defective protein 2 expression abnormality and its
clinicopathologic significance in human osteosarcoma. APMS.
118:222–9. 2010. View Article : Google Scholar : PubMed/NCBI
|
|
20
|
Wu CW, Chi CW and Huang TS: Elevated level
of spindle checkprotein MAD2 correlates with cellular mitotic
arrest, but not with aneuploidy and clinicopathological
characteristics in gastric cancer. World J gastroenterol.
10:3240–3244. 2004.PubMed/NCBI
|
|
21
|
Sotillo R, Schvartzman JM, Socci ND and
Beneztra R: Mad2- induced chromosome instability leads to lung
tumor relapse after oncogene withdrawal. Nature. 464:436–40. 2010.
View Article : Google Scholar : PubMed/NCBI
|
|
22
|
Scully RE, Young RH and Clement PB: Tumors
of the ovary, maldeveloped gonads, fallopian tube and broad
ligament. Atlas of tumor pathology. (3rd series). fascicle 23.
Armed Forces Institute of pathology; Washington DC: 1998,
PubMed/NCBI
|
|
23
|
Hart WR: Borderline epithelial tumors of
the ovary. Mod Pathol. 18:S33–50. 2005. View Article : Google Scholar : PubMed/NCBI
|
|
24
|
Lee KR and Scully RE: Mucinous tumors of
the ovary: a clinicopathologic study 196 borderline tumors (of
intestinal type) and carcinomas, including an evaluation of 11
cases with ‘pseudomyxoma peritonei’. Am J Surg Pathol.
28:1311–1318. 2002.PubMed/NCBI
|
|
25
|
Winter WE, Maxwell GL, Tian C, Carlson JW,
Ozols RF, Rose PG, Markman M, Armstrong DK, Muggia F and McGuire
WP: Prognostic factors for stageIII epithelial ovarian cancer: a
gynecologic oncology group study. J Clin Oncol. 25:3621–3627. 2007.
View Article : Google Scholar : PubMed/NCBI
|
|
26
|
Puls LE, powell DE, DePriest PD, Gallion
HH, Hunter JE, Kryscio RJ and van Nagell JR: Transition from benign
to malignant epithelium in mucinous and serous ovarian
cystadenocarcinoma. Gynecol Oncol. 47:53–57. 1992. View Article : Google Scholar : PubMed/NCBI
|
|
27
|
Garrett AP, Lee KR, Colitti CR, Muto MG,
Berkowitz RS and Mok SC: K-ras mutation may be an early event in
mucinous ovarian tumorigenesis. Int J Gynecol Pathol. 20:244–251.
2001. View Article : Google Scholar : PubMed/NCBI
|
|
28
|
Wamunyokoli FW, Bonome T, Lee JY, Feltmate
CM, Welch WR, Radonovich M, Pise-Masison C, Brady J, Hao K,
Berkowitz RS, Mok S and Birrer MJ: Expression profiling of mucinous
tumors of the ovary identifies genes of clinicopathologic
importance. Clin Cancer Res. 12:690–700. 2006. View Article : Google Scholar : PubMed/NCBI
|
|
29
|
Sinicrope FA, Ruan SB, Cleary KR, Stephens
LC, Lee JJ and Levin B: Bcl-2 and p53 oncoprotein expression during
colorectal tumorigenesis. Cancer Res. 55:237–241. 1995.PubMed/NCBI
|