Introduction
The BTG/Tob family comprises at least six distinct
members in vertebrates, namely BTG1, BTG2/TIS21/PC3, BTG3/ANA,
PC3B, TOB2 and TOB. The family may be divided into two subgroups,
the BTG family and the TOB family (1–3). Both
families have been reported to suppress cell proliferation when
expressed exogenously in cultured cells (4–7). They
commonly share a conserved amino-terminal region known as the BTG
homology domain which is responsible for their antiproliferative
function (8–10).
TOB, a transducer of ErbB-2, also known as TOB1, is
ubiquitously expressed in human adult tissues and was first
identified by screening an expression library that detected
protein-protein interactions with an ErbB2 probe (11). It is located on chromosome 17q21 and
codes for a 45-kDa protein (12).
Its function involves many aspects of the biological process.
First, cell growth suppression is related to gene TOB1 and it is
hampered by the presence of kinase-active
p185erbB2.Co-immunoprecipitate assay showed that p185erbB2 could
directly interact with the carboxyl-terminal half of TOB and
negatively regulated TOB-mediated cell growth suppression (11). Unphosphorylated TOB, the active form
of TOB, is necessary in exerting its antiproliferative effect and
elevated TOB1 phosphorylation abrogates the antiproliferative
effect in lung cancer (13).
Second, previous studies have shown that TOB binds Smad1, Smad5 and
Smad8, and negatively regulates BMP2-dependent bone formation by
inhibiting the transcriptional activity of Smad (14,15).
Third, TOB1 is required for correct dorsoventral patterning through
inhibiting β-catenin transcriptional activity and preventing the
formation of β-catenin/LEF1 complexes (16). Finally, TOB also enhances mRNA
deadenylation in the mRNA decay process by simultaneous interaction
with the poly(A) nuclease complex CCR4-CAF1 and the cytoplasmic
poly(A)-binding protein, PABPC1 (17). In addition, Yoshida et al
reported that mice lacking TOB were prone to spontaneous formation
of tumors and the mRNA was decreased to 4.7–87.3% of the normal
level in 13 of 18 human lung cancers. The mutation analysis
revealed no point mutations or gross aberrations in the TOB gene
(18). TOB also functions as a
tumor suppressor in breast cancer through the modulation and
regulation of multiple signaling pathways and its expression is
inversely correlated with breast cancer progression (12). However, whether TOB is a tumor
suppressor in hepatocellular carcinoma (HCC) has yet to be
elucidated. If it were a tumor suppressor, it is unclear what else
would account for its downregulation, since no mutation was found
in lung cancer.
In order to evaluate whether TOB is a tumor
suppressor, the methylation profiles of 47 CpG sites were examined
in the TOB promoter and nearby coding region and we performed
MassArray methylation analysis in HCC and breast cancer tissues. No
common CpG sites of significant difference in methylation level
between tumor tissues and adjacent normal tissues were found. In
addition, the mRNA expression of TOB was determined by real-time
PCR and restoration experiments were performed with
5-aza-2′-deoxycytidine (5-aza-dC). The real-time PCR assay
documented that the expression of TOB displayed no significant
difference between tumor tissues and adjacent normal tissues and
the restoration experiments demonstrated that methylation of TOB
inhibited its expression in the HepG2 cell line. Generally
speaking, these data illustrated that TOB may be a candidate
non-tumor suppressor in HCC. In addition, survival analysis and
analysis of clinical characteristics using the Chi-square test also
suggested that the TOB gene was not a tumor suppressor in HCC.
Materials and methods
Materials
Informed, written consent regarding the use of the
tissue samples was obtained from each patient prior to the study.
Seventeen breast cancer samples [named as breast (tumor)] and
adjacent matched normal tissues [named as breast (non-tumor)] from
breast cancer patients were collected at Henan Province People’s
Hospital, China. Ethical approval was obtained from the research
ethics committee of the hospital. The cell lines used in this study
were obtained from the Shanghai cell bank of the Chinese Academy of
Sciences (Shanghai, China) (A-375) or were kindly provided by Qing
Sang (Fudan University, Shanghai, China) (MDA-MB-231 and
HepG2).
Patients and follow-up
HCC samples [named as liver (tumor)] and their
adjacent non-tumorous samples [named as liver (non-tumor)] were
obtained from 43 consecutive patients who underwent curative liver
resection for primary tumors between February 2004 and October 2005
at the Liver Cancer Institute (Zhongshan Hospital, Fudan
University, Shanghai, China). HCC diagnosis was based on the
criteria of the World Health Organization. Liver function was
assessed using the Child-Pugh scoring system. Of the 43 patients,
32 had hepatitis B history. Tumor stage was determined according to
the 2010 International Union Against Cancer tumor-node-metastasis
(TNM) classification and the Barcelona Clinic Liver Cancer (BCLC)
staging classification. Tumor differentiation was graded by the
Edmondson grading system. Following surgery, the patients were
monitored until April 2010, with a median follow-up of 53 months
(range, 0.8–71.2 months). The detailed clinicopathological
characteristics are displayed in Table
I (19). Ethical approval was
obtained from the research ethics committee of Zhongshan Hospital,
and written informed consent was obtained from each patient. The
follow-up procedures were carried out as described in the previous
study (20).
 | Table ITOB1 primers used for MassArray
quantitative methylation analysis. |
Table I
TOB1 primers used for MassArray
quantitative methylation analysis.
| Primer | Sequences
(5′–3′) | Length (bp) |
|---|
| meth2s |
aggaagagagAAGTTAAAAGTTTTTAGGTTTGGTATG | 429 |
| meth2a |
cagtaatacgactcactatagggagaaggctTCAACTAAAAATATTACTCACAAATAACA | |
| meth4s |
aggaagagagGGGTAGGTTGTGAAAAAGGTATTTAT | 451 |
| meth4a |
agtaatacgactcactatagggagaaggctTATTAATCACCCCAAAACCTAAACC | |
| meth11s |
aggaagagagTTTAGGTTTTTGATTTGGAAAGTGT | 459 |
| meth11a |
cagtaatacgactcactatagggagaaggctCCAACTTCTCTAAACCTTTTATTTTCA | |
| meth14s |
aggaagagagGGAATAAGATTATTTAAGGTGAAGGA | 474 |
| meth14a |
cagtaatacgactcactatagggagaaggctCACTAATCCCTTTTCACCAATTTAATA | |
| meth17s |
aggaagagagTTAAATTGGTGAAAAGGGATTAGTG | 409 |
| meth17a |
cagtaatacgactcactatagggagaaggctCTAACTACCCAAACCAAACCCATAC | |
DNA/RNA extraction
Genomic DNA was isolated using AxyPrep gDNA
Isolation Mini kit (HD Biosciences Co., Ltd., Shanghai, China). RNA
was extracted using Aqua-SPIN RNA Isolation Mini kit (Watson
Biotechnologies, Inc., Shanghai, China). The concentration and
quality of the isolated DNA and RNA were measured with NanoDrop
ND-1000 spectrophotometer (NanoDrop Technologies, Wilmington, DE,
USA).
Bisulfite conversion and MassArray
quantitative methylation analysis
In total, 33 of the 43 HCC samples and 17 breast
cancer samples were utilized for MassArray quantitative methylation
analysis. Bisulfite treatment of genomic DNA was performed using
the Ez DNA Bisulfite Treatment kit (Zymo Research, Irvine, CA, USA)
as recommended by the manufacturer. Quantitative methylation was
measured using the MassArray compact system, following the
MassCLEAVE training protocol (Sequenom, San Diego, CA, USA) at
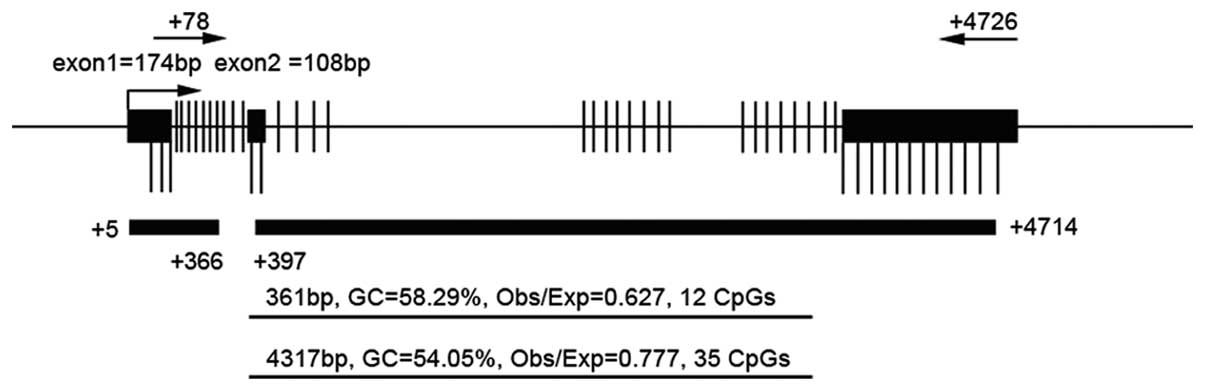
CapitalBio Corporation (Beijing, China). The target CpG island in
the promoter region and nearby coding region are shown in Fig. 1 and the primer pairs in Table I. On the basis of
bisulfite-converted genomic DNA, this system worked by combining
MassCLEAVE base-specific cleavage with MALDI-TOF mass spectrometry,
and the resultant methylation calls were analyzed with EpiTyper
software (Sequenom) to generate quantitative CpG methylation
results.
Real-time PCR
The 43 HCC samples were used for real-time PCR. The
cDNA was synthesized by PrimerScriptRT Reagent kit (Takara Bio
Inc., Otsu, Japan). The TOB1 gene was co-amplified with a fragment
of the glyceraldehyde 3-phosphate dehydrogenase (GAPDH) gene, which
served as an internal standard. Specification of each pair of
primers (Table II) was confirmed by
agarose gel electrophoresis and melting curve analysis. Q-PCR was
conducted by amplifying 1.0 μl of diluted cDNA with the SYBR Premix
Ex Taq kit (Takara Bio Inc.) on the ABI 7900HT Fast Real-Time PCR
system (Life Technologies, Carlsbad, CA, USA). The cycling
conditions of forty cycles of PCR were 95˚C/5 sec, 55˚C/30 sec and
72˚C/30 sec. The amount of specific mRNA was quantified by
determining the point at which the fluorescence accumulation
entered the exponential phase (Ct), and the Ct ratio of the target
gene to GAPDH was calculated for each sample. Each sample was run
in four repeats and all the PCR data were analyzed with the ABI
7900HT system software version 2.3 (21).
| Table IIPrimers used for real-time PCR. |
Table II
Primers used for real-time PCR.
| Gene/primer | Sequence
(5′–3′) | Length (bp) |
|---|
| TOB1 | | |
| tob1s |
GAAAATGGATGTGAGTTGGATAAGG | 198 |
| tob1a |
GGCAGCAAAAGTGGCAGTG | |
| GAPDH | | |
| gapdhs |
CAAGAAGGTGGTGAAGCAGG | 116 |
| gapdha |
CGTCAAAGGTGGAGGAGTGG | |
5-aza-dC treatment
Human cell lines (MDA-MB-231, HepG2 and A-375) were
incubated for 72 h with 50 μM/l 5-aza-dC (Sigma-Aldrich, Steinheim,
Germany) with a medium change every 24 h. RNA was isolated from
treated cells as described above.
Statistical analysis
The methylation rates and real-time PCR results in
two independent sample groups were compared using an independent
samples t-test. SPSS version 15.0 (SPSS Inc., Chicago, IL, USA) was
used for all statistical analyses. The cases with hierarchical
cluster analysis clustered the 32 CpG sites in the TOB1 promoter
based on Euclidean distances and the average linkage clustering
algorithm. This clustering was implemented using Cluster 3.0 and
viewed on Java Treeview. The correlation between the TOB1
expression ratio (tumor/non-tumor) and other clinicopathological
characteristics was evaluated using Pearson’s Chi-square test.
Overall survival (OS) was defined as the interval between HCC
resection and mortality; patients alive at the end of follow-up
were censored. The time to recurrence was calculated from the HCC
resection to the first radiological evidence of recurrence.
Patients who succumbed but did not experience recurrence were
censored in determining recurrence (22). The cumulative recurrence and
survival rates were carried out by the Kaplan-Meier method and
analyzed by the log-rank test. All P-values were two-sided, and
P<0.05 was considered to represent a statistically significant
result.
Results
DNA methylation status of TOB gene
promoter and nearby coding region in HCC and breast cancer
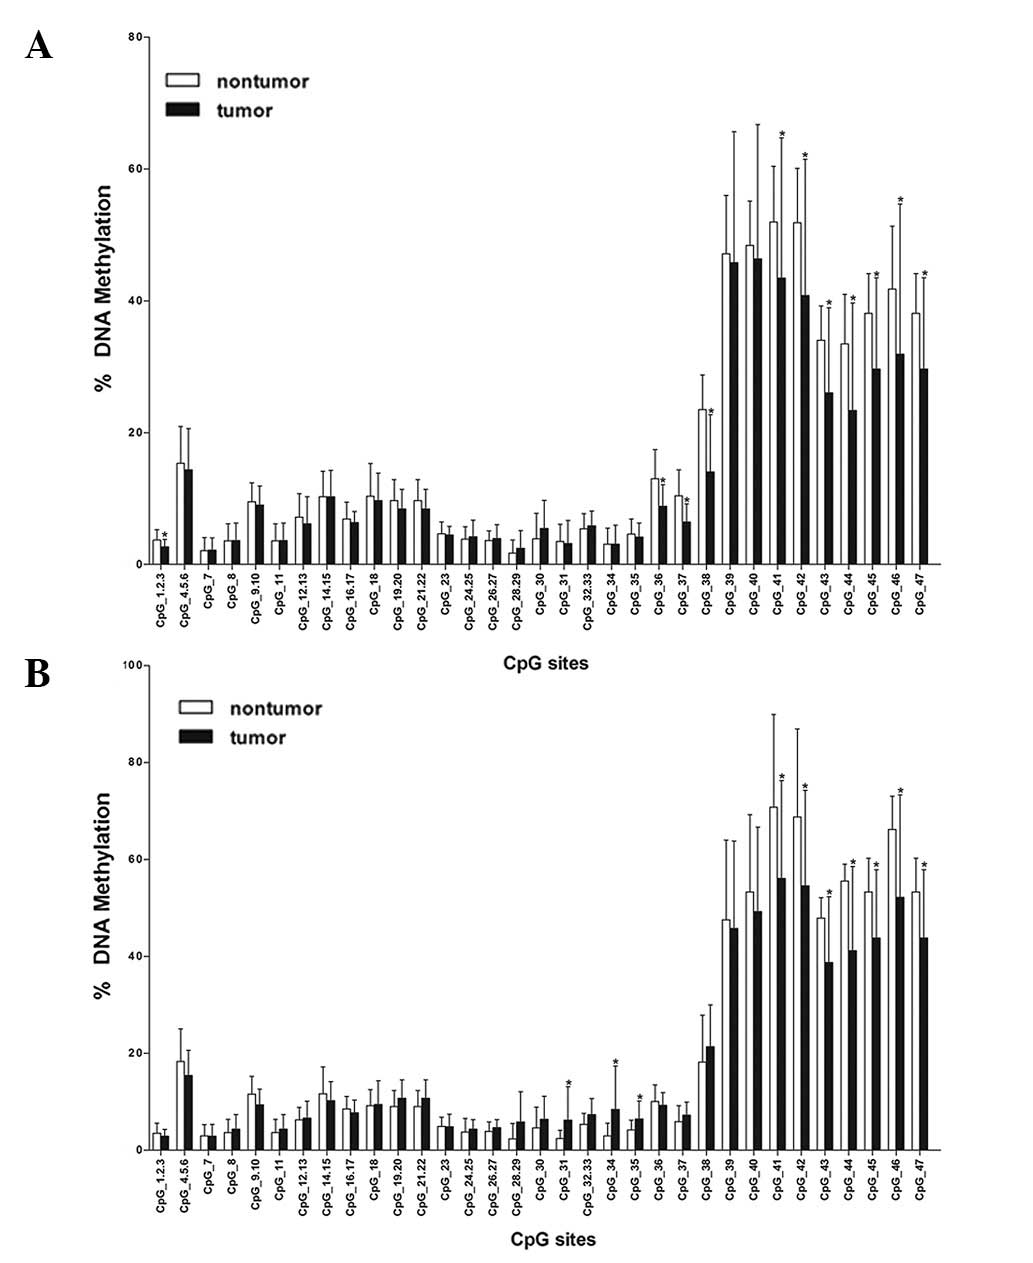
According to MassArray quantitative methylation
analysis in 33 HCC samples and 17 breast cancer samples, the mean
methylation level of each CpG site was used to compare between
non-tumor and tumor tissues of the liver and breast (Fig. 2). In HCC tissue, the significant
differences (P<0.05) were revealed at the following CpG sites:
CpG_1.2.3, CpG_36, CpG_37, CpG_38, CpG_41, CpG_42, CpG_43, CpG_44,
CpG_45, CpG_46 and CpG_47. In breast tissue, they were identified
at the following CpG sites: CpG_31, CpG_34, CpG_35, CpG_41, CpG_42,
CpG_43, CpG_44, CpG_45, CpG_46 and CpG_47. The common CpG sites of
significant difference were CpG_41, CpG_42, CpG_43, CpG_44, CpG_45,
CpG_46 and CpG_47. However, the common CpG sites shared the
characteristic that the mean methylation degree in tumor tissues
was lower than that of adjacent normal tissues and these common CpG
sites were located in exon 3. These characteristics of CpG sites
suggested that TOB may not be a tumor suppressor gene.
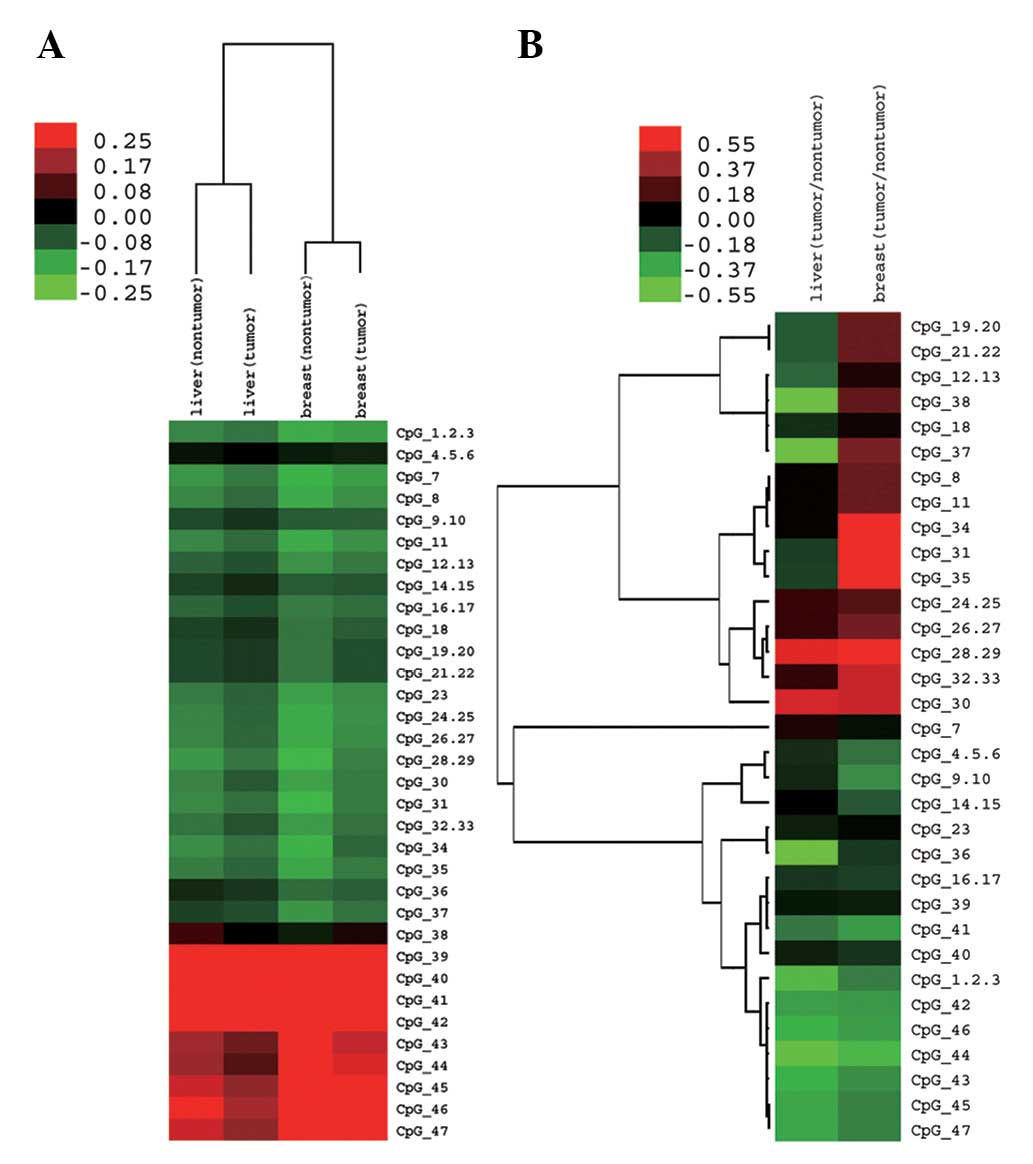
We then analyzed the general methylation feature
profile of all examined CpG sites. The mean methylation range of
different CpG sites was from 2.19% (at CpG_7) to 46.39% (at CpG_40)
in liver tumor tissues and from 1.72% (at CpG_28.29) to 51.94% (at
CpG_41) in liver non-tumor tissues. The mean methylation range of
different CpG sites was from 2.94% (at CpG_1.2.3 and CpG_7) to
56.12% (at CpG_41) in breast tumor tissues and from 2.38% (at
CpG_28.29) to 70.81% (at CpG_41) in breast non-tumor tissues. After
unsupervised clustering, we observed that different CpG sites in
the TOB promoter and nearby coding region shared a similar
methylation pattern, namely, different CpG sites simultaneously had
high or low methylation levels in liver or breast tissues (Fig. 3A). However, with clustering ratios
of methylation level (tumor: non-tumor) in both liver and breast
tissues, we observed that many CpG sites possessed different
methylation change patterns in liver and breast tissues (Fig. 3B; red represents upregulation and
green represents downregulation). The mean methylation level of
liver tumors was 14.18% and that of liver non-tumors was 16.90%.
The mean methylation level of breast tumors was 18.58% and that of
breast non-tumors was 20.70%. The mean methylation level in tumor
tissues was compared to that of adjacent normal tissues and no
significant difference was observed between them. Together with the
above analysis of individual CpG sites, we observed that
methylation variation may not be a major factor in the regulation
of TOB expression.
Expression change of TOB1 in tumor
tissues versus non-tumor tissues and in cell lines following
restoration experiments with 5-aza-dC
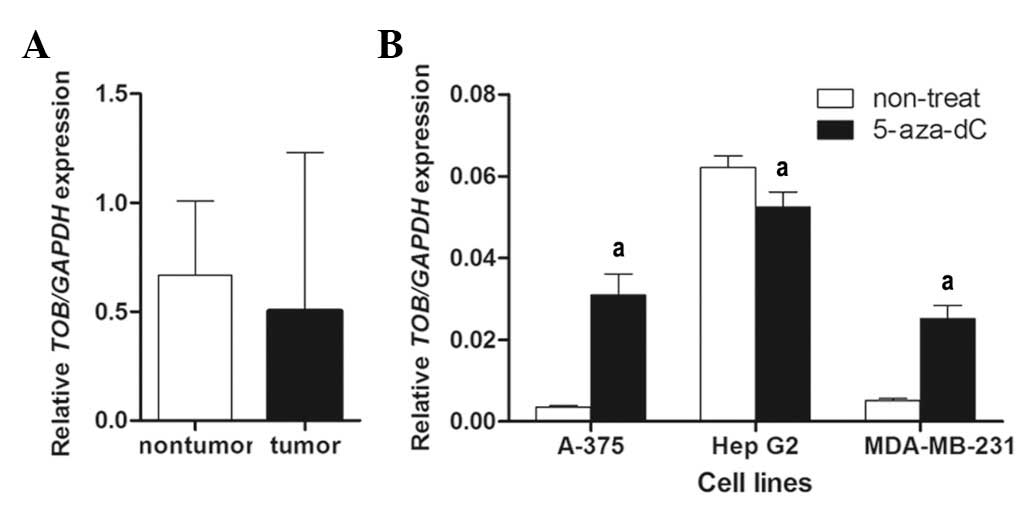
With real-time RT-PCR, TOB mRNA expression was
quantified in 43 HCC samples. As shown in Fig. 4A, no significance difference in mRNA
levels was found in the tumor group compared to the non-tumor group
(mean ratio of tumor group, 0.502; mean ratio of non-tumor group,
0.6680; P>0.05).
To verify the functional association between the
promoter and nearby coding region methylation increase and loss of
TOB gene expression, mRNA expression levels were compared before
and after treatment with 5-aza-dC in cell lines A-375, HepG2 and
MDA-MB-231. In A-375 and MDA-MB-231 cells, the expression increased
approximately ten and five-fold, respectively, following treatment.
However, the expression in HepG2 decreased approximately 20%
following treatment (mean ratio before treatment, 0.062; mean ratio
after treatment, 0.052; P<0.01; Fig.
4B). The expression variation in HepG2 was not consistent with
that in A-375 and MDA-MB-231 cell lines. Many tumor suppressor
genes were inhibited in expression by the hypermethylation in their
promoter or nearby coding region. Therefore, our data suggested
that TOB may be a candidate non-tumor suppressor gene in HCC.
Relative expression or expression ratio
(tumor/non-tumor) of TOB1 are not correlated with poorer prognosis
in HCC patients
To explore whether TOB was a significant factor in
determining clinical outcomes of HCC patients, we assessed its
expression in 43 HCC patients. The expression of TOB was classified
as either high or low group [median value of relative expression
(mvalue) was used as the cut-off value: TOB1high, value >
mvalue; TOB1low, value < mvalue] or [median value of expression
ratio (tumor/non-tumor) (mRatio) was used as the cut-off value:
TOB1highrate, ratio > mRatio; TOB1lowrate, ratio < mRatio].
TOB1high or TOB1highrate accounted for 50% (21 of 42, expression
data was not obtained in one sample) of all the patients. The
Pearson’s Chi-square test indicated that TOB1 was not associated
with clinicopathological characteristics (Table III) and the expression ratio was not
associated with clinicopathological characteristics (Table IV) with the exception of GGT. As of
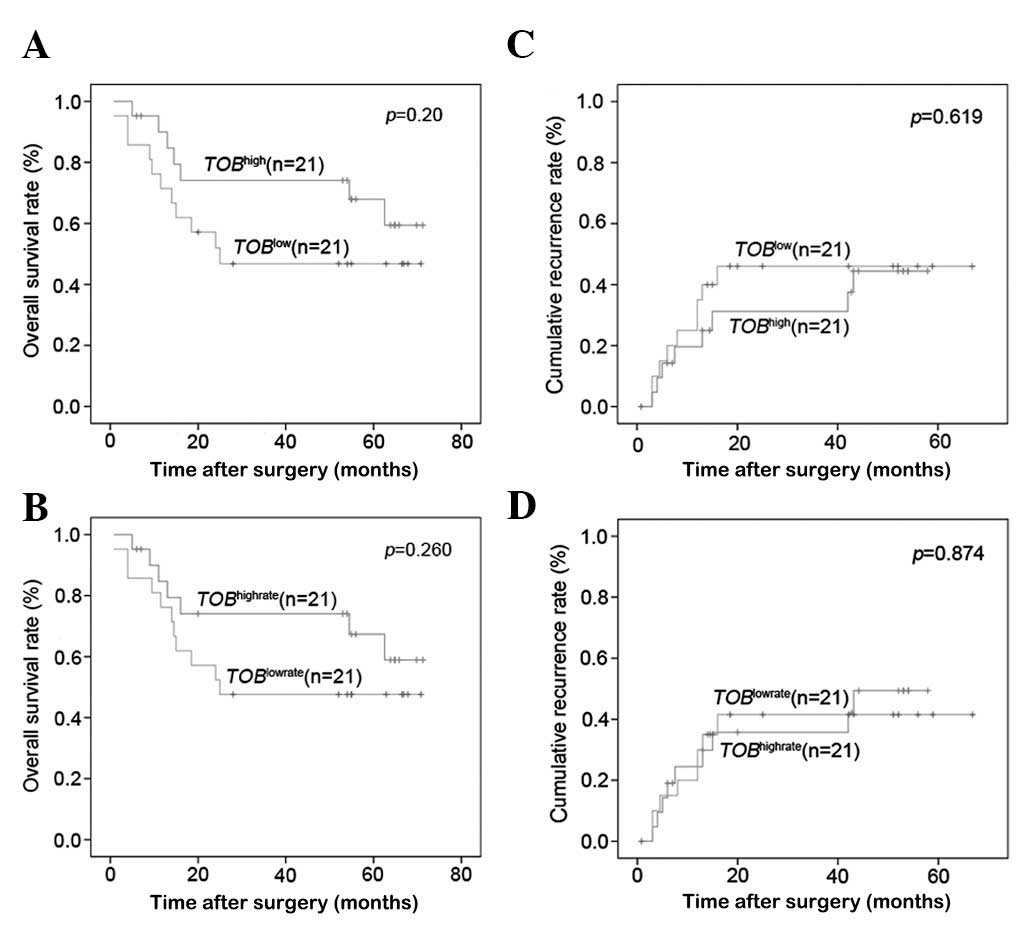
the last follow-up in April 2010, the OS and cumulative recurrence
rates in the whole cohort were 60.4 and 28.6%, respectively.
Furthermore, the OS rate showed no significant difference between
the TOB1high group and the TOB1low group, or between the
TOB1highrate group and the TOB1lowrate group (54.12 vs. 39.76%, P=
0.20; 53.74 vs. 40.41%, P= 0.26). The cumulative recurrence rates
also had no significant difference between them (40.39 vs. 40.13%,
P=0.619; 37.99 vs. 42.91%, P=0.874) (Fig. 5).
| Table IIICorrelation between TOB expression
and clinicopathological characteristics in 42 HCC patients. |
Table III
Correlation between TOB expression
and clinicopathological characteristics in 42 HCC patients.
| TOB expression (%)
| |
|---|
| Variables | Low (n=21) | High (n=21) | P-value |
|---|
| Age (years) | | | 0.538 |
| ≤50 | 14 | 9 | |
| >50 | 7 | 12 | |
| Gender | | | 0.107 |
| Male | 0 | 4 | |
| Female | 21 | 17 | |
| HBsAg | | | 1.000 |
| Negative | 1 | 1 | |
| Positive | 20 | 20 | |
| Liver
cirrhosis | | | 1.000 |
| No | 16 | 16 | |
| Yes | 5 | 5 | |
| Serum AFP
(ng/ml) | | | 0.758 |
| ≤20 | 10 | 11 | |
| >20 | 11 | 10 | |
| ALT (U/l) | | | 1.000 |
| ≤75 | 19 | 19 | |
| >75 | 2 | 2 | |
| GGT (U/l) | | | 0.116 |
| ≤54 | 6 | 2 | |
| >54 | 15 | 19 | |
| Tumor diameter
(cm) | | | 0.352 |
| ≤5 | 10 | 13 | |
| >5 | 11 | 8 | |
| Tumor number | | | 0.634 |
| Single | 18 | 19 | |
| Multiple | 3 | 2 | |
| Tumor
encapsulation | | | 0.204 |
| Complete | 11 | 15 | |
| Incomplete | 10 | 6 | |
| Tumor
differentiation | | | 0.477 |
| I/II | 16 | 17a | |
| III/IV | 5 | 3 | |
| Microvascular
invasion | | | 0.317 |
| No | 13 | 16 | |
| Yes | 8 | 5 | |
| TNM stage | | | 0.334 |
| I | 12 | 15 | |
| II/III | 9 | 6 | |
| BCLC stage | | | 0.495 |
| 0/A | 5 | 7 | |
| B/C | 16 | 14 | |
| Table IVCorrelation between TOB expression
ratio and clinicopathological characteristics in 42 HCC
patients. |
Table IV
Correlation between TOB expression
ratio and clinicopathological characteristics in 42 HCC
patients.
| TOB expression
ratio (%)
| |
|---|
| Variables | Low (n=21) | High (n=21) | P-value |
|---|
| Age (years) | | | 0.217 |
| ≤50 | 13 | 8 | |
| >50 | 8 | 13 | |
| Gender | | | 0.107 |
| Male | 0 | 4 | |
| Female | 21 | 17 | |
| HBsAg | | | 1.000 |
| Negative | 1 | 1 | |
| Positive | 20 | 20 | |
| Liver
cirrhosis | | | 1.000 |
| No | 16 | 16 | |
| Yes | 5 | 5 | |
| Serum AFP
(ng/ml) | | | 0.355 |
| ≤20 | 9 | 12 | |
| >20 | 12 | 9 | |
| ALT (U/l) | | | 1.000 |
| ≤75 | 19 | 19 | |
| >75 | 2 | 2 | |
| GGT (U/l) | | | 0.045 |
| ≤54 | 7 | 1 | |
| >54 | 14 | 20 | |
| Tumor diameter
(cm) | | | 0.121 |
| ≤5 | 9 | 14 | |
| >5 | 12 | 7 | |
| Tumor number | | | 0.634 |
| Single | 18 | 19 | |
| Multiple | 3 | 2 | |
| Tumor
encapsulation | | | 0.525 |
| Complete | 12 | 14 | |
| Incomplete | 9 | 7 | |
| Tumor
differentiation | | | 0.477 |
| I/II | 16 | 17a | |
| III/IV | 5 | 3 | |
| Microvascular
invasion | | | 0.317 |
| No | 13 | 16 | |
| Yes | 8 | 5 | |
| TNM stage | | | 0.334 |
| I | 12 | 15 | |
| II/III | 9 | 6 | |
| BCLC stage | | | 0.172 |
| 0/A | 4 | 8 | |
| B/C | 17 | 13 | |
Discussion
TOB1 has been reported to be a tumor suppressor gene
and TOB expression is lost in human lung and thyroid cancers
(12). However, whether it is a
tumor suppressor gene in HCC remains unclear. In addition, whether
its expression is decreased, and what is responsible for the
downregulation in gene expression in HCC still need to be explored.
In light of this, we performed MassArray quantitative methylation
analysis in the promoter CpG island of TOB1 in breast cancer and
HCC. Our results indicated that tumor and non-tumor tissues tended
to share a common methylation pattern at different CpG sites
(Fig. 3A). However, different CpG
sites had a different change pattern following tumorigenesis in
different tissues. This suggested that different CpG sites had
different functions or only partial CpG sites were crucial for
regulation in gene expression. With respect to DNA methylation, the
decrease in CpG sites in tumors relative to their normal tissue
counterparts was one of the first epigenetic alterations to be
found in human cancer, particularly in the tumor suppressor gene
promoter and nearby region (21,23).
In our study, following comparison between tumor tissues and
adjacent normal tissues at different CpG sites, we did not observe
statistical significance at common CpG sites which shared the above
phenomena in the methylation level. Based on these data, we
speculated that TOB1 may be a candidate non-tumor suppressor gene
in HCC.
To further evaluate whether TOB1 is a tumor
suppressor gene in HCC, we investigated the correlation between
TOB1 methylation variation and mRNA expression, and real-time PCR
was conducted on a cohort of 43 patients with HCC. The results did
not reveal a significant difference in tumor tissues compared to
adjacent normal tissues. Our findings were not in agreement with a
previous observation in breast cancer patients (12). Therefore, that TOB1 is not a tumor
suppressor gene in HCC appears more likely. This concept was
further supported by the fact that the TOB1 expression was
inhibited in HepG2; however, in other two cell lines (A-375 and
MDA-MB-231) TOB1 expression was elevated dramatically following
5-aza-dC treatment. Consequently, other mechanisms may account for
the regulation of TOB1 gene expression, but no significant
difference in gene expression between tumor tissues and adjacent
normal tissues together with 5-aza-dC treatment assay provided a
significant indication that TOB1 was not a tumor suppressor gene.
Of course, the same gene having different functions in different
tissues is normal for the TOB1 gene. For example, Ruan et al
reported that TOB1 functioned in the deadenylation of mRNA decay
and could interact with Caf1 and PABPC1 (24); Tzachanis et al reported that
TOB1 functioned in enhancing Smad DNA-binding through associating
with Smad2 and Smad4 in T cells (4). Therefore, it was logical to assume
that TOB1 was not a tumor suppressor in HCC.
TOB1 has emerged as an important molecule correlated
with tumorigenicity and metastasis in cell lines and expression
inhibition in breast cancer tissues. This study did not reveal a
significant difference in TOB1 expression between tumor tissues and
adjacent normal tissues, and the TOB1 expression or expression
ratio was not associated with the OS or cumulative recurrence
rates. Taken together, this may prove that TOB1 is not a tumor
suppressor in HCC. The study also showed that TOB1 was associated
with GGT. However, GGT is only an auxiliary marker in the diagnosis
of HCC diagnosis, and further investigations are warranted to
explore the role of TOB1 in HCC, such as a study in different
populations. Therefore, it should be stated that our findings that
TOB1 was not a tumor suppressor in HCC are still preliminary.
To conclude, our study found no methylation
aberrance in global methylation level or single CpG site in the
TOB1 promoter and nearby region between tumor tissues and adjacent
normal tissues. In addition, the expression of the TOB1 gene
displayed no significant difference between tumor tissues and
adjacent normal tissues. We also observed that TOB1 expression had
no correlation with the OS or cumulative recurrence rates. Based on
these data, we hypothesize that TOB1 is not a tumor suppressor gene
in HCC.
Acknowledgements
We are grateful to all the
participants in this study. The study was supported by a grant from
the National Natural Science Foundation of China (No. 90919049),
the 973 Program (2010CB529600 and 2007CB947300), the Shanghai
Municipal Commission of Science and Technology Program
(09DJ1400601) and the third phase of the 211 project from Ministry
of Education of China.
References
|
1.
|
M MaekawaE NishidaT TanoueIdentification
of the anti-proliferative protein Tob as a MAPK substrateJ Biol
Chem2773778337787200210.1074/jbc.M20450620012151396
|
|
2.
|
Y YoshidaE HosodaT NakamuraT
YamamotoAssociation of ANA, a member of the antiproliferative Tob
family proteins, with a Caf1 component of the CCR4 transcriptional
regulatory complexJpn J Cancer
Res92592596200110.1111/j.1349-7006.2001.tb01135.x11429045
|
|
3.
|
BS FletcherRW LimBC VarnumDA KujubuRA
KoskiHR HerschmanStructure and expression of TIS21, a primary
response gene induced by growth factors and tumor promotersJ Biol
Chem266145111451819911713584
|
|
4.
|
D TzachanisGJ FreemanN HiranoTob is a
negative regulator of activation that is expressed in anergic and
quiescent T cellsNat Immunol211741182200110.1038/ni73011694881
|
|
5.
|
JP RouaultR RimokhC TessaBTG1, a member of
a new family of antiproliferative genesEMBO
J111663167019921373383
|
|
6.
|
JP RouaultN FaletteF
GuehenneuxIdentification of BTG2, an antiproliferative
p53-dependent component of the DNA damage cellular response
pathwayNat Genet14482486199610.1038/ng1296-4828944033
|
|
7.
|
A BradburyR PossentiEM ShooterF
TironeMolecular cloning of PC3, a putatively secreted protein whose
mRNA is induced by nerve growth factor and depolarizationProc Natl
Acad Sci USA8833533357199110.1073/pnas.88.8.33531849653
|
|
8.
|
M MaekawaT YamamotoE NishidaRegulation of
subcellular localization of the antiproliferative protein Tob by
its nuclear export signal and bipartite nuclear localization signal
sequencesExp Cell Res2955965200410.1016/j.yexcr.2003.12.016
|
|
9.
|
T SuzukiJ K-TsuzukuR AjimaT NakamuraY
YoshidaT YamamotoPhosphorylation of three regulatory serines of Tob
by Erk1 and Erk2 is required for Ras-mediated cell proliferation
and transformationGenes
Dev1613561370200210.1101/gad.96280212050114
|
|
10.
|
J Kawamura-TsuzukuT SuzukiY YoshidaT
YamamotoNuclear localization of Tob is important for regulation of
its antiproliferative
activityOncogene2366306638200410.1038/sj.onc.120789015235587
|
|
11.
|
S MatsudaJ Kawamura-TsuzukuM OhsugiTob, a
novel protein that interacts with p185erbB2, is associated with
anti-proliferative activityOncogene1270571319968632892
|
|
12.
|
S O’MalleyH SuT ZhangC NgH GeCK TangTOB
suppresses breast cancer tumorigenesisInt J
Cancer125180518132009
|
|
13.
|
K IwanagaN SueokaA SatoAlteration of
expression or phosphorylation status of tob, a novel tumor
suppressor gene product, is an early event in lung cancerCancer
Lett2027179200310.1016/j.canlet.2003.08.01914643028
|
|
14.
|
Y YoshidaS TanakaH UmemoriNegative
regulation of BMP/Smad signaling by Tob in
osteoblastsCell10310851097200010.1016/S0092-8674(00)00211-711163184
|
|
15.
|
Y YoshidaA von BubnoffN IkematsuTob
proteins enhance inhibitory Smad-receptor interactions to repress
BMP signalingMech
Dev120629637200310.1016/S0925-4773(03)00020-012782279
|
|
16.
|
B XiongY RuiM ZhangTob1 controls dorsal
development of zebrafish embryos by antagonizing maternal
beta-catenin transcriptional activityDev
Cell11225238200610.1016/j.devcel.2006.06.01216890162
|
|
17.
|
N EzzeddineTC ChangW ZhuHuman TOB, an
antiproliferative transcription factor, is a poly(A)-binding
protein-dependent positive regulator of cytoplasmic mRNA
deadenylationMol Cell Biol2777917801200710.1128/MCB.01254-07
|
|
18.
|
Y YoshidaT NakamuraM KomodaMice lacking a
transcriptional corepressor Tob are predisposed to cancerGenes
Dev1712011206200310.1101/gad.108800312756225
|
|
19.
|
H LiuQ KongB LiY HeP LiB JiaExpression of
PEBP4 protein correlates with the invasion and metastasis of
colorectal cancerTumour
Biol33267273201210.1007/s13277-011-0279-x22125029
|
|
20.
|
Q GaoSJ QiuJ FanIntratumoral balance of
regulatory and cytotoxic T cells is associated with prognosis of
hepatocellular carcinoma after resectionJ Clin
Oncol2525862593200710.1200/JCO.2006.09.456517577038
|
|
21.
|
Y ZhaoX KongX LiMetadherin mediates
lipopolysaccharide-induced migration and invasion of breast cancer
cellsPLoS One6e29363201110.1371/journal.pone.002936322195048
|
|
22.
|
JM LlovetAM Di BisceglieJ BruixDesign and
endpoints of clinical trials in hepatocellular carcinomaJ Natl
Cancer Inst100698711200810.1093/jnci/djn134
|
|
23.
|
J TostDNA methylation: an introduction to
the biology and the disease-associated changes of a promising
biomarkerMol Biotechnol447181201010.1007/s12033-009-9216-2
|
|
24.
|
L RuanM OsawaN HosodaQuantitative
characterization of Tob interactions provides the thermodynamic
basis for translation termination-coupled deadenylase regulationJ
Biol Chem2852762427631201010.1074/jbc.M110.138867
|