Introduction
Side population (SP) cells are a small group of
cells that stain faintly or not at all when treated with Hoechst
33342 dye. These cells are typically isolated by flow cytometry
(FCM) using the method described by Goodell et al in a study
of murine bone marrow (1). This
technique has been used to sort SP cells from various types of
cancer, including gliomas (2,3), and
breast (4), colon (5,6), lung
(7) and liver (8,9)
cancer.
SP cells demonstrate self-renewal and multiplex
differentiation potential. Further, xenograft experiments have
revealed that these cells exhibit stem cell characteristics,
including high in vitro proliferation ability and a strong
tumor-forming ability. Although SP cells have been isolated and
identified from several different cell lines of gastrointestinal
cancer (10), there has been
relatively little research conducted on SP cells in SGC-7901 cell
lines from human gastric tumors.
The aim of the current study was to isolate and
characterize SP cells from SGC-7901 cell lines. Specifically, we
used the SP cell sorting method to isolate SP cells in order to
investigate their proliferation, self-renewal, chemoresistance and
differentiation properties. We hope that this information will lay
the foundation for further gastric cancer stem cell research.
Materials and methods
Cells and experimental animals
The human gastric cancer cell strain SGC-7901 was
donated by Dr Yan Xuedong from the First Affiliated Hospital of
Chongqing Medical University. In vivo experiments were
performed on 18 female specific pathogen-free (SPF) Balb/c nude
mice (4–6 weeks old) that had been purchased from the Laboratory
Animal Center of the Third Military Medical University (Chongqing,
China). The breeding and use of the experimental animals were in
accordance with the reviewed principles designated by the Ethics
Committee of the Third Military Medical University.
Reagents
Trypsin-ethylenediaminetetraacetic acid
(trypsin-EDTA), RPMI-1640 medium and fetal bovine serum (FBS) were
purchased from HyClone Laboratories (Logan, UT, USA). Additionally,
Hoechst 33342 and verapamil were purchased from Sigma (St. Louis,
MO, USA), while epidermal growth factor (EGF) and basic fibroblast
growth factor (b-FGF) were purchased from Peprotech (Rocky Hill,
NJ, USA). Cell Counting Kit-8 (CCK-8), rabbit anti-human ABCG2 and
rabbit anti-human Bcl-2 antibodies were purchased from Boster
Biological Technology Ltd. (Fremont, CA, USA). Furthermore, TRIzol
reagent was purchased from Invitrogen (Carlsbad, CA, USA), while
the retrovirus kit and the Thunderbird SYBR qPCR mix were purchased
from Toyobo (Osaka, Japan).
Experimental methods
Cell cultures
SGC-7901 cells were cultured in RPMI-1640 medium
with 10% FBS, 100 U/ml penicillin G and 100 μg/ml
streptomycin. In all experiments, the cells were cultured in a
hatch box at 37°C, 5% CO2 and 95% humidity. Passage was
completed in 3–4 days, and all experiments were performed on cells
in the exponential growth phase.
Detection and sorting of SP cells by
FCM
Cells were digested with 0.25% trypsin-EDTA and then
centrifuged for 5 min at 1,000 rpm. The cells were subsequently
suspended in phosphate-buffered saline (PBS) containing 5% FBS,
then stained with Hoechst 33342 at a concentration of 10
μg/ml, and incubated for 90 min at 37°C either alone or with
100 μM verapamil. During the incubation, the cells were
shaken every 10 min. A second round of centrifuging was performed
for 5 min at 1,000 rpm, then the cells were suspended in PBS with
5% FBS at a concentration of 1×10⁷ cells/ml. The
solution was poured through a 400-mesh screen filter and then
stored in the dark at 4°C. Next, samples were dyed with 1
μg/ml propidium iodide (PI) for 5 min to remove the dead
cells. The remaining cells were sorted using a flow cytometer (FACS
Aria II; BD Biosciences; Franklin Lakes, NJ, USA). The Hoechst
33342 dye was excited at 355 nm and its dual-wavelength
fluorescence was analyzed (blue, 450 nm; red, 675 nm).
In vitro proliferation activity
assay
After centrifuging and suspension, the acquired SP
and non-SP cells were inoculated in a 96-well plate at
2×10² cells/well, and then cultured in a CO2
incubator. Each group was set up in triplicate. Cell proliferation
activity tests were performed every day for 7 days. CCK-8 solution
(10 μl) was added to each well and the plate was placed in a
CO2 incubator for 3 h. The optical density (OD) was determined at
450 nm. These data were used to calculate cell growth curves based
on the mean OD450 and standard deviation values for each
well.
Observation of tumor mass formation
ability in a serum-free medium
The SP and non-SP cells were each inoculated in 3 ml
RPMI-1640 serum-free medium in non-adsorption petri dishes at a
density of 200 cells/dish. Following treatment of the cultures with
20 ng/ml EGF and 10 ng/ml b-FGF, the plates were placed in a
CO2 incubator. Tumor mass formation was observed under a
microscope after 7 days.
Appraisal of non-symmetrical division
ability
After centrifuging, the SP cells and non-SP cells
were resuspended in RPMI-1640 medium containing 10% FBS for 1 week
of routine culture. After this time, the SP sorting method was
applied to the two groups to re-evaluate the proportion of SP cells
present in the culture.
Cell resistance experiment
SP and non-SP cells were seeded in 96-well plates at
a concentration of 1,000 cells/plate. Following 24 h of
cultivation, 5-fluorouracil (5-FU) was added to all cultures to a
final concentration of 10 μg/ml. The plates were placed in a
hatch box for 48 h. A solution of CCK-8 (10 μl) was then
added to each well, and the plates were incubated for an additional
3 h. The mean and standard deviation of absorbance at
OD450 were then calculated. Cell resistance in both
groups was calculated using the following formula: Cell resistance
rate (%) = (experimental group OD450 value/control group
OD450 value) × 100.
Western blot test for ABCG2 and Bcl-2
protein expression
Proteins were extracted from the SP and non-SP
cells, and protein concentration was determined using the
bicinchoninic acid (BCA) method. Following sodium dodecyl
sulfate-polyacrylamide gel electrophoresis (SDS-PAGE) and transfer
to a membrane, the gels were treated with the primary antibodies
(rabbit anti-human ABCG2 and Bcl-2), the secondary antibody (goat
anti-rabbit IgG with alkaline phosphatase markers) and a
chemiluminescence reagent. The density of the target bands was
analyzed using a biomedical image analysis system.
Detection of stem cell gene expression
by fluorescence quantitative PCR
For RNA extraction, TRIzol was added to samples
comprising 2×10⁵ SP and non-SP cells. Amplification was
performed by real-time PCR according to the manufacturer’s
instructions: 95°C denaturation for 1 min, followed by 95°C for 15
sec, 58°C for 15 sec, and 72°C for 45 sec for a total of 40 cycles.
Fluorescence data were collected at the end of each cycle. The
2−ΔΔCT method was used to analyze the Ct value of the
target (Musashi-1 and CD44) and reference (β-actin) genes of the
two cell types. We calculated the relative gene expression between
the SP and non-SP cells by setting the non-SP cell group data as
the initial standard. Primers were obtained from Sangon Biotech Co.
Ltd. (Shanghai, China), and the sequences used were as follows:
forward: 5′-GACTCCAAAACAATTGACCCTAAG-3′ and reverse:
5′-GAGCTTTCTTACATTCCAAACTTT-3′ for Musashi-1; forward:
5′-CGGACACCATGGACAAGTTT-3′ and reverse: 5′-AGCTTTTTCTTCTGCCCACA-3′
for CD44; and forward: 5′-GGACTTCGAGCAAGAGATGG-3′ and reverse:
5′-AGCACTGTGTTGGCGTACAG-3′ for β-actin.
In vivo tumor formation
Mice were randomly divided into SP and non-SP groups
(n=9 for each group). Each mouse received a subcutaneous injection
(in the back) with one of three different cell suspension
concentrations: 2×10², 2×10³ or
2×10⁴ (n=3 apiece for the SP and non-SP groups). Tumor
formation was observed weekly for 8 weeks.
Statistical analysis
Data are presented as the mean ± standard deviation.
Differences between the two groups were investigated using the
Student’s t-test. P<0.05 was considered to indicate a
statistically significant difference. All analyses were performed
using the Statistical Package for the Social Sciences (SPSS) v.17
(SPSS Inc.; Chicago, IL, USA).
Results
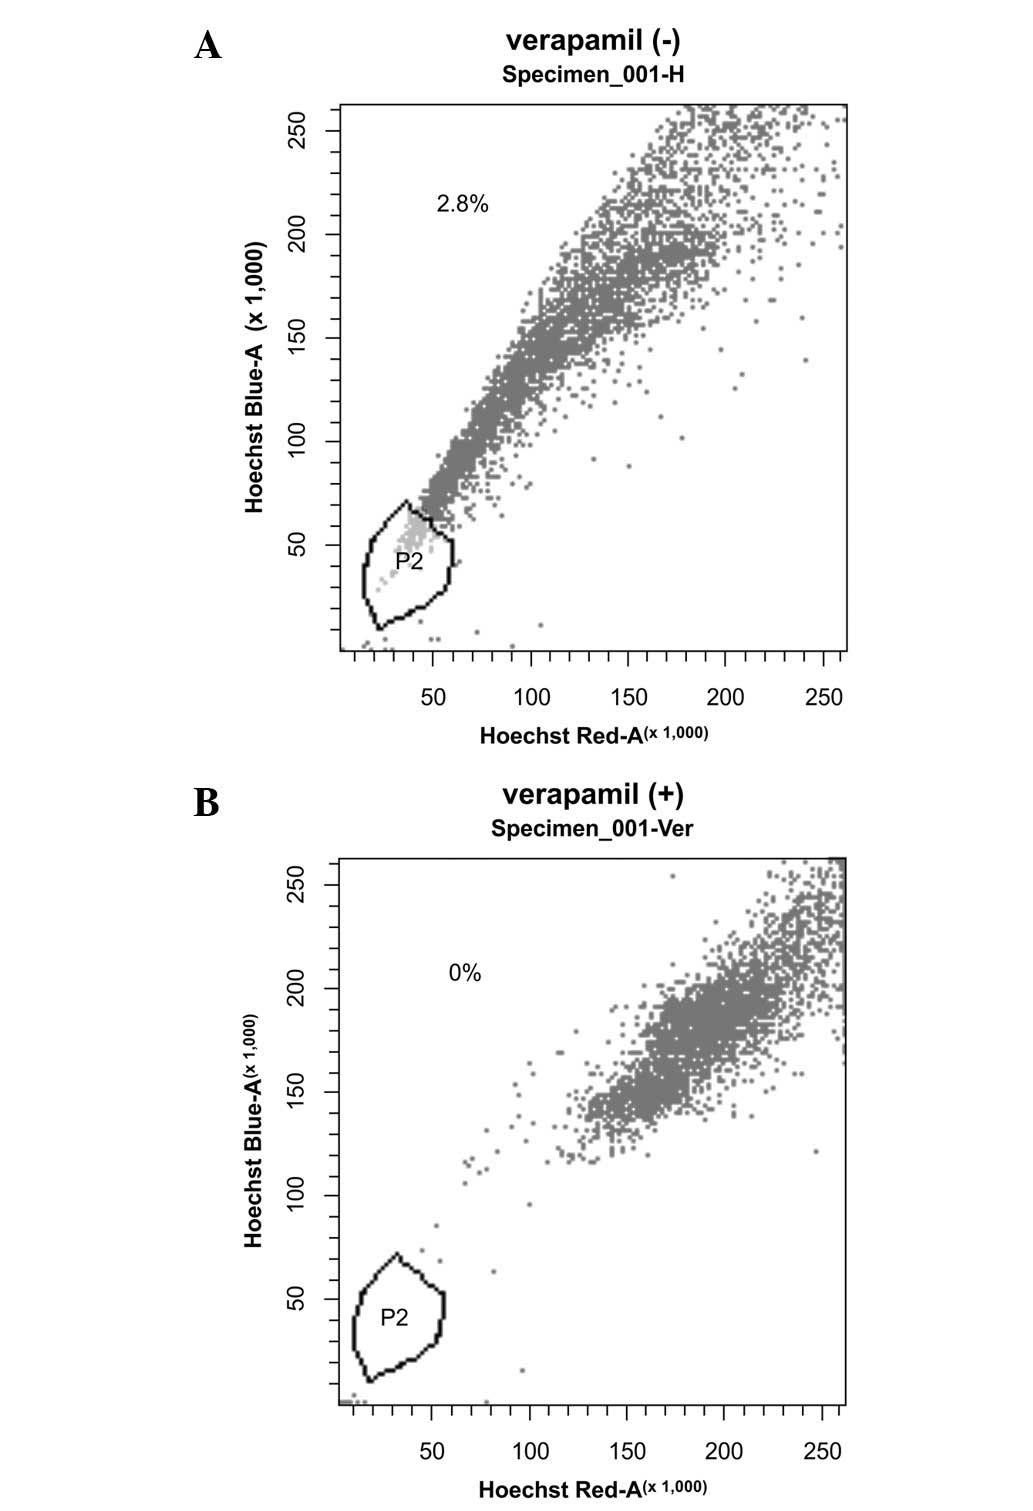
SP cell ratio analysis
Only a small proportion (2.3±0.78%) of the SGC-7901
cells were SP cells (Table I).
Treatment with verapamil considerably reduced the proportion of SP
cells to ∼0% (Fig. 1).
 | Table IResults from the SP cell detection
test. |
Table I
Results from the SP cell detection
test.
| Sample number | Percentage of SP
cells |
|---|
| 1 | 1.9 |
| 2 | 2.8 |
| 3 | 3.2 |
| 4 | 2.4 |
| 5 | 1.2 |
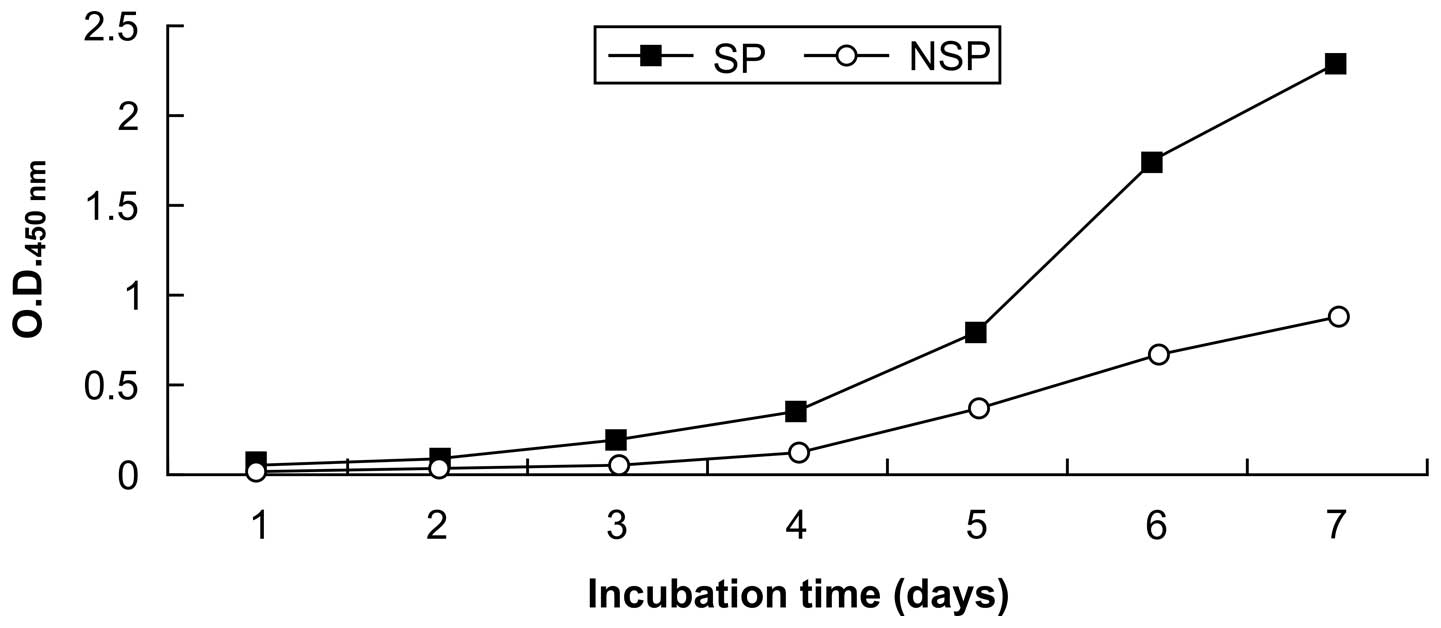
In vitro proliferation ability
Fig. 2 shows growth
curves for SP and non-SP cells. The SP cells underwent rapid
proliferation on day 3, with the growth beginning to plateau by day
7; whereas the non-SP cells exhibited slower growth. The in
vitro proliferation activity was significantly higher in the SP
cells (P<0.05; Table II).
| Table IIOD450 values of the two
groups at different incubation times. |
Table II
OD450 values of the two
groups at different incubation times.
| Time (days)
|
|---|
| Group | 1 | 2 | 3 | 4 | 5 | 6 | 7 |
|---|
| SP cells | 0.0451±0.0073 | 0.0837±0.0052 | 0.1872±0.0045 | 0.3527±0.0062 | 0.7834±0.0193 | 1.7483±0.0782 | 2.2657±0.09531 |
| Non-SP cells | 0.0274±0.0059 | 0.0468±0.0027a | 0.0732±0.0061a | 0.1368±0.0057a | 0.3829±0.0094a | 0.6746±0.0629a |
0.8837±0.06382a |
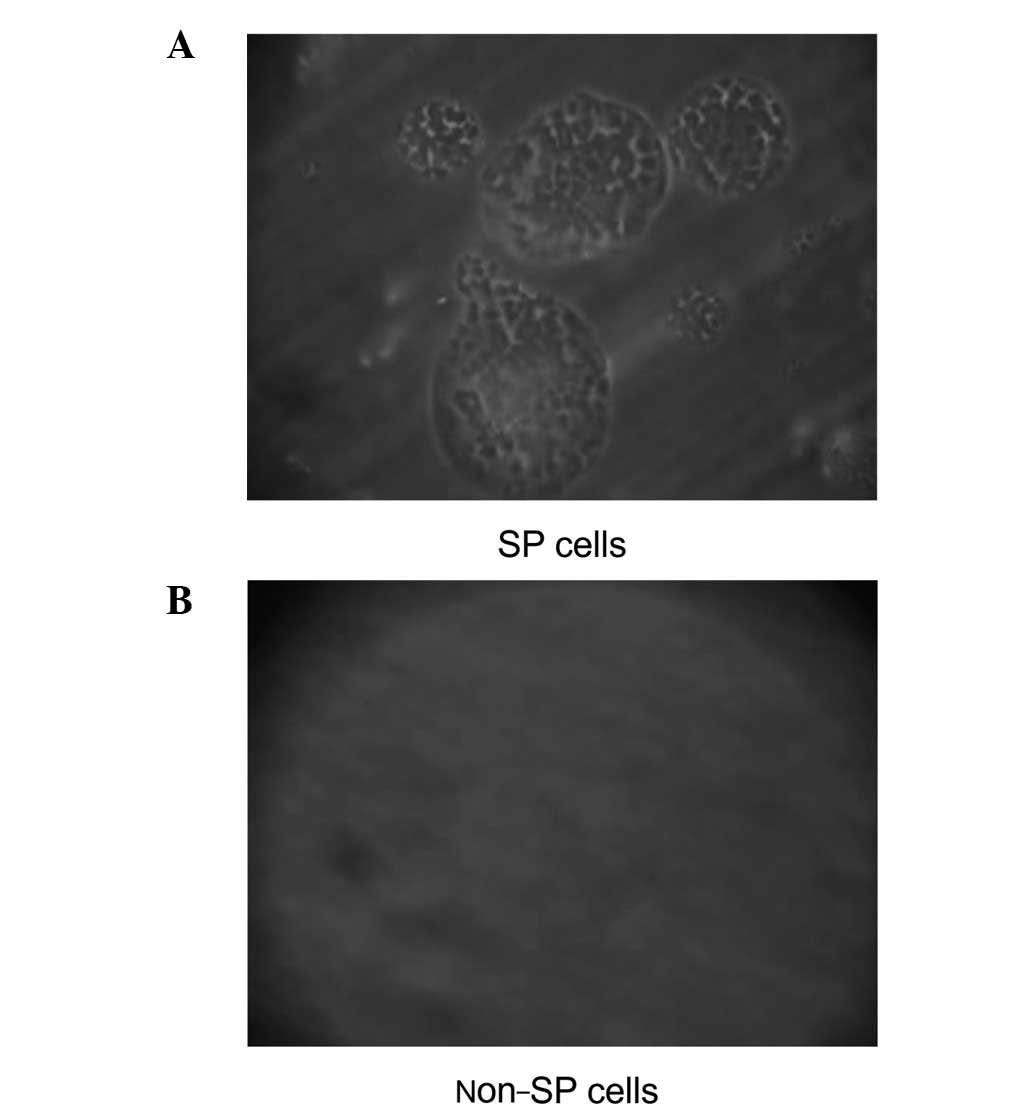
Observation of tumor mass formation
ability in a serum-free medium
SP cell cultures contained round and oval
ball-shaped suspension tumors characterized by densely packed
cells, indicating that these cells have high self-renewal rates in
serum-free culture. However, the cells died and no suspension
tumors were observed in the non-SP cell cultures (Fig. 3).
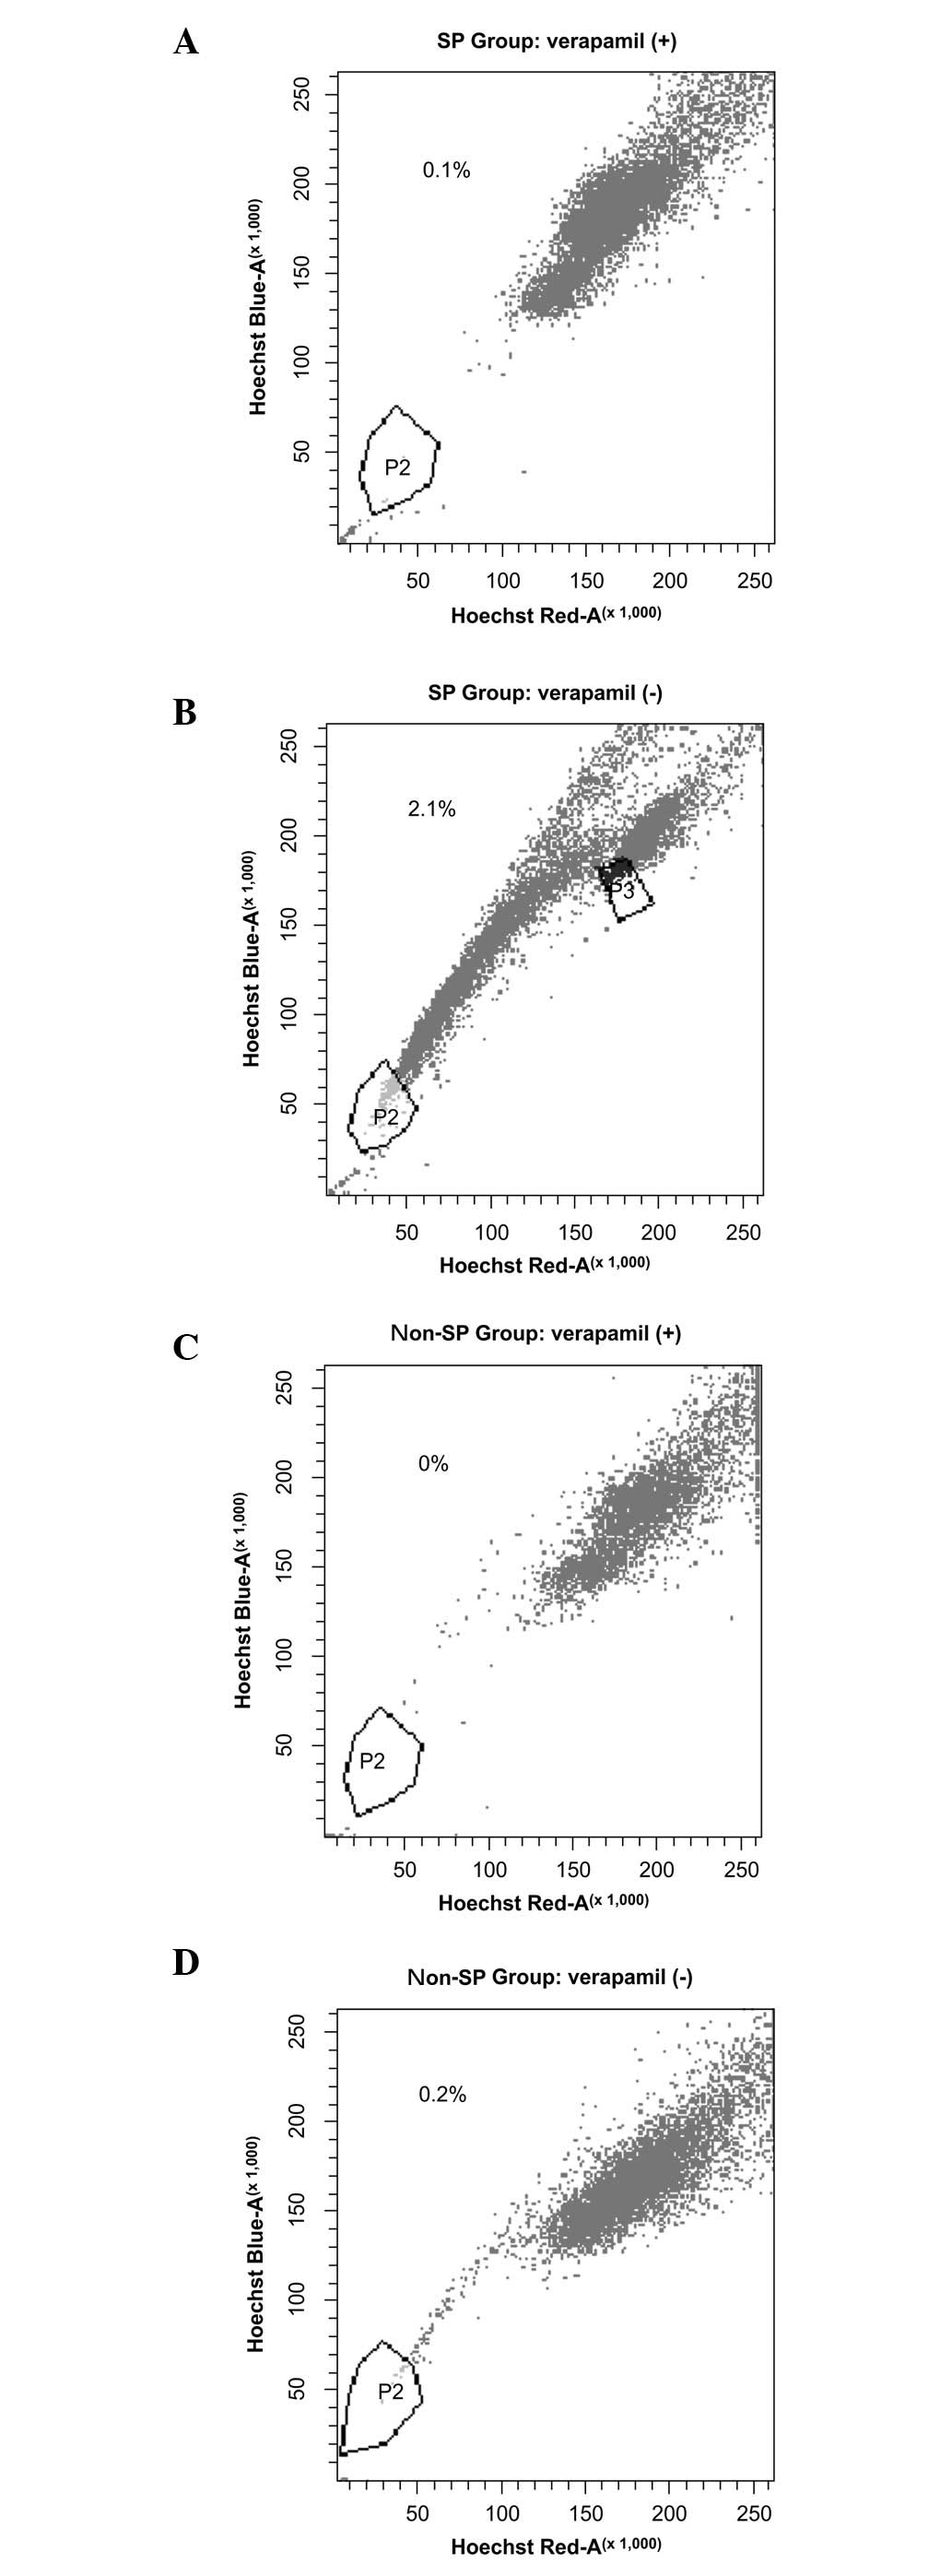
Appraisal of non-symmetrical
division
After one week of cultivation, the ratio of SP cells
was 2.1% in the SP group and 0.2% in the non-SP group, suggesting
that SP cells exhibit non-symmetrical division. Non-SP cells were
also generated during SP cell self-renewal. In the SP cell group,
the proportion of SP cells was reduced from 100 to 2.1% (Fig. 4).
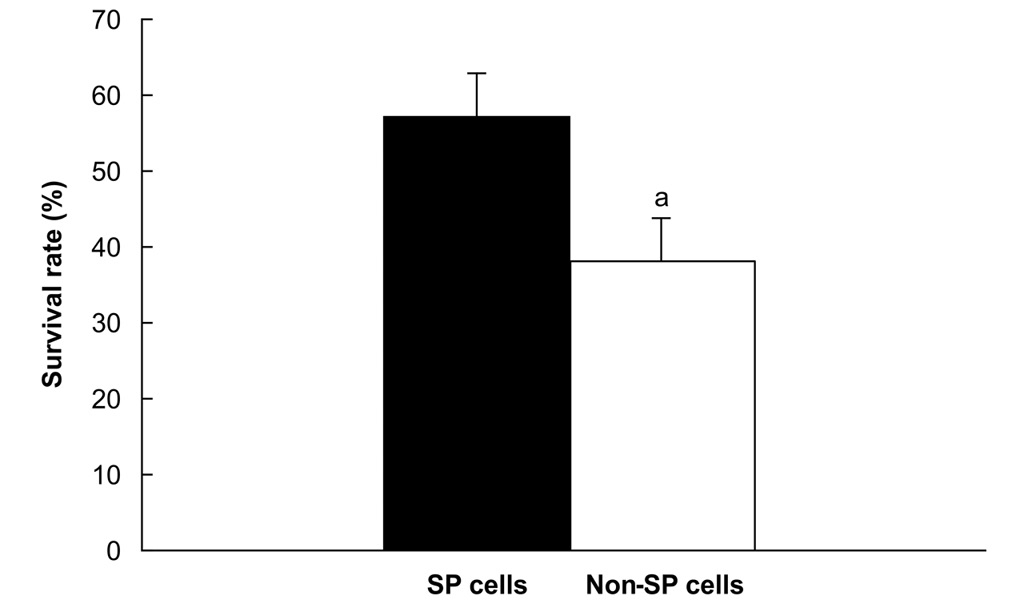
Cell resistance experiment
The survival rates following exposure to 10
μg/ml 5-FU were significantly higher for SP cells (57%) than
for non-SP cells (38%; P<0.05; Fig.
5).
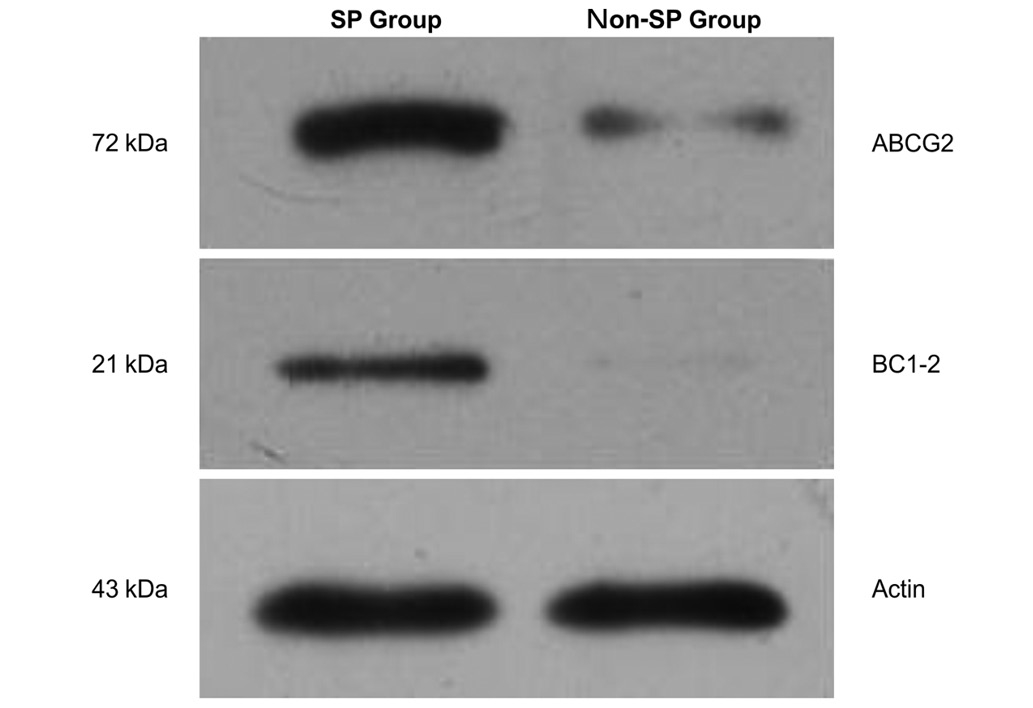
Western blot analysis for ABCG2 and
Bcl-2 protein expression
The expression levels of ABCG2 and Bcl-2 were higher
in SP cells (0.99±0.07 and 0.47±0.02, respectively) than in non-SP
cells (0.28±0.06 and 0.12±0.01, respectively; P<0.05; Fig. 6).
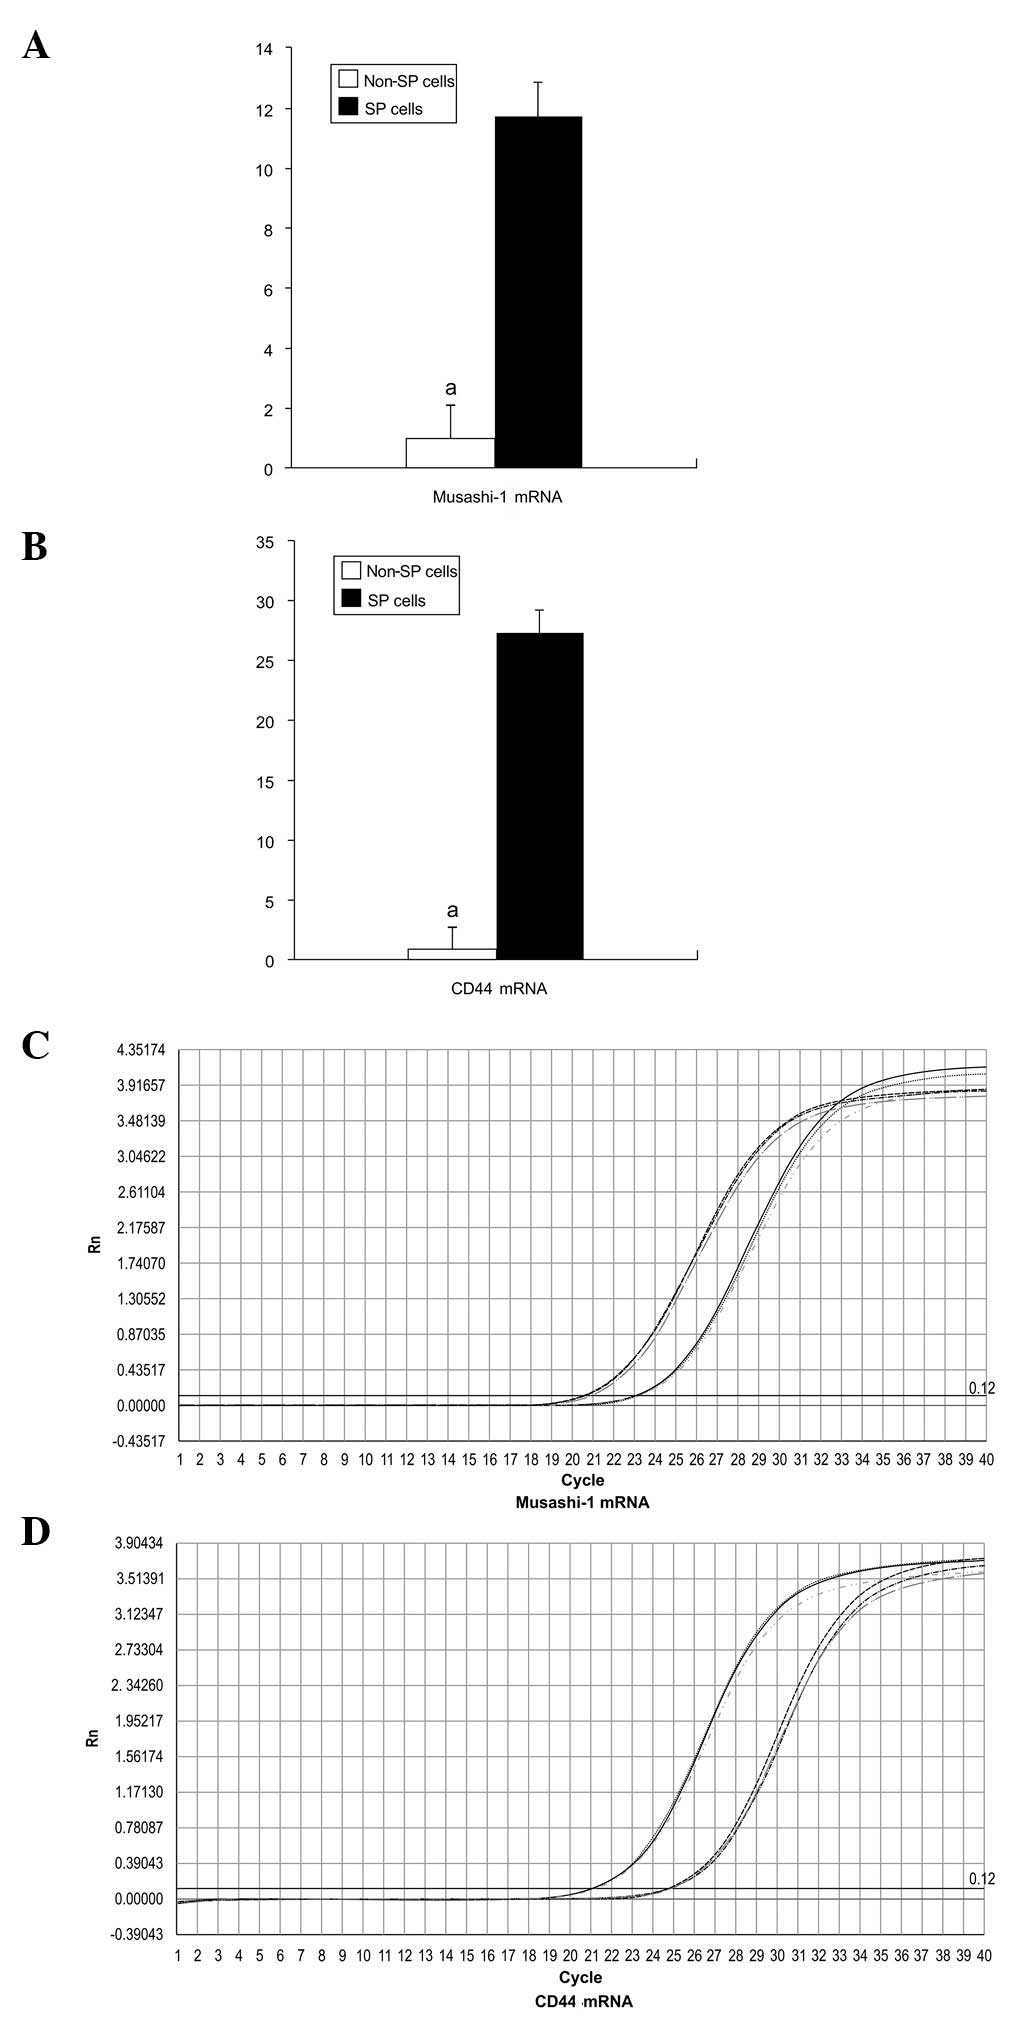
Detection of stem cell gene expression
by fluorescence quantitative PCR
The expression of Musashi-1 and CD44 mRNA was
significantly higher in SP cells than in non-SP cells, by factors
of 11.74 and 27.35, respectively (P<0.05; Fig. 7).
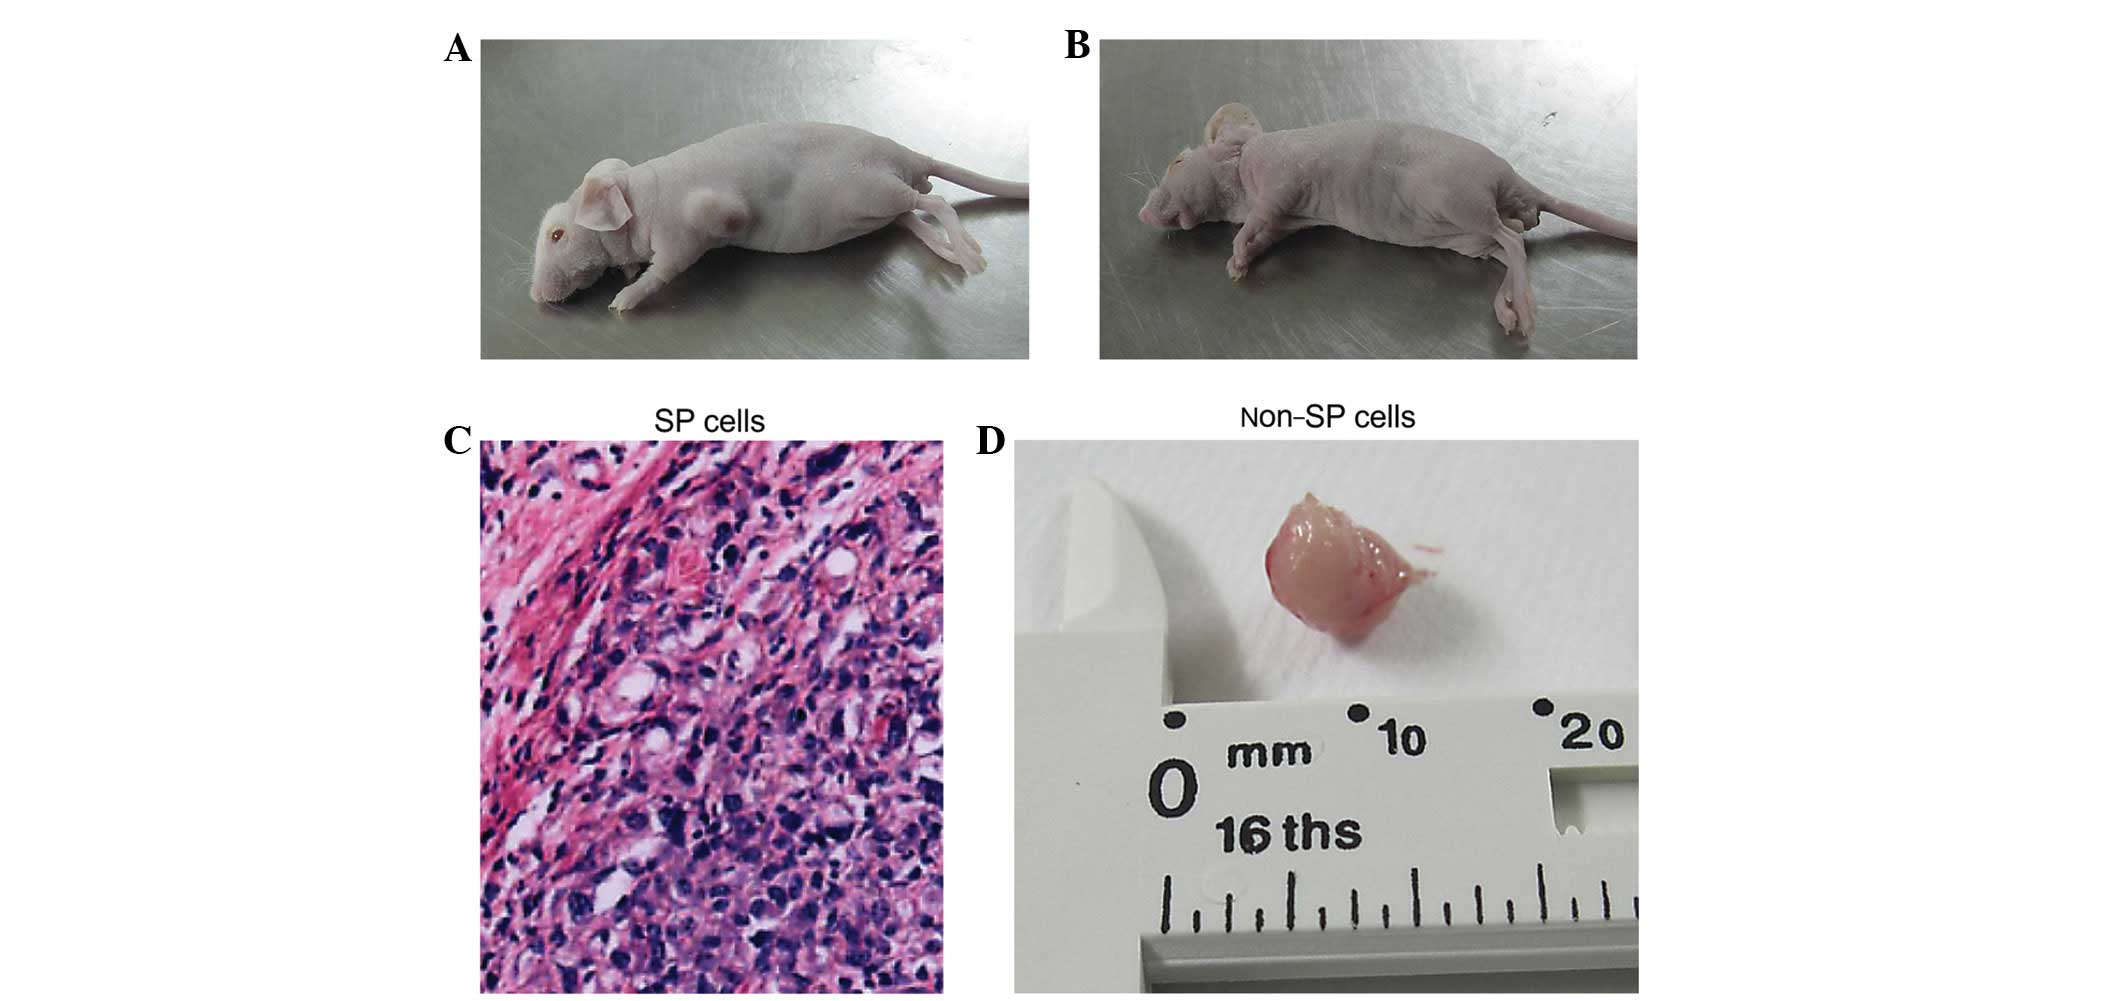
In vivo tumor formation
No tumors were observed in the mice treated with
non-SP cell suspensions or in SP-treated mice administered the
lowest treatment concentration (2×10² cells). However,
one tumor was observed among SP cell-treated mice administered
2×10³ cells, and two were observed in mice treated with
2×10⁴ cells (Fig.
8).
Discussion
We consistently observed differences between SP and
non-SP cells, in terms of proliferation and division, survival,
gene expression and the ability to form tumor masses. Cumulatively,
these results support previous findings (6,7,9,11)
that the majority of SP cells in tumors exhibit stem cell
characteristics. Notably, the proportion of SP cells found in the
current study was slightly higher (2.3±0.78%) than previously
reported by Haraguchi et al (0.6–2.2%) (6), who identified different proportions of
SP cells isolated from four stomach cancer cell strains. These
differences may be due to strain-specific variations, the
concentration of Hoechst 33343 dye used and/or the FCM
settings.
SP cells accounted for just over 2% of all cells in
the SGC-7901 cultures. Likewise, after one week of routine
culturing, SP cell cultures contained ∼2% SP cells. Proliferation
of these cells was observed to be notably more rapid than that of
the non-SP cells. Furthermore, SP cells were characterized by the
ability to self-renew and form a cell suspension tumor mass,
whereas non-SP cells died prior to the formation of tumor masses.
Each of these differences may be explained by the peculiar
asymmetric splitting abilities exhibited by cancer stem cells;
parent cells undergo asymmetric splitting into two daughter cells,
one of which retains the biological characteristics of the parent,
and the other of which undergoes directional differentiation, thus
maintaining its stability and facilitating tumor production.
Cancer therapy is often limited by the resistance of
tumors to chemotherapy drugs. SP cells were more resistant to the
chemotherapy drug 5-FU and exhibited a significantly higher
survival rate than non-SP cells (P<0.05). Similar findings were
demonstrated by Fukuda et al(11), whose study revealed that SP cells in
the gastric cancer cell strain MNK45 exhibited significantly higher
resistance to cisplatin chemotherapy drugs and adriamycin than
non-SP cells.
Resistance to 5-FU is likely to be facilitated by
two major processes, including the activity of adenosine
triphosphate binding cassette (ABC) transporters that pump harmful
materials out of cells and the suppression of apoptosis. Our
results suggest that both processes occur in SP cells. Relative to
non-SP cells, SP cells have a significantly higher expression of
ABCG2, the most important ABC, and the antiapoptotic protein Bcl-2.
Cumulatively, these findings suggest that the chemotherapy
resistance characteristics of SP cells are derived from their high
expression levels of anti-chemotherapy proteins.
We also observed significantly higher expression
levels of Musashi-1 and CD44 mRNA in SP cells compared with non-SP
cells. Both products are associated with stem cell behavior.
Musashi-1 is an evolutionarily conserved RNA-binding protein that
is important in stem cell maintenance, differentiation and the
state of tumorigenesis. Nagata et al(12) demonstrated that Musashi-1 is found
in the stem/progenitor cell area in the mouse stomach. Using a
double-marking immunohistochemical method, Akasaka et
al(13) confirmed the specific
expression of Musashi-1 in the distal proliferation area,
suggesting that this protein may be the distal stem/progenitor cell
surface marker. CD44, on the other hand, was previously speculated
to be involved in tumor metastasis involving adhesion molecules
between cells. Following its recent identification as a surface
marker for cancer stem cells, CD44 has been applied in screening
studies concerned with breast (4),
prostate (14), pancreatic
(15) and head and neck (16) cancer. In a screening study for
gastric cancer surface markers, Takaishi et al(17) demonstrated that CD44+
gastric cancer cells have stronger in vivo proliferation and
tumor formation ability compared with CD44− cells,
suggesting that the former have biological characteristics similar
to those of tumor stem cells. The high expression of both of these
types of mRNA in SP cells suggests that gastric cancer stem cell
subsets may exist in SP cells.
We used xenotransplantation techniques to confirm
the patterns suggested by our observational work, particularly that
SP cells are correlated with higher rates of tumor formation.
Subcutaneous injection of non-SP cells failed to produce any tumors
within 8 weeks, while both the 2×10³ and
2×10⁴ SP doses were associated with tumor formation (one
and two tumors, respectively).
Overall, our findings indicate that a small number
of SP cells exist in the gastric cancer strain SGC-7901. Relative
to non-SP cells, these cells have a stronger in vitro
proliferation ability, a stronger renewal ability, non-symmetrical
division, greater resistance to chemotherapy, higher expression of
stem cell genes, and the capacity for in vivo and in
vitro tumor formation. These results further demonstrate that
SP cells isolated from the gastric cancer cell strain SGC-7901
exhibit biological characteristics similar to those of cancer stem
cells. Thus, we conclude that SP cells are rich in gastric cancer
stem cell subsets, and that the SP cell sorting method is an
effective means for isolating and identifying gastric cancer stem
cells in early screening. It is difficult to identify gastric
cancer stem cells, as they are few in number and their specific
surface markers remain unknown. Therefore, further DNA microarray
analyses using SP cells are required to identify potential
candidates for gastric cancer stem cells markers, which may
contribute to a more accurate targeted therapy for gastric
cancer.
References
|
1
|
Goodell MA, Brose K, Paradis G, Conner AS
and Mulligan RC: Isolation and functional properties of murine
hematopoietic stem cells that are replicating in vivo. J Exp
Med. 183:1797–1806. 1996. View Article : Google Scholar : PubMed/NCBI
|
|
2
|
Singh SK, Hawkins C, Clarke ID, et al:
Identification of human brain tumour initiating cells. Nature.
432:396–401. 2004. View Article : Google Scholar : PubMed/NCBI
|
|
3
|
Piccirillo SG, Binda E, Fiocoo R, Vescovi
AL and Shah K: Brain cancer stem cells. J Mol Med (Berl).
87:1087–1095. 2009. View Article : Google Scholar : PubMed/NCBI
|
|
4
|
Al-Hajj M, Wicha MS, Benito-Hernandez A,
Morrison SJ and Clarke MF: Prospective identification of
tumorigenic breast cancer cells. Proc Natl Acad Sci USA.
100:3983–3988. 2003. View Article : Google Scholar : PubMed/NCBI
|
|
5
|
O’Brien CA, Pollett A, Gallinger S and
Dick JE: A human colon cancer cell capable of initiating tumour
growth in immunodeficient mice. Nature. 445:106–110.
2007.PubMed/NCBI
|
|
6
|
Haraguchi N, Utsunomiya T, Inoue H, Tanaka
F, Mimori K, Barnard GF and Mori M: Characterization of a side
population of cancer cells from human gastrointestinal system. Stem
Cells. 24:506–513. 2006. View Article : Google Scholar : PubMed/NCBI
|
|
7
|
Ho MM, Ng AV, Lam S and Hung JY: Side
population in human lung cancer cell lines and tumor is enriched
with stem-like cancer cells. Cancer Res. 67:4827–4833. 2007.
View Article : Google Scholar : PubMed/NCBI
|
|
8
|
Yang ZF, Ho DW, Ng MN, et al: Significance
of CD90+ cancer stem cells in human liver cancer. Cancer
Cell. 13:153–166. 2008.
|
|
9
|
Chiba T, Kita K, Zheng YW, et al: Side
population purified from hepatocellular carcinoma cells harbors
cancer stem cell-like properties. Hepatology. 44:240–251. 2006.
View Article : Google Scholar : PubMed/NCBI
|
|
10
|
Haraguchi N, Inoue H, Tanaka F, Mimori K,
Utsunomiya T, Sasaki A and Mori M: Cancer stem cells in human
gastrointestinal cancers. Hum Cell. 19:24–29. 2006. View Article : Google Scholar
|
|
11
|
Fukuda K, Saikawa Y, Ohashi M, et al:
Tumor initiating potential of side population cells in human
gastric cancer. Int J Oncol. 34:1201–1207. 2009.PubMed/NCBI
|
|
12
|
Nagata H, Akiba Y, Suzuki H, Okano H and
Hibi T: Expression of Musashi-1 in the rat stomach and changes
during mucosal injury and restitution. FEBS Lett. 580:27–33. 2006.
View Article : Google Scholar : PubMed/NCBI
|
|
13
|
Akasaka Y, Saikawa Y, Fujita K, et al:
Expression of a candidate marker for progenitor cells, Musashi-1,
in the proliferative regions of human antrum and its decreased
expression in intestinal meta-plasia. Histopathology. 47:348–356.
2005. View Article : Google Scholar : PubMed/NCBI
|
|
14
|
Collins AT, Berry PA, Hyde C, Stower MJ
and Maitland NJ: Prospective identification of tumorigenic prostate
cancer stem cells. Cancer Res. 65:10946–10951. 2005. View Article : Google Scholar : PubMed/NCBI
|
|
15
|
Li C, Heidt DG, Dalerba P, et al:
Identification of pancreatic cancer stem cells. Cancer Res.
67:1030–1037. 2007. View Article : Google Scholar : PubMed/NCBI
|
|
16
|
Prince ME, Sivanadan R, Kaczorowski A, et
al: Identification of subpopulation of cells with cancer stem cell
properties in head and neck squamous cell carcinoma. Proc Natl Acad
Sci USA. 104:973–978. 2007. View Article : Google Scholar : PubMed/NCBI
|
|
17
|
Takaishi S, Okumura T, Tu S, et al:
Identification of gastric cancer stem cells using the cell surface
marker CD44. Stem Cells. 27:1006–1020. 2009. View Article : Google Scholar : PubMed/NCBI
|